kertas kerja 4: dashboarding myspata - jkrjpak.jkr.gov.my/document/files/dokumen/seminar/seminar...
TRANSCRIPT

KERTAS KERJA 4: DASHBOARDING MYSPATA
“DRIVING ASSET INTELLIGENCE USING PENTAHO
BUSINESS ANALYTICS”

Agenda
2 © 2012, Pentaho. All Rights Reserved. pentaho.com. Worldwide +1 (866) 660-7555
Asset Intelligence
References
Pentaho Salient features
Driving Asset Intelligence
Q&A
Asset Intelligence
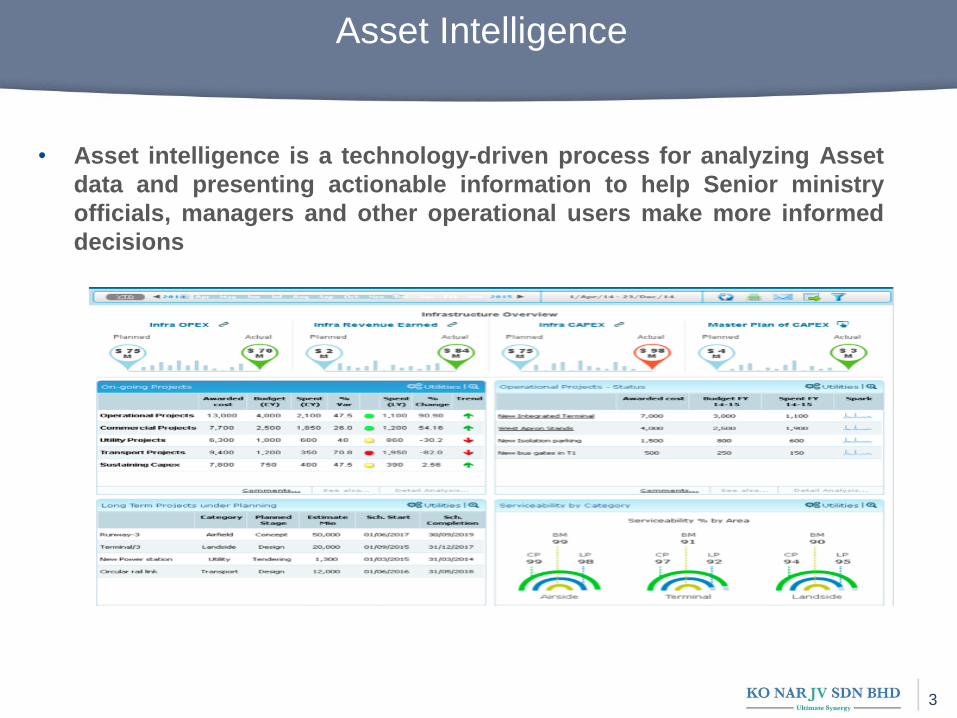
• Asset intelligence is a technology-driven process for analyzing Asset
data and presenting actionable information to help Senior ministry
officials, managers and other operational users make more informed
decisions
3
Achieving Asset Intelligence
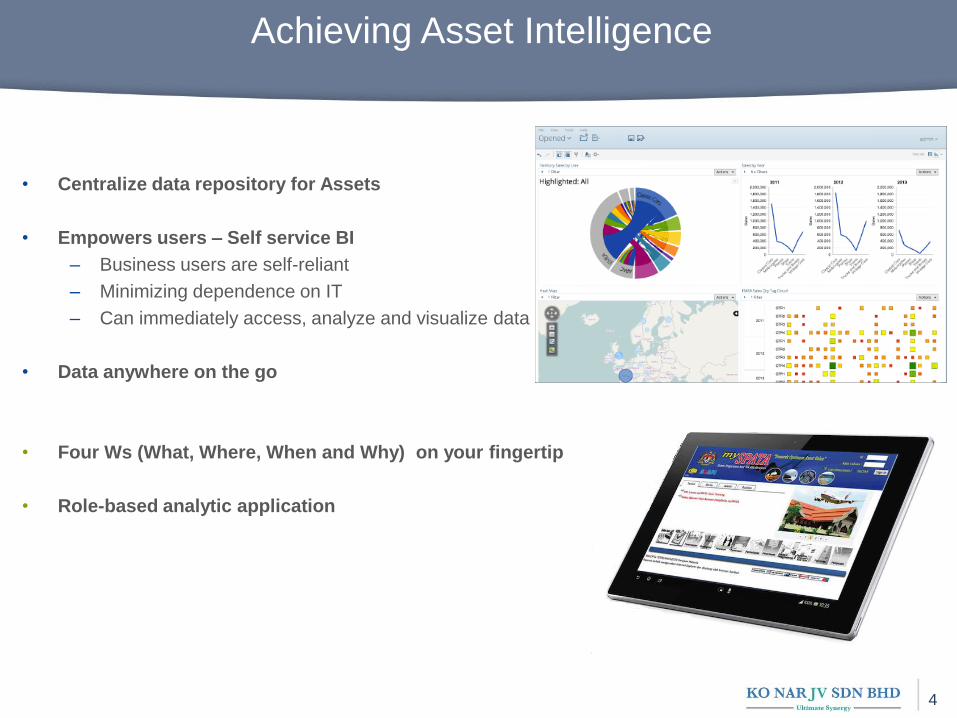
• Centralize data repository for Assets
• Empowers users – Self service BI
– Business users are self-reliant
– Minimizing dependence on IT
– Can immediately access, analyze and visualize data
• Data anywhere on the go
• Four Ws (What, Where, When and Why) on your fingertip
• Role-based analytic application
4
5
Partial Client list

6
About Pentaho
Recognized leader in business analytics & data integration
Subscription-based business model
Achieved critical mass:
• Over 1,200 commercial customers
• Over 10,000 production deployments
• Over 185 countries
Stewardship of most important open source analytics projects
6
INDUSTRY RECOGNITION OVER 160 PARTNERS GLOBALLY
© 2012, Pentaho. All Rights Reserved. pentaho.com. Worldwide +1 (866) 660-7555

Driving Asset Intelligence
Self-service Interactive KPI & Metrics and
Visualization Ministries
Dashboards
Ad hoc and Operational
Reports Agencies
Reporting
States and districts
Self-service Interactive and Ad Hoc Analysis Analysis
High Performance Data Integration, BIG DATA, Cleansing
and Presentation IT
Department Data
Advanced Predictive Analysis Data Mining
5 © 2012, GrayMatter. All Rights Reserved. Graymatter.co.in. Worldwide +91 (80) 4284 6666
Power users
What is a Dashboard
• A business intelligence dashboard is a data visualization tool that displays the current status of key performance indicators (KPIs)
• Dashboards consolidate and arrange numbers, metrics and performance scorecards on a single screen.
• They may be tailored for a specific role and display metrics targeted for a single point of view or department.
• The essential features of a BI dashboard product include a customizable interface and the ability to pull real-time data from multiple sources.
8

Dashboards – Ease of Use
• Dashboards
– Web-based
– Simple, drag & drop, easy-to-use
– Customized based on specific business goals
– Design rich interactivity with data
• Dashboard Framework
– Create highly customized dashboards
& interactive web applications
– Collection of visualization and filter control widgets
9
Dashboard Designer
Dashboard Framework

Dashboards Samples
8
Number of Assets by Ministries
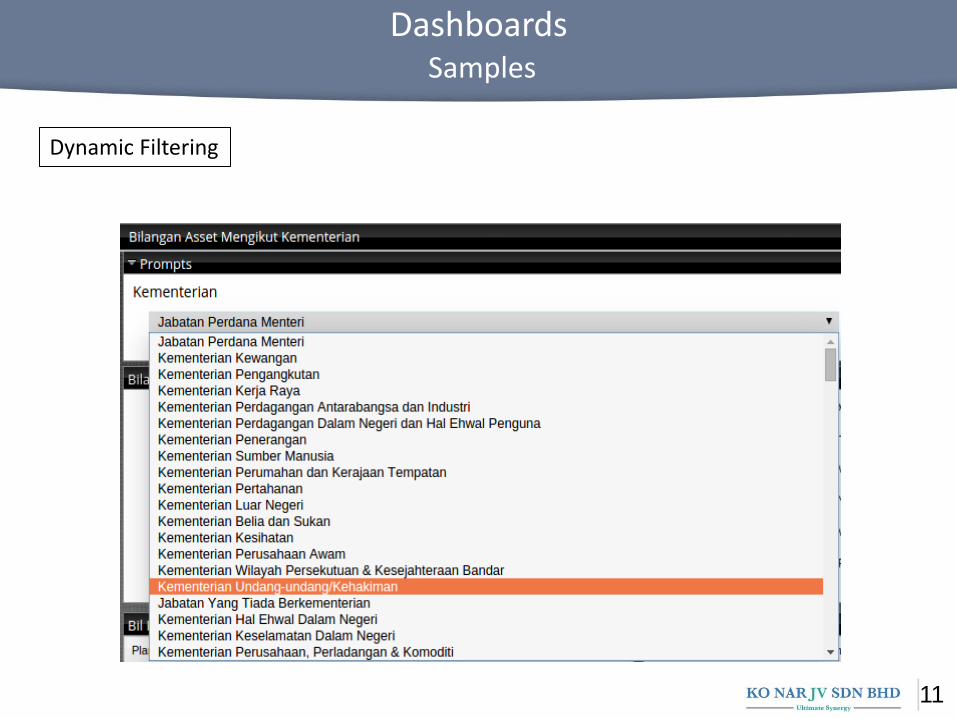
11
Dynamic Filtering
Dashboards Samples

Dashboards Samples
8
Statistic: Number of Assets by Category, Department & States
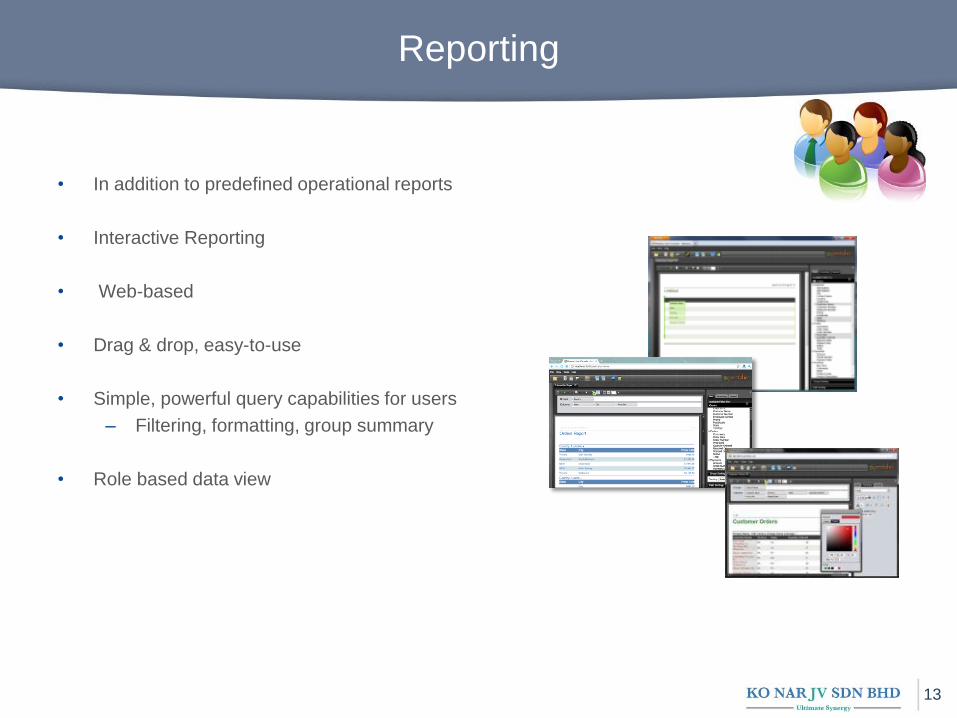
Reporting
• In addition to predefined operational reports
• Interactive Reporting
• Web-based
• Drag & drop, easy-to-use
• Simple, powerful query capabilities for users
– Filtering, formatting, group summary
• Role based data view
13

9 © 2012, GrayMatter. All Rights Reserved. Graymatter.co.in. Worldwide +91 (80) 4284 6666
Reporting Samples
Converting forms/reports in TPATA into interactive reporting

9 © 2012, GrayMatter. All Rights Reserved. Graymatter.co.in. Worldwide +91 (80) 4284 6666
Reporting Samples
Statistic: Budget Application for Year 2015

• Simple, easy-to-use
• Visual data exploration
• Rich library of interactive visualizations
• Pluggable visualizations
16
Analysis
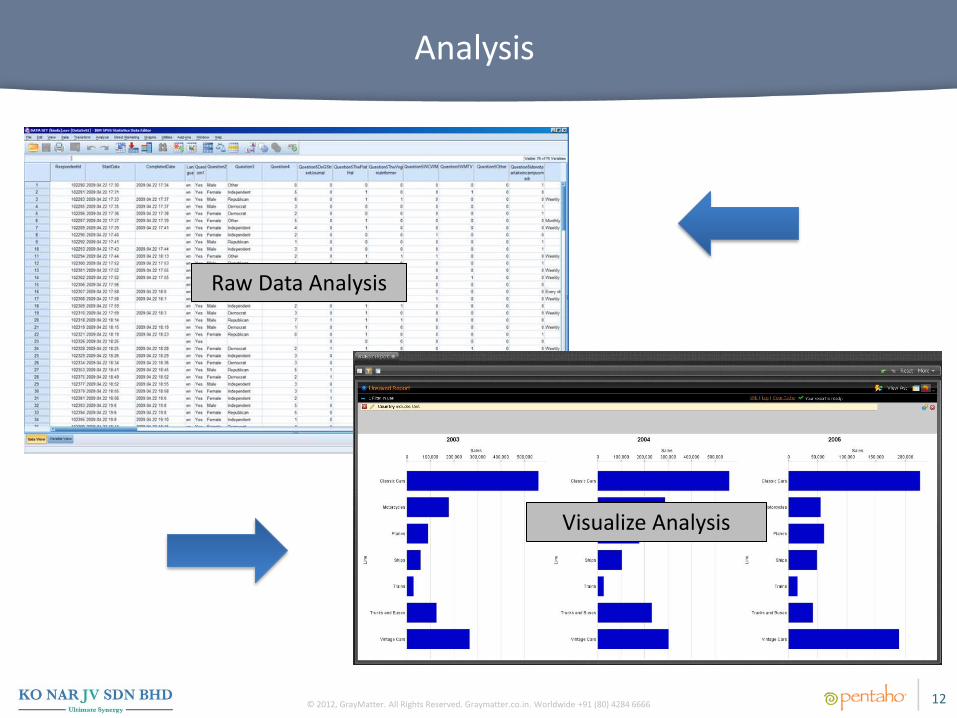
Analysis
12 © 2012, GrayMatter. All Rights Reserved. Graymatter.co.in. Worldwide +91 (80) 4284 6666
Raw Data Analysis
Visualize Analysis
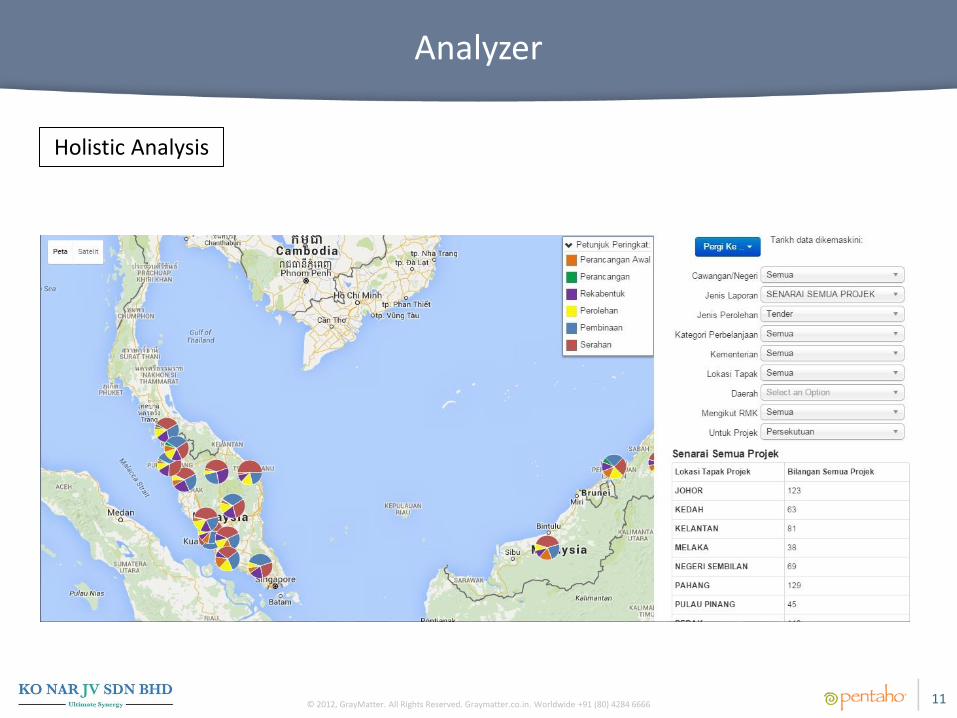
Analyzer
11 © 2012, GrayMatter. All Rights Reserved. Graymatter.co.in. Worldwide +91 (80) 4284 6666
Holistic Analysis
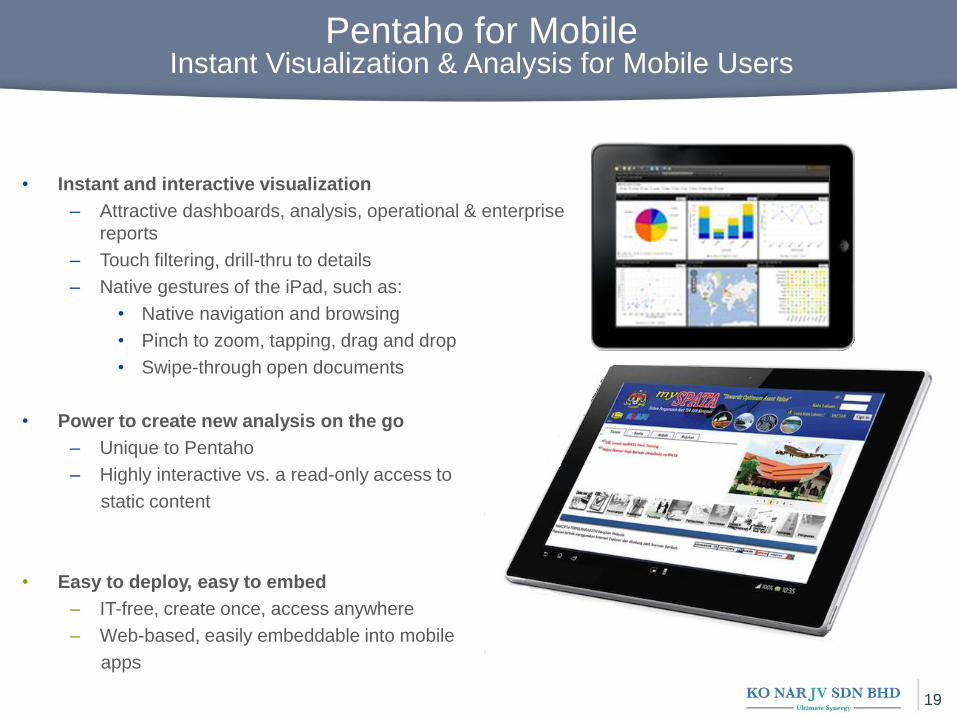
Pentaho for Mobile Instant Visualization & Analysis for Mobile Users
• Instant and interactive visualization
– Attractive dashboards, analysis, operational & enterprise
reports
– Touch filtering, drill-thru to details
– Native gestures of the iPad, such as:
• Native navigation and browsing
• Pinch to zoom, tapping, drag and drop
• Swipe-through open documents
• Power to create new analysis on the go
– Unique to Pentaho
– Highly interactive vs. a read-only access to
static content
• Easy to deploy, easy to embed
– IT-free, create once, access anywhere
– Web-based, easily embeddable into mobile
apps
19

THANK YOU