kenya’s competitiveness in business
DESCRIPTION
KENYA’S COMPETITIVENESS IN BUSINESS. BY JULIUS KIPNGETICH MANAGING DIRECTOR INVESTMENT PROMOTION CENTRE. AFRICA AT A GLANCE. The continent’s size is to equivalent to USA China India Argentina Western Europe New Zealand Has a population of 740 million - PowerPoint PPT PresentationTRANSCRIPT
KENYA’S COMPETITIVENESS IN BUSINESS
BYJULIUS KIPNGETICHMANAGING DIRECTORINVESTMENT PROMOTION CENTRE
AFRICA AT A GLANCE• The continent’s size is to equivalent to
USA China India Argentina Western Europe New Zealand
• Has a population of 740 million• Is endowed with vast natural resources• Has a huge debt • Has a small GDP size• 2/3 of the population is young and dynamic• Its violent and turbulent past is coming to an end
Kenya at a glance Has a GDP of $11 billion Population is 31.5 million Per capita of $350 16% of the GDP is savings 75% of employment is in agriculture, 24% of GDP Tourism earns Kshs. 24 billion, 12% of GDP Manufacturing accounts for 14%, largest base in COMESA ICT is the fastest growing sector in the economy Financial & diplomatic capital of the region Aviation hub of the region courtesy of Kenya Airways Busiest port of the region at Kilindini Best educated workforce in Sub-sahara Highest concentration of Olympians in the world
Kenya’s investment priority areas Agriculture and agro-processing Tourism Manufacturing Professional services
ICT Financial & Banking Medical Trade
Knowledge-based industries Privatisation of state enterprises
Mainly infrastructure parastatals
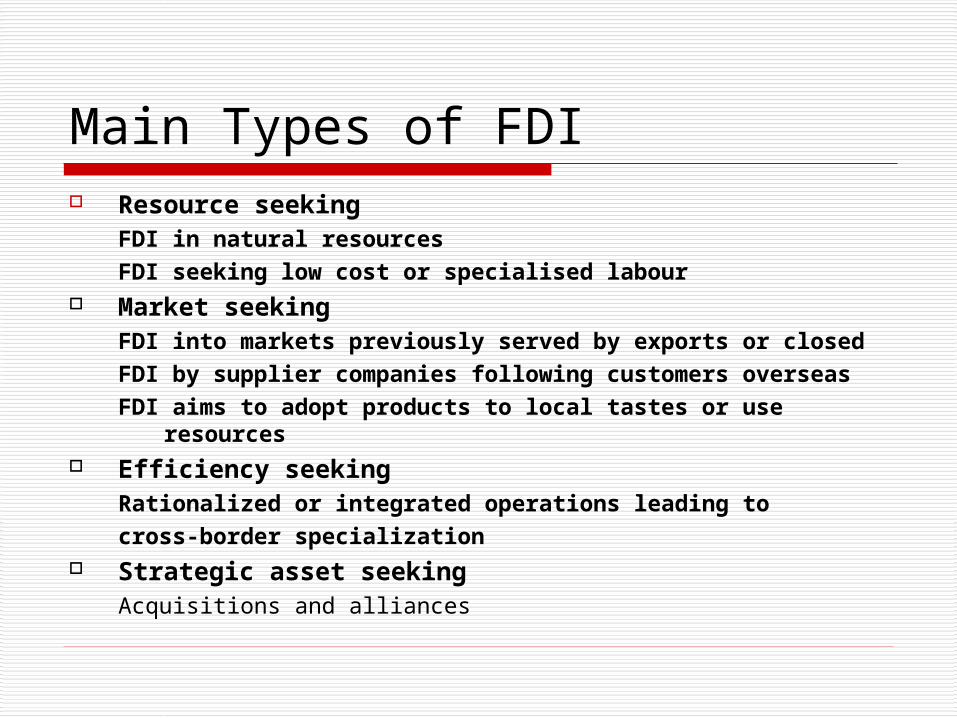
Main Types of FDI Resource seeking
FDI in natural resourcesFDI seeking low cost or specialised labour
Market seekingFDI into markets previously served by exports or closedFDI by supplier companies following customers overseasFDI aims to adopt products to local tastes or use resources
Efficiency seekingRationalized or integrated operations leading to cross-border specialization
Strategic asset seekingAcquisitions and alliances
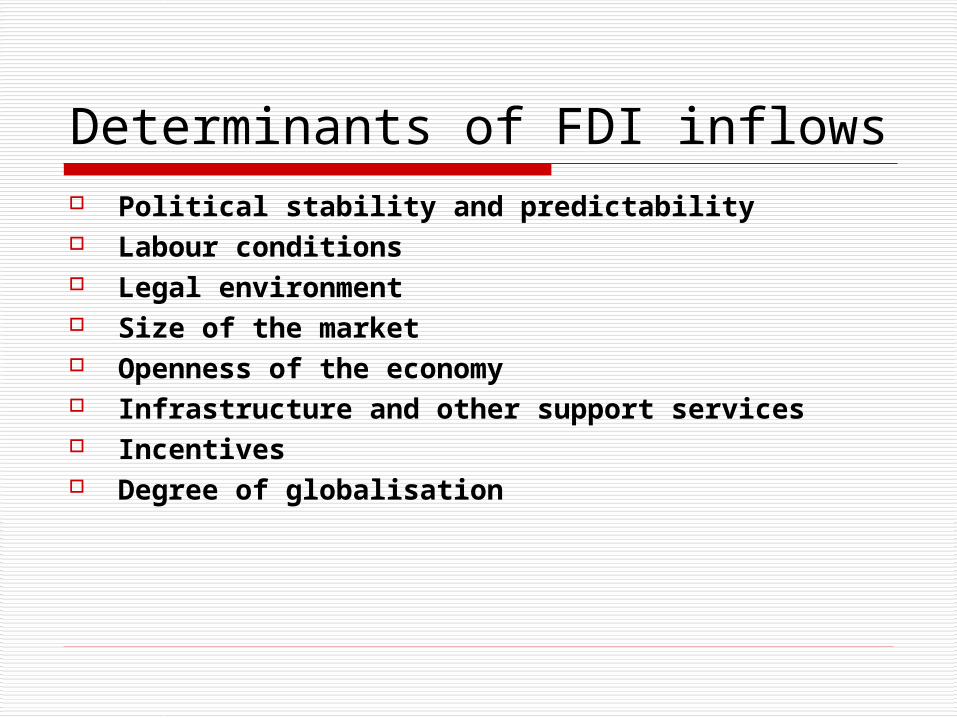
Determinants of FDI inflows Political stability and predictability Labour conditions Legal environment Size of the market Openness of the economy Infrastructure and other support services Incentives Degree of globalisation
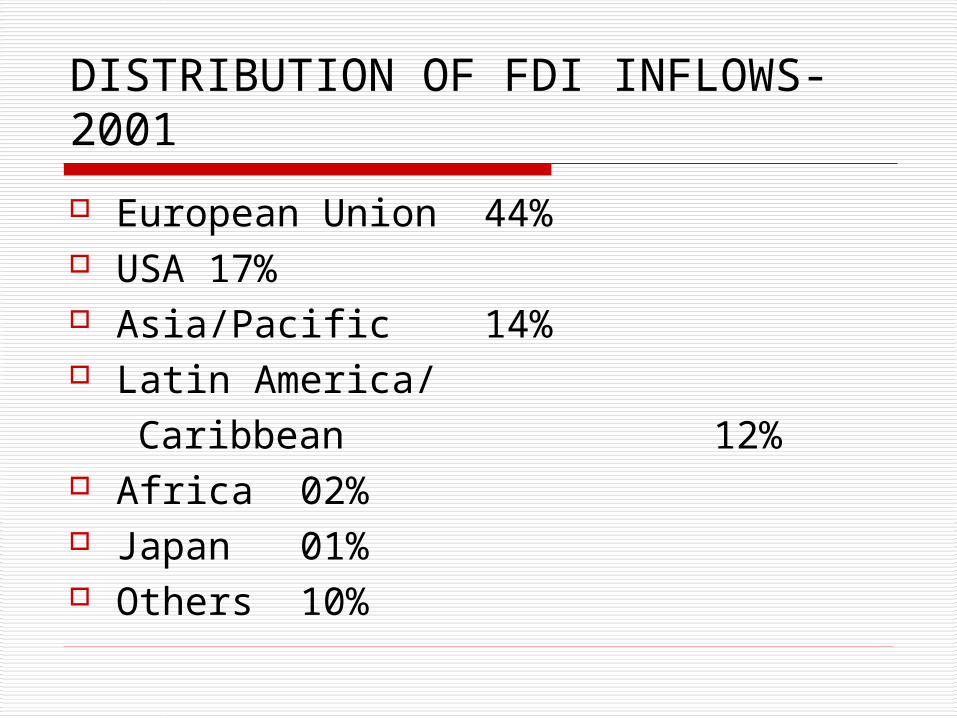
DISTRIBUTION OF FDI INFLOWS- 2001 European Union 44% USA 17% Asia/Pacific 14% Latin America/ Caribbean 12% Africa 02% Japan 01% Others 10%
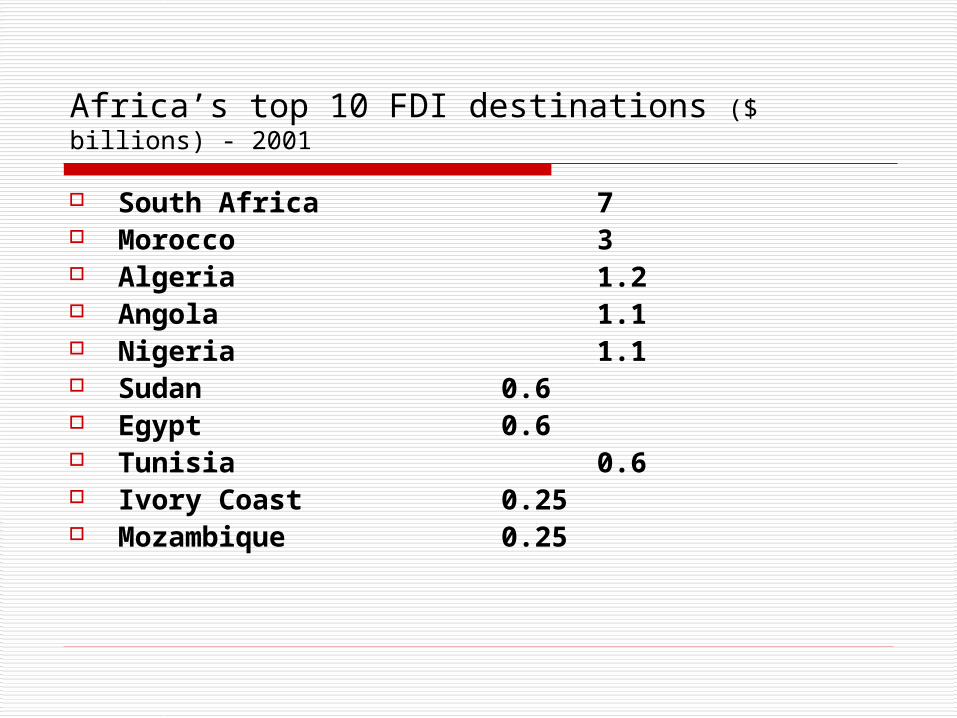
Africa’s top 10 FDI destinations ($ billions) - 2001
South Africa 7 Morocco 3 Algeria 1.2 Angola 1.1 Nigeria 1.1 Sudan 0.6 Egypt 0.6 Tunisia 0.6 Ivory Coast 0.25 Mozambique 0.25
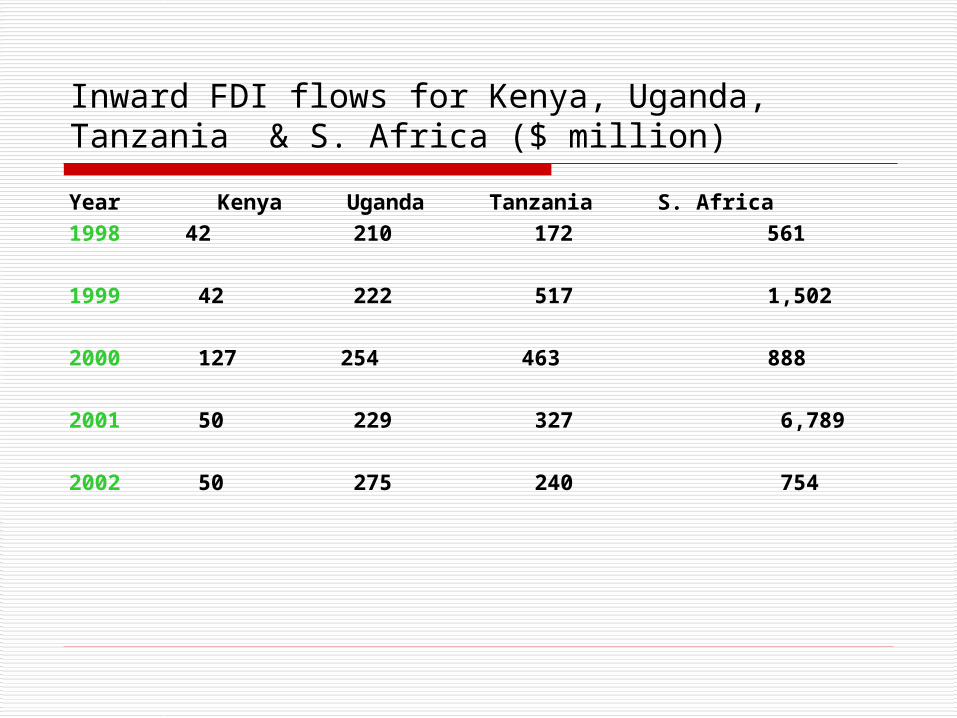
Inward FDI flows for Kenya, Uganda, Tanzania & S. Africa ($ million)Year Kenya Uganda Tanzania S. Africa1998 42 210 172 561
1999 42 222 517 1,502
2000 127 254 463 888
2001 50 229 327 6,789
2002 50 275 240 754
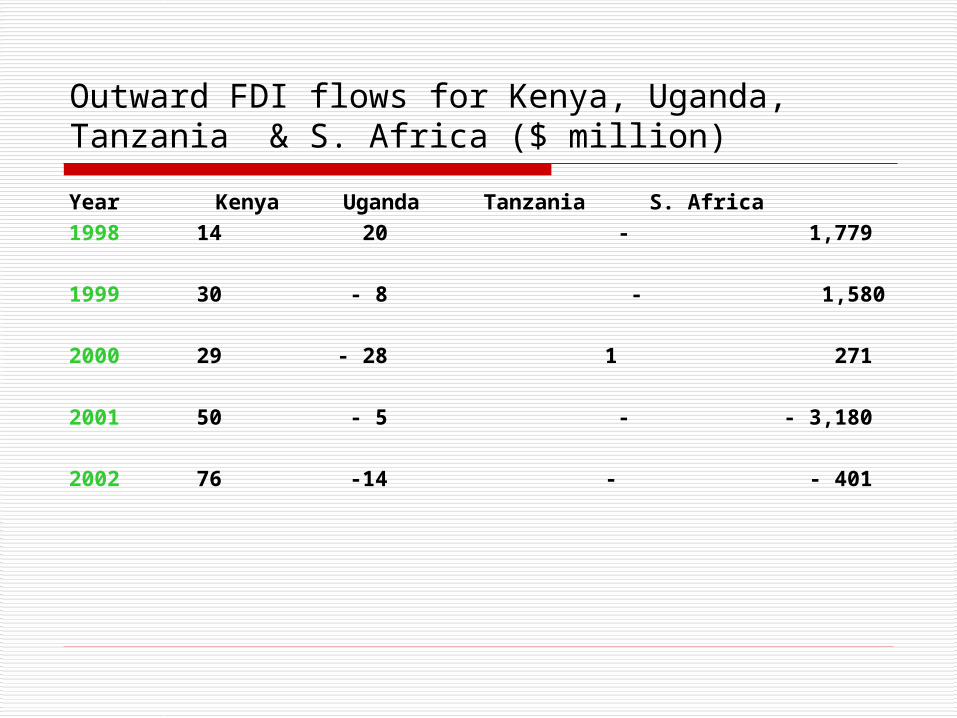
Outward FDI flows for Kenya, Uganda, Tanzania & S. Africa ($ million)Year Kenya Uganda Tanzania S. Africa1998 14 20 - 1,779
1999 30 - 8 - 1,580
2000 29 - 28 1 271
2001 50 - 5 - - 3,180
2002 76 -14 - - 401
KENYA’S COMPETITIVENESS AS A PREFERRED FDI DESTINATION
( 1 ) denotes negative perception and( 4 ) denotes no impact on deciding investment destination
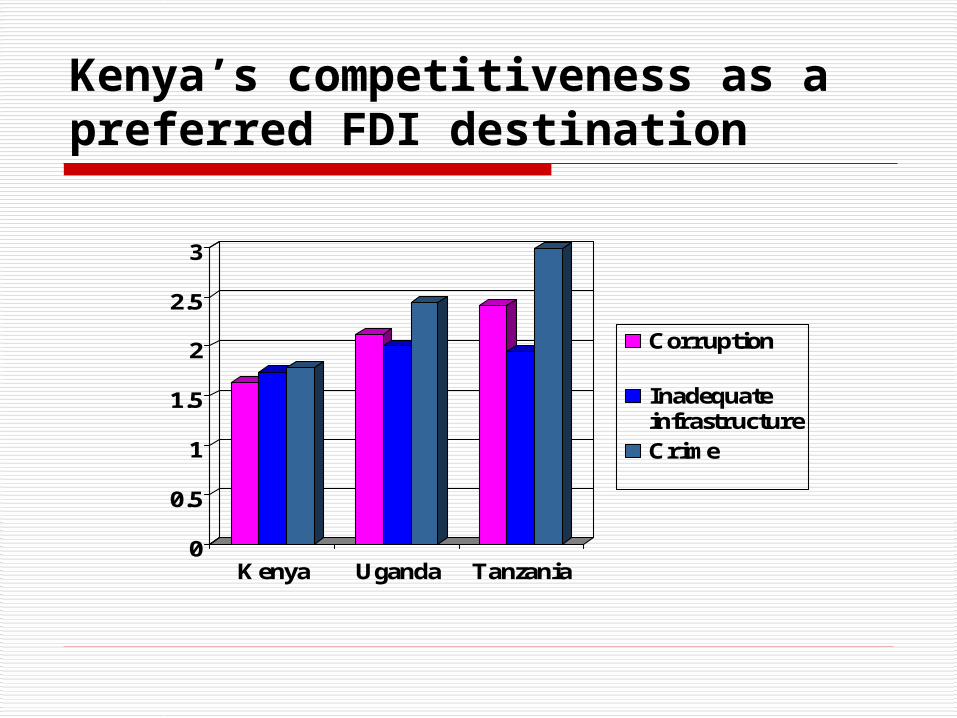
Kenya’s competitiveness as a preferred FDI destination
0
0.5
1
1.5
2
2.5
3
Kenya Uganda Tanzania
Corruption
InadequateinfrastructureCrime
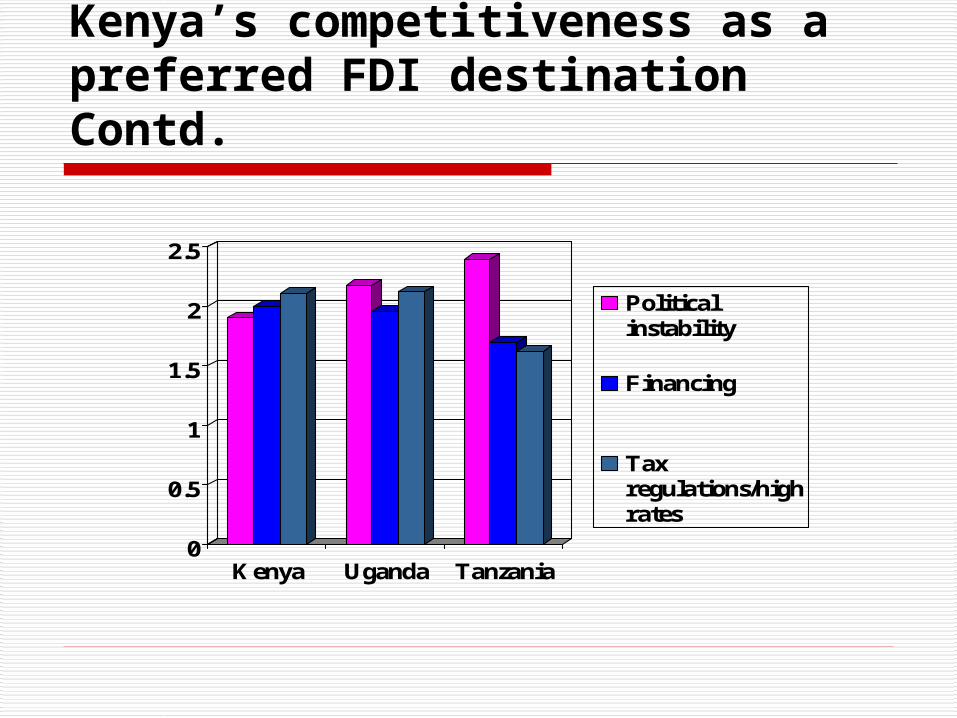
Kenya’s competitiveness as a preferred FDI destination Contd.
0
0.5
1
1.5
2
2.5
Kenya Uganda Tanzania
Politicalinstability
Financing
Taxregulations/highrates
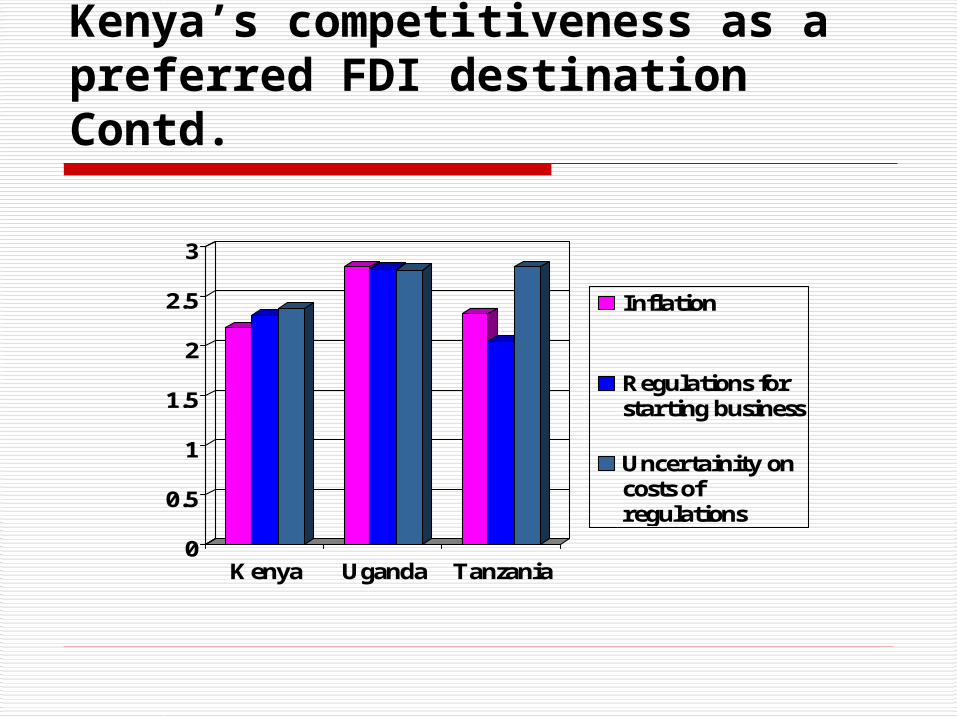
Kenya’s competitiveness as a preferred FDI destination Contd.
0
0.5
1
1.5
2
2.5
3
Kenya Uganda Tanzania
Inflation
Regulations forstarting business
Uncertainity oncosts ofregulations
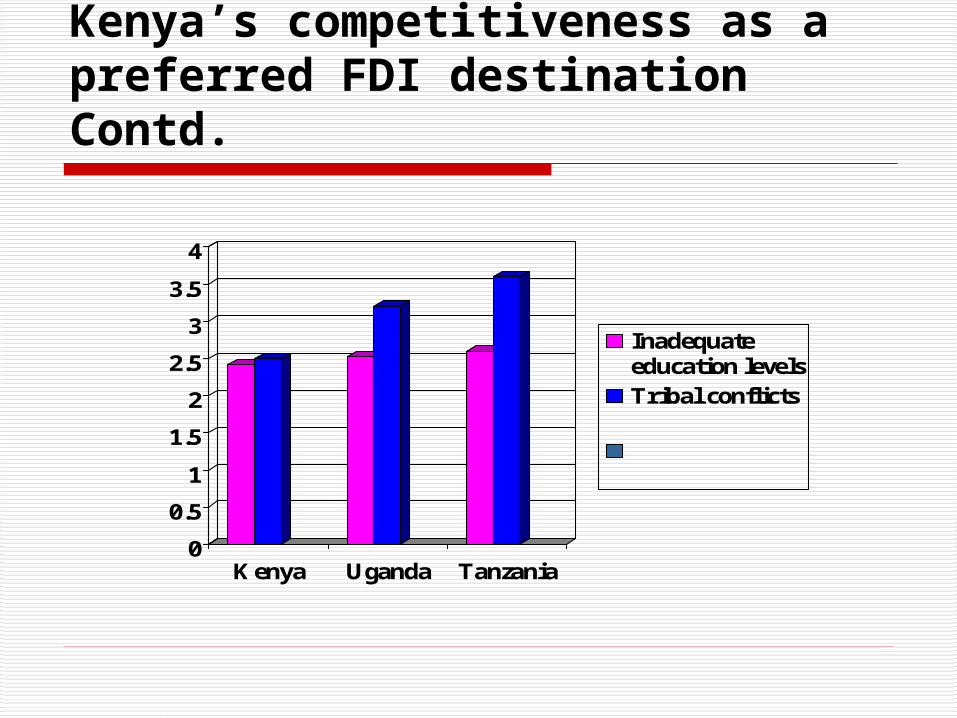
Kenya’s competitiveness as a preferred FDI destination Contd.
0
0.5
1
1.5
2
2.5
3
3.5
4
Kenya Uganda Tanzania
Inadequateeducation levelsTribal conflicts
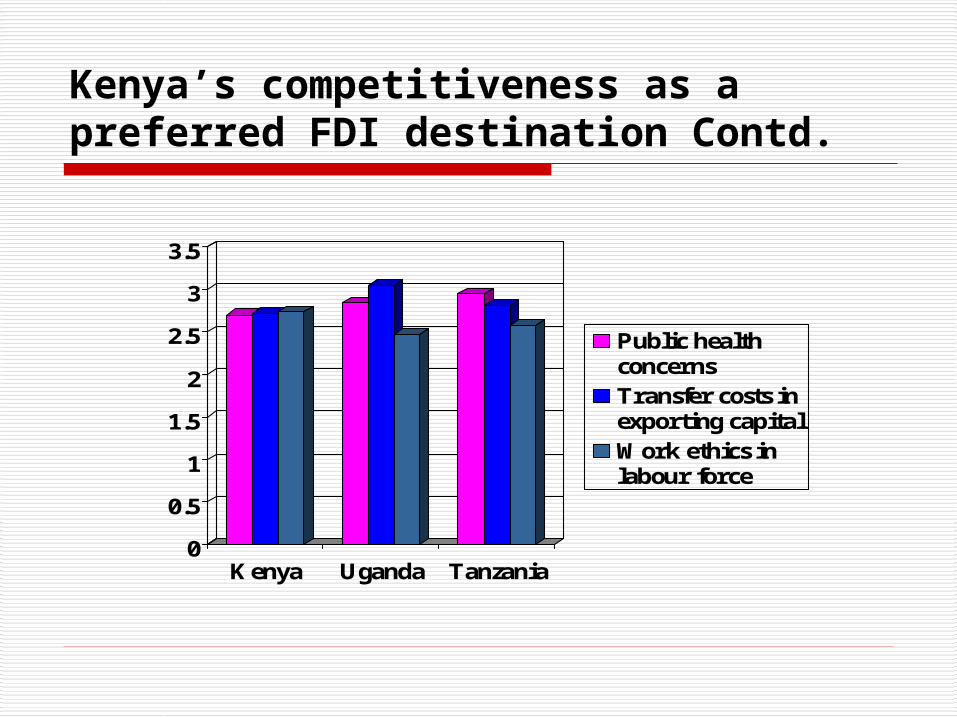
Kenya’s competitiveness as a preferred FDI destination Contd.
0
0.5
1
1.5
2
2.5
3
3.5
Kenya Uganda Tanzania
Public healthconcernsTransfer costs inexporting capitalWork ethics inlabour force
Kenya’s competitiveness as a preferred FDI destination Contd.
0
0.5
1
1.5
2
2.5
3
3.5
Kenya Uganda Tanzania
Labourregulations
ForeigncurrencyregulationsRegulations onforeign trade

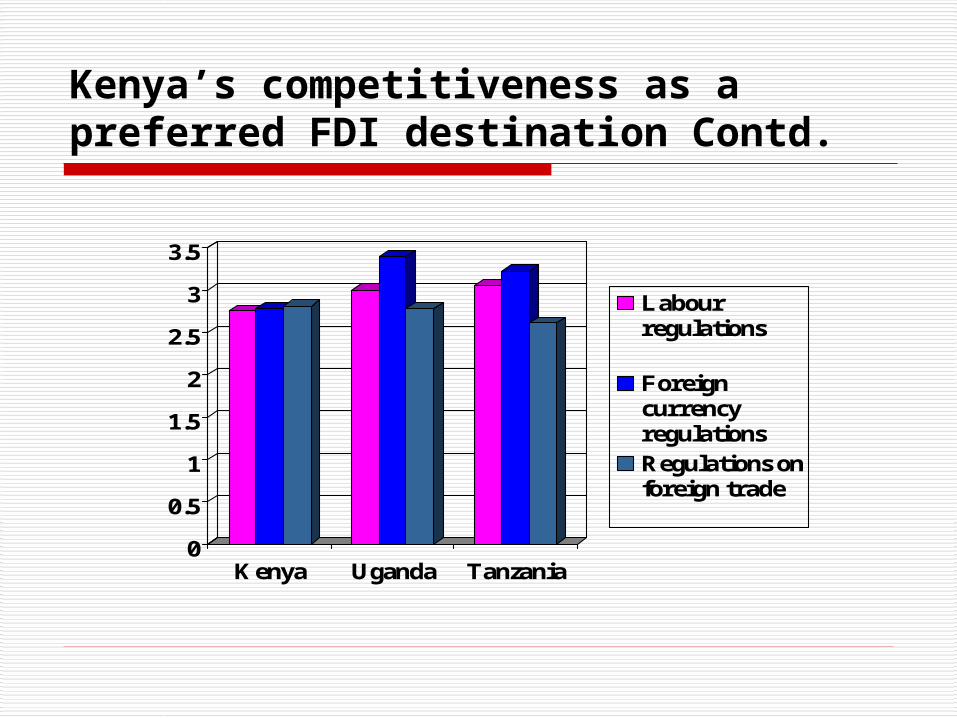
Kenya’s competitiveness as a preferred FDI destination Contd.
2.32.42.52.62.72.82.9
33.13.2
Kenya Uganda Tanzania
Safety orenvironmentalregulationsPrice controls
Geographicallocation of thefirm
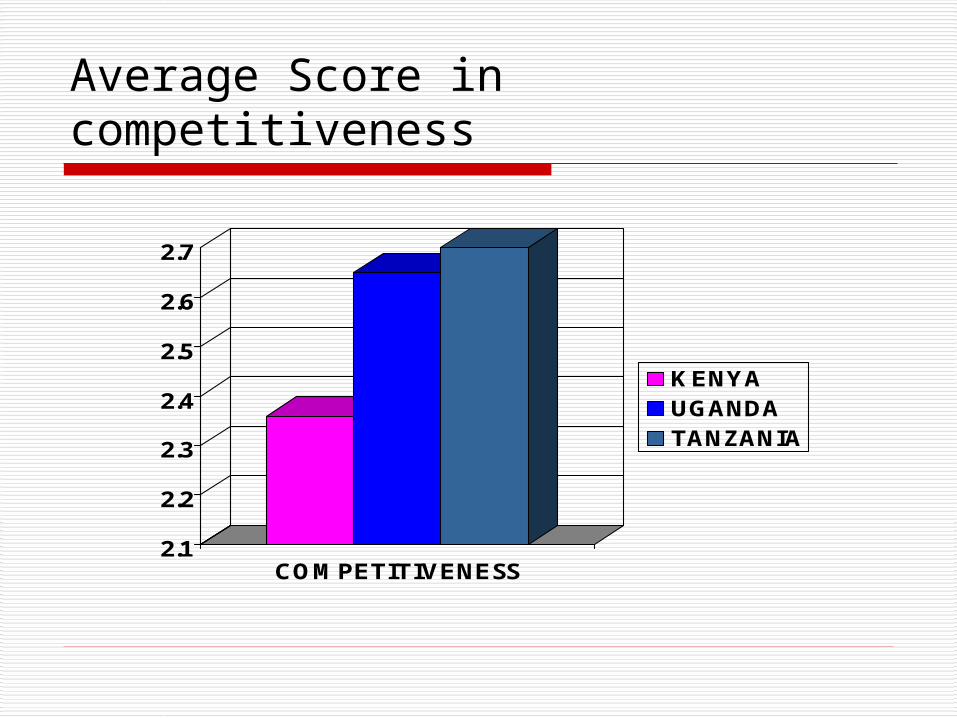
Average Score in competitiveness
2.1
2.2
2.3
2.4
2.5
2.6
2.7
COMPETITIVENESS
KENYAUGANDATANZANIA
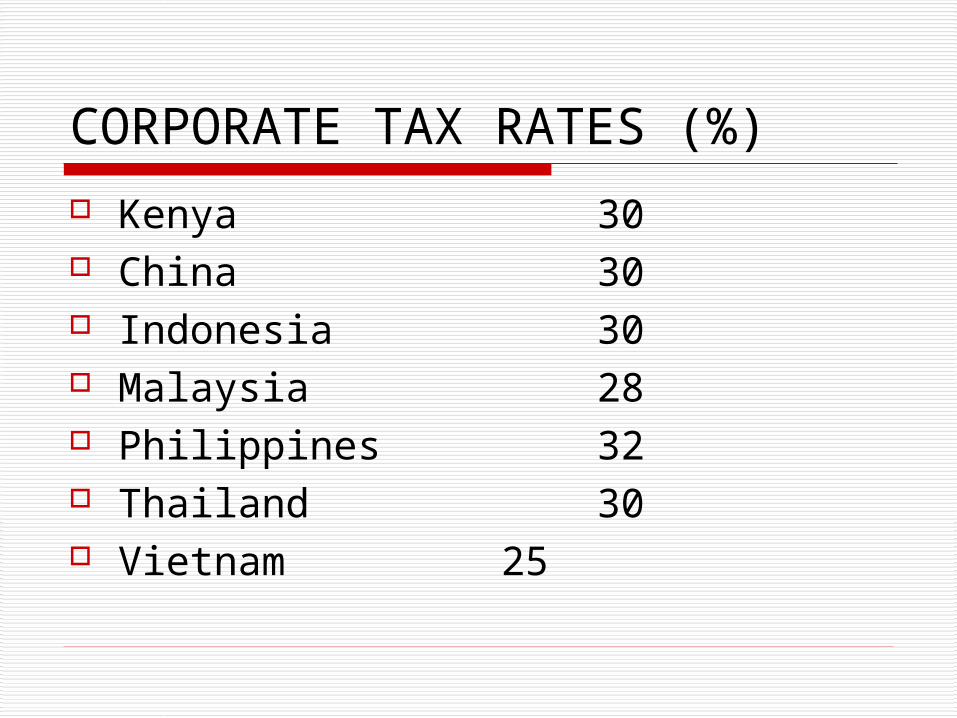
CORPORATE TAX RATES (%) Kenya 30 China 30 Indonesia 30 Malaysia 28 Philippines 32 Thailand 30 Vietnam 25

TELECOMMUNICATIONSKENYA SELECTED COUNTRIES
US$/minute to US
Private landphone (Local calls 0-60 km)US$ 0.02 per minute
Trunk calls US$ 0.08 – 0.25 per minute International calls - USUS$ 1.25 per minute
Indonesia 1.00 Malaysia 0.24 Philippines
0.30 Thailand 0.56 China 0.25 Vietnam 1.30
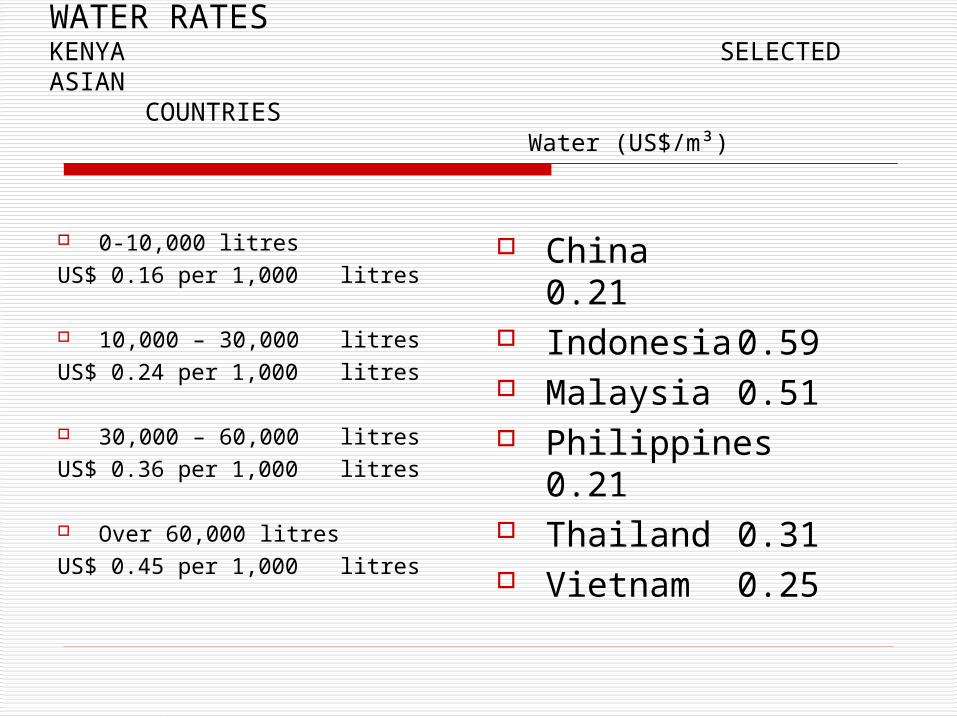
WATER RATESKENYA SELECTED ASIAN
COUNTRIESWater (US$/m³)
0-10,000 litres US$ 0.16 per 1,000 litres
10,000 – 30,000 litresUS$ 0.24 per 1,000 litres
30,000 – 60,000 litresUS$ 0.36 per 1,000 litres
Over 60,000 litresUS$ 0.45 per 1,000 litres
China 0.21
Indonesia 0.59 Malaysia 0.51 Philippines
0.21 Thailand 0.31 Vietnam 0.25
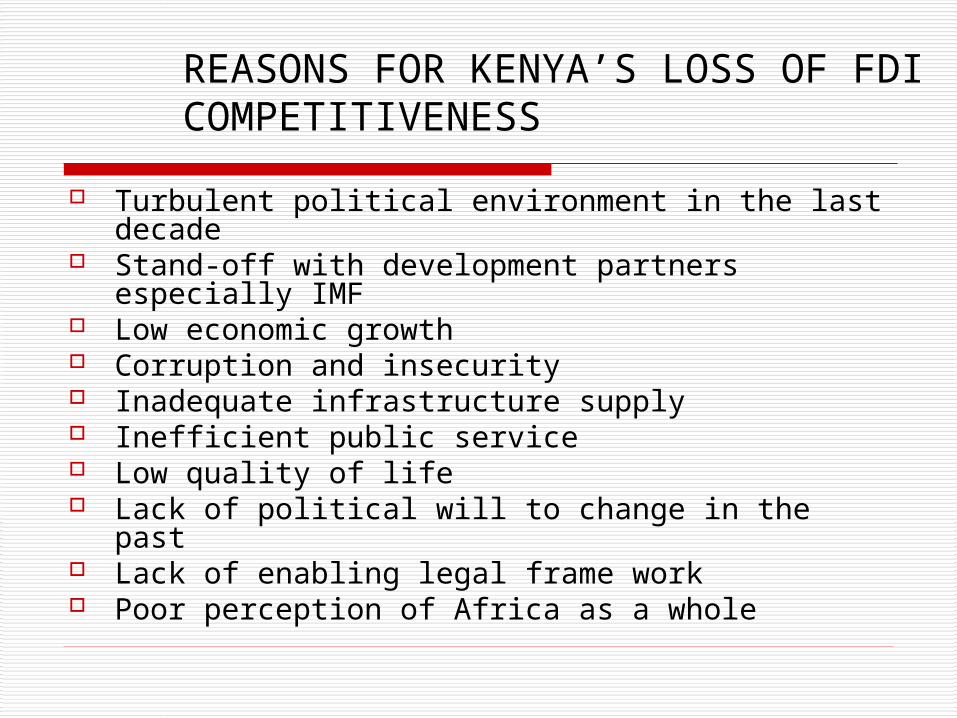
REASONS FOR KENYA’S LOSS OF FDI COMPETITIVENESS
Turbulent political environment in the last decade
Stand-off with development partners especially IMF
Low economic growth Corruption and insecurity Inadequate infrastructure supply Inefficient public service Low quality of life Lack of political will to change in the past Lack of enabling legal frame work Poor perception of Africa as a whole
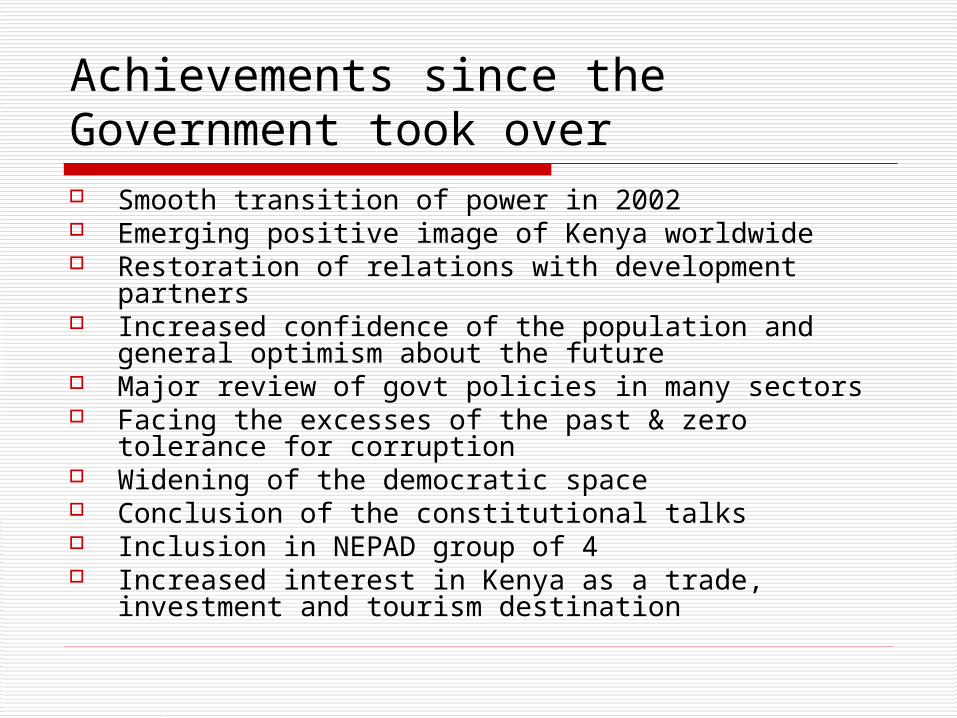
Achievements since the Government took over Smooth transition of power in 2002 Emerging positive image of Kenya worldwide Restoration of relations with development partners Increased confidence of the population and general
optimism about the future Major review of govt policies in many sectors Facing the excesses of the past & zero tolerance for
corruption Widening of the democratic space Conclusion of the constitutional talks Inclusion in NEPAD group of 4 Increased interest in Kenya as a trade, investment
and tourism destination
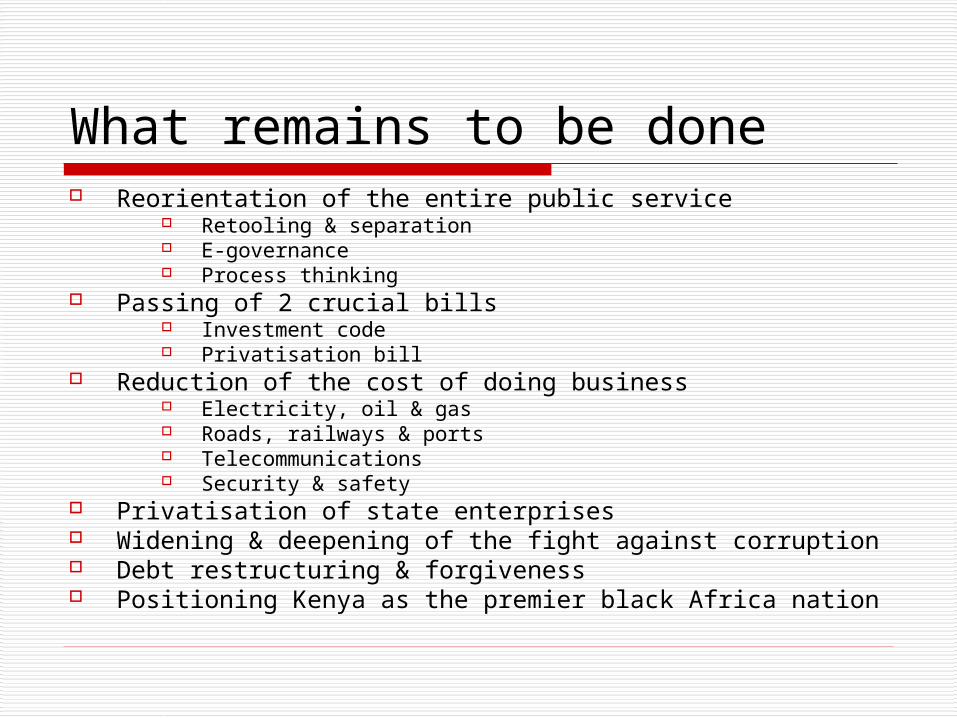
What remains to be done Reorientation of the entire public service
Retooling & separation E-governance Process thinking
Passing of 2 crucial bills Investment code Privatisation bill
Reduction of the cost of doing business Electricity, oil & gas Roads, railways & ports Telecommunications Security & safety
Privatisation of state enterprises Widening & deepening of the fight against corruption Debt restructuring & forgiveness Positioning Kenya as the premier black Africa nation