portuguese competitiveness - harvard business … files/caon portugal 04-10-02 ck2...portuguese...
TRANSCRIPT
1
CAON Portugal 04-17-02 CK Copyright © 2002 Professor Michael E. Porter1
Portuguese Competitiveness
Professor Michael E. PorterInstitute for Strategy and Competitiveness
Harvard Business School
Novos Desafiois da CompetitividadeLisbon, PortugalApril 17th, 2002
This presentation draws on ideas from Professor Porter’s articles and books, in particular, The Competitive Advantage of Nations (The Free Press, 1990), “The Microeconomic Foundations of Economic Development,” in The Global Competitiveness Report 2001/02, (World Economic Forum, 1998), “Clusters and the New Competitive Agenda for Companies and Governments” in On Competition (Harvard Business School Press, 1998), ongoing statistical study of clusters, and “What is Strategy?” (Harvard Business Review, Nov/Dec 1996). For further information please check the Institute’s web site at www.isc.hbs.edu. No part of this publication may be reproduced, stored in a retrieval system, or transmitted in any form or by any means - electronic, mechanical, photocopying, recording, or otherwise - without the permission of Michael E. Porter.
CAON Portugal 04-17-02 CK Copyright © 2002 Professor Michael E. Porter2
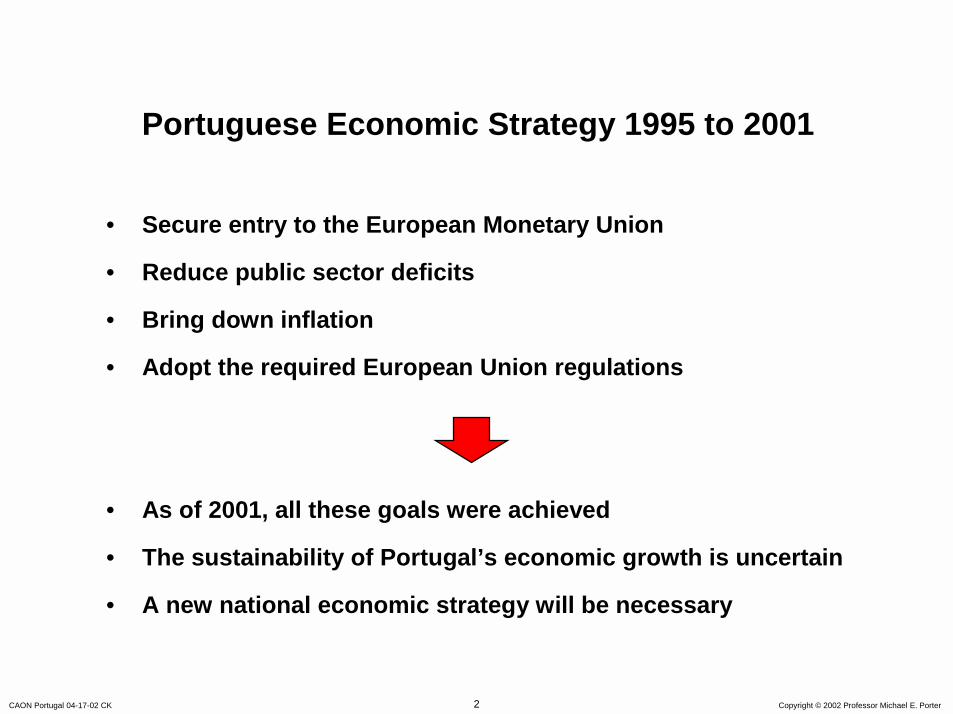
Portuguese Economic Strategy 1995 to 2001
• Secure entry to the European Monetary Union
• Reduce public sector deficits
• Bring down inflation
• Adopt the required European Union regulations
• As of 2001, all these goals were achieved
• The sustainability of Portugal’s economic growth is uncertain
• A new national economic strategy will be necessary
CAON Portugal 04-17-02 CK Copyright © 2002 Professor Michael E. Porter3
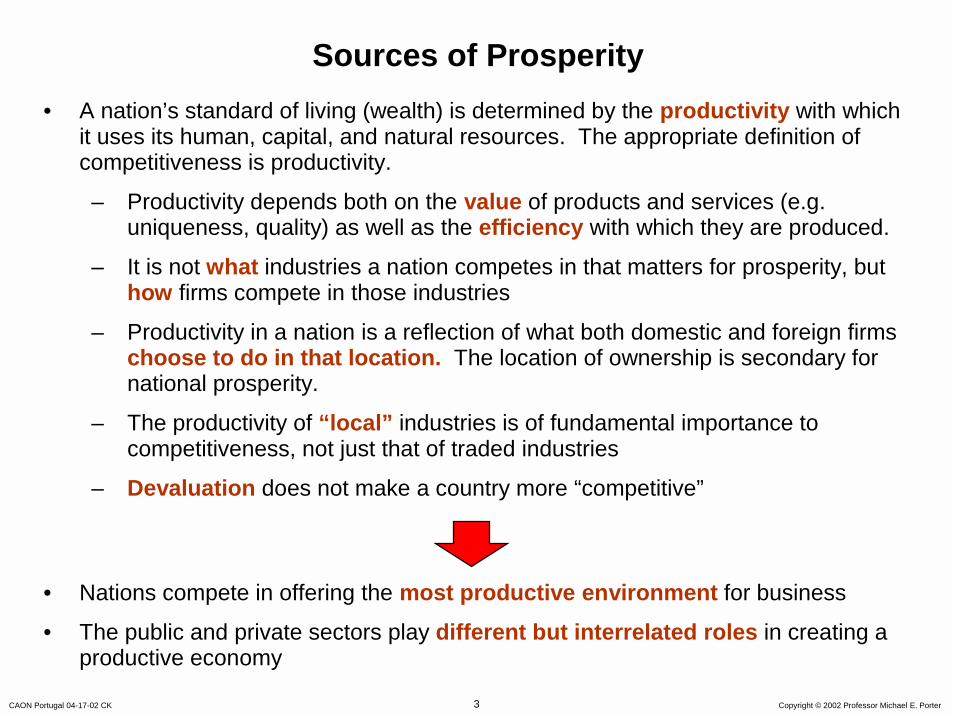
Sources of Prosperity• A nation’s standard of living (wealth) is determined by the productivity with which
it uses its human, capital, and natural resources. The appropriate definition of competitiveness is productivity.
– Productivity depends both on the value of products and services (e.g. uniqueness, quality) as well as the efficiency with which they are produced.
– It is not what industries a nation competes in that matters for prosperity, buthow firms compete in those industries
– Productivity in a nation is a reflection of what both domestic and foreign firms choose to do in that location. The location of ownership is secondary for national prosperity.
– The productivity of “local” industries is of fundamental importance to competitiveness, not just that of traded industries
– Devaluation does not make a country more “competitive”
• Nations compete in offering the most productive environment for business
• The public and private sectors play different but interrelated roles in creating a productive economy
CAON Portugal 04-17-02 CK Copyright © 2002 Professor Michael E. Porter4
Microeconomic Foundations of DevelopmentMicroeconomic Foundations of Development
Quality of the Microeconomic
BusinessEnvironment
Quality of the Microeconomic
BusinessEnvironment
Sophisticationof Company
Operations andStrategy
Sophisticationof Company
Operations andStrategy
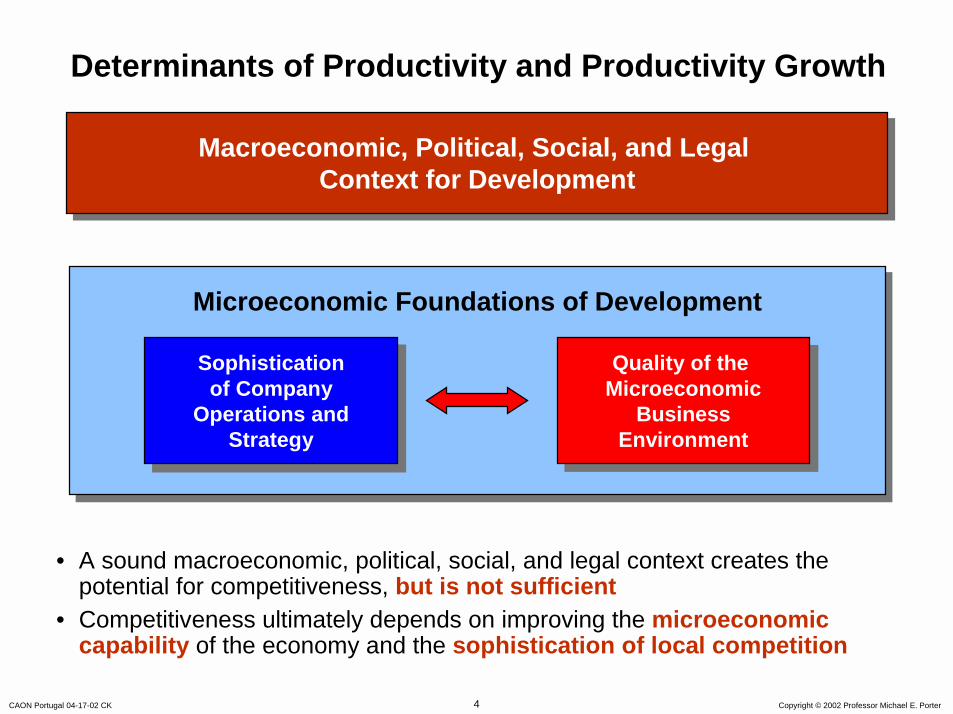
Determinants of Productivity and Productivity Growth
Macroeconomic, Political, Social, and Legal Context for Development
Macroeconomic, Political, Social, and Legal Context for Development
• A sound macroeconomic, political, social, and legal context creates the potential for competitiveness, but is not sufficient
• Competitiveness ultimately depends on improving the microeconomic capability of the economy and the sophistication of local competition
CAON Portugal 04-17-02 CK Copyright © 2002 Professor Michael E. Porter5
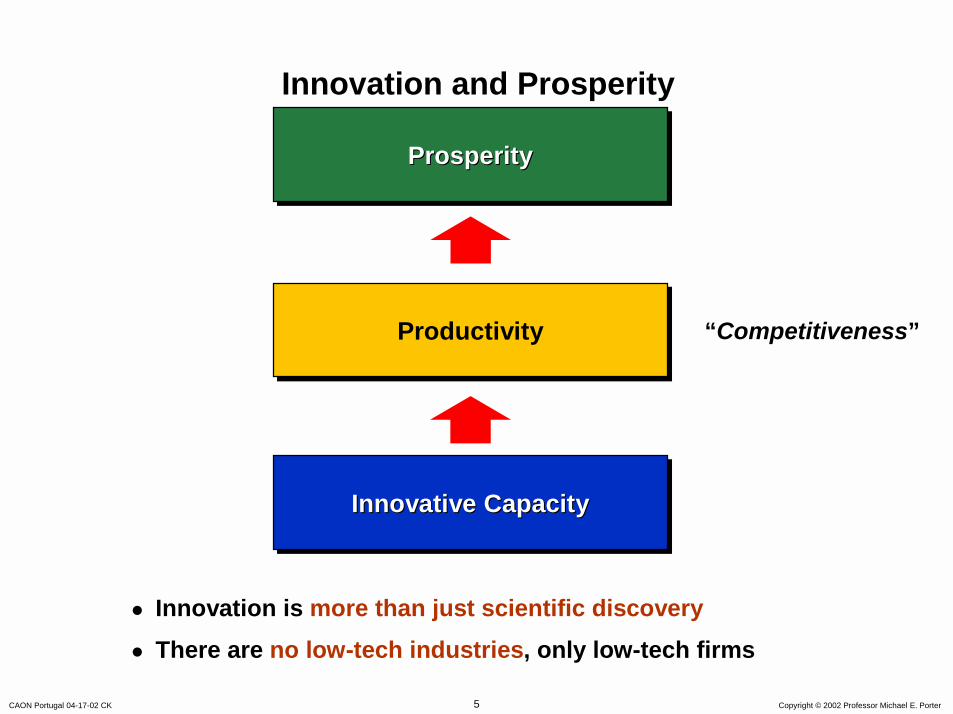
Innovation and Prosperity
ProductivityProductivity
Innovative CapacityInnovative CapacityInnovative Capacity
ProsperityProsperityProsperity
! Innovation is more than just scientific discovery! There are no low-tech industries, only low-tech firms
“Competitiveness”
CAON Portugal 04-17-02 CK Copyright © 2002 Professor Michael E. Porter6
Context for Firm
Strategy and Rivalry
Context for Context for Firm Firm
Strategy Strategy and Rivalryand Rivalry
Related and Supporting Industries
Related and Supporting Industries
Factor(Input)
Conditions
FactorFactor(Input) (Input)
ConditionsConditions
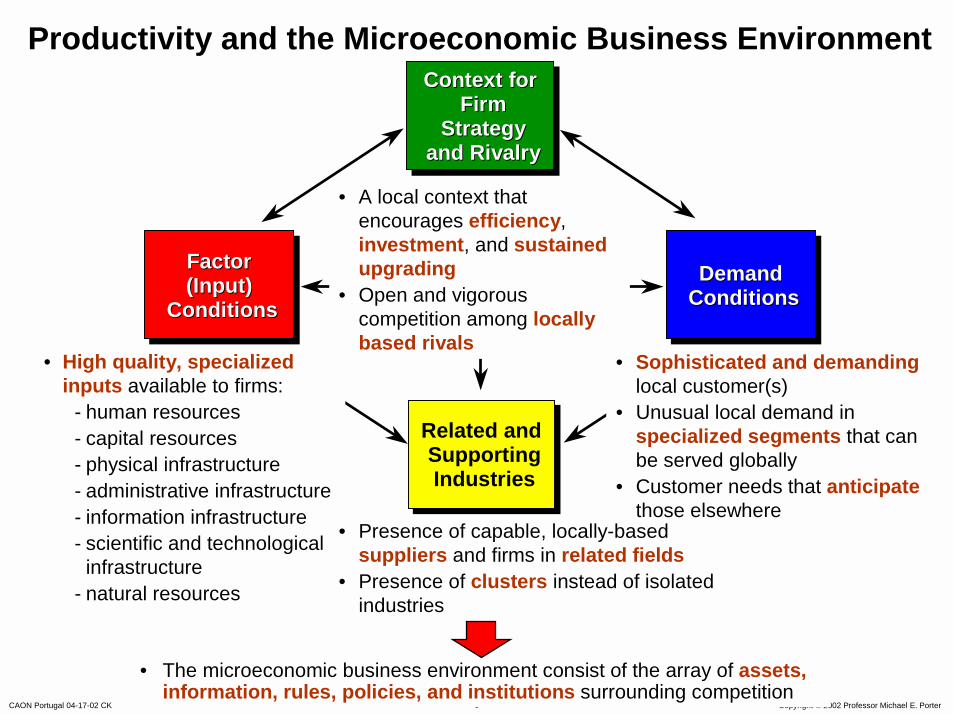
• A local context that encourages efficiency,investment, and sustained upgrading
• Open and vigorous competition among locally based rivals
Demand ConditionsDemand Demand
ConditionsConditions
Productivity and the Microeconomic Business Environment
• The microeconomic business environment consist of the array of assets, information, rules, policies, and institutions surrounding competition
• Sophisticated and demandinglocal customer(s)
• Unusual local demand in specialized segments that can be served globally
• Customer needs that anticipatethose elsewhere
• High quality, specialized inputs available to firms:
- human resources- capital resources- physical infrastructure- administrative infrastructure- information infrastructure- scientific and technological
infrastructure- natural resources
• Presence of capable, locally-based suppliers and firms in related fields
• Presence of clusters instead of isolated industries
7
CAON Portugal 04-17-02 CK Copyright © 2002 Professor Michael E. Porter7
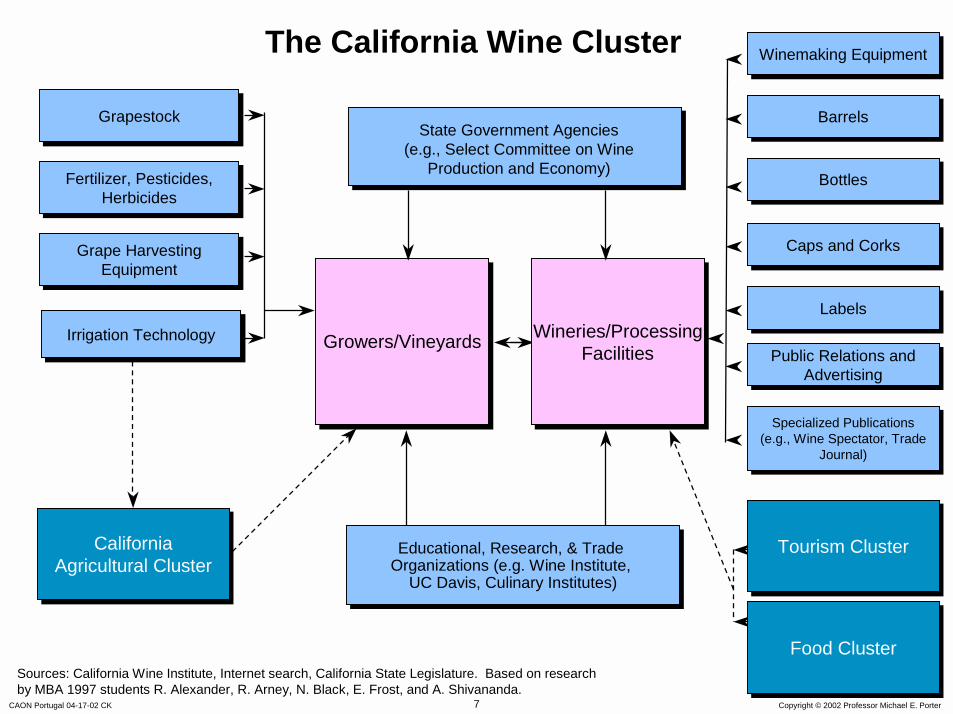
The California Wine Cluster
Educational, Research, & Trade Organizations (e.g. Wine Institute,
UC Davis, Culinary Institutes)
Educational, Research, & Trade Organizations (e.g. Wine Institute,
UC Davis, Culinary Institutes)
Growers/VineyardsGrowers/Vineyards
Sources: California Wine Institute, Internet search, California State Legislature. Based on research by MBA 1997 students R. Alexander, R. Arney, N. Black, E. Frost, and A. Shivananda.
Wineries/ProcessingFacilities
Wineries/ProcessingFacilities
GrapestockGrapestock
Fertilizer, Pesticides, Herbicides
Fertilizer, Pesticides, Herbicides
Grape Harvesting Equipment
Grape Harvesting Equipment
Irrigation TechnologyIrrigation Technology
Winemaking EquipmentWinemaking Equipment
BarrelsBarrels
LabelsLabels
BottlesBottles
Caps and CorksCaps and Corks
Public Relations and Advertising
Public Relations and Advertising
Specialized Publications (e.g., Wine Spectator, Trade
Journal)
Specialized Publications (e.g., Wine Spectator, Trade
Journal)
Food ClusterFood Cluster
Tourism ClusterTourism ClusterCalifornia Agricultural Cluster
California Agricultural Cluster
State Government Agencies(e.g., Select Committee on Wine
Production and Economy)
CAON Portugal 04-17-02 CK Copyright © 2002 Professor Michael E. Porter8
Agenda
• Portugal’s economic performance
• Portugal’s competitiveness
CAON Portugal 04-17-02 CK Copyright © 2002 Professor Michael E. Porter9
0
5,000
10,000
15,000
20,000
25,000
0%
2%
4%
6%
8%
10%
12%
14%
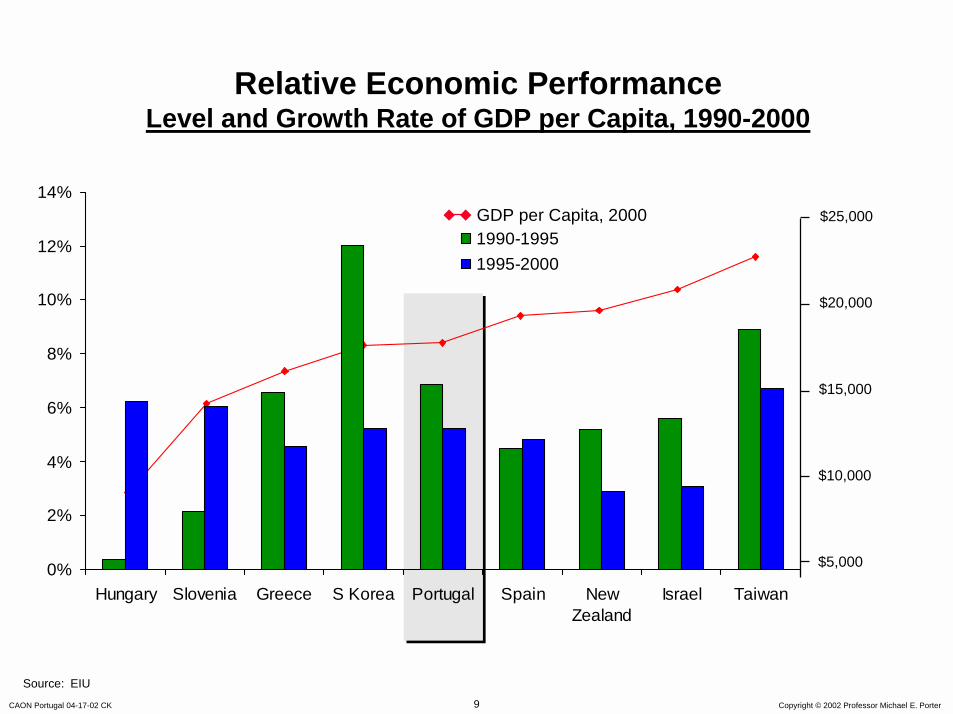
Hungary Slovenia Greece S Korea Portugal Spain NewZealand
Israel Taiwan
1990-19951995-2000
Relative Economic PerformanceLevel and Growth Rate of GDP per Capita, 1990-2000
$25,000
$20,000
$15,000
$10,000
$5,000
GDP per Capita, 2000
Source: EIU
CAON Portugal 04-17-02 CK Copyright © 2002 Professor Michael E. Porter10
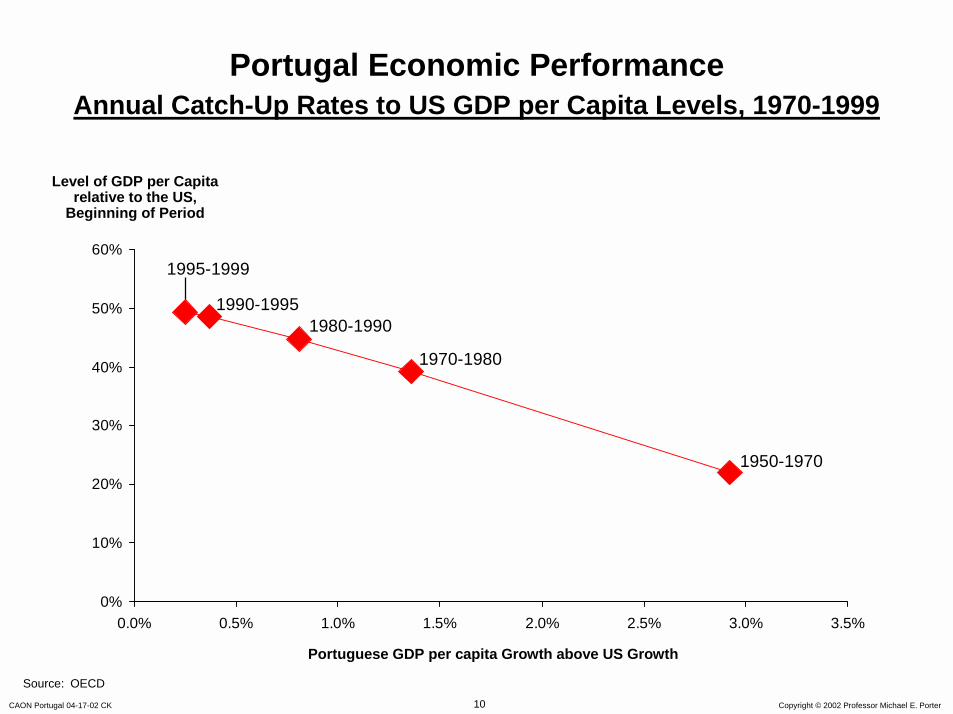
Portugal Economic PerformanceAnnual Catch-Up Rates to US GDP per Capita Levels, 1970-1999
0%
10%
20%
30%
40%
50%
60%
0.0% 0.5% 1.0% 1.5% 2.0% 2.5% 3.0% 3.5%
Source: OECD
Portuguese GDP per capita Growth above US Growth
Level of GDP per Capita relative to the US,
Beginning of Period
1950-1970
1970-1980
1980-19901990-1995
1995-1999
CAON Portugal 04-17-02 CK Copyright © 2002 Professor Michael E. Porter11
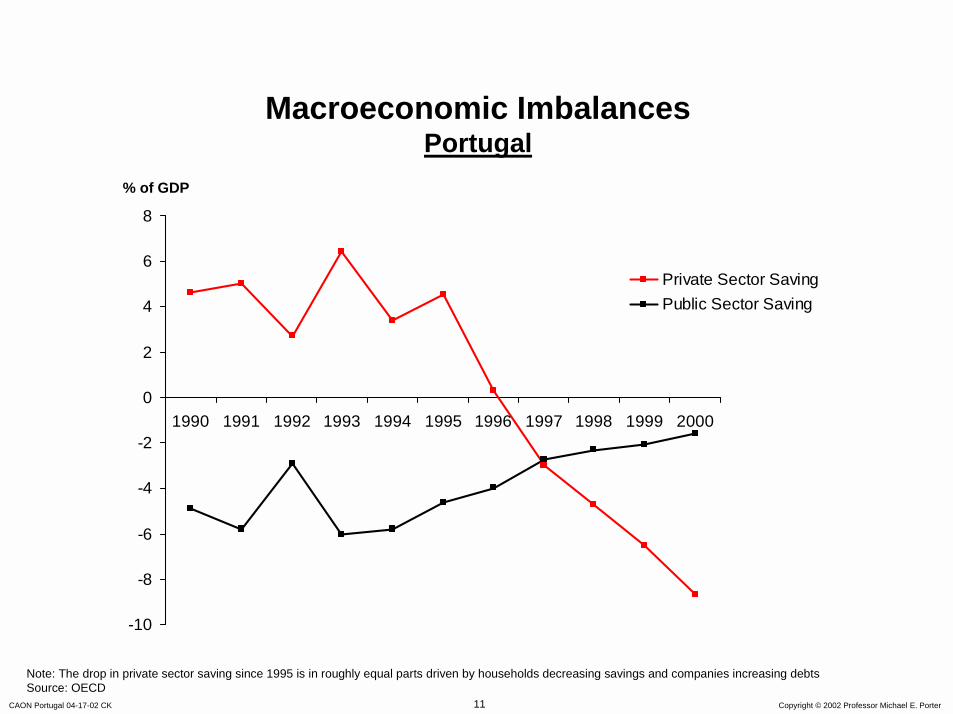
Macroeconomic ImbalancesPortugal
-10
-8
-6
-4
-2
0
2
4
6
8
1990 1991 1992 1993 1994 1995 1996 1997 1998 1999 2000
Private Sector SavingPublic Sector Saving
% of GDP
Note: The drop in private sector saving since 1995 is in roughly equal parts driven by households decreasing savings and companies increasing debtsSource: OECD
CAON Portugal 04-17-02 CK Copyright © 2002 Professor Michael E. Porter12
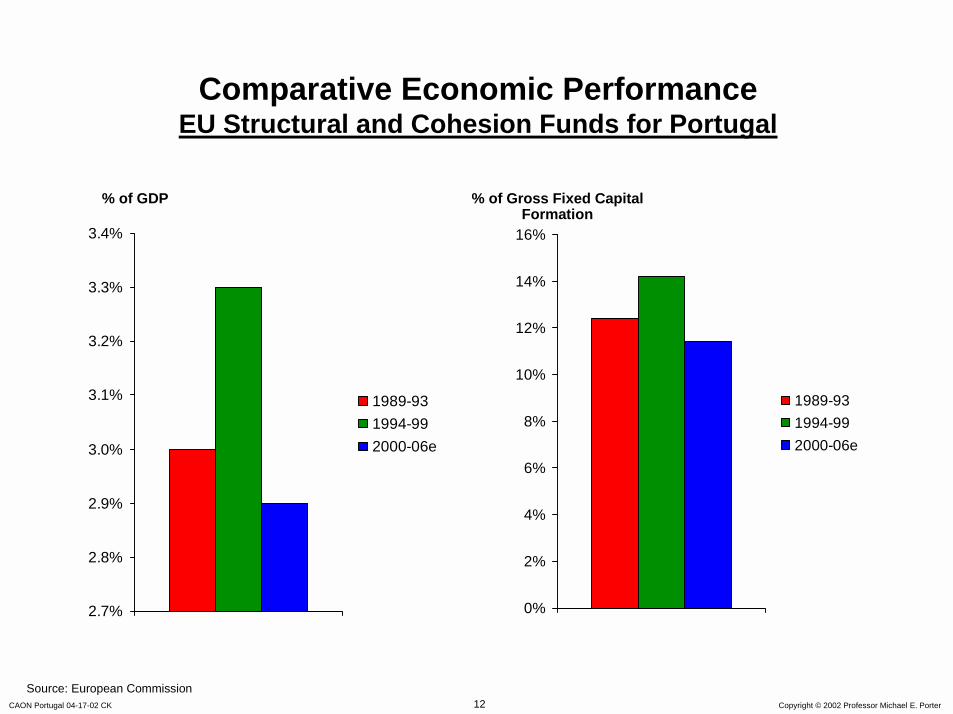
Comparative Economic PerformanceEU Structural and Cohesion Funds for Portugal
2.7%
2.8%
2.9%
3.0%
3.1%
3.2%
3.3%
3.4%
1989-931994-992000-06e
% of GDP
Source: European Commission
0%
2%
4%
6%
8%
10%
12%
14%
16%
1989-931994-992000-06e
% of Gross Fixed Capital Formation
CAON Portugal 04-17-02 CK Copyright © 2002 Professor Michael E. Porter13
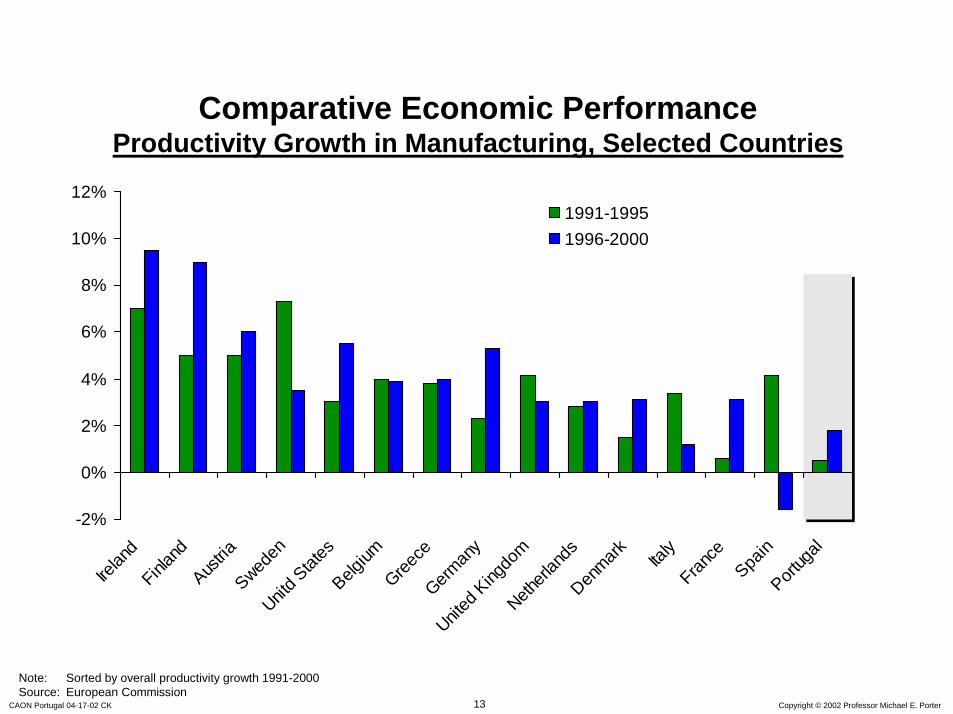
Comparative Economic PerformanceProductivity Growth in Manufacturing, Selected Countries
-2%
0%
2%
4%
6%
8%
10%
12%
Irelan
dFinla
ndAus
triaSwed
enUnit
d Stat
esBelg
iumGree
ceGerm
any
United
Kingdo
mNeth
erlan
dsDen
mark Italy
France
Spain
Portug
al
1991-19951996-2000
Note: Sorted by overall productivity growth 1991-2000Source: European Commission
CAON Portugal 04-17-02 CK Copyright © 2002 Professor Michael E. Porter14
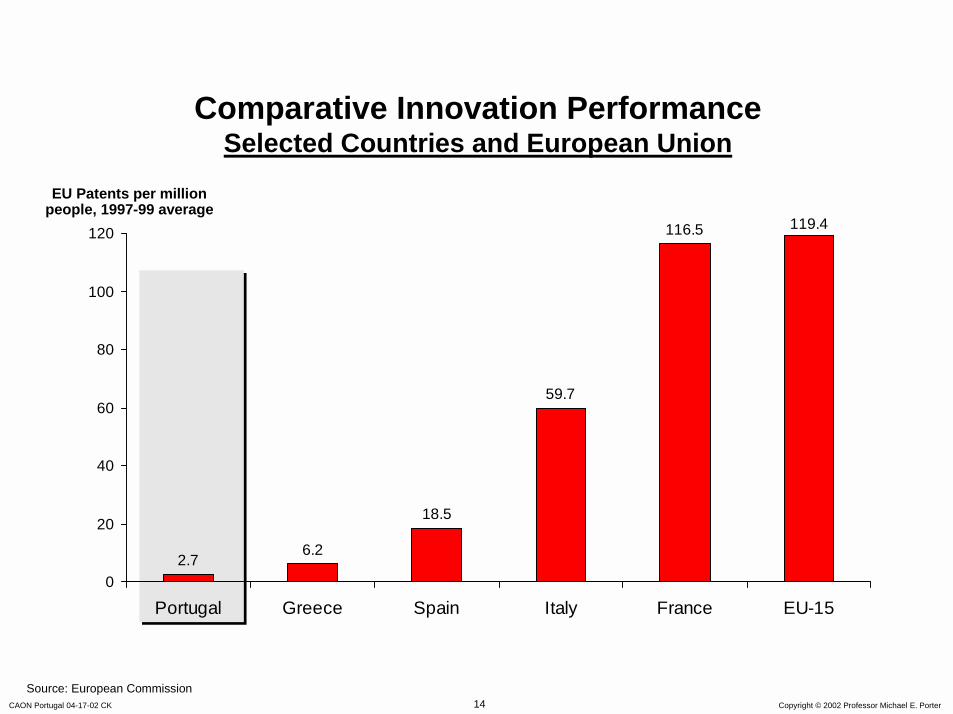
Comparative Innovation PerformanceSelected Countries and European Union
2.76.2
18.5
59.7
116.5 119.4
0
20
40
60
80
100
120
Portugal Greece Spain Italy France EU-15
EU Patents per million people, 1997-99 average
Source: European Commission
CAON Portugal 04-17-02 CK Copyright © 2002 Professor Michael E. Porter15
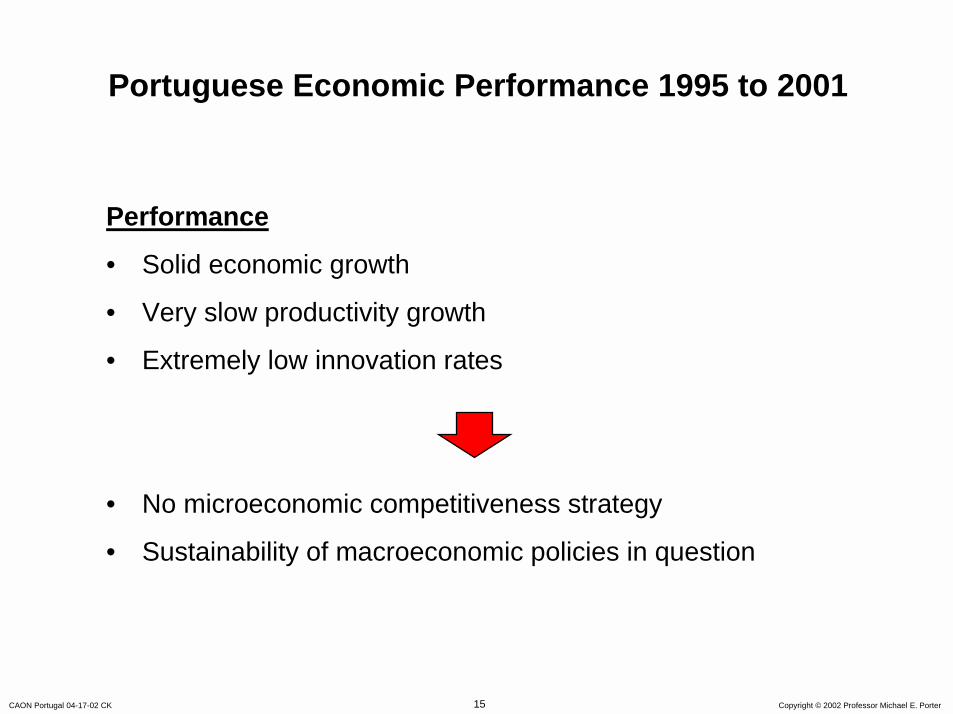
Portuguese Economic Performance 1995 to 2001
Performance
• Solid economic growth
• Very slow productivity growth
• Extremely low innovation rates
• No microeconomic competitiveness strategy
• Sustainability of macroeconomic policies in question
CAON Portugal 04-17-02 CK Copyright © 2002 Professor Michael E. Porter16
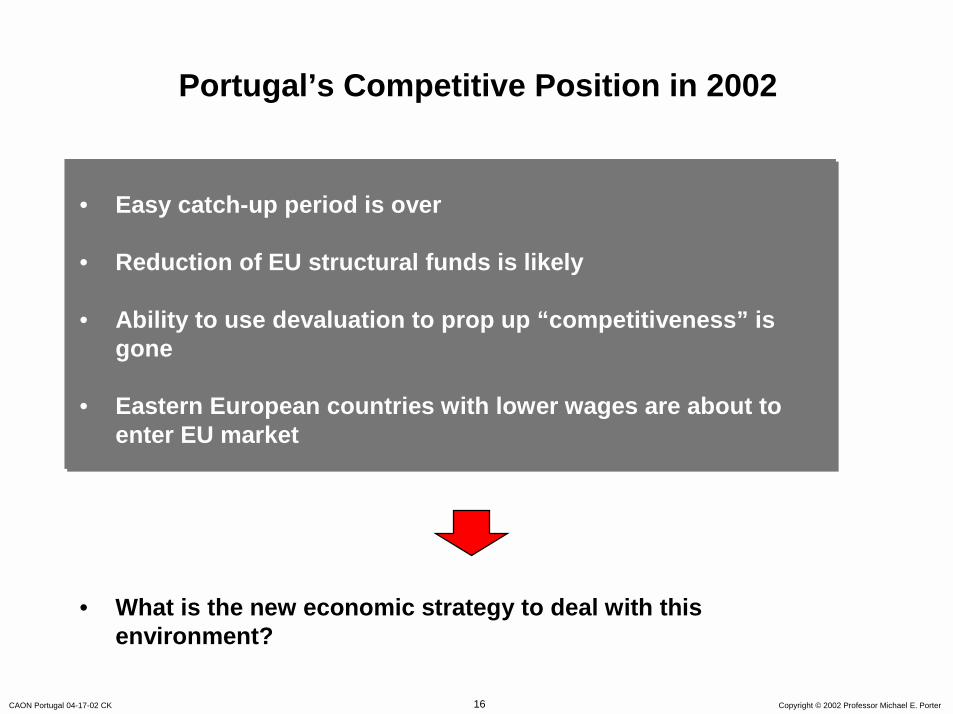
Portugal’s Competitive Position in 2002
• Easy catch-up period is over
• Reduction of EU structural funds is likely
• Ability to use devaluation to prop up “competitiveness” is gone
• Eastern European countries with lower wages are about to enter EU market
• What is the new economic strategy to deal with this environment?
CAON Portugal 04-17-02 CK Copyright © 2002 Professor Michael E. Porter17
Agenda
• Portugal’s economic performance
• Portugal’s competitiveness
CAON Portugal 04-17-02 CK Copyright © 2002 Professor Michael E. Porter18
Context for Firm
Strategy and Rivalry
Context for Context for Firm Firm
Strategy Strategy and Rivalryand Rivalry
Related and Supporting Industries
Related and Supporting Industries
Factor(Input)
Conditions
FactorFactor(Input) (Input)
ConditionsConditions
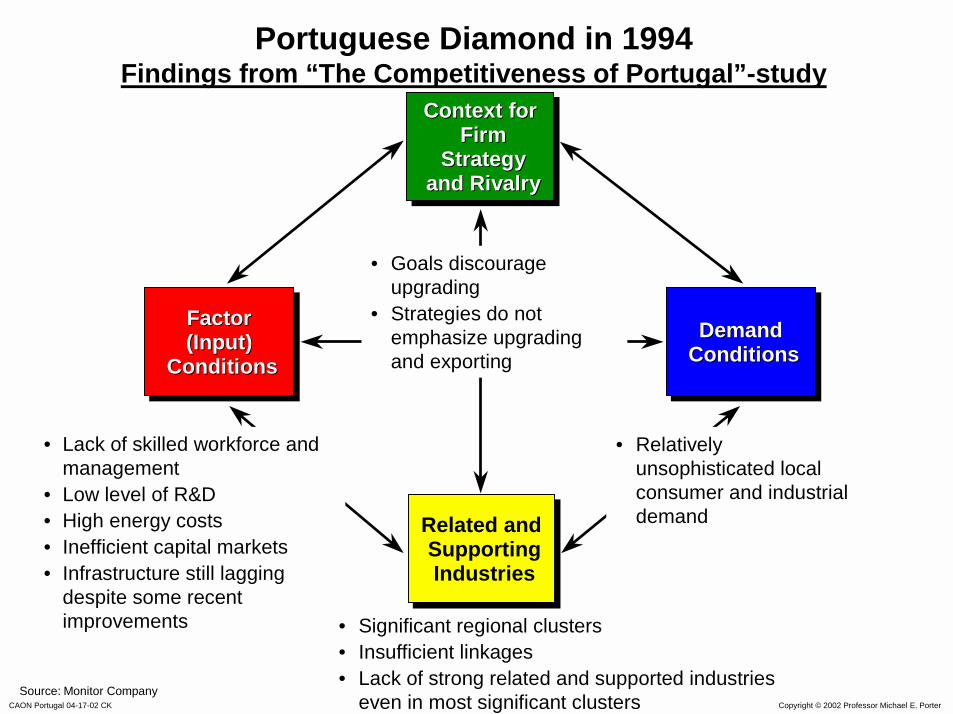
• Relatively unsophisticated local consumer and industrial demand
• Goals discourage upgrading
• Strategies do not emphasize upgrading and exporting
Demand ConditionsDemand Demand
ConditionsConditions
• Lack of skilled workforce and management
• Low level of R&D• High energy costs• Inefficient capital markets• Infrastructure still lagging
despite some recent improvements
Portuguese Diamond in 1994Findings from “The Competitiveness of Portugal”-study
Source: Monitor Company
• Significant regional clusters• Insufficient linkages• Lack of strong related and supported industries
even in most significant clusters
CAON Portugal 04-17-02 CK Copyright © 2002 Professor Michael E. Porter19
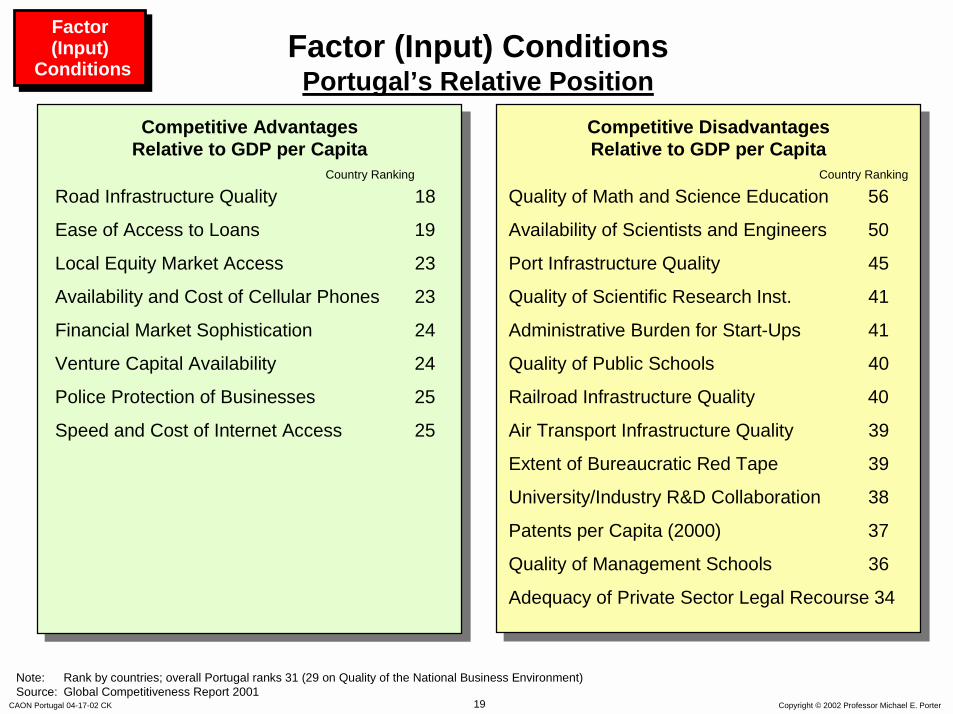
Factor (Input) ConditionsPortugal’s Relative Position
Factor(Input)
Conditions
Factor(Input)
Conditions
Road Infrastructure Quality 18
Ease of Access to Loans 19
Local Equity Market Access 23
Availability and Cost of Cellular Phones 23
Financial Market Sophistication 24
Venture Capital Availability 24
Police Protection of Businesses 25
Speed and Cost of Internet Access 25
Competitive Disadvantages Relative to GDP per Capita
Competitive Advantages Relative to GDP per Capita
Country RankingCountry Ranking
Note: Rank by countries; overall Portugal ranks 31 (29 on Quality of the National Business Environment)Source: Global Competitiveness Report 2001
Quality of Math and Science Education 56
Availability of Scientists and Engineers 50
Port Infrastructure Quality 45
Quality of Scientific Research Inst. 41
Administrative Burden for Start-Ups 41
Quality of Public Schools 40
Railroad Infrastructure Quality 40
Air Transport Infrastructure Quality 39
Extent of Bureaucratic Red Tape 39
University/Industry R&D Collaboration 38
Patents per Capita (2000) 37
Quality of Management Schools 36
Adequacy of Private Sector Legal Recourse 34
CAON Portugal 04-17-02 CK Copyright © 2002 Professor Michael E. Porter20
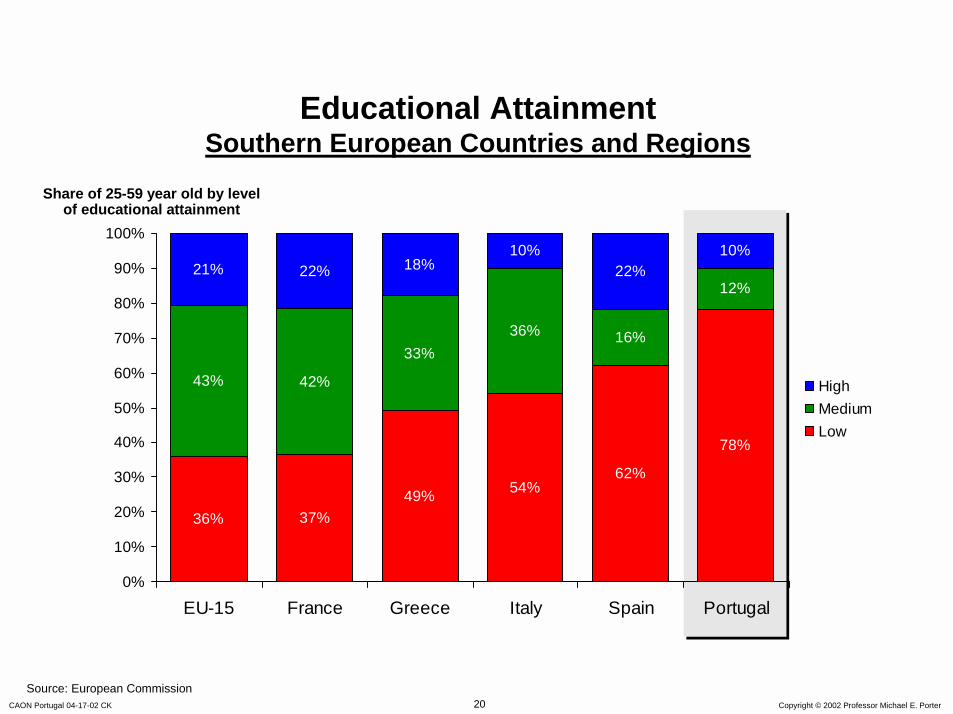
Educational AttainmentSouthern European Countries and Regions
36% 37%49% 54%
62%
78%
43% 42%
33%36% 16%
12%21% 22% 18%
10%22%
10%
0%
10%
20%
30%
40%
50%
60%
70%
80%
90%
100%
EU-15 France Greece Italy Spain Portugal
HighMediumLow
Share of 25-59 year old by level of educational attainment
Source: European Commission
CAON Portugal 04-17-02 CK Copyright © 2002 Professor Michael E. Porter21
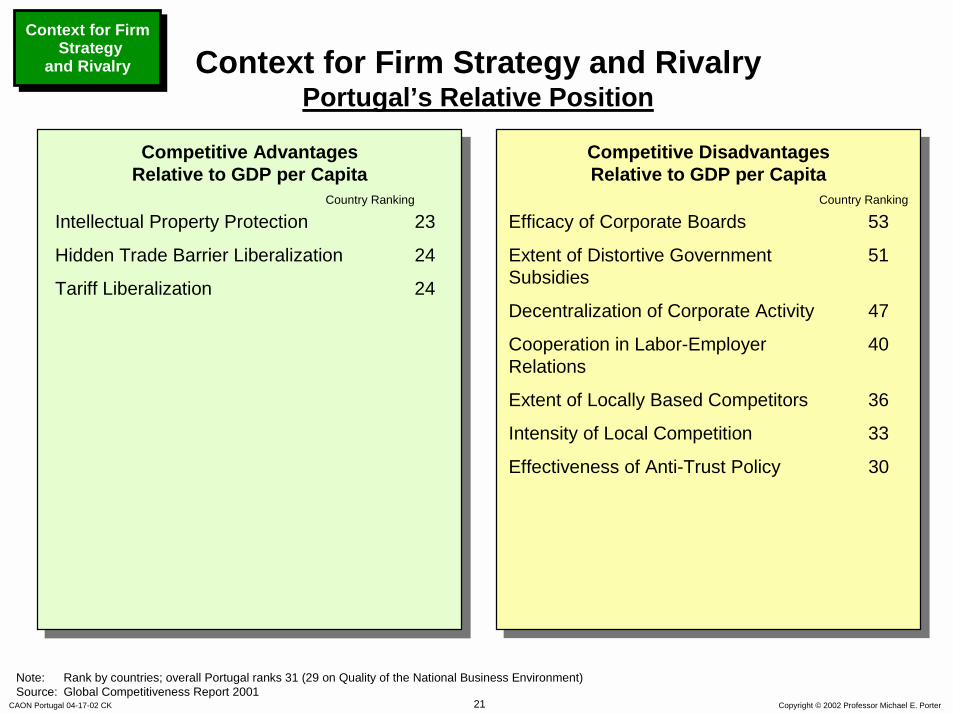
Context for Firm Strategy and RivalryPortugal’s Relative Position
Intellectual Property Protection 23
Hidden Trade Barrier Liberalization 24
Tariff Liberalization 24
Competitive Disadvantages Relative to GDP per Capita
Competitive Advantages Relative to GDP per Capita
Country RankingCountry Ranking
Note: Rank by countries; overall Portugal ranks 31 (29 on Quality of the National Business Environment)Source: Global Competitiveness Report 2001
Efficacy of Corporate Boards 53
Extent of Distortive Government 51Subsidies
Decentralization of Corporate Activity 47
Cooperation in Labor-Employer 40Relations
Extent of Locally Based Competitors 36
Intensity of Local Competition 33
Effectiveness of Anti-Trust Policy 30
Context for Firm Strategy
and Rivalry
Context for Firm Strategy
and Rivalry
CAON Portugal 04-17-02 CK Copyright © 2002 Professor Michael E. Porter22
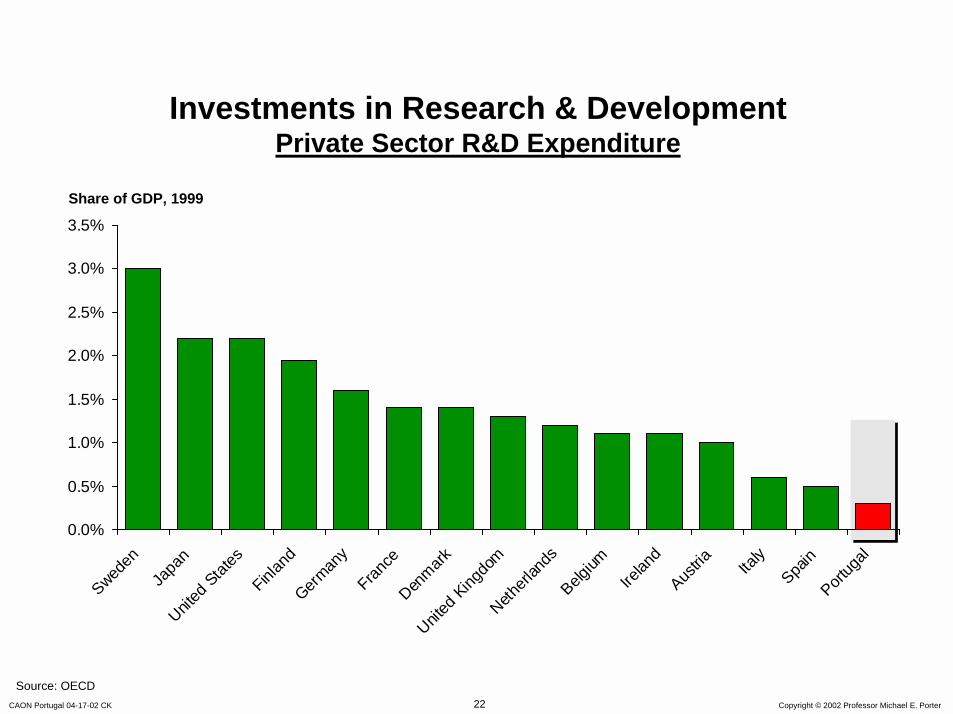
Investments in Research & DevelopmentPrivate Sector R&D Expenditure
0.0%
0.5%
1.0%
1.5%
2.0%
2.5%
3.0%
3.5%
Sweden
Japa
nUnit
ed Stat
esFinl
and
German
yFran
ceDen
markUnit
ed King
dom
Netherl
ands
Belgium
Irelan
dAus
tria Italy
Spain
Portug
al
Share of GDP, 1999
Source: OECD
CAON Portugal 04-17-02 CK Copyright © 2002 Professor Michael E. Porter23
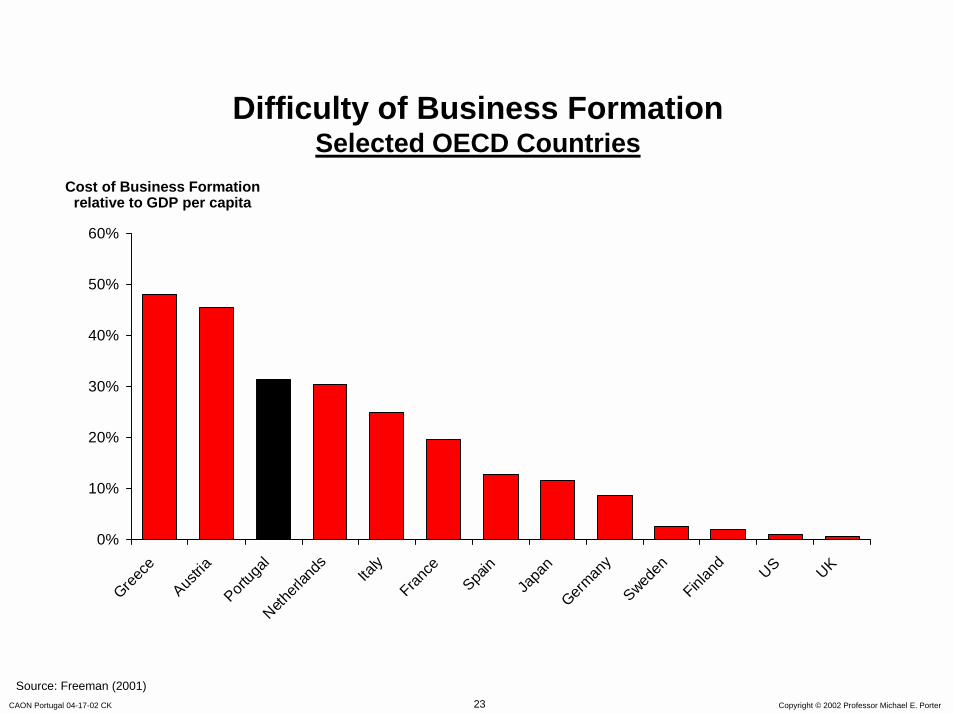
Difficulty of Business FormationSelected OECD Countries
0%
10%
20%
30%
40%
50%
60%
Greece
Austria
Portug
alNeth
erlan
ds Italy
France
Spain
Japa
nGerm
any
Sweden
Finlan
d
US UK
Cost of Business Formation relative to GDP per capita
Source: Freeman (2001)
CAON Portugal 04-17-02 CK Copyright © 2002 Professor Michael E. Porter24
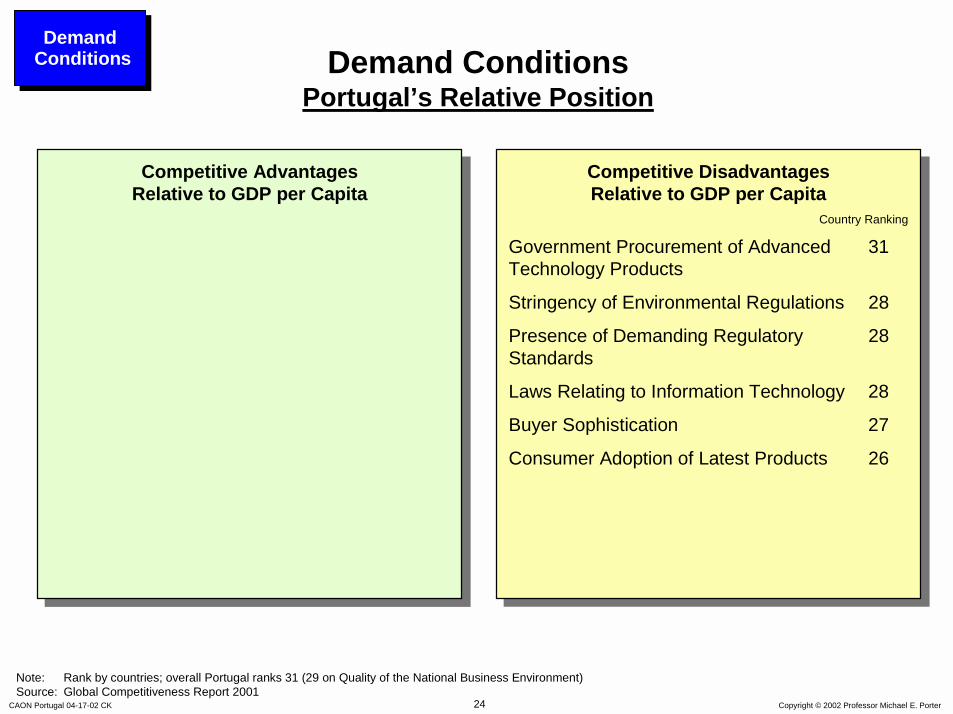
Demand ConditionsPortugal’s Relative Position
Competitive Disadvantages Relative to GDP per Capita
Competitive Advantages Relative to GDP per Capita
Country Ranking
Note: Rank by countries; overall Portugal ranks 31 (29 on Quality of the National Business Environment)Source: Global Competitiveness Report 2001
Government Procurement of Advanced 31 Technology Products
Stringency of Environmental Regulations 28
Presence of Demanding Regulatory 28Standards
Laws Relating to Information Technology 28
Buyer Sophistication 27
Consumer Adoption of Latest Products 26
Demand ConditionsDemand
Conditions
CAON Portugal 04-17-02 CK Copyright © 2002 Professor Michael E. Porter25
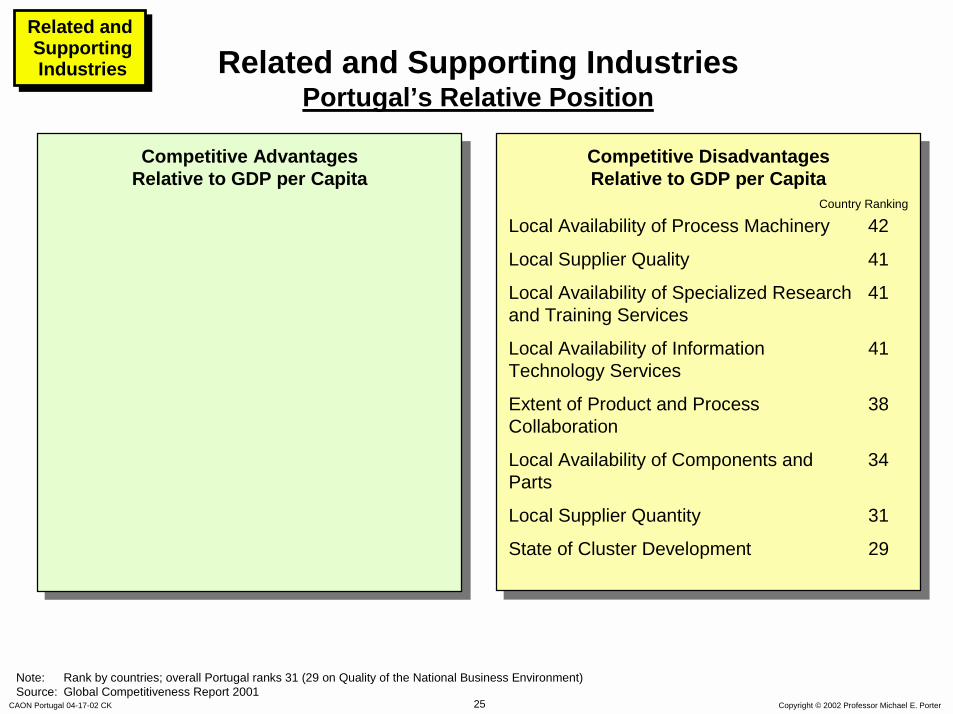
Related and Supporting IndustriesPortugal’s Relative Position
Competitive Disadvantages Relative to GDP per Capita
Competitive Advantages Relative to GDP per Capita
Country Ranking
Note: Rank by countries; overall Portugal ranks 31 (29 on Quality of the National Business Environment)Source: Global Competitiveness Report 2001
Local Availability of Process Machinery 42
Local Supplier Quality 41
Local Availability of Specialized Research 41and Training Services
Local Availability of Information 41 Technology Services
Extent of Product and Process 38Collaboration
Local Availability of Components and 34Parts
Local Supplier Quantity 31
State of Cluster Development 29
Related and Supporting Industries
Related and Supporting Industries
CAON Portugal 04-17-02 CK Copyright © 2002 Professor Michael E. Porter26
Context for Firm
Strategy and Rivalry
Context for Context for Firm Firm
Strategy Strategy and Rivalryand Rivalry
Related and Supporting Industries
Related and Supporting Industries
Factor(Input)
Conditions
FactorFactor(Input) (Input)
ConditionsConditions
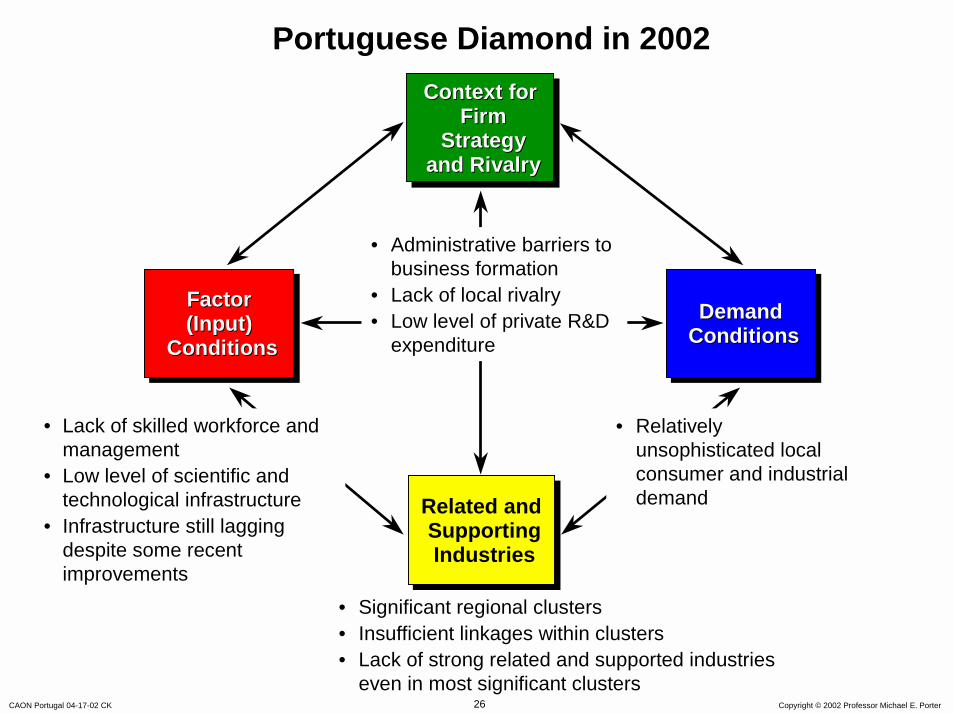
• Relatively unsophisticated local consumer and industrial demand
• Administrative barriers to business formation
• Lack of local rivalry• Low level of private R&D
expenditureDemand
ConditionsDemand Demand
ConditionsConditions
• Lack of skilled workforce and management
• Low level of scientific and technological infrastructure
• Infrastructure still lagging despite some recent improvements
Portuguese Diamond in 2002
• Significant regional clusters• Insufficient linkages within clusters• Lack of strong related and supported industries
even in most significant clusters
CAON Portugal 04-17-02 CK Copyright © 2002 Professor Michael E. Porter27
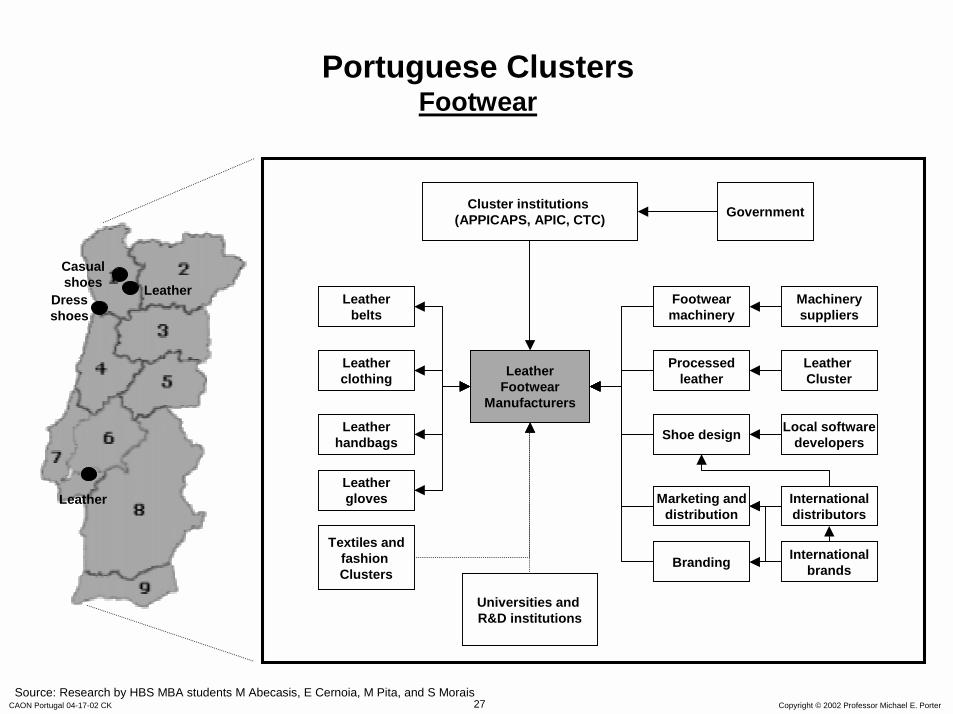
Portuguese ClustersFootwear
LeatherFootwear
Manufacturers
Universities and R&D institutions
Branding
Shoe design
Marketing anddistribution
Processedleather
Cluster institutions (APPICAPS, APIC, CTC)
Footwearmachinery
Internationalbrands
Local softwaredevelopers
Internationaldistributors
Leather Cluster
Machinerysuppliers
Textiles andfashion Clusters
Leatherhandbags
Leathergloves
Leatherclothing
Government
Leatherbelts
Leather
Dress shoes
Leather
Casual shoes
Source: Research by HBS MBA students M Abecasis, E Cernoia, M Pita, and S Morais
CAON Portugal 04-17-02 CK Copyright © 2002 Professor Michael E. Porter28
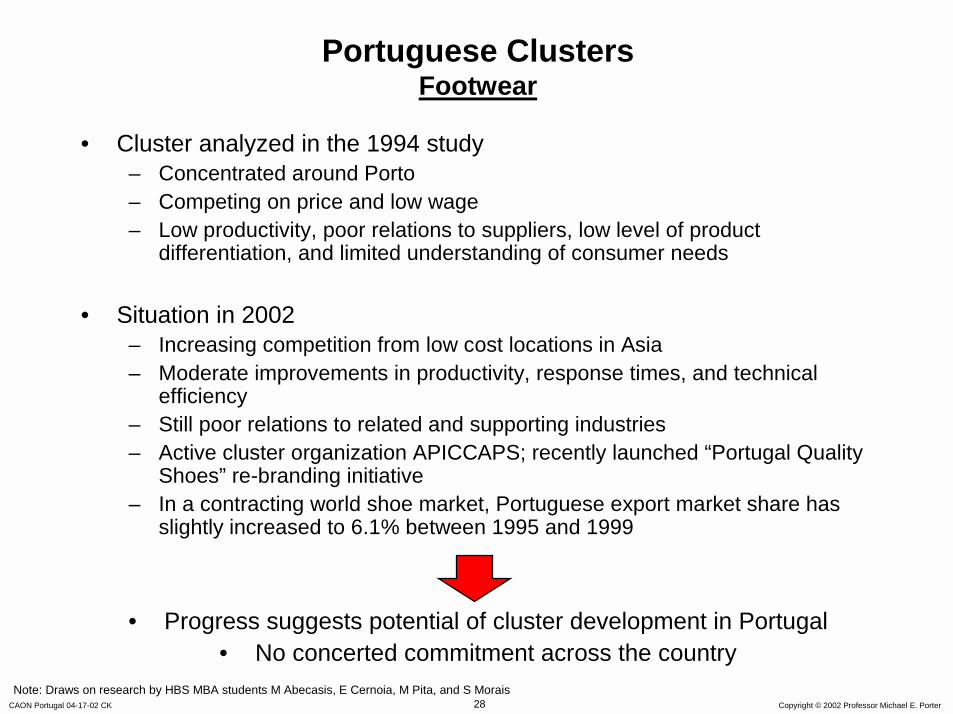
Portuguese ClustersFootwear
• Cluster analyzed in the 1994 study– Concentrated around Porto– Competing on price and low wage– Low productivity, poor relations to suppliers, low level of product
differentiation, and limited understanding of consumer needs
• Situation in 2002– Increasing competition from low cost locations in Asia– Moderate improvements in productivity, response times, and technical
efficiency– Still poor relations to related and supporting industries– Active cluster organization APICCAPS; recently launched “Portugal Quality
Shoes” re-branding initiative– In a contracting world shoe market, Portuguese export market share has
slightly increased to 6.1% between 1995 and 1999
• Progress suggests potential of cluster development in Portugal• No concerted commitment across the country
Note: Draws on research by HBS MBA students M Abecasis, E Cernoia, M Pita, and S Morais
CAON Portugal 04-17-02 CK Copyright © 2002 Professor Michael E. Porter29
Portuguese Competitiveness 1994 versus 2002
• Portugal has made important progress on macroeconomic terms
• Progress on the microeconomic foundations of competitiveness has been largely absent – There are exceptions (E.g., reduction of government subsidies,
privatizations, creation of a more independent anti-trust authority) – The exceptions were more a by-product of adopting EU rules than
part of a competitiveness strategy
• Portugal must address its microeconomic weaknesses if it is to improve or even sustain its prosperity
CAON Portugal 04-17-02 CK Copyright © 2002 Professor Michael E. Porter30
Portugal in 2002 The Need for a New Strategy
• The central challenge is microeconomic
• Portugal’s new strategy must focus on competitiveness and productivity
– A long-term program to upgrade the business environment– A long-term program to build innovative capacity
• Aggressive cluster development throughout the economy must become a national priority
• Leaders must create a national economic vision to inspire and motivate the Portuguese people