june 25, 2015 tom timko vice president, controller & cao · tom timko vice president,...
TRANSCRIPT
General Motors – Behind the ChartsJune 25, 2015
Tom TimkoVice President, Controller & CAO
1
In this presentation and in related comments by our management, our use of the words“plans,” “expect,” “anticipate,” “possible,” “target,” “believe,” “commit,” “intend,”“continue,” “may,” “would,” “could,” “should,” “project,” “appears,” “potential,” “projected,”“upside,” “positioned,” “outlook” or similar expressions is intended to identify forward-looking statements that represent our current judgment about possible future events.We believe these judgments are reasonable, but these statements are not guarantees ofany events or financial results, and our actual results may differ materially due to avariety of important factors. Among other items, such factors may include: our ability torealize production efficiencies and to achieve reductions in costs as a result of ourrestructuring initiatives and labor modifications; our ability to maintain quality controlover our vehicles and avoid material vehicle recalls and the cost and effect on ourreputation of product recalls; our ability to maintain adequate financing sources,including as required to fund our planned significant investment in new technology; theability of our suppliers to timely deliver parts, components and systems; our ability torealize successful vehicle applications of new technology; overall strength and stability ofour markets, particularly outside of North America and China; costs and risks associatedwith litigation and government investigations including those related to our recent recalls;our ability to remain competitive and our ability to continue to attract new customers,particularly for our new products.
General Motors Co. (“GM”)’s most recent annual report on Form 10-K and quarterlyreports on Form 10-Q provides information about these and other factors, which we mayrevise or supplement in future reports to the Securities and Exchange Commission (the"SEC").
Forward Looking Statements
Note: References throughout this presentation to SEC filed documents 10-Q and 10-K refer to pagenumbers from the EDGAR filed versions, which can be found on:http://www.gm.com/company/investors/sec-filings.html
2
Agenda
Reporting
Understanding the EBIT Bridge
Warranty & Recall Accounting
Taxes
Automotive Cash Flow Considerations
Appendix
The purpose of this presentation is to highlight how GM accounts for keyfinancial elements as well as to answer frequently asked questions
3
Reporting
Understanding the EBIT Bridge
Warranty & Recall Accounting
Taxes
Automotive Cash Flow Considerations
Appendix
Agenda
4
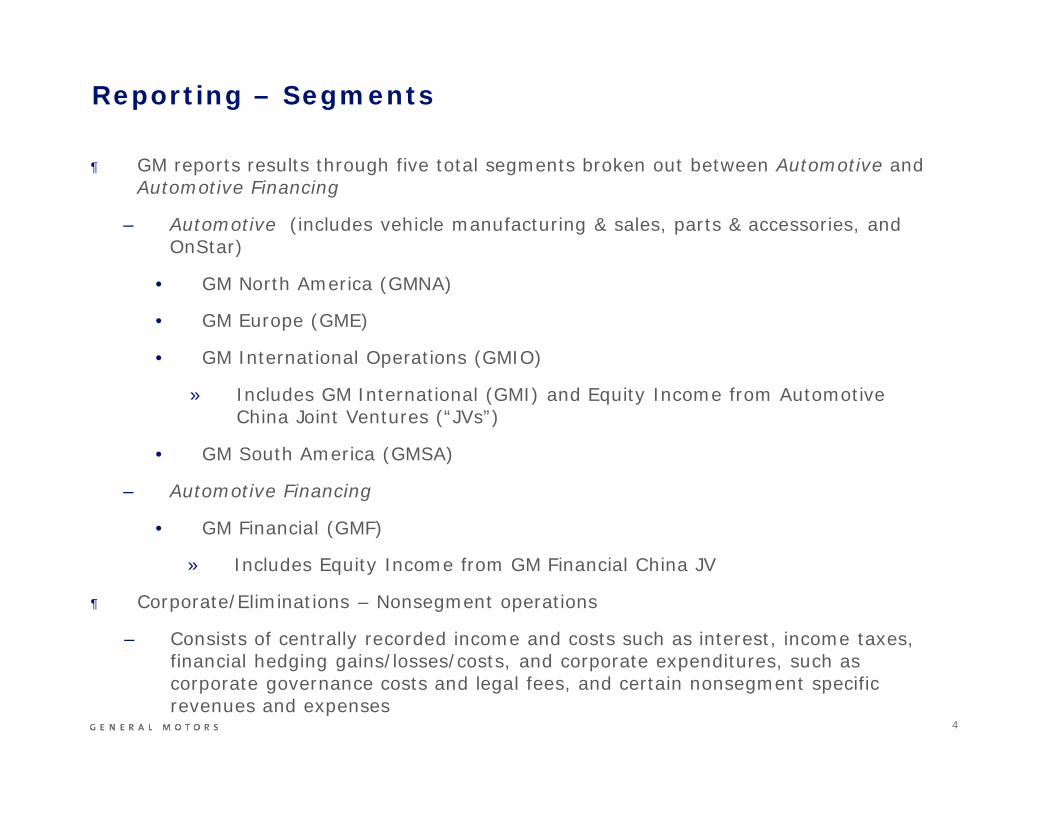
¶ GM reports results through five total segments broken out between Automotive andAutomotive Financing
– Automotive (includes vehicle manufacturing & sales, parts & accessories, andOnStar)
• GM North America (GMNA)
• GM Europe (GME)
• GM International Operations (GMIO)
» Includes GM International (GMI) and Equity Income from AutomotiveChina Joint Ventures (“JVs”)
• GM South America (GMSA)
– Automotive Financing
• GM Financial (GMF)
» Includes Equity Income from GM Financial China JV
¶ Corporate/Eliminations – Nonsegment operations
– Consists of centrally recorded income and costs such as interest, income taxes,financial hedging gains/losses/costs, and corporate expenditures, such ascorporate governance costs and legal fees, and certain nonsegment specificrevenues and expenses
Reporting – Segments
5
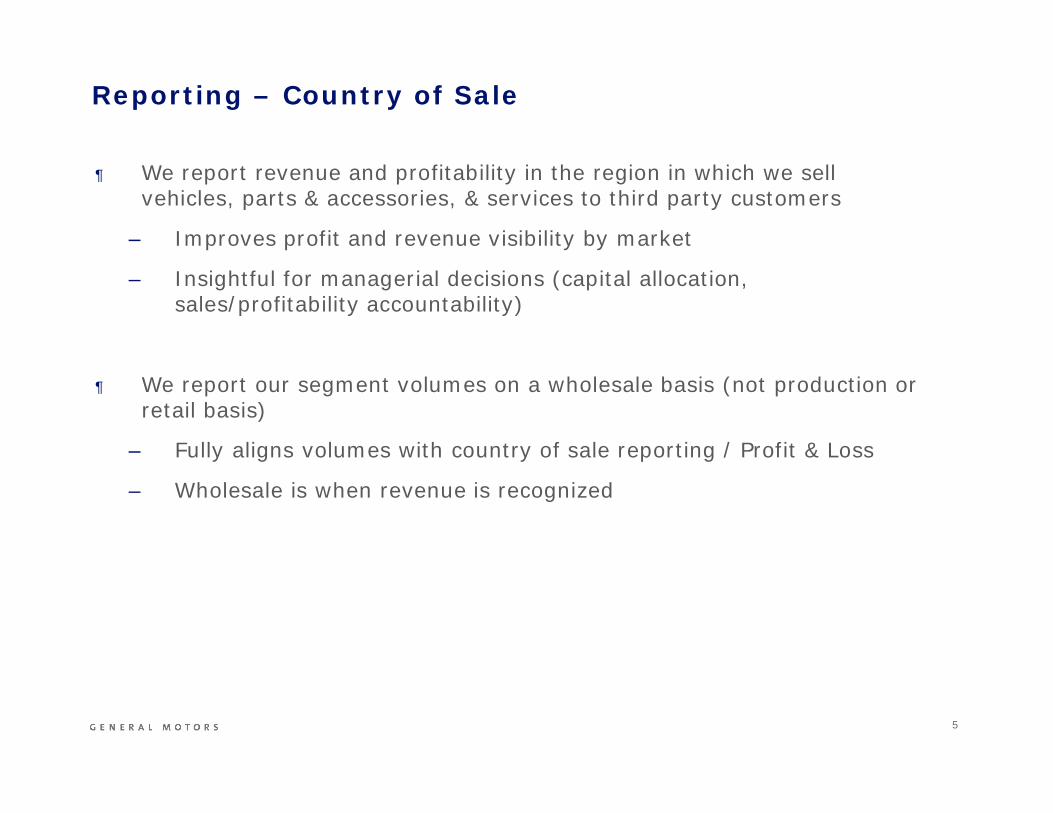
¶ We report revenue and profitability in the region in which we sellvehicles, parts & accessories, & services to third party customers
– Improves profit and revenue visibility by market
– Insightful for managerial decisions (capital allocation,sales/profitability accountability)
¶ We report our segment volumes on a wholesale basis (not production orretail basis)
– Fully aligns volumes with country of sale reporting / Profit & Loss
– Wholesale is when revenue is recognized
Reporting – Country of Sale
6
Wholesale Units
Revenue $
GM Dealers (excludes JV sales)
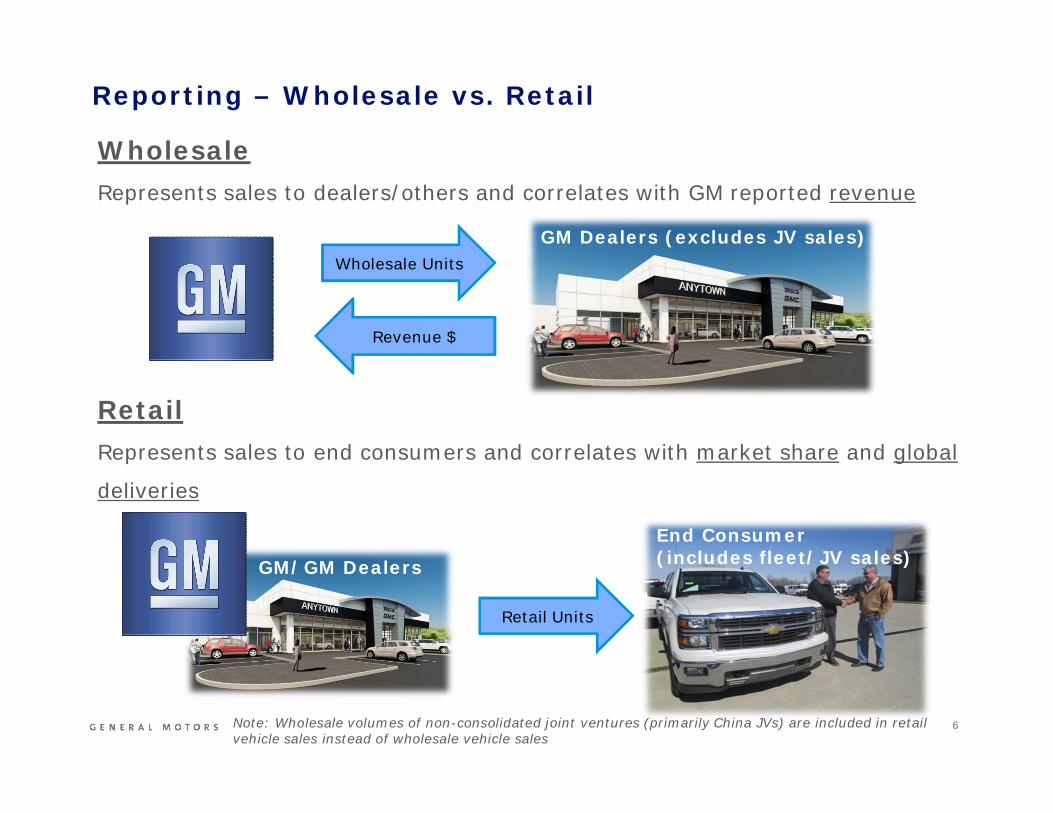
WholesaleRepresents sales to dealers/others and correlates with GM reported revenue
RetailRepresents sales to end consumers and correlates with market share and global
deliveries
End Consumer(includes fleet/JV sales)GM/GM Dealers
Retail Units
Reporting – Wholesale vs. Retail
Note: Wholesale volumes of non-consolidated joint ventures (primarily China JVs) are included in retailvehicle sales instead of wholesale vehicle sales

7
Wholesale volumes of non-consolidatedjoint ventures (primarily China JVs) areincluded in retail vehicle sales instead of
wholesale vehicle sales
Note: Information per p. 1-2 of the 2014 10-K*For China, end user retail data is not readily available for the industry; therefore, wholesale volumeswere used for GM, Industry, and Market Share
2014 CY Wholesale and Retail vehicle sales by segment:
Reporting – Wholesale vs. Retail
GM GM IndustryMarketShare
GMNA 3,320 GMNA 3,413 20,237 16.9%GME 1,172 GME 1,256 18,731 6.7%GMIO 655 GMIO* 4,378 42,980 10.2%GMSA 886 GMSA 878 5,301 16.6%Worldwide 6,033 Worldwide 9,925 87,249 11.4%
Wholesale Vehicle Sales(in thousands)
Retail Vehicle Sales(in thousands)
8
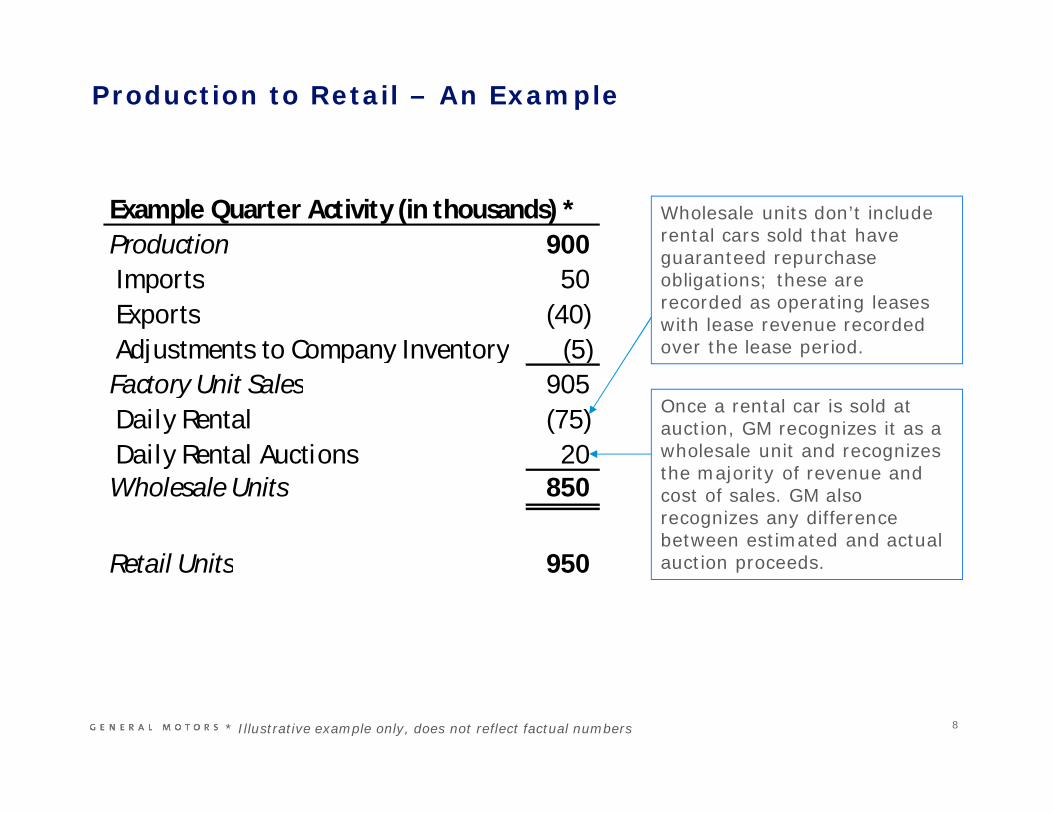
Wholesale units don’t includerental cars sold that haveguaranteed repurchaseobligations; these arerecorded as operating leaseswith lease revenue recordedover the lease period.
Once a rental car is sold atauction, GM recognizes it as awholesale unit and recognizesthe majority of revenue andcost of sales. GM alsorecognizes any differencebetween estimated and actualauction proceeds.
* Illustrative example only, does not reflect factual numbers
Example Quarter Activity (in thousands) *Production 900 Imports 50 Exports (40) Adjustments to Company Inventory (5)Factory Unit Sales 905 Daily Rental (75) Daily Rental Auctions 20Wholesale Units 850
Retail Units 950
Production to Retail – An Example
9
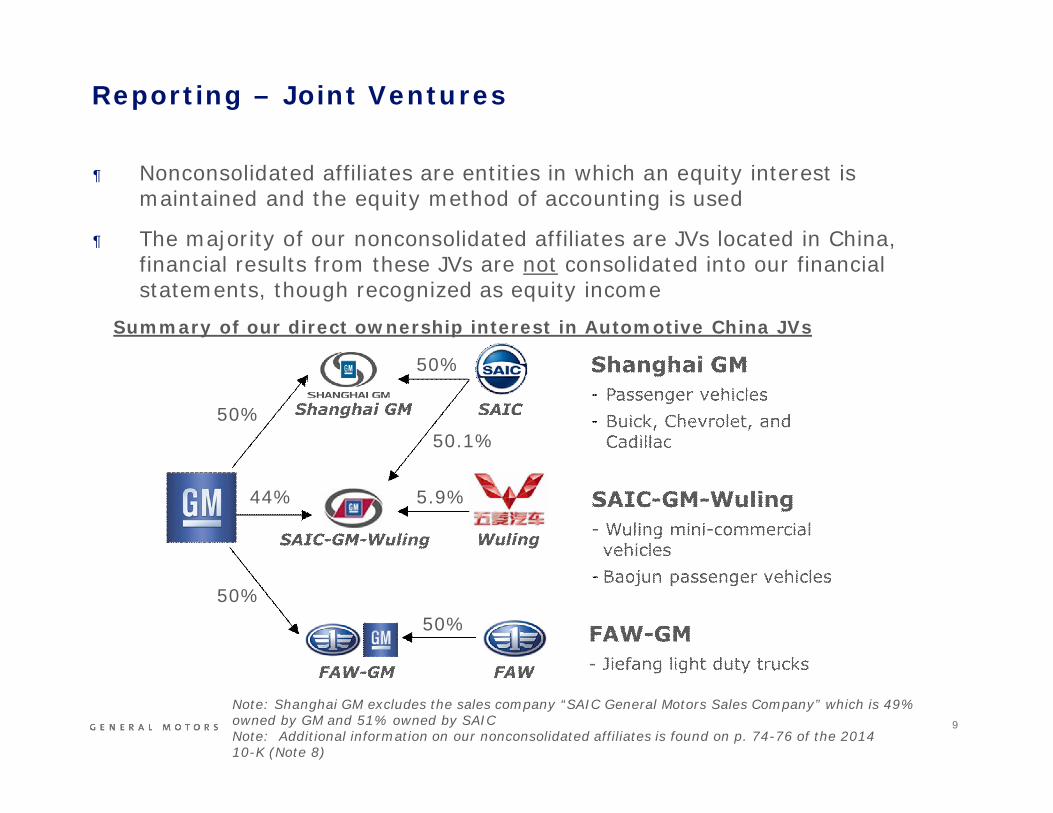
¶ Nonconsolidated affiliates are entities in which an equity interest ismaintained and the equity method of accounting is used
¶ The majority of our nonconsolidated affiliates are JVs located in China,financial results from these JVs are not consolidated into our financialstatements, though recognized as equity income
Summary of our direct ownership interest in Automotive China JVs
Note: Shanghai GM excludes the sales company “SAIC General Motors Sales Company” which is 49%owned by GM and 51% owned by SAICNote: Additional information on our nonconsolidated affiliates is found on p. 74-76 of the 201410-K (Note 8)
Reporting – Joint Ventures
50%
50%
44% 5.9%
50%
50%
50.1%
1 0
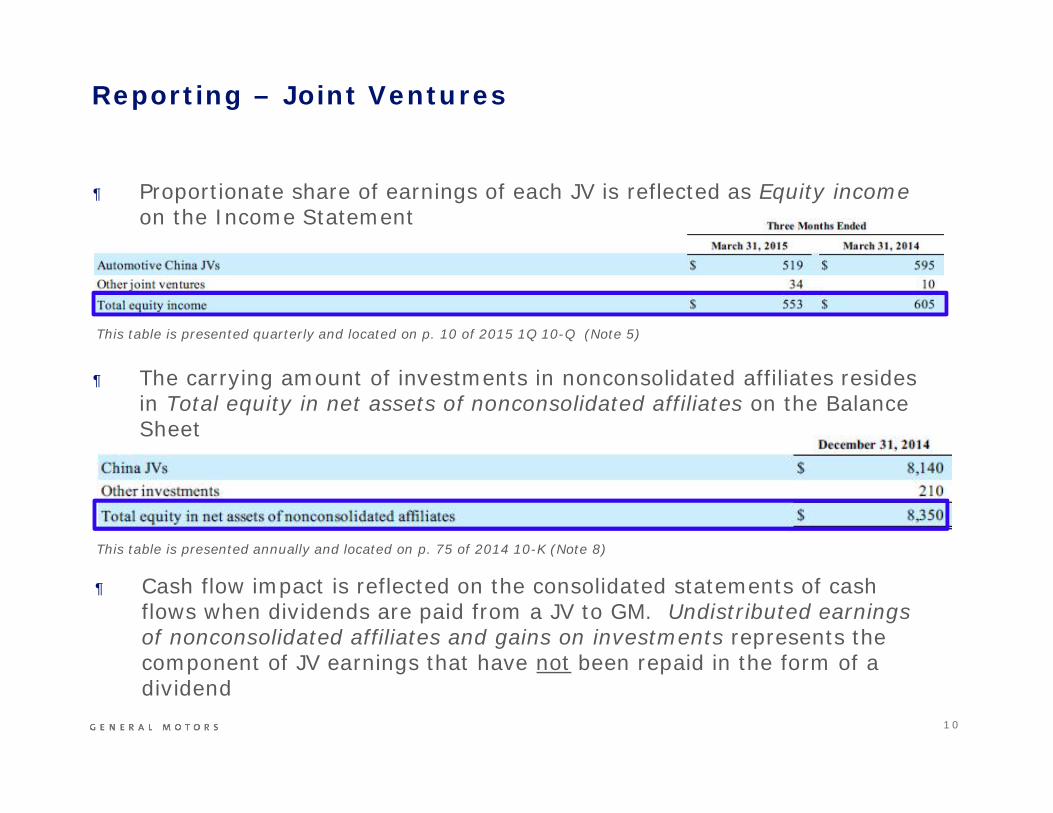
¶ Proportionate share of earnings of each JV is reflected as Equity incomeon the Income Statement
¶ The carrying amount of investments in nonconsolidated affiliates residesin Total equity in net assets of nonconsolidated affiliates on the BalanceSheet
This table is presented quarterly and located on p. 10 of 2015 1Q 10-Q (Note 5)
This table is presented annually and located on p. 75 of 2014 10-K (Note 8)
Reporting – Joint Ventures
¶ Cash flow impact is reflected on the consolidated statements of cashflows when dividends are paid from a JV to GM. Undistributed earningsof nonconsolidated affiliates and gains on investments represents thecomponent of JV earnings that have not been repaid in the form of adividend
1 1
¶ EBIT-Adjusted is our internal measure of profitability andrepresents earnings before interest and taxes, adjusted for“special items”
¶ A special item is defined as an event or transaction that isnot a part of the normal operating cycle of ongoingoperations
¶ EBIT-Adjusted is reconciled to our most relevant U.S.GAAP equivalent
¶ Useful to exclude special items to more accurately trackcore operational performance
– EBIT-Adjusted (non-GAAP) excludes special items
Reporting – Special Items: EBIT-Adjusted

1 2
Example SpecialItem? Example Special
Item?
Gain/loss on acquisition ordisposition of a business orinvestment
Routine restructuring activities(employee restructuring, employeeseparation costs, etc.)
Gain/loss on extinguishment ofdebt Routine impairment of PP&E
Certain impairments (investments,long lived assets, goodwill)
Impairments of special tooling(e.g. impairment associated with alow-performing vehicle line)
Costs associated with strategicshift in operations of the business(e.g. exiting a brand in a market)
Gain/loss on disposition of assets(e.g. machinery and equipment ortooling)
Settlement loss on pension plansarising from a discretemanagement action to derisk thepension plans
Routine policy and warrantyreserve adjustment, includinglarge recall campaign costs
Note: List is not intended to be all-inclusive, and subject to other considerations(for example, certain $ thresholds)
Special Items – Examples
1 3
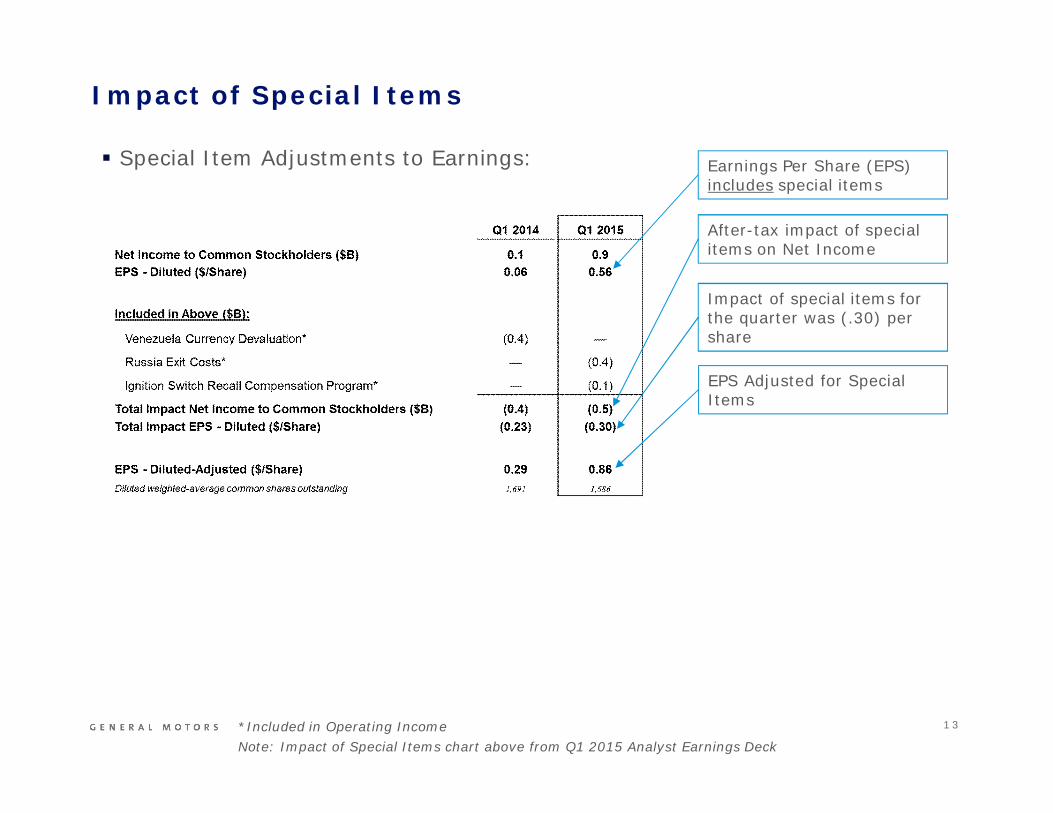
Earnings Per Share (EPS)includes special items
Impact of special items forthe quarter was (.30) pershare
After-tax impact of specialitems on Net Income
Impact of Special Items
EPS Adjusted for SpecialItems
*Included in Operating IncomeNote: Impact of Special Items chart above from Q1 2015 Analyst Earnings Deck
Special Item Adjustments to Earnings:
1 4
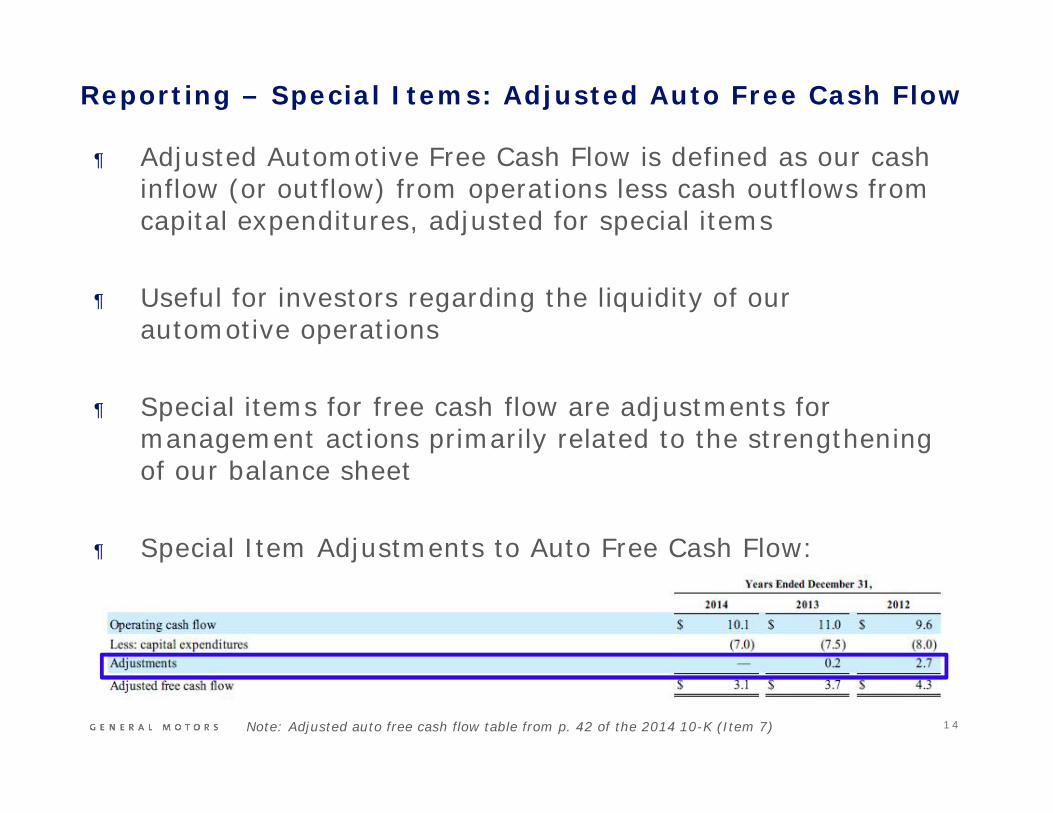
¶ Adjusted Automotive Free Cash Flow is defined as our cashinflow (or outflow) from operations less cash outflows fromcapital expenditures, adjusted for special items
¶ Useful for investors regarding the liquidity of ourautomotive operations
¶ Special items for free cash flow are adjustments formanagement actions primarily related to the strengtheningof our balance sheet
¶ Special Item Adjustments to Auto Free Cash Flow:
Reporting – Special Items: Adjusted Auto Free Cash Flow
Note: Adjusted auto free cash flow table from p. 42 of the 2014 10-K (Item 7)
1 5
Agenda
Reporting
Understanding the EBIT Bridge
Warranty & Recall Accounting
Taxes
Automotive Cash Flow Considerations
Appendix
1 6
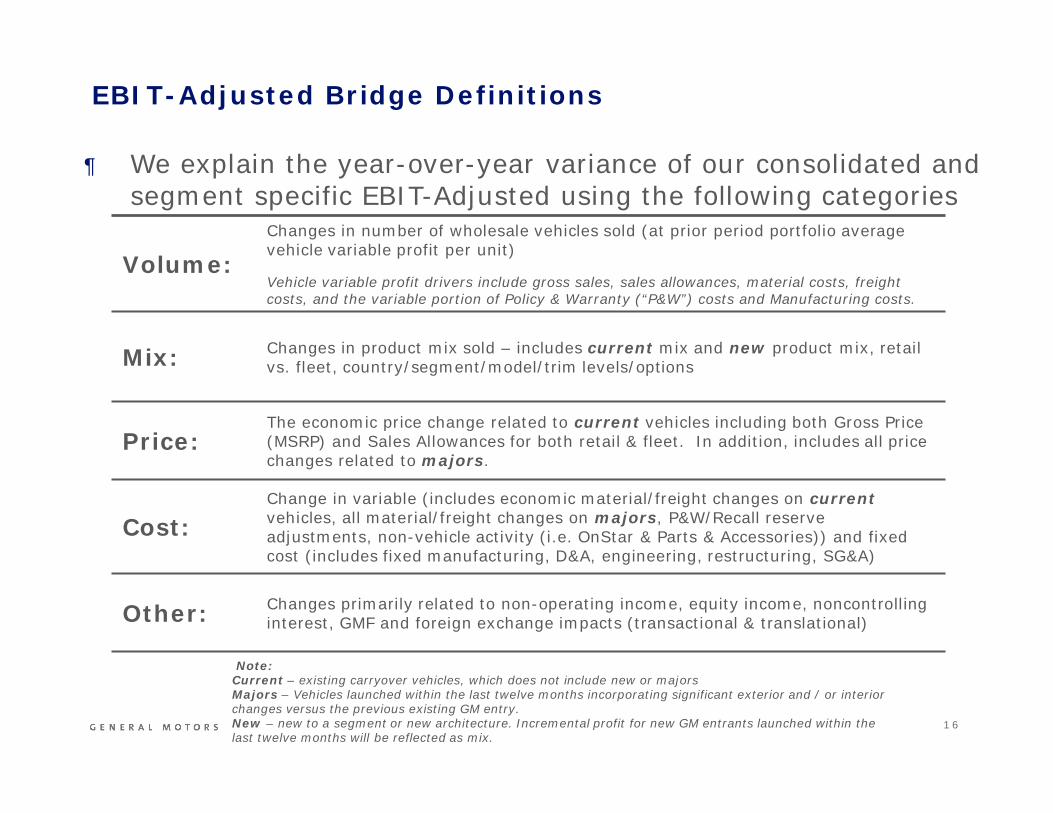
Volume:Changes in number of wholesale vehicles sold (at prior period portfolio averagevehicle variable profit per unit)
Vehicle variable profit drivers include gross sales, sales allowances, material costs, freightcosts, and the variable portion of Policy & Warranty (“P&W”) costs and Manufacturing costs.
Mix: Changes in product mix sold – includes current mix and new product mix, retailvs. fleet, country/segment/model/trim levels/options
Price:The economic price change related to current vehicles including both Gross Price(MSRP) and Sales Allowances for both retail & fleet. In addition, includes all pricechanges related to majors.
Cost:Change in variable (includes economic material/freight changes on currentvehicles, all material/freight changes on majors, P&W/Recall reserveadjustments, non-vehicle activity (i.e. OnStar & Parts & Accessories)) and fixedcost (includes fixed manufacturing, D&A, engineering, restructuring, SG&A)
Other: Changes primarily related to non-operating income, equity income, noncontrollinginterest, GMF and foreign exchange impacts (transactional & translational)
¶ We explain the year-over-year variance of our consolidated andsegment specific EBIT-Adjusted using the following categories
Note:Current – existing carryover vehicles, which does not include new or majorsMajors – Vehicles launched within the last twelve months incorporating significant exterior and / or interiorchanges versus the previous existing GM entry.New – new to a segment or new architecture. Incremental profit for new GM entrants launched within thelast twelve months will be reflected as mix.
EBIT-Adjusted Bridge Definitions
1 7
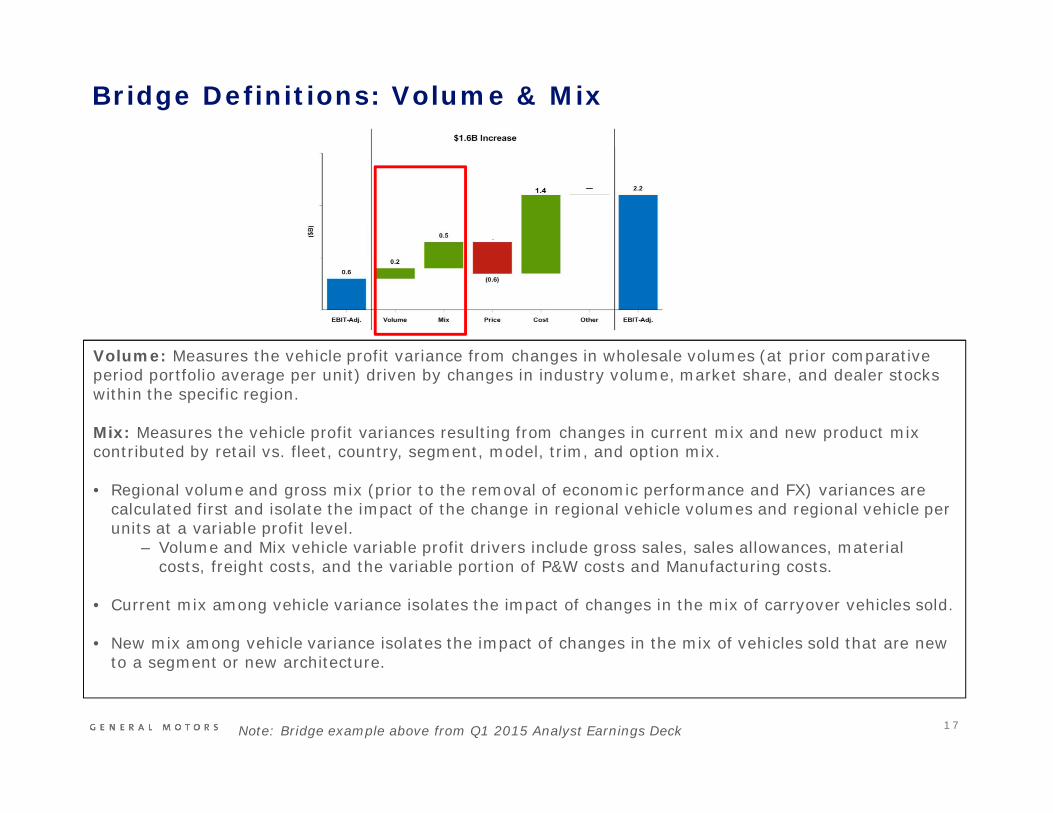
Volume: Measures the vehicle profit variance from changes in wholesale volumes (at prior comparativeperiod portfolio average per unit) driven by changes in industry volume, market share, and dealer stockswithin the specific region.
Mix: Measures the vehicle profit variances resulting from changes in current mix and new product mixcontributed by retail vs. fleet, country, segment, model, trim, and option mix.
• Regional volume and gross mix (prior to the removal of economic performance and FX) variances arecalculated first and isolate the impact of the change in regional vehicle volumes and regional vehicle perunits at a variable profit level.
Volume and Mix vehicle variable profit drivers include gross sales, sales allowances, materialcosts, freight costs, and the variable portion of P&W costs and Manufacturing costs.
• Current mix among vehicle variance isolates the impact of changes in the mix of carryover vehicles sold.
• New mix among vehicle variance isolates the impact of changes in the mix of vehicles sold that are newto a segment or new architecture.
Bridge Definitions: Volume & Mix
Note: Bridge example above from Q1 2015 Analyst Earnings Deck
1 8
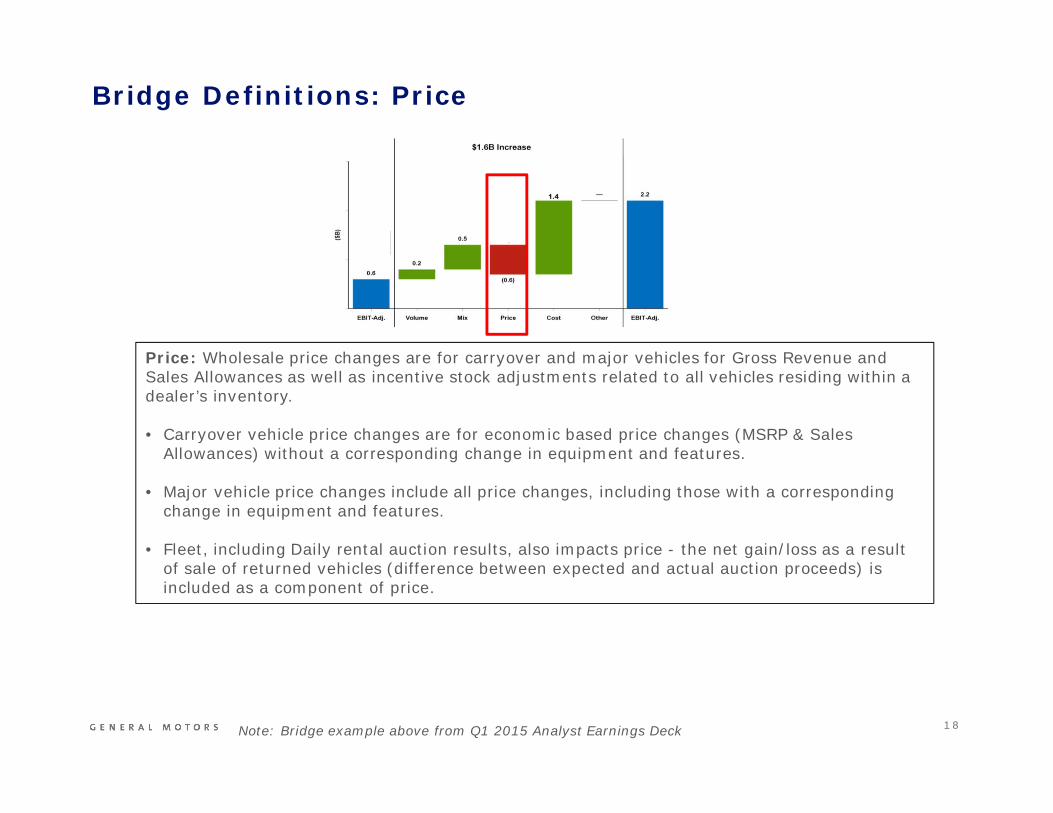
Price: Wholesale price changes are for carryover and major vehicles for Gross Revenue andSales Allowances as well as incentive stock adjustments related to all vehicles residing within adealer’s inventory.
• Carryover vehicle price changes are for economic based price changes (MSRP & SalesAllowances) without a corresponding change in equipment and features.
• Major vehicle price changes include all price changes, including those with a correspondingchange in equipment and features.
• Fleet, including Daily rental auction results, also impacts price - the net gain/loss as a resultof sale of returned vehicles (difference between expected and actual auction proceeds) isincluded as a component of price.
Bridge Definitions: Price
Note: Bridge example above from Q1 2015 Analyst Earnings Deck
1 9
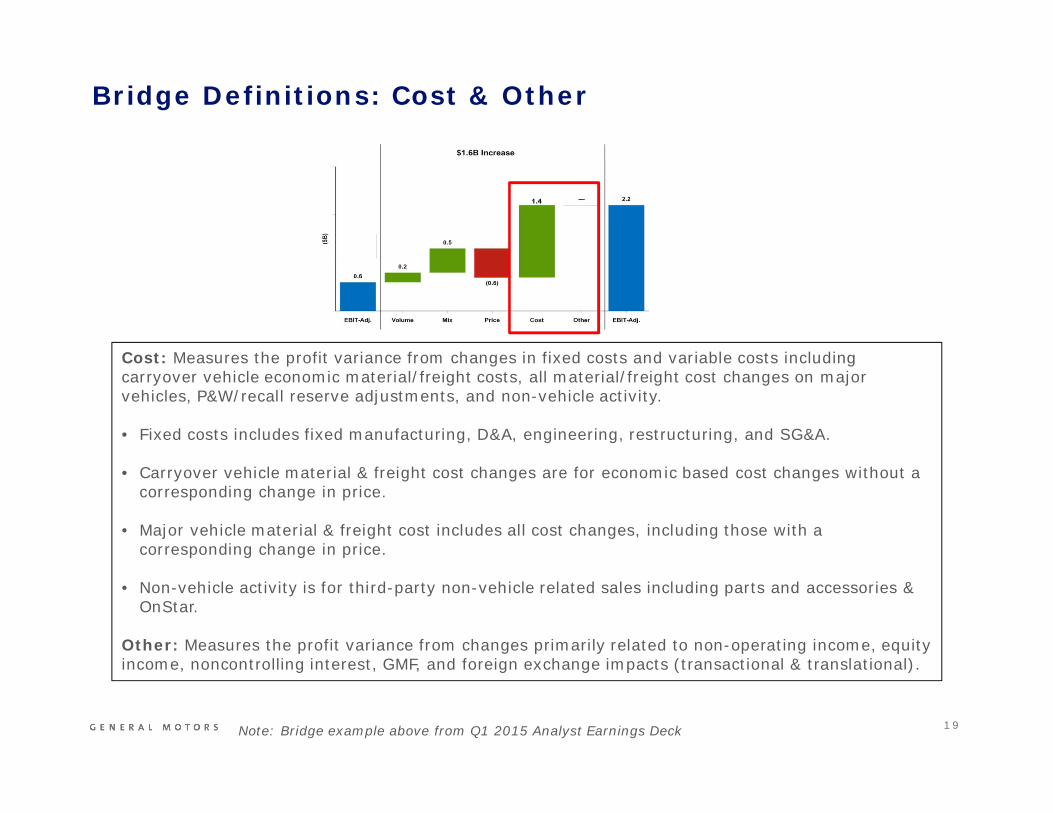
Cost: Measures the profit variance from changes in fixed costs and variable costs includingcarryover vehicle economic material/freight costs, all material/freight cost changes on majorvehicles, P&W/recall reserve adjustments, and non-vehicle activity.
• Fixed costs includes fixed manufacturing, D&A, engineering, restructuring, and SG&A.
• Carryover vehicle material & freight cost changes are for economic based cost changes without acorresponding change in price.
• Major vehicle material & freight cost includes all cost changes, including those with acorresponding change in price.
• Non-vehicle activity is for third-party non-vehicle related sales including parts and accessories &OnStar.
Other: Measures the profit variance from changes primarily related to non-operating income, equityincome, noncontrolling interest, GMF, and foreign exchange impacts (transactional & translational).
Bridge Definitions: Cost & Other
Note: Bridge example above from Q1 2015 Analyst Earnings Deck
2 0Note: EBIT- Adjusted includes GM Financial on an Earnings Before Tax - Adjusted (EBT-Adjusted) basis
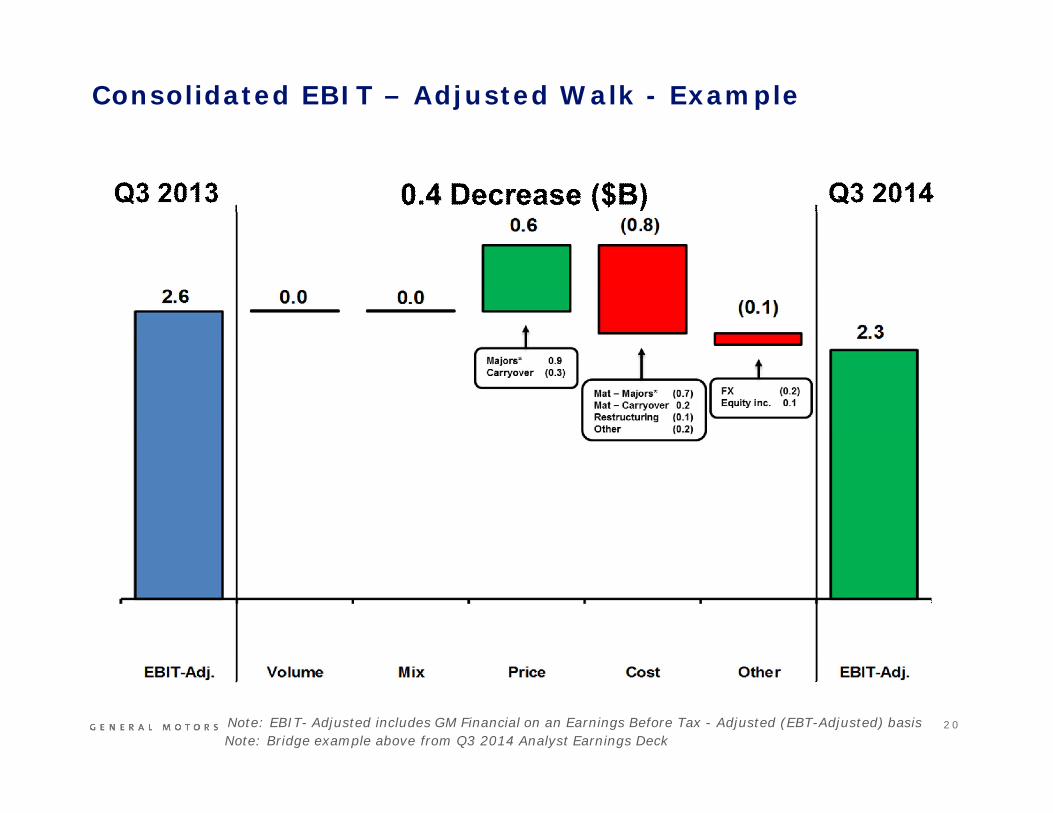
Consolidated EBIT – Adjusted Walk - Example
Note: Bridge example above from Q3 2014 Analyst Earnings Deck
2 1
Agenda
Reporting
Understanding the EBIT Bridge
Warranty & Recall Accounting
Taxes
Automotive Cash Flow Considerations
Appendix
2 2
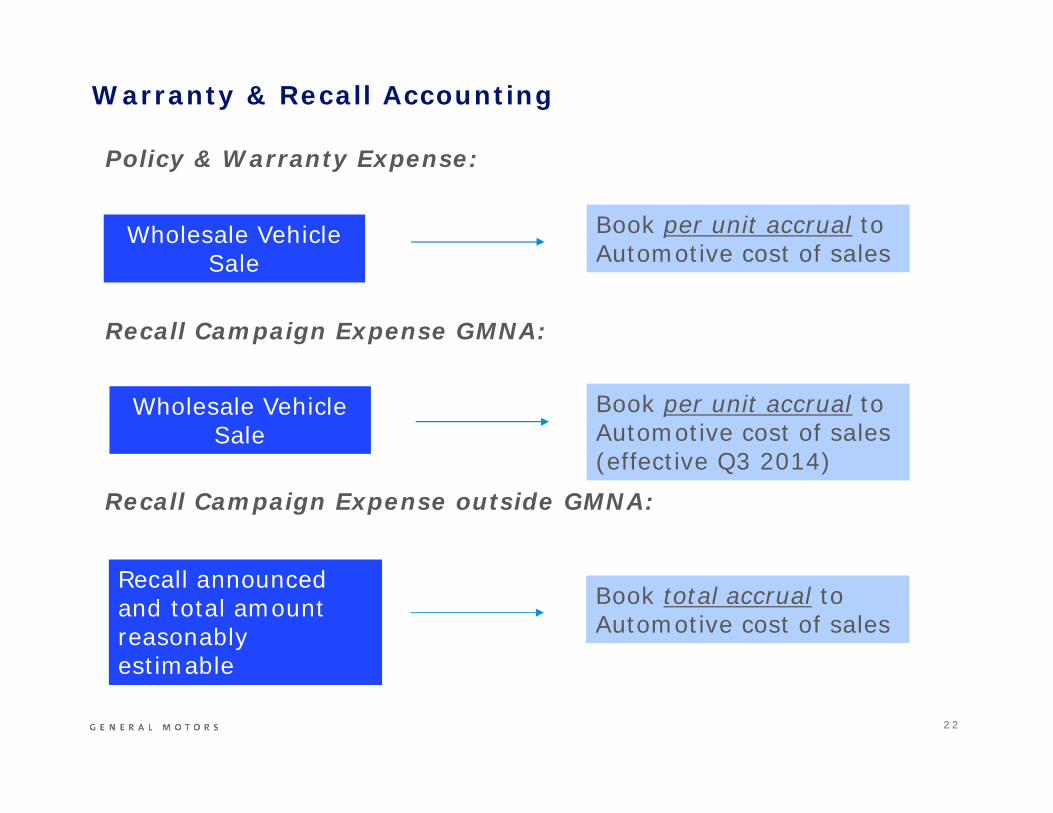
Wholesale VehicleSale
Book per unit accrual toAutomotive cost of sales
Policy & Warranty Expense:
Recall Campaign Expense GMNA:
Recall Campaign Expense outside GMNA:
Recall announcedand total amountreasonablyestimable
Book total accrual toAutomotive cost of sales
Wholesale VehicleSale
Book per unit accrual toAutomotive cost of sales(effective Q3 2014)
Warranty & Recall Accounting
2 3
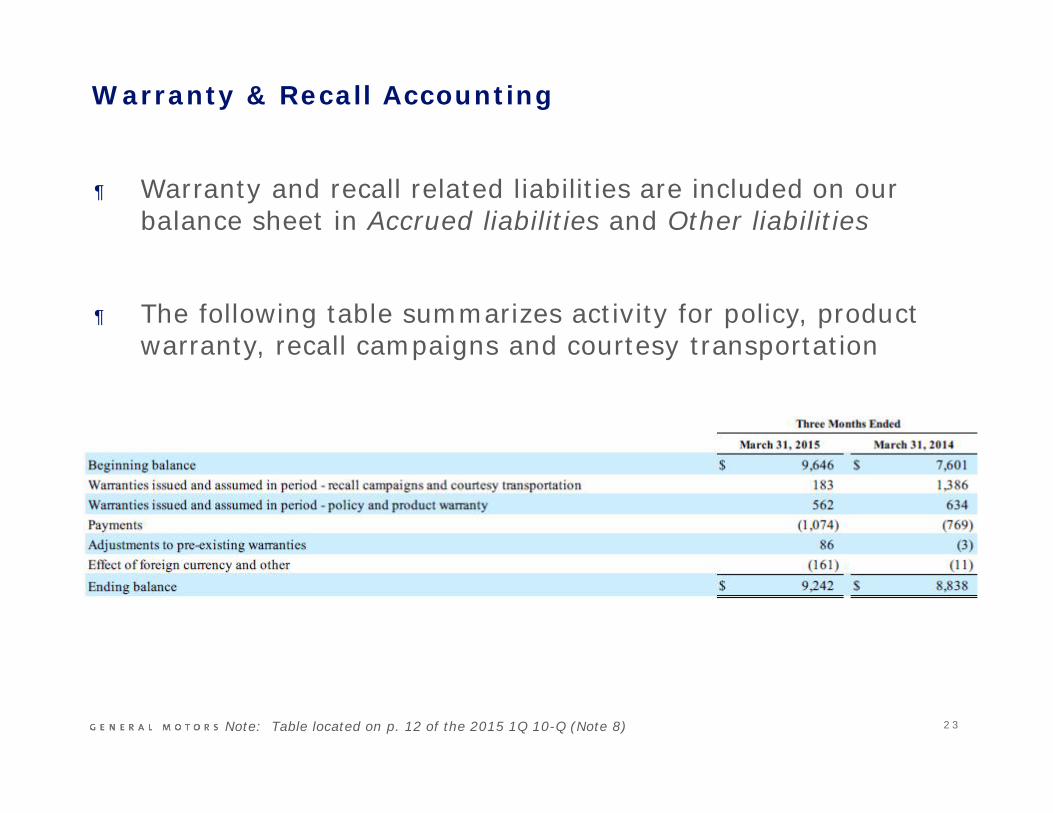
¶ Warranty and recall related liabilities are included on ourbalance sheet in Accrued liabilities and Other liabilities
¶ The following table summarizes activity for policy, productwarranty, recall campaigns and courtesy transportation
Note: Table located on p. 12 of the 2015 1Q 10-Q (Note 8)
Warranty & Recall Accounting

2 4
Agenda
Reporting
Understanding the EBIT Bridge
Warranty & Recall Accounting
Taxes
Automotive Cash Flow Considerations
Appendix
2 5
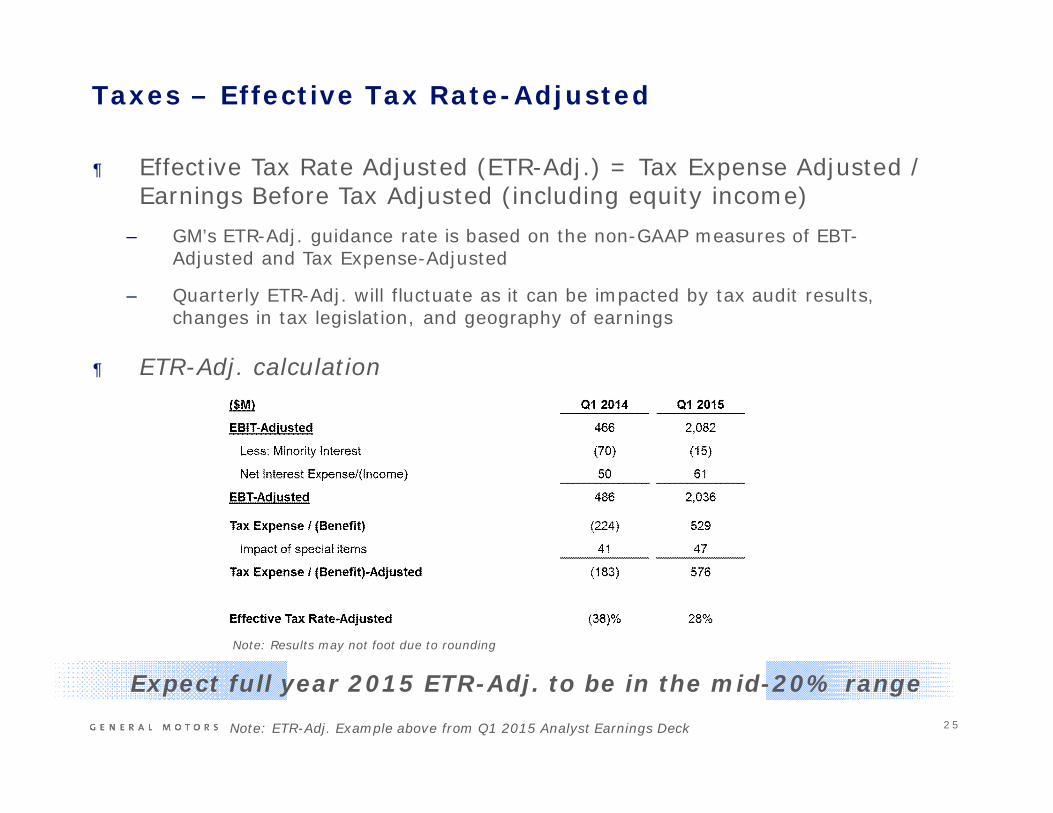
¶ Effective Tax Rate Adjusted (ETR-Adj.) = Tax Expense Adjusted /Earnings Before Tax Adjusted (including equity income)
– GM’s ETR-Adj. guidance rate is based on the non-GAAP measures of EBT-Adjusted and Tax Expense-Adjusted
– Quarterly ETR-Adj. will fluctuate as it can be impacted by tax audit results,changes in tax legislation, and geography of earnings
¶ ETR-Adj. calculation
Taxes – Effective Tax Rate-Adjusted
Note: Results may not foot due to rounding
Expect full year 2015 ETR-Adj. to be in the mid-20% range
Note: ETR-Adj. Example above from Q1 2015 Analyst Earnings Deck
2 6
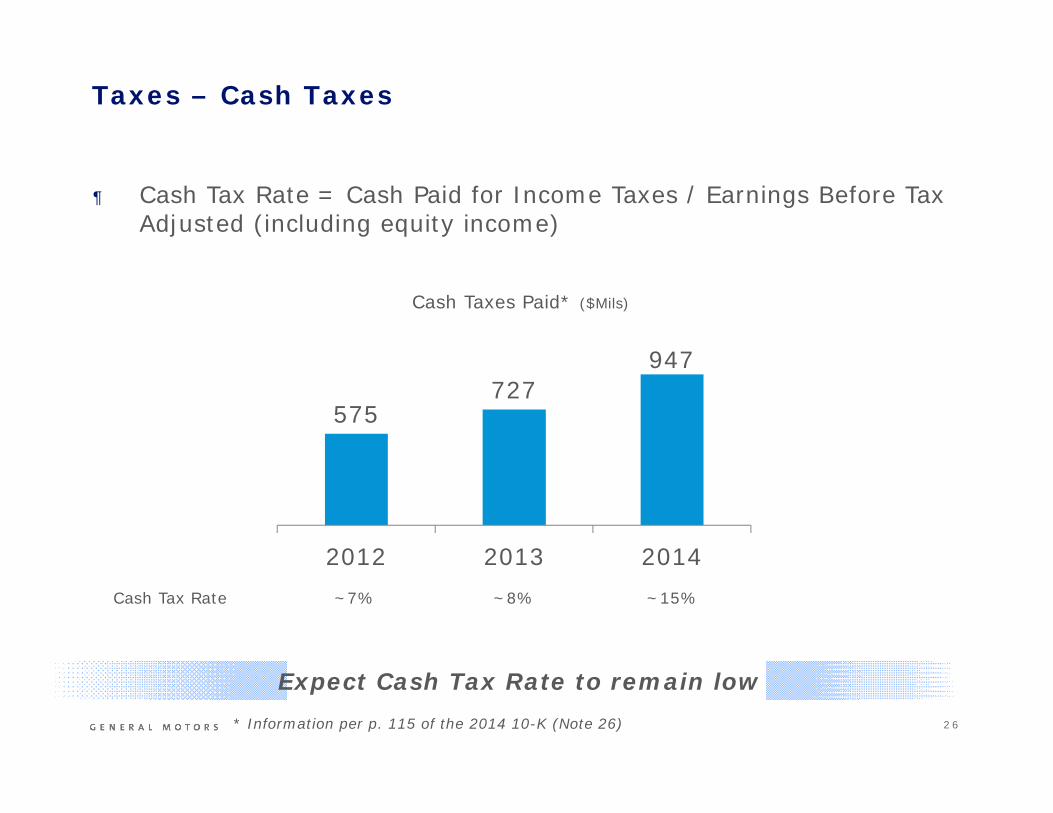
¶ Cash Tax Rate = Cash Paid for Income Taxes / Earnings Before TaxAdjusted (including equity income)
Taxes – Cash Taxes
Expect Cash Tax Rate to remain low
575727
947
2012 2013 2014
Cash Taxes Paid* ($Mils)
Cash Tax Rate ~7% ~8% ~15%
* Information per p. 115 of the 2014 10-K (Note 26)
2 7
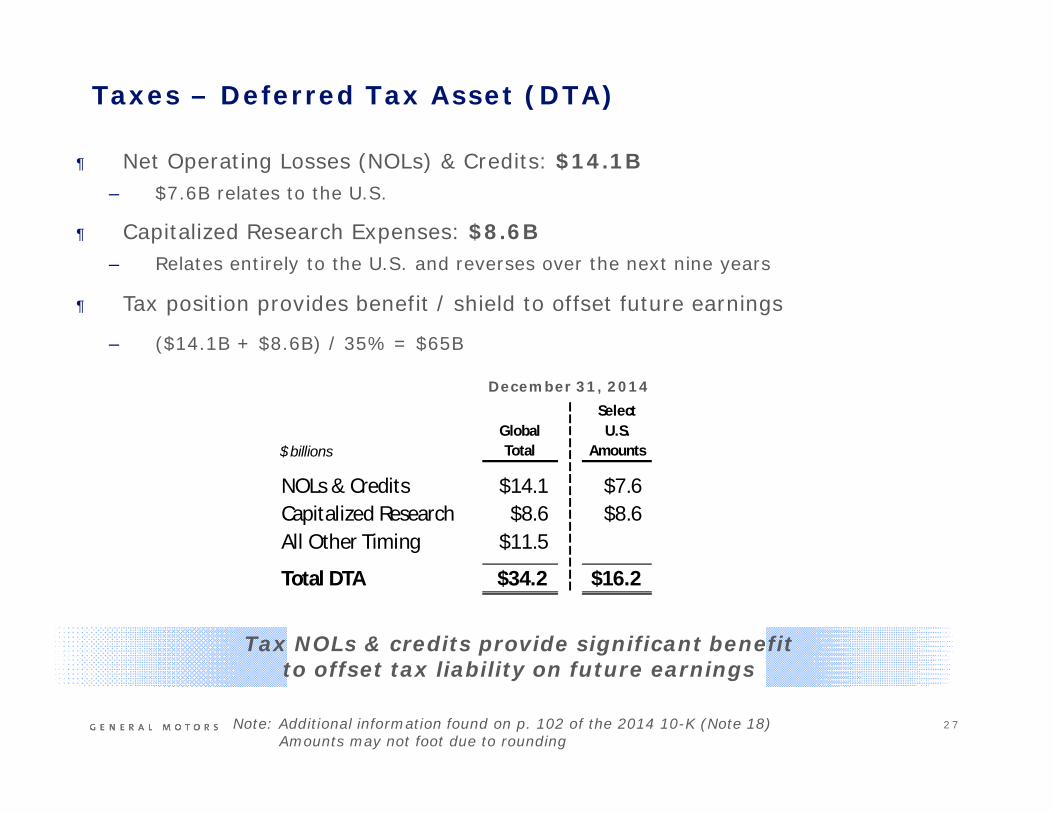
¶ Net Operating Losses (NOLs) & Credits: $14.1B– $7.6B relates to the U.S.
¶ Capitalized Research Expenses: $8.6B– Relates entirely to the U.S. and reverses over the next nine years
¶ Tax position provides benefit / shield to offset future earnings
– ($14.1B + $8.6B) / 35% = $65B
Taxes – Deferred Tax Asset (DTA)
Tax NOLs & credits provide significant benefitto offset tax liability on future earnings
December 31, 2014
Note: Additional information found on p. 102 of the 2014 10-K (Note 18)Amounts may not foot due to rounding
$ billionsGlobalTotal
SelectU.S.
Amounts
NOLs & Credits $14.1 $7.6Capitalized Research $8.6 $8.6All Other Timing $11.5
Total DTA $34.2 $16.2
2 8
¶ European businesses had deferred tax asset valuation allowances of$4.4B as of March 31, 2015
– Based on improving business results in Europe, significant portions of the valuationallowances may be reversed
– In the quarter in which the valuation allowances are reversed, we will record asignificant tax benefit in the income statement which will be treated as a special item
¶ Cash taxes in Europe will continue to remain low as we utilize losses fromprior periods to offset current tax
Taxes – Valuation Allowances
2 9
Agenda
Reporting
Understanding the EBIT Bridge
Warranty & Recall Accounting
Taxes
Automotive Cash Flow Considerations
Appendix

3 0* Excludes impact of non-cash special items
Adjusted Automotive Free Cash Flow – Example
Equipment on operating leasesis composed of vehicle sales todaily rental car companies witha guaranteed repurchaseobligation
Comprised of dealer/customerallowances, deposits fromrental car companies, employeebenefits, policy & warranty,and other accruals & otherliabilities
Provisions for deferred taxesand current taxes payable
Equity income earned but notyet received as dividends(e.g.China JVs)
Note: Adjusted Automotive Free Cash Flow Example above from Q1 2015 Analyst Earnings Deck
3 1
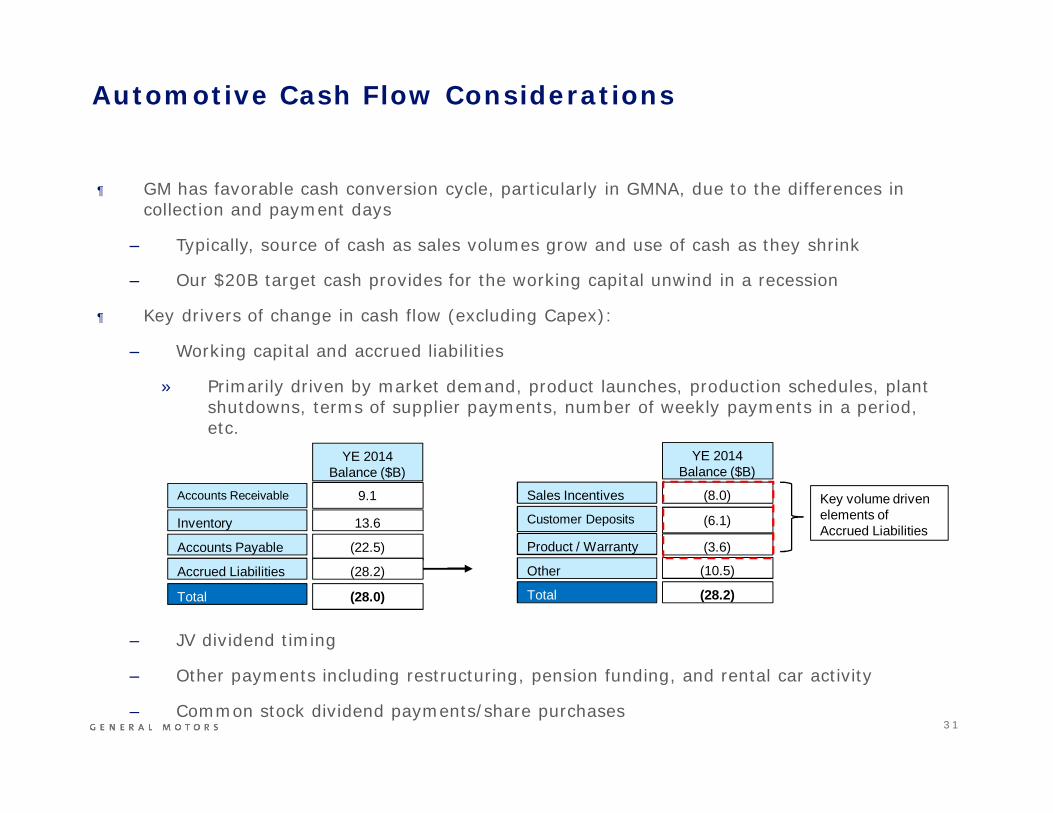
¶ GM has favorable cash conversion cycle, particularly in GMNA, due to the differences incollection and payment days
– Typically, source of cash as sales volumes grow and use of cash as they shrink
– Our $20B target cash provides for the working capital unwind in a recession
¶ Key drivers of change in cash flow (excluding Capex):
– Working capital and accrued liabilities
» Primarily driven by market demand, product launches, production schedules, plantshutdowns, terms of supplier payments, number of weekly payments in a period,etc.
– JV dividend timing
– Other payments including restructuring, pension funding, and rental car activity
– Common stock dividend payments/share purchases
Automotive Cash Flow Considerations
Accounts Receivable
Inventory
Accounts Payable
Accrued Liabilities
9.1
13.6
(22.5)
(28.2)
YE 2014Balance ($B)
Total (28.0)
Sales Incentives
Customer Deposits
Product / Warranty
Other
(8.0)
(6.1)
(3.6)
(10.5)
YE 2014Balance ($B)
Total (28.2)
Key volume drivenelements ofAccrued Liabilities

3 2
Q&A
3 3
Appendix
Understanding the Earnings Deck & Key Performance Metrics
Income Statement Considerations
Balance Sheet Considerations
Capital Allocation Framework
GM Financial
3 4
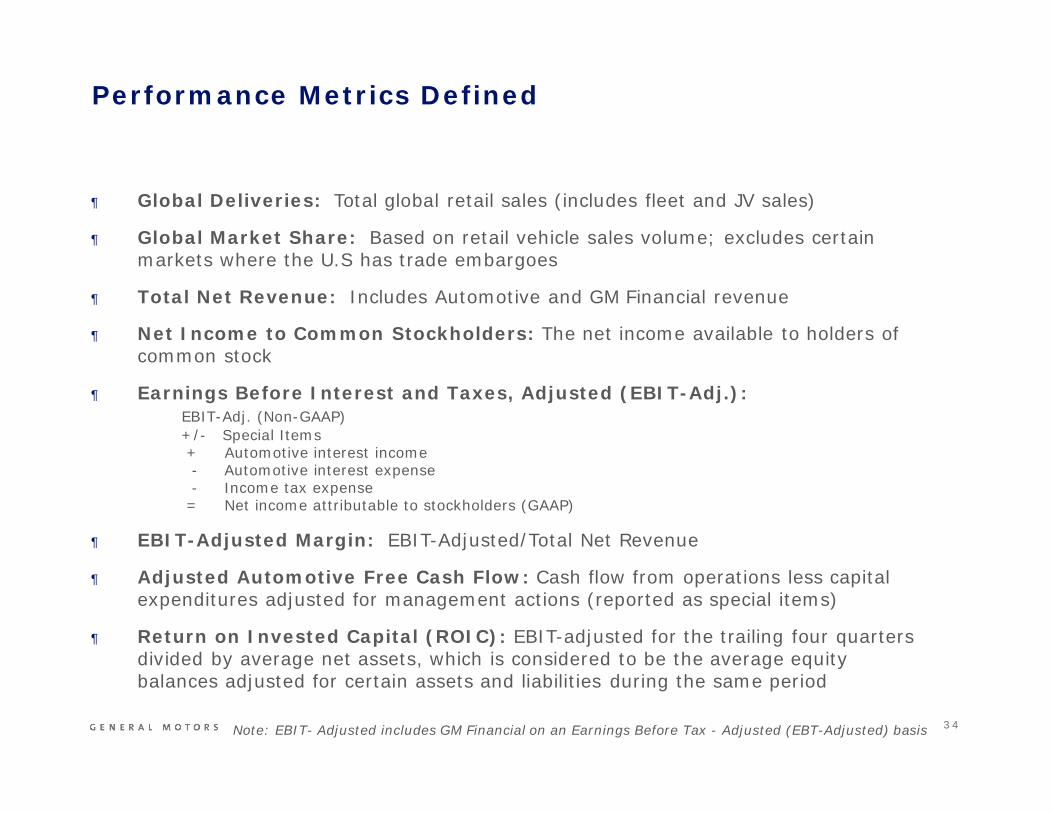
¶ Global Deliveries: Total global retail sales (includes fleet and JV sales)
¶ Global Market Share: Based on retail vehicle sales volume; excludes certainmarkets where the U.S has trade embargoes
¶ Total Net Revenue: Includes Automotive and GM Financial revenue
¶ Net Income to Common Stockholders: The net income available to holders ofcommon stock
¶ Earnings Before Interest and Taxes, Adjusted (EBIT-Adj.):EBIT-Adj. (Non-GAAP)+/- Special Items+ Automotive interest income- Automotive interest expense- Income tax expense= Net income attributable to stockholders (GAAP)
¶ EBIT-Adjusted Margin: EBIT-Adjusted/Total Net Revenue
¶ Adjusted Automotive Free Cash Flow: Cash flow from operations less capitalexpenditures adjusted for management actions (reported as special items)
¶ Return on Invested Capital (ROIC): EBIT-adjusted for the trailing four quartersdivided by average net assets, which is considered to be the average equitybalances adjusted for certain assets and liabilities during the same period
Note: EBIT- Adjusted includes GM Financial on an Earnings Before Tax - Adjusted (EBT-Adjusted) basis
Performance Metrics Defined
3 5
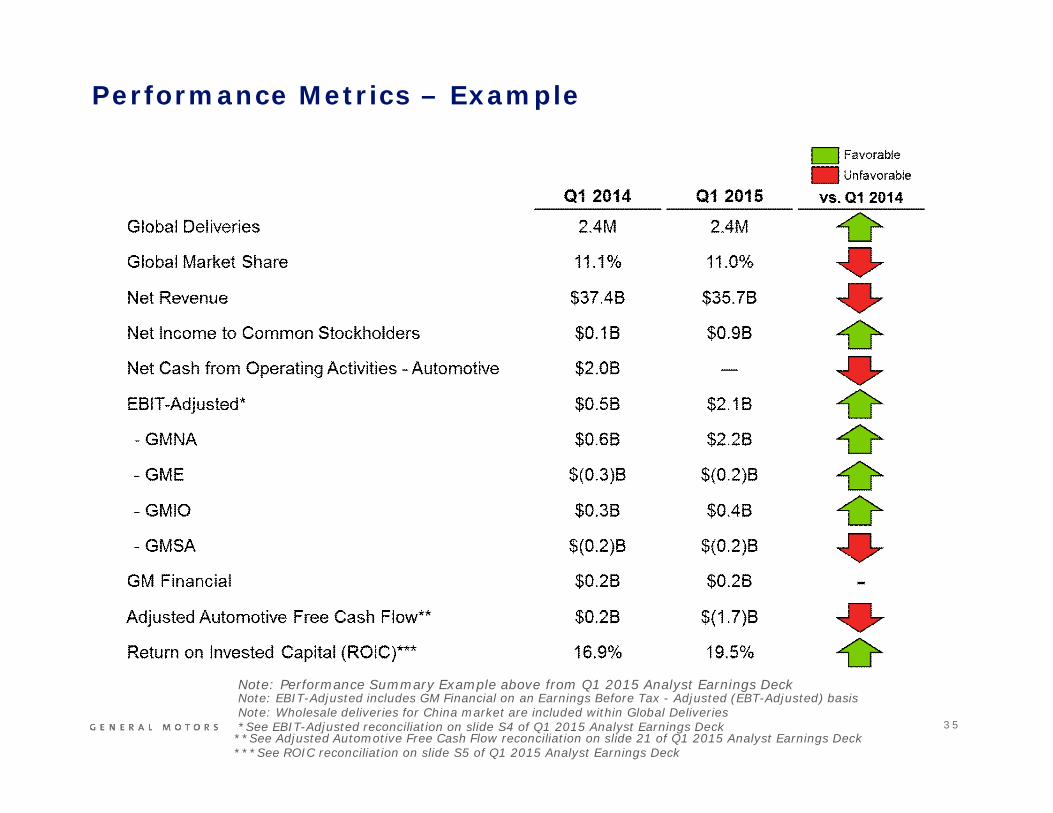
Performance Metrics – Example
**See Adjusted Automotive Free Cash Flow reconciliation on slide 21 of Q1 2015 Analyst Earnings Deck***See ROIC reconciliation on slide S5 of Q1 2015 Analyst Earnings Deck
Note: EBIT-Adjusted includes GM Financial on an Earnings Before Tax - Adjusted (EBT-Adjusted) basisNote: Wholesale deliveries for China market are included within Global Deliveries*See EBIT-Adjusted reconciliation on slide S4 of Q1 2015 Analyst Earnings Deck
Note: Performance Summary Example above from Q1 2015 Analyst Earnings Deck
3 6
Appendix
Understanding the Earnings Deck & Key Performance Metrics
Income Statement Considerations
Balance Sheet Considerations
Capital Allocation Framework
GM Financial
3 7
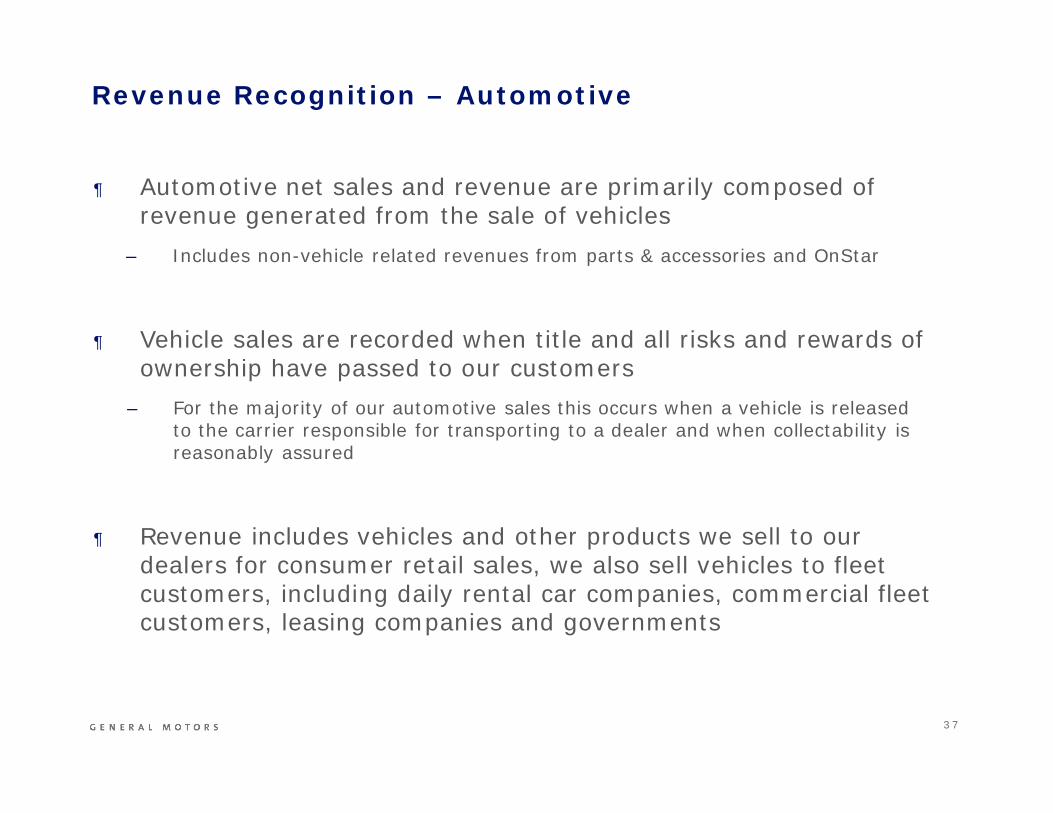
Revenue Recognition – Automotive
¶ Automotive net sales and revenue are primarily composed ofrevenue generated from the sale of vehicles
– Includes non-vehicle related revenues from parts & accessories and OnStar
¶ Vehicle sales are recorded when title and all risks and rewards ofownership have passed to our customers
– For the majority of our automotive sales this occurs when a vehicle is releasedto the carrier responsible for transporting to a dealer and when collectability isreasonably assured
¶ Revenue includes vehicles and other products we sell to ourdealers for consumer retail sales, we also sell vehicles to fleetcustomers, including daily rental car companies, commercial fleetcustomers, leasing companies and governments
3 8
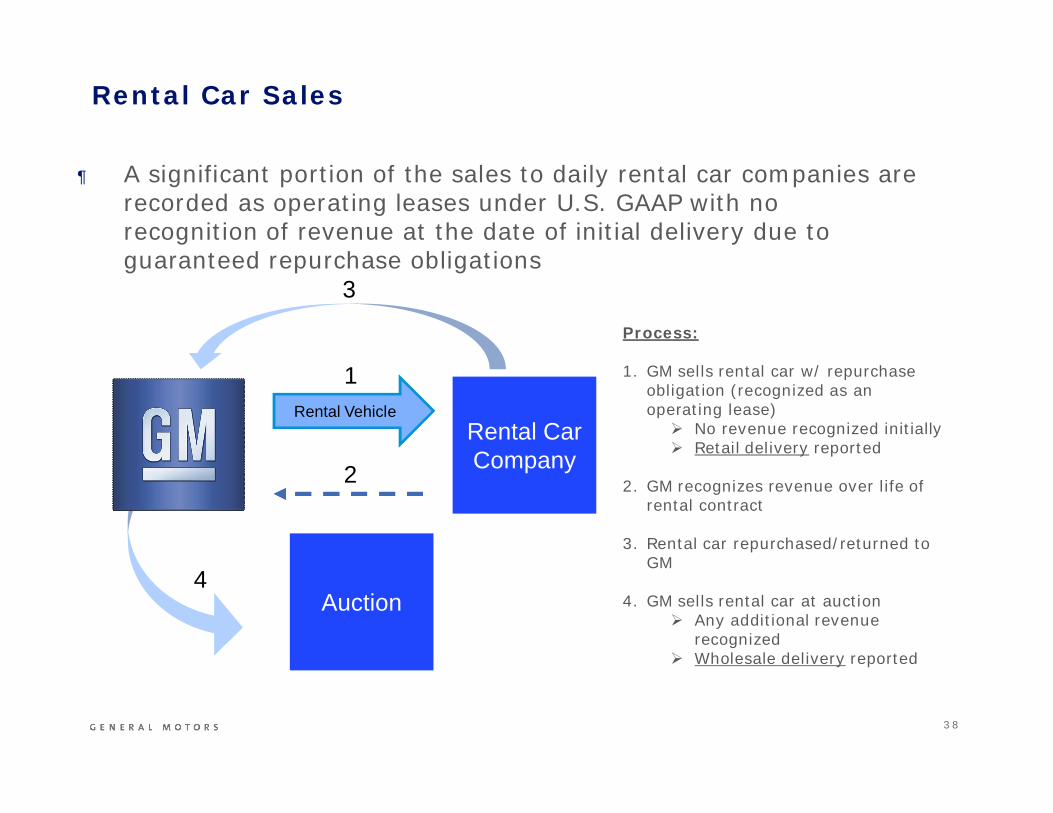
¶ A significant portion of the sales to daily rental car companies arerecorded as operating leases under U.S. GAAP with norecognition of revenue at the date of initial delivery due toguaranteed repurchase obligations
Rental CarCompany
Rental Vehicle
Auction
1
3
4
Process:
1. GM sells rental car w/ repurchaseobligation (recognized as anoperating lease)
No revenue recognized initiallyRetail delivery reported
2. GM recognizes revenue over life ofrental contract
3. Rental car repurchased/returned toGM
4. GM sells rental car at auctionAny additional revenuerecognizedWholesale delivery reported
2
Rental Car Sales
3 9
At conclusion of agreement and/or vehicle return
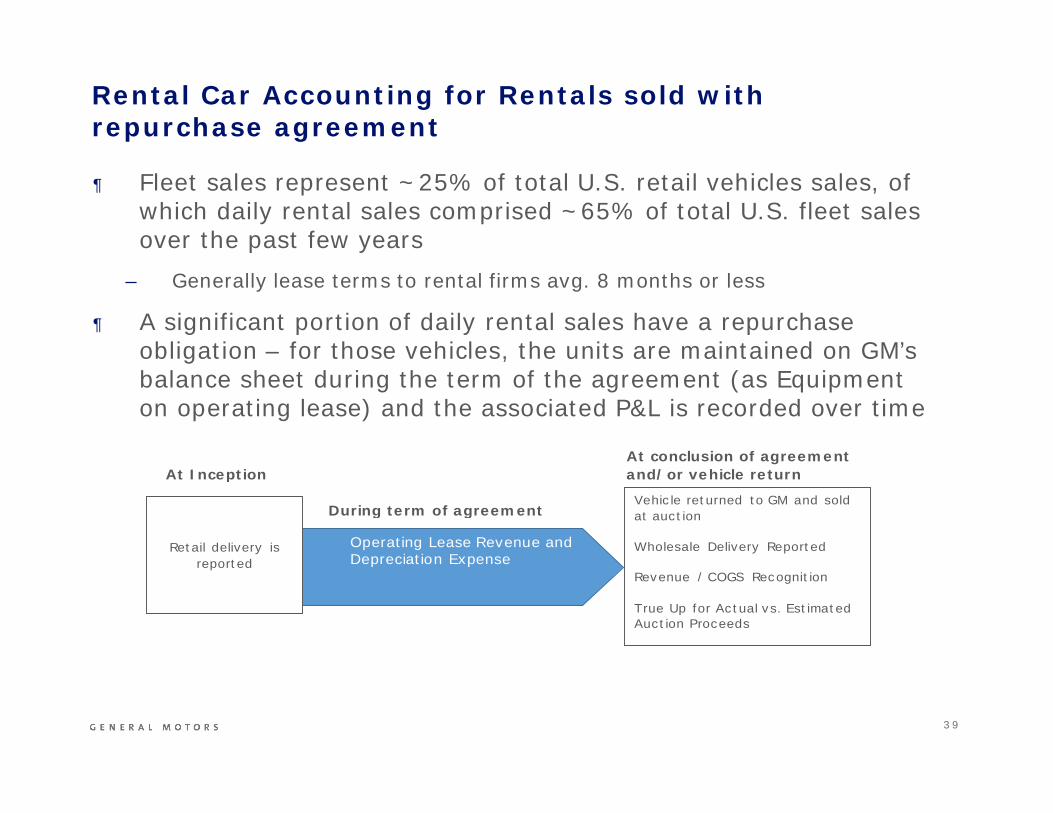
During term of agreement
At Inception
Operating Lease Revenue andDepreciation Expense
Recognized
Retail delivery isreported
Vehicle returned to GM and soldat auction
Wholesale Delivery Reported
Revenue / COGS Recognition
True Up for Actual vs. EstimatedAuction Proceeds
¶ Fleet sales represent ~25% of total U.S. retail vehicles sales, ofwhich daily rental sales comprised ~65% of total U.S. fleet salesover the past few years
– Generally lease terms to rental firms avg. 8 months or less
¶ A significant portion of daily rental sales have a repurchaseobligation – for those vehicles, the units are maintained on GM’sbalance sheet during the term of the agreement (as Equipmenton operating lease) and the associated P&L is recorded over time
Rental Car Accounting for Rentals sold withrepurchase agreement
4 0
Rental Car Accounting for Rentals sold withrepurchase agreement
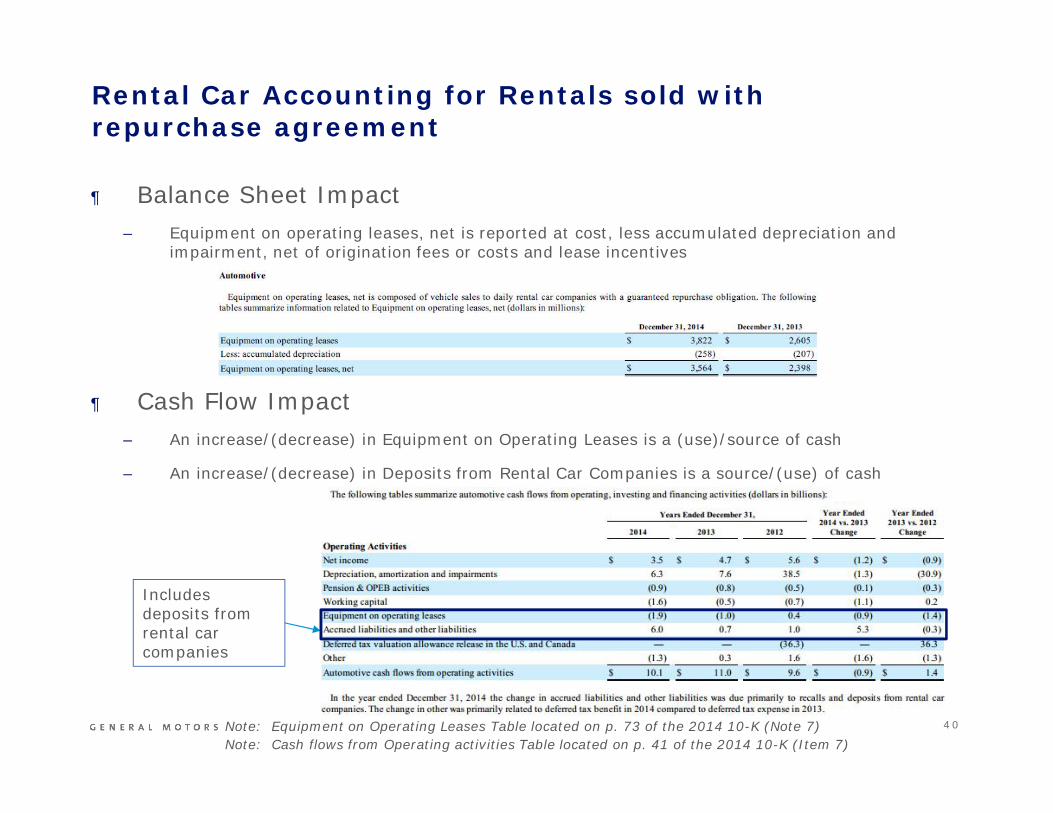
Note: Equipment on Operating Leases Table located on p. 73 of the 2014 10-K (Note 7)
Includesdeposits fromrental carcompanies
Note: Cash flows from Operating activities Table located on p. 41 of the 2014 10-K (Item 7)
¶ Balance Sheet Impact– Equipment on operating leases, net is reported at cost, less accumulated depreciation and
impairment, net of origination fees or costs and lease incentives
¶ Cash Flow Impact– An increase/(decrease) in Equipment on Operating Leases is a (use)/source of cash
– An increase/(decrease) in Deposits from Rental Car Companies is a source/(use) of cash
4 1
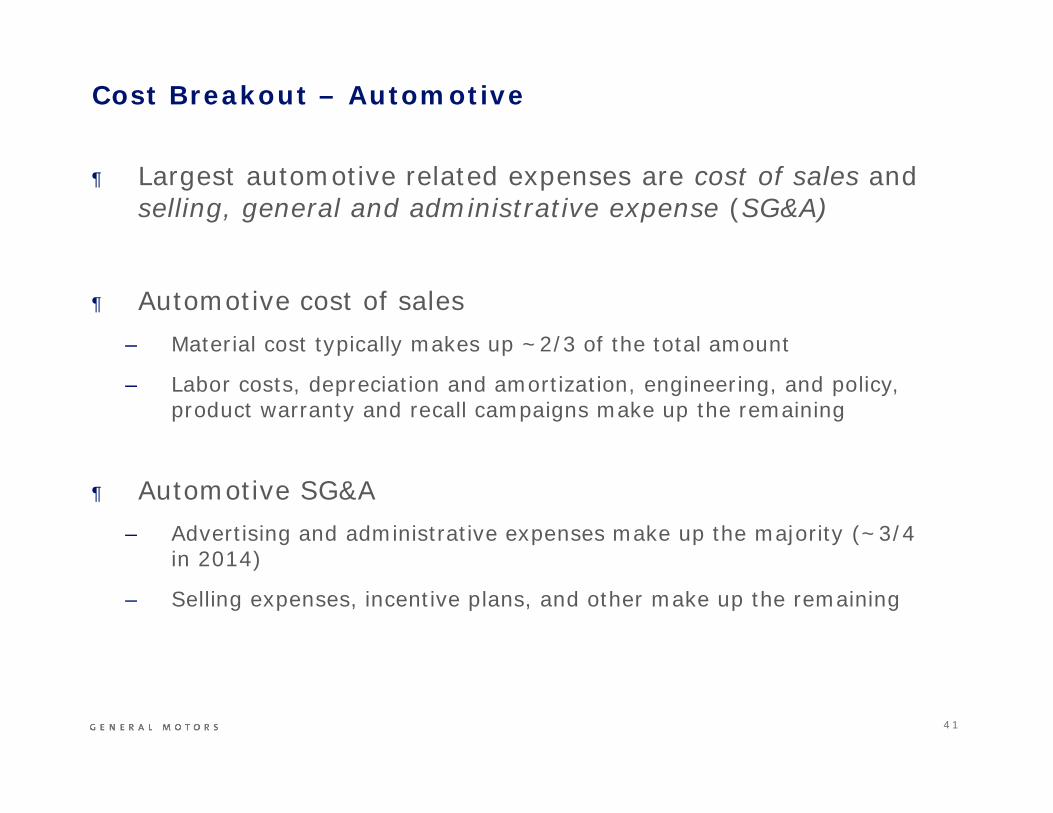
¶ Largest automotive related expenses are cost of sales andselling, general and administrative expense (SG&A)
¶ Automotive cost of sales– Material cost typically makes up ~2/3 of the total amount
– Labor costs, depreciation and amortization, engineering, and policy,product warranty and recall campaigns make up the remaining
¶ Automotive SG&A– Advertising and administrative expenses make up the majority (~3/4
in 2014)
– Selling expenses, incentive plans, and other make up the remaining
Cost Breakout – Automotive

4 2
Appendix
Understanding the Earnings Deck & Key Performance Metrics
Income Statement Considerations
Balance Sheet Considerations
Capital Allocation Framework
GM Financial

4 3
Key Automotive Balance Sheet Items
(1) Excludes uncommitted facilities(2) March 31, 2014 and 2015 balances are rolled forward and do not reflect remeasurement(3) Non-U.S. represents GM Automotive Only. Excludes $0.1B GMF Pension liabilityNote: Key Automotive Balance Sheet Items Example above from Q1 2015 Analyst Earnings Deck
4 4
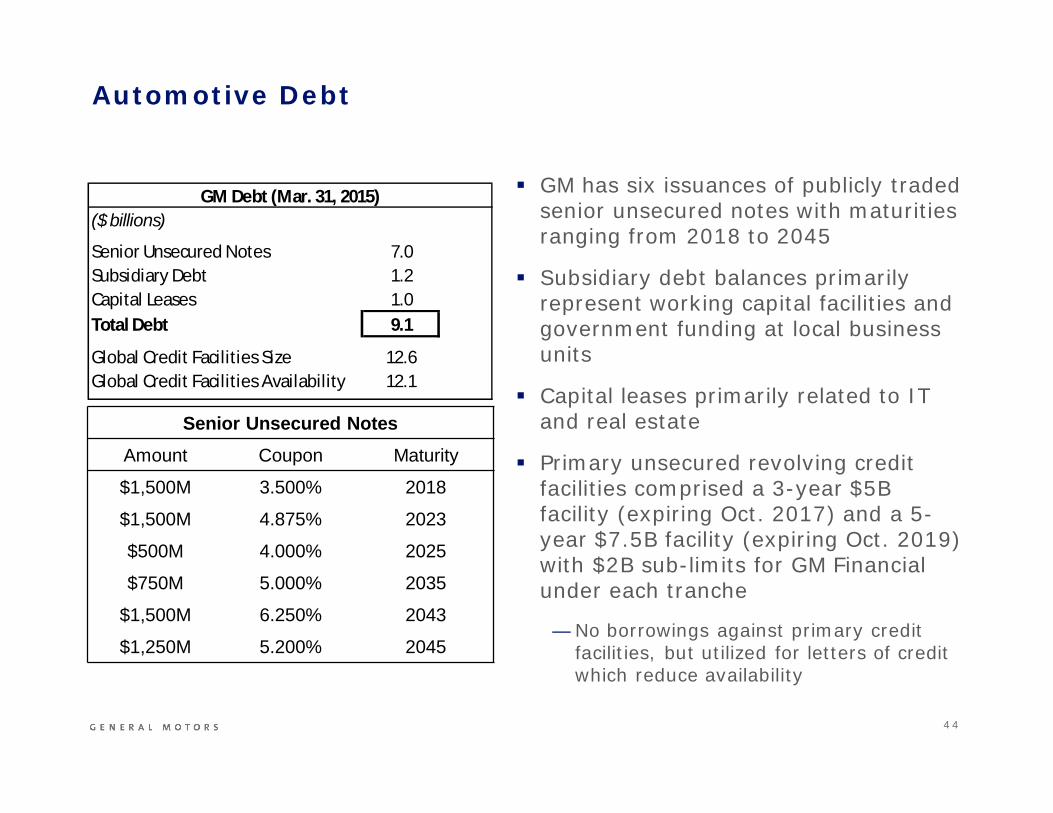
Automotive Debt
Senior Unsecured NotesAmount Coupon Maturity
$1,500M 3.500% 2018
$1,500M 4.875% 2023
$500M 4.000% 2025
$750M 5.000% 2035
$1,500M 6.250% 2043
$1,250M 5.200% 2045
($ billions)
Senior Unsecured Notes 7.0Subsidiary Debt 1.2Capital Leases 1.0Total Debt 9.1
Global Credit Facilities Size 12.6Global Credit Facilities Availability 12.1
GM Debt (Mar. 31, 2015) GM has six issuances of publicly tradedsenior unsecured notes with maturitiesranging from 2018 to 2045
Subsidiary debt balances primarilyrepresent working capital facilities andgovernment funding at local businessunits
Capital leases primarily related to ITand real estate
Primary unsecured revolving creditfacilities comprised a 3-year $5Bfacility (expiring Oct. 2017) and a 5-year $7.5B facility (expiring Oct. 2019)with $2B sub-limits for GM Financialunder each tranche
— No borrowings against primary creditfacilities, but utilized for letters of creditwhich reduce availability
4 5
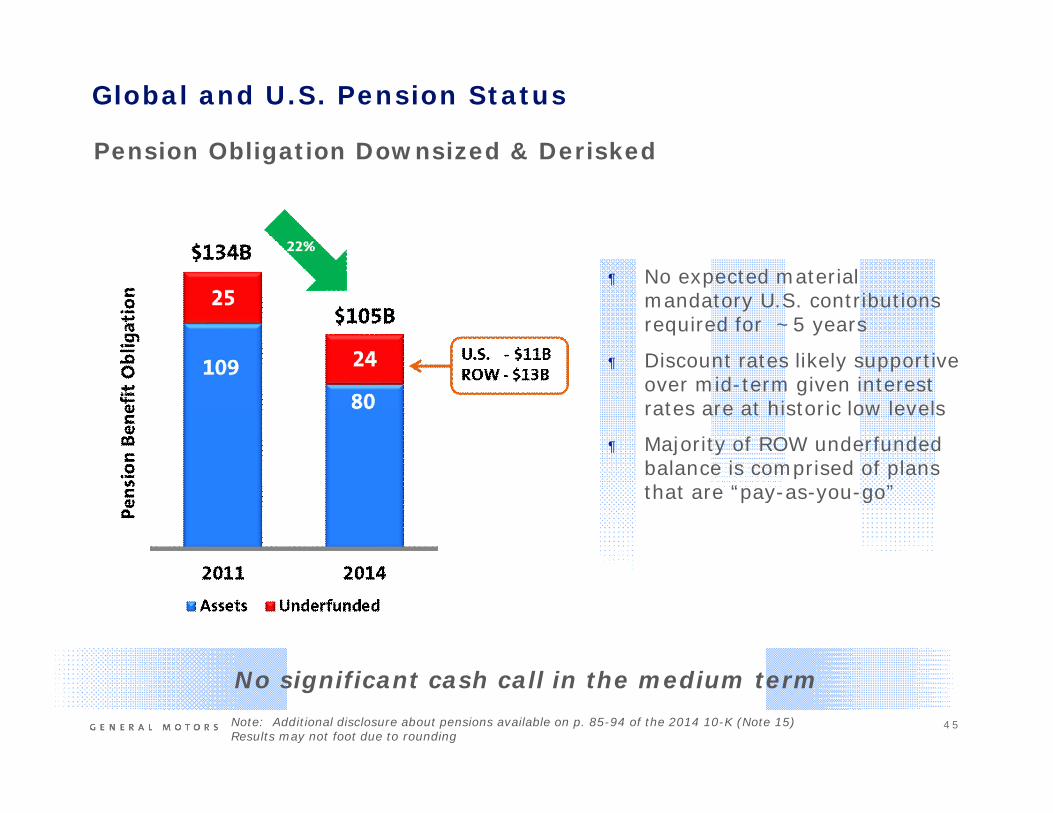
Pension Obligation Downsized & Derisked
Note: Additional disclosure about pensions available on p. 85-94 of the 2014 10-K (Note 15)Results may not foot due to rounding
Global and U.S. Pension Status
No significant cash call in the medium term
¶ No expected materialmandatory U.S. contributionsrequired for ~5 years
¶ Discount rates likely supportiveover mid-term given interestrates are at historic low levels
¶ Majority of ROW underfundedbalance is comprised of plansthat are “pay-as-you-go”

4 6
¶ Hourly and salaried OPEB plans provide postretirement lifeinsurance to certain U.S. retirees and eligible dependentsand postretirement health coverage to some U.S. retireesand eligible dependents
¶ Certain of the non-U.S. subsidiaries have postretirementbenefit plans, although most participants are covered bygovernment sponsored or administered programs
Other Post-Employment Benefits (OPEB)
4 7
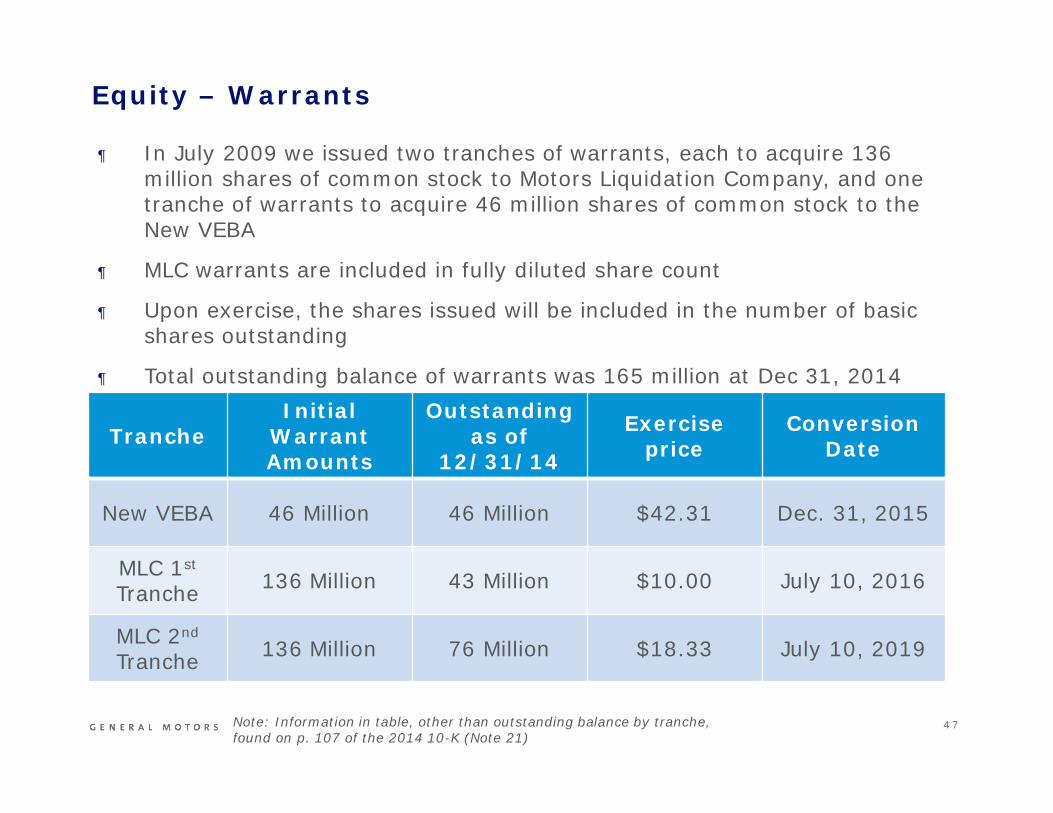
¶ In July 2009 we issued two tranches of warrants, each to acquire 136million shares of common stock to Motors Liquidation Company, and onetranche of warrants to acquire 46 million shares of common stock to theNew VEBA
¶ MLC warrants are included in fully diluted share count
¶ Upon exercise, the shares issued will be included in the number of basicshares outstanding
¶ Total outstanding balance of warrants was 165 million at Dec 31, 2014
TrancheInitial
WarrantAmounts
Outstandingas of
12/31/14
Exerciseprice
ConversionDate
New VEBA 46 Million 46 Million $42.31 Dec. 31, 2015
MLC 1st
Tranche 136 Million 43 Million $10.00 July 10, 2016
MLC 2nd
Tranche 136 Million 76 Million $18.33 July 10, 2019
Note: Information in table, other than outstanding balance by tranche,found on p. 107 of the 2014 10-K (Note 21)
Equity – Warrants

4 8
Appendix
Understanding the Earnings Deck & Key Performance Metrics
Income Statement Considerations
Balance Sheet Considerations
Capital Allocation Framework
GM Financial
4 9
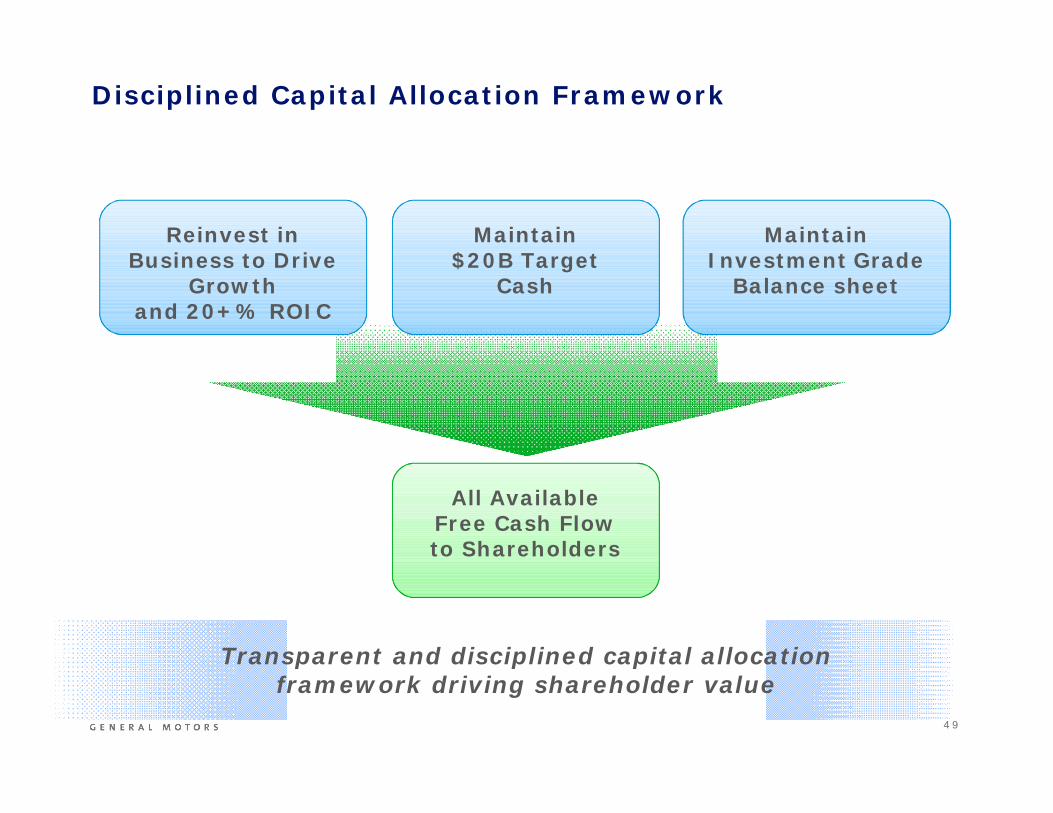
Transparent and disciplined capital allocationframework driving shareholder value
Reinvest inBusiness to Drive
Growthand 20+% ROIC
Maintain$20B Target
Cash
MaintainInvestment Grade
Balance sheet
All AvailableFree Cash Flowto Shareholders
Disciplined Capital Allocation Framework
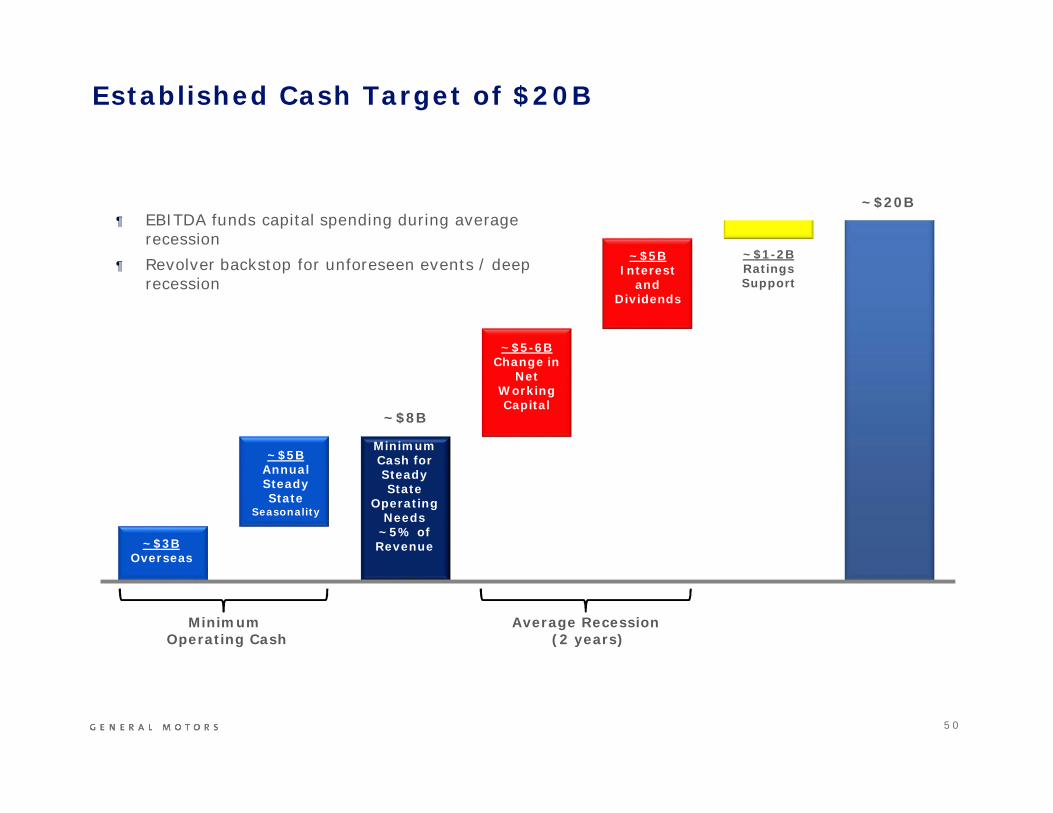
5 0
~$20B
MinimumOperating Cash
Average Recession(2 years)
~$5-6BChange in
NetWorkingCapital
~$5BInterest
andDividends
MinimumCash forSteadyState
OperatingNeeds
~5% ofRevenue
~$8B
~$5BAnnualSteadyState
Seasonality
~$3BOverseas
¶ EBITDA funds capital spending during averagerecession
¶ Revolver backstop for unforeseen events / deeprecession
~$1-2BRatingsSupport
Established Cash Target of $20B
5 1
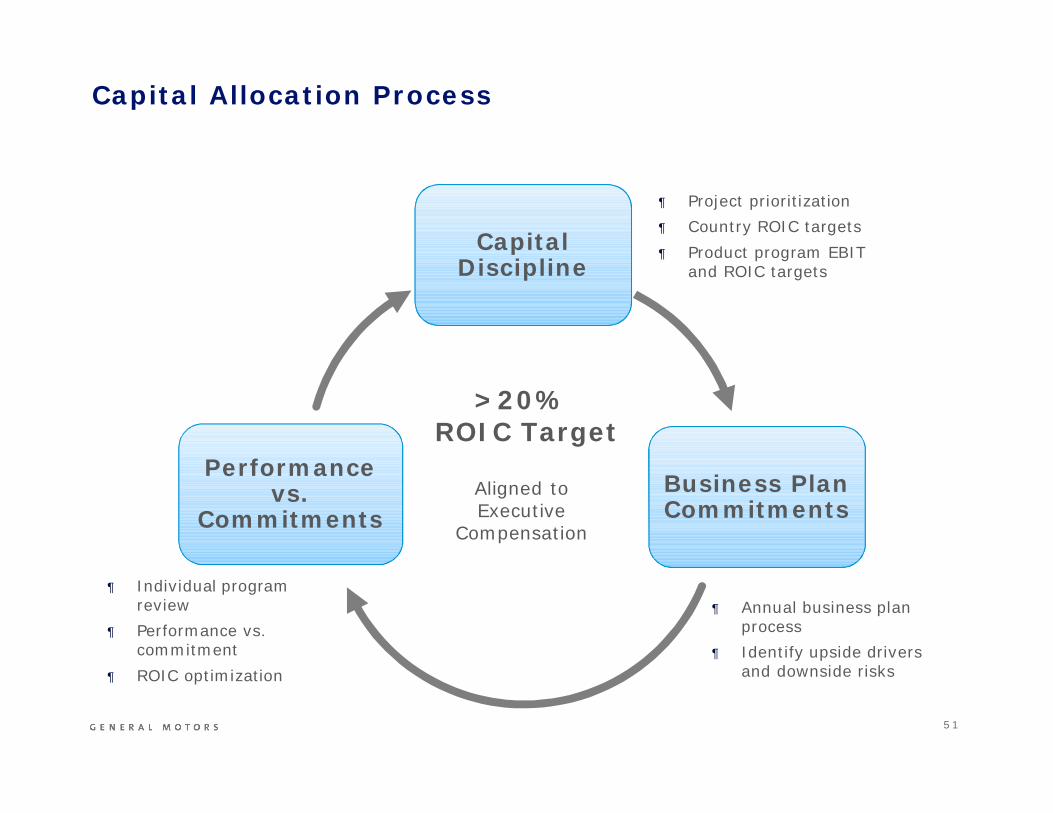
CapitalDiscipline
Business PlanCommitments
Performancevs.
CommitmentsAligned toExecutive
Compensation
>20%ROIC Target
¶ Annual business planprocess
¶ Identify upside driversand downside risks
¶ Individual programreview
¶ Performance vs.commitment
¶ ROIC optimization
¶ Project prioritization¶ Country ROIC targets¶ Product program EBIT
and ROIC targets
Capital Allocation Process
5 2
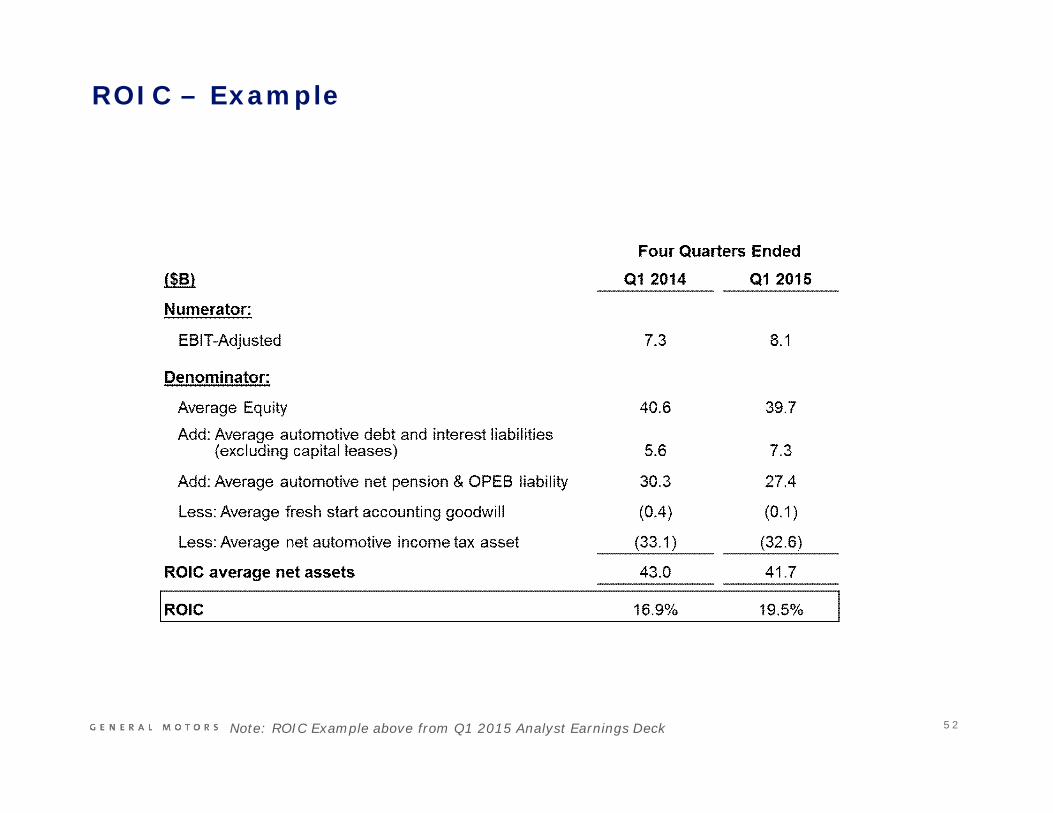
ROIC – Example
Note: ROIC Example above from Q1 2015 Analyst Earnings Deck
5 3
Appendix
Understanding the Earnings Deck & Key Performance Metrics
Income Statement Considerations
Balance Sheet Considerations
Capital Allocation Framework
GM Financial
5 4
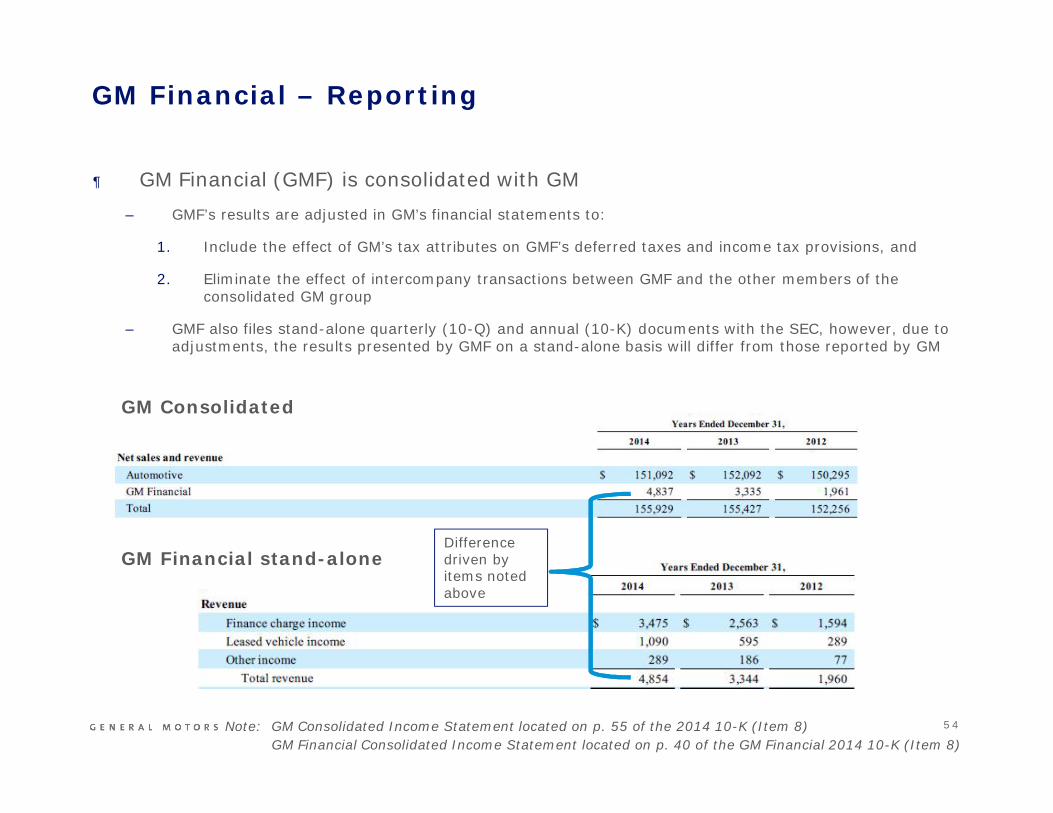
¶ GM Financial (GMF) is consolidated with GM– GMF’s results are adjusted in GM’s financial statements to:
1. Include the effect of GM’s tax attributes on GMF’s deferred taxes and income tax provisions, and
2. Eliminate the effect of intercompany transactions between GMF and the other members of theconsolidated GM group
– GMF also files stand-alone quarterly (10-Q) and annual (10-K) documents with the SEC, however, due toadjustments, the results presented by GMF on a stand-alone basis will differ from those reported by GM
GM Financial – Reporting
GM Consolidated
GM Financial stand-aloneDifferencedriven byitems notedabove
Note: GM Consolidated Income Statement located on p. 55 of the 2014 10-K (Item 8)GM Financial Consolidated Income Statement located on p. 40 of the GM Financial 2014 10-K (Item 8)
5 5
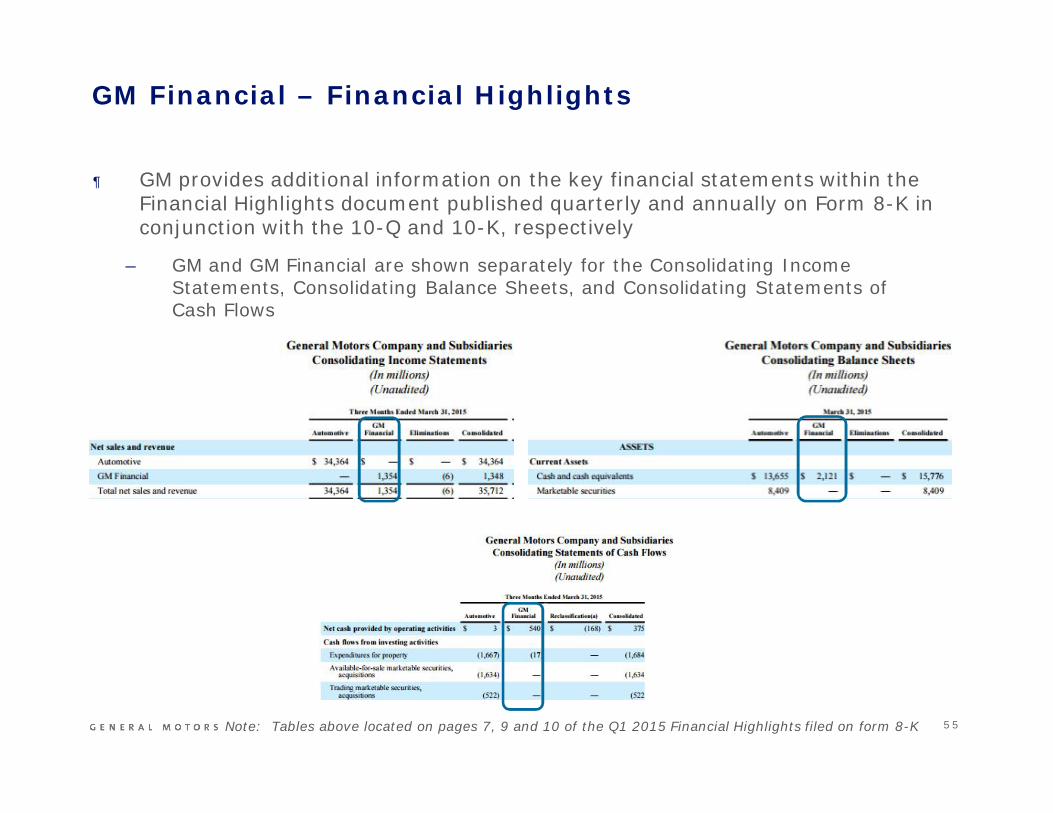
GM Financial – Financial Highlights
¶ GM provides additional information on the key financial statements within theFinancial Highlights document published quarterly and annually on Form 8-K inconjunction with the 10-Q and 10-K, respectively
– GM and GM Financial are shown separately for the Consolidating IncomeStatements, Consolidating Balance Sheets, and Consolidating Statements ofCash Flows
Note: Tables above located on pages 7, 9 and 10 of the Q1 2015 Financial Highlights filed on form 8-K
5 6
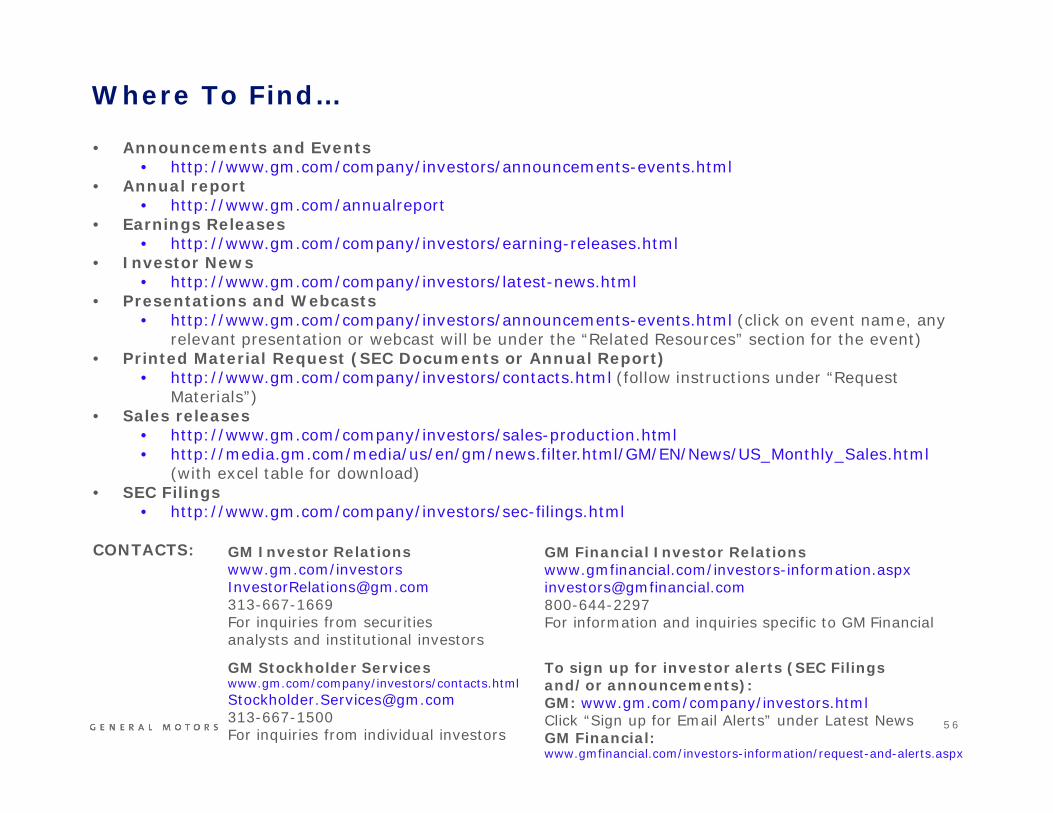
Where To Find…
• Announcements and Events• http://www.gm.com/company/investors/announcements-events.html
• Annual report• http://www.gm.com/annualreport
• Earnings Releases• http://www.gm.com/company/investors/earning-releases.html
• Investor News• http://www.gm.com/company/investors/latest-news.html
• Presentations and Webcasts• http://www.gm.com/company/investors/announcements-events.html (click on event name, any
relevant presentation or webcast will be under the “Related Resources” section for the event)• Printed Material Request (SEC Documents or Annual Report)
• http://www.gm.com/company/investors/contacts.html (follow instructions under “RequestMaterials”)
• Sales releases• http://www.gm.com/company/investors/sales-production.html• http://media.gm.com/media/us/en/gm/news.filter.html/GM/EN/News/US_Monthly_Sales.html
(with excel table for download)• SEC Filings
• http://www.gm.com/company/investors/sec-filings.html
CONTACTS: GM Investor Relationswww.gm.com/[email protected] inquiries from securitiesanalysts and institutional investors
GM Stockholder Serviceswww.gm.com/company/investors/[email protected] inquiries from individual investors
GM Financial Investor Relationswww.gmfinancial.com/investors-information.aspxinvestors@gmfinancial.com800-644-2297For information and inquiries specific to GM Financial
To sign up for investor alerts (SEC Filingsand/or announcements):GM: www.gm.com/company/investors.htmlClick “Sign up for Email Alerts” under Latest NewsGM Financial:www.gmfinancial.com/investors-information/request-and-alerts.aspx