journal of solar energy research (jser) · pdf file · 2018-03-06hydrogen (h2) has...
TRANSCRIPT
23
1. Introduction
Hydrogen (H2) has various applications in
industry. The largest application of H2 is for the processing
of fossil fuels, and in the production of ammonia. It is used
as a hydrogenating agent, particularly in increasing the level
of saturation of unsaturated fats and oils (found in items
such as margarine), and in the production of methanol. It is
similarly the source of hydrogen in the manufact. of
hydrochloric acid. H2 is also used as a reducing agent of
metallic ores [1]. Apart from its use as a reactant, H2 has
wide applications in physics and engineering. It is used as a
shielding gas in welding methods such as atomic hydrogen
welding [2]. H2 is used as the rotor coolant in electrical
generators at power stations, because it has the highest
thermal conductivity of any gas. Liquid H2 is also used in
cryogenic research, including super conductivity studies [3].
In more recent applications, H2 is used p. or mixed with
nitrogen (sometimes called forming gas) as a tracer gas for
minute leak detection. Applications can be found in the
automotive, chemical, power generation, aerospace, and
telecommunications industries [4]. Hydrogen is an
authorized food additive that allows food package leak
testing among other anti-oxidizing properties. Hydrogen can
be produced in a relatively environmentally benign manner
(depending on the source of the input energy) via splitting
water by photocatalysis, thermochemical cycles and
electrolysis. Currently, both thermochemical and
photocatalysis hydrogen production are not economically
competitive. Water electrolysis is a mat. technology for
large scale hydrogen production. Hydrogen production by
proton exchange membrane (PEM) electrolysis has
numerous advantages, such as low environmental impact
and easy maintenance [5]. Recently, several investigation
have been carried out on H2 production using the
multigeneration energy systems owing to their high
thermodynamic performances. Ozturk and Dincer [6]
developed a new multi-generation system for solar-based
hydrogen production. Thermodynamic analysis of the
proposed system which produces a number of outputs, such
as power, heating, cooling, hot water, hydrogen and oxygen
was conducted. Several parametric studies were performed
Click here, type the title of your paper, Capitalize first letter of each words
First Authora, Second Author
b,*
aFirst affiliation, Address, City and Postcode, Country bSecond affiliation, Address, City and Postcode, Country
Journal of Solar Energy Research Vol 1 No1 (2016) 23-33
Journal of Solar Energy Research (JSER)
Journal homepage: jser.ir
A B S T R A C T
Click here and insert your abstract text. Click here and insert your abstract text. Click here and insert your abstract text. Click here and insert your abstract text. Click here and insert your abstract text. Click here and insert your abstract text. Click here and insert your abstract text. Click here and insert your abstract text. Click here and insert your abstract text. Click here and insert your abstract text. Click here and insert your abstract text. Click here and insert your abstract text. Click here and insert your abstract text. Click here and insert your abstract text. Click here and insert your abstract text. Click here and insert your abstract text. Click here and
insert your abstract text. Click here and insert your abstract text. Click here and insert your abstract text. Click here and insert your abstract text. Click here and insert your abstract text Click here and insert your abstract text Click here and insert your abstract text Click here and insert your abstract text Click here and insert your abstract text Click here and insert your abstract text Click here and insert your abst
© 2013Published by University of Tehran Press. All rights reserved.
ARTICLE INFO
Received:
Received in revised form:
Accepted:
Available online:
Keywords:
Type 3-6 keywords here, separated by semicolons ;
Parametric Optimization of PEM Electrolyzer Integrated with Solar Multi-
Generation System Based On Exergy, Cost and Environmental Criteria
S.Nazer, F.Ahmadi Boyaghchi*
Depatement of Mechanical Engineering, Faculty of Engineering and Technology, Alzahra University, Tehran, Iran. *E-mail: [email protected]
Journal of Solar Energy Research (JSER)
Journal homepage: www.jser.ut.ac.ir
A B S T R A C T
A theoretical investigation is conducted for a novel renewable energy based multigeneration system producing hydrogen by means of a proton exchange membrane (PEM) electrolyzer as well as several commodities, namely power, drying, cooling and hot water. Engineering Equation Solver (EES) software is applied to model the PEM
electrolyzer and multigeneration system. Thermodynamic, cost and environmental impact evaluations are included for hydrogen produced by considering the major design parameters. Outcomes indicate that the turbine inlet press. increases the hydrogen exergy efficiency of the system within 56% and decreases its environmental impact by about 3.8 % whereas it has a negative effect on the hydrogen cost produced. Moreover, the current density and temperat. of the electrolyzer affect the cost and environmental impact of hydrogen negatively.
© 2016 Published by University of Tehran Press. All rights reserved.
ARTICLE INFO
Received: 12 May 2016
Received in revised form:
10 July 2016
Accepted: 15 July 2016
Available online: 17 July
2016
Keywords:
solar energy; hydrogen production;exergoeconomic; exergoenvironment
24
in order to examine the effects of varying operating
conditions on the exergy efficiencies of the sub-systems as
well as the whole system. The solar-based multigeneration
system which had an exergy efficiency of 57.35%, was
obtained to be higher than using these sub-systems
separately. Increasing the reference temperat. affected the
exergy efficiency of the Rankine, organic Rankine,
hydrogen production and utilization cycles as well as the
multi-generation system positively. Ahmadi et al. [7]
proposed and thermodynamically assessed a new multi-
generation system based on a biomass combustor, an
organic Rankine cycle, an absorption chiller (LiBr-water)
and a proton exchange membrane (PEM) electrolyzer to
produce hydrogen, and a domestic water heater for hot water
production. A parametric study was performed to investigate
the effects of several important design parameters on the
energy and exergy efficiencies of the system. Ahmadi et al.
[8] reported a comprehensive thermodynamic modeling and
multi-objective optimization of a multigeneration energy
system, based on a micro gas turbine, a dual press. heat
recovery steam generator, an absorption chiller, an ejector
refrigeration cycle, a domestic water heater and a PEM
electrolyzer, that produced multiple commodities: power,
heating, cooling, hot water and hydrogen. Energy and
exergy analyses and an environmental impact assessment
were included. They [9] also developed a new
multigeneration system based on an ocean thermal energy
conversion system and equipped with flat plate and
photovoltaic/thermal (PV/T) collectors, a reverse osmosis
desalination unit to produce fresh water, a single effect
absorption chiller (LiBr-Water) and a PEM electrolyzer.
Energy and exergy analyses were employed to determine the
irreversibilities in each component and assess system
performance. A multi-objective optimization method based
on a fast and elitist non-dominated sorting genetic algorithm
(NSGA-II) was applied to determine the best design
parameters for the system. Bicer and Dincer [10] developed
a new combined system, using solar and geothermal
resources, for hydrogen production, along with power
generation, cooling and heating, was proposed and analyzed
for practical applications. This combined renewable energy
system consisted of solar PV/T modules for heating, water
heating and hydrogen production purposes and geothermal
energy for electricity, cooling and hydrogen production.
Energy and exergy analyses were conducted to assess the
performance of the cycle, and the effects of various system
parameters on energy and exergy efficiencies of the overall
system and its subsystems were also studied.
In this communication, a novel solar-geothermal
multigeneration system equipped with a PEM electrolyzer to
produce hydrogen is proposed and assessed using
thermodynamic, cost and EI concepts. The following
objective of this research are performed:
(I) Modelling the proposed renewable system.
(II) Validating the PEM electrolyzer with experimental
data.
(III) Conducting the cost and EI rate of the overall system.
(IV) Evaluating the effects of design parameters on
thermodynamic, cost and EI of PEM electrolyzer.
2. Materials and Methods
2.1. System description
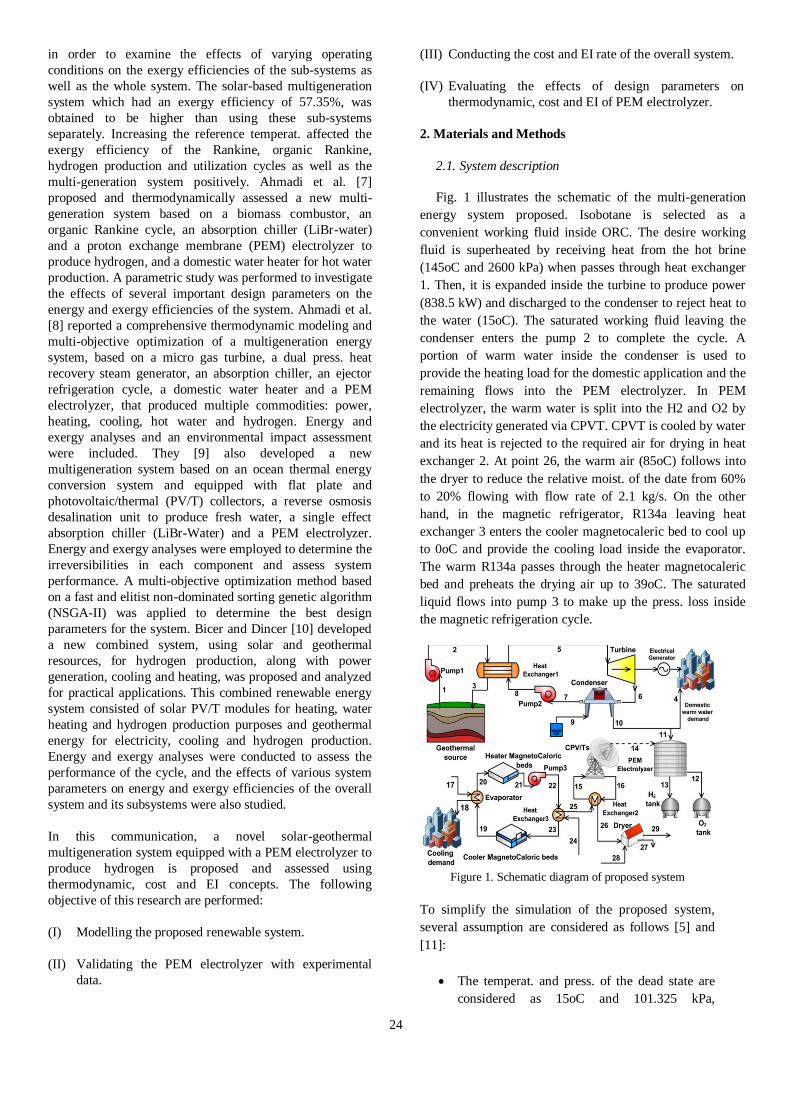
Fig. 1 illustrates the schematic of the multi-generation
energy system proposed. Isobotane is selected as a
convenient working fluid inside ORC. The desire working
fluid is superheated by receiving heat from the hot brine
(145oC and 2600 kPa) when passes through heat exchanger
1. Then, it is expanded inside the turbine to produce power
(838.5 kW) and discharged to the condenser to reject heat to
the water (15oC). The saturated working fluid leaving the
condenser enters the pump 2 to complete the cycle. A
portion of warm water inside the condenser is used to
provide the heating load for the domestic application and the
remaining flows into the PEM electrolyzer. In PEM
electrolyzer, the warm water is split into the H2 and O2 by
the electricity generated via CPVT. CPVT is cooled by water
and its heat is rejected to the required air for drying in heat
exchanger 2. At point 26, the warm air (85oC) follows into
the dryer to reduce the relative moist. of the date from 60%
to 20% flowing with flow rate of 2.1 kg/s. On the other
hand, in the magnetic refrigerator, R134a leaving heat
exchanger 3 enters the cooler magnetocaleric bed to cool up
to 0oC and provide the cooling load inside the evaporator.
The warm R134a passes through the heater magnetocaleric
bed and preheats the drying air up to 39oC. The saturated
liquid flows into pump 3 to make up the press. loss inside
the magnetic refrigeration cycle.
Figure 1. Schematic diagram of proposed system
To simplify the simulation of the proposed system,
several assumption are considered as follows [5] and
[11]:
The temperat. and press. of the dead state are
considered as 15oC and 101.325 kPa,
25
respectively.
All components operate under the steady state
condition.
The kinetic and potential energyies and exergies
are considered negligible.
The reactants and products during the chemical
reactions have the press. of 101.325 kPa.
The outlet flow of the condenser is in the liquid
saturation state.
The isentropic efficiencies of the pump and turbine
are 80% and 85%, respectively
All components of the desired system are considered
control valume.
The system is assumed to be located at Bandar-
Abbas with latitude and longitude of 56.38oN and
27.22oE, respectively with the average monthly
irradiation of 0.6644 GJ/m2.
2.2. Mass and energy balances
By considering the assumption made, mass and
energy relations are applied for each component as follows
[12]:
i em m (1)
i e
Q + mh=W + mh (2)
Here, and indicate the heat and work rate, respectively.
and h represent the mass flow rate and specific enthalpy.
2.3. Exergy balance
The total exergy destruction rate (dEx ) for the kth
component can be determined with fuel exergy (dEx ) and
product exergy (dEx ) as follows [5]:
d,k F,k P,kEx =Ex -Ex (3)
The exergy efficiency of each component can be expressed
as the ratio of the product exergy output rate to the exergy
input (fuel) rate as follows [5]:
P,k
k
F,k
Ex
Ex (4)
Table 1 illustrates the exergy destruction rate and efficiency
relations for each component of the desired system.
Table 1. Exergy destruction rates and exergy efficiency equations for the system components
Component Exergy destruction rate definition Exergy efficiency definition
Turbine d,Turbine 5 6 out,TurbineEx Ex Ex W
out,Turbine
Turbine
5 6
W
Ex Ex
Evaporator
d,Evaporator 17 19 18 20Ex Ex Ex Ex Ex 17 18
Evaporator
19 20
Ex Ex
Ex Ex
Heat exchanger 1
d,HeatExchanger1 2 8 3 5Ex Ex Ex Ex Ex 8 5
HeatExchanger1
2 3
Ex Ex
Ex Ex
Condenser
d,Condenser 6 9 10 7Ex Ex Ex Ex Ex 9 10
Condenser
6 7
Ex Ex
Ex Ex
Heat exchanger 2
d,HeatExchanger2 16 25 15 26Ex Ex Ex Ex Ex 25 26
HeatExchanger2
16 15
Ex Ex
Ex Ex
Heat exchanger 3
d,HeatExchanger3 22 24 23 25Ex Ex Ex Ex Ex
24 25HeatExchanger3
22 23
Ex Ex
Ex Ex
Pump 1
d,Pump1 1 2 in,Pump1Ex Ex Ex W
1 2Pump1
in,Pump1
Ex Ex
W
Pump 2
d,Pump2 7 8 in,Pump2Ex Ex Ex W
7 8Pump2
in,Pump2
Ex Ex
W
Pump 3
d,Pump3 21 22 in,Pump3Ex Ex Ex W 21 22
Pump3
in,Pump3
Ex Ex
W
CPV/T based electrolysis
d,Electrolyzer 11 12 13 ElectrolyzerEx Ex Ex Ex W
12 13Electrolyzer
Electrolyzer
Ex Ex
W
Heater Magnetocaloric
beds d,HeaterMG 20 21 HeatingEx Ex Ex W 20 21
HeaterMG
Heating
Ex Ex
W
Cooler Magnetocaloric
beds d,CoolerMG 23 19 CoolingEx Ex Ex W
23 19CoolerMG
Cooling
Ex Ex
W
Solar CPV/T
0d,CPV 15 16 CPV in,solar
sun
TEx Ex Ex W Q (1 )
T
CPV 16 15CPV
0in,solar
sun
W Ex Ex
TQ (1 )
T
26
Dryer d,Dryer 26 28 27 29Ex Ex Ex Ex Ex
28 29
Dryer
26 27
Ex Ex
Ex Ex
2.4. PEM electrolyzer simulation
The performance of PEM electrolyzer cells can be
expressed by the voltage and current density relationship.
The present model assumes that: (a) the catalyst layer is
infinitely thin and the electrochemical reaction only occurs
at the interface of gas diffusion layer and PEM; (b) gases
transferred inside the electrode and channel are ideal gases;
(c) the porous electrode means and together and its physical
parameters refer to those of gas diffusion layer. The
potential of a single PEM electrolyzer cell is composed by
the open circuit voltage, activation overpotential, diffusion
overpotential, and ohmic loss overpotential. The total
relationship is [13]:
ocv act diff ohmV V V V V (5)
where Vocv is the open circuit voltage as well as the
theoretical minimum voltage for PEM electrolyzer cells
when neglecting other overpotentials, Vact is the
overpotential due to the electrochemical reaction, Vdiff is
the diffusion overpotential (concentration overptential)
caused by the mass transport in the electrolyzers, and Vohm
is the ohmic overpotential caused by the electrolyzer cell
resistances. The concentration overpotentials are assumed to
be negligible. This is valid if the current density is not too
high (i.e. J < 10,000 A/m2) [14]:
2 2
2
0.5
H O
ocv 0
H O
RTV V ln( )
zF
(6)
3
0 PEMV 1.229 0.9 10 (T 298) (7)
The activation overpotential is a potential loss from the
electrolysis electrochemical reaction, which can be
significantly affected by physical and chemical parameters,
such as operating temperat., catalyst property, active
reaction site, and electrode morphology. Since some effects
are very difficult to model, the activation overpotential in
the present model will be typically derived from the Butlere
Volmer equation, which is the fundamental electrochemical
relationship describing how current depends on the voltage
in the electrode.
act act,a act,cV V V (8)
1 2a aact,a
a 0,a a 0,a 0,a
RT RTJ J JV sinh ( ) ln( 1 ( ) )
F 2J F 2J 2J
(9)
1 2c cact,c
c 0,c c 0,c 0,c
RT RTJ J JV sinh ( ) ln( 1 ( ) )
F 2J F 2J 2J
(10)
where Vact,a and Vact,c are the anode and cathode voltage
respectively, Ta and Tc indicate the anode and cathode
operating temperat. respectively, which are equal to
electrolyzer operating temperat. in the present model, and aa
and ac are the charge transfer coefficient at the anode and
cathode. αa =2.0 and αc = 0.5 are typically values for PEM
electrolyzer cells . j is the current density on the electrodes.
j0,a and j0,c are the exchange current density on the anode
and cathode electrode, which also vary greatly according to
different papers and play an important role in PEM
electrolyzer cell modeling. Ohmic overpotential across the
proton exchange membrane is caused by the resistance of
the membrane to the hydrogen ions transporting through it.
The ionic resistance of the membrane is related to the degree
of humidification and thickness of the membrane as well as
the membrane temperat.. The local ionic conductivity σ(x)
of the membrane has been empirically determined as [14]:
PEM
1 1[ (x)] [0.5139 (x) 0.326]exp[1268( )]
303 T (11)
where x is the depth in the membrane meas.d from the
cathode membrane interface; λ(x) is the water content at
location x in the membrane. The value of λ(x) can be
determined in terms of water content at the membrane-
electrode interfaces.
a cc(x) x
L
(12)
where L is the membrane thickness; λa and λc are the water
contents at the anode-membrane and the cathode-membrane
interface, respectively. The overall ohmic resistance (RPEM) can thus be determined as:
L
PEM
PEM0
dxR
[ (x)]
(13)
The ohmic overpotential can be expressed in terms of ohm’s
law:
ohm,PEM PEMV JR
(14)
The energy and exergy efficiency of PEM electrolyzer can
be calculated using following relations [15]:
2 2H H ,out
en
electric heat,PEM
LHV N
Q Q
(15)
2 2H H ,out
ex
electric heat,PEM
Ex N
Ex Ex
(16)
2.5.Exergoeconomic balance
To calculate the cost of exergy destruction rate in
each component, the cost balance should be used as [5]:
out in
cEx= cEx+Z (17)
In Eq. (17), c refers to the cost per unit exergy and
Z indicates the investment and maintenance cost rate. The cost balance and the auxiliary equation based on the fuel and
product rules are listed in Table 2.
The major parameters to assess the cost performance of the
system are presented as follows:
Exergy destruction cost rate within the kth component,
D,kC :
D,k F,k D,kC c Ex (18)
In Eq. (18), cF represents the cost per exergy of fuel.
27
Exergoeconomic factor, fc :
kc,k
k D,k
Zf
Z C
(19)
Relative cost difference, representing the potential of
cost reduction within the kth component, rc:
P,k F,k
c,k
F,k
c cr
c
(20)
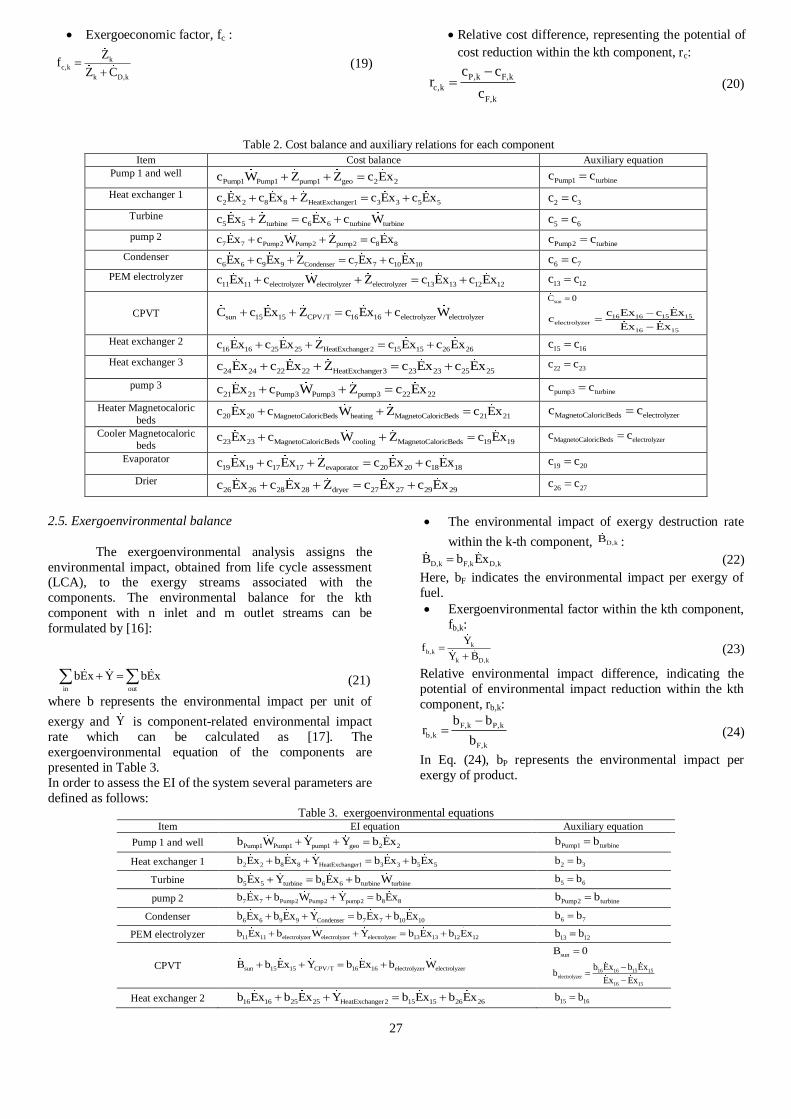
Table 2. Cost balance and auxiliary relations for each component Item Cost balance Auxiliary equation
Pump 1 and well Pump1 Pump1 pump1 geo 2 2c W Z Z c Ex
Pump1 turbinec c
Heat exchanger 1
2 2 8 8 HeatExchanger1 3 3 5 5c Ex c Ex Z c Ex c Ex 2 3c c
Turbine
5 5 turbine 6 6 turbine turbinec Ex Z c Ex c W 5 6c c
pump 2
7 7 Pump2 Pump2 pump2 8 8c Ex c W Z c Ex Pump2 turbinec c
Condenser
6 6 9 9 Condenser 7 7 10 10c Ex c Ex Z c Ex c Ex 6 7c c
PEM electrolyzer
11 11 electrolyzer electrolyzer electrolyzer 13 13 12 12c Ex c W Z c Ex c Ex 13 12c c
CPVT sun 15 15 CPV/T 16 16 electrolyzer electrolyzerC c Ex Z c Ex c W
sunC 0
16 16 15 15electrolyzer
16 15
c Ex c Exc
Ex Ex
Heat exchanger 2
16 16 25 25 HeatExchanger2 15 15 26 26c Ex c Ex Z c Ex c Ex 15 16c c
Heat exchanger 3
24 24 22 22 HeatExchanger3 23 23 25 25c Ex c Ex Z c Ex c Ex
22 23c c
pump 3 21 21 Pump3 Pump3 pump3 22 22c Ex c W Z c Ex
pump3 turbinec c
Heater Magnetocaloric
beds 20 20 MagnetoCaloricBeds heating MagnetoCaloricBeds 21 21c Ex c W Z c Ex
MagnetoCaloricBeds electrolyzerc c
Cooler Magnetocaloric
beds 23 23 MagnetoCaloricBeds cooling MagnetoCaloricBeds 19 19c Ex c W Z c Ex
MagnetoCaloricBeds electrolyzerc c
Evaporator 19 19 17 17 evaporator 20 20 18 18c Ex c Ex Z c Ex c Ex
19 20c c
Drier 26 26 28 28 dryer 27 27 29 29c Ex c Ex Z c Ex c Ex
26 27c c
2.5. Exergoenvironmental balance
The exergoenvironmental analysis assigns the
environmental impact, obtained from life cycle assessment (LCA), to the exergy streams associated with the
components. The environmental balance for the kth
component with n inlet and m outlet streams can be
formulated by [16]:
in out
bEx Y bEx
(21)
where b represents the environmental impact per unit of
exergy and Y is component-related environmental impact
rate which can be calculated as [17]. The
exergoenvironmental equation of the components are
presented in Table 3.
In order to assess the EI of the system several parameters are
defined as follows:
The environmental impact of exergy destruction rate
within the k-th component, D,kB :
D,k F,k D,kB b Ex (22)
Here, bF indicates the environmental impact per exergy of
fuel.
Exergoenvironmental factor within the kth component,
fb,k:
kb,k
k D,k
Yf
Y B
(23)
Relative environmental impact difference, indicating the
potential of environmental impact reduction within the kth
component, rb,k:
F,k P,k
b,k
F,k
b br
b
(24)
In Eq. (24), bP represents the environmental impact per
exergy of product.
Table 3. exergoenvironmental equations Item EI equation Auxiliary equation
Pump 1 and well Pump1 Pump1 pump1 geo 2 2b W Y Y b Ex Pump1 turbineb b
Heat exchanger 1 2 2 8 8 HeatExchanger1 3 3 5 5b Ex b Ex Y b Ex b Ex 2 3b b
Turbine 5 5 turbine 6 6 turbine turbineb Ex Y b Ex b W 5 6b b
pump 2 7 7 Pump2 Pump2 pump2 8 8b Ex b W Y b Ex Pump2 turbineb b
Condenser 6 6 9 9 Condenser 7 7 10 10b Ex b Ex Y b Ex b Ex 6 7b b
PEM electrolyzer 11 11 electrolyzer electrolyzer electrolyzer 13 13 12 12b Ex b W Y b Ex b Ex 13 12b b
CPVT sun 15 15 CPV/T 16 16 electrolyzer electrolyzerB b Ex Y b Ex b W
sunB 0
16 16 15 15electrolyzer
16 15
b Ex b Exb
Ex Ex
Heat exchanger 2 16 16 25 25 HeatExchanger2 15 15 26 26b Ex b Ex Y b Ex b Ex 15 16b b
28
Heat exchanger 3 24 24 22 22 HeatExchanger3 23 23 25 25b Ex b Ex Y b Ex b Ex 22 23b b
pump 3 21 21 Pump3 Pump3 pump3 22 22b Ex b W Y b Ex pump3 turbineb b
Heater
Magnetocaloric
beds 20 20 MagnetoCaloricBeds heating MagnetoCaloricBeds 21 21b Ex b W Y b Ex
MagnetoCaloricBeds electrolyzerb b
Cooler
Magnetocaloric
beds 23 23 MagnetoCaloricBeds cooling MagnetoCaloricBeds 19 19b Ex b W Y b Ex
MagnetoCaloricBeds electrolyzerb b
Evaporator 19 19 17 17 evaporator 20 20 18 18b Ex b Ex Y b Ex b Ex 19 20b b
Drier 26 26 28 28 dryer 27 27 29 29b Ex b Ex Y b Ex b Ex 26 27b b
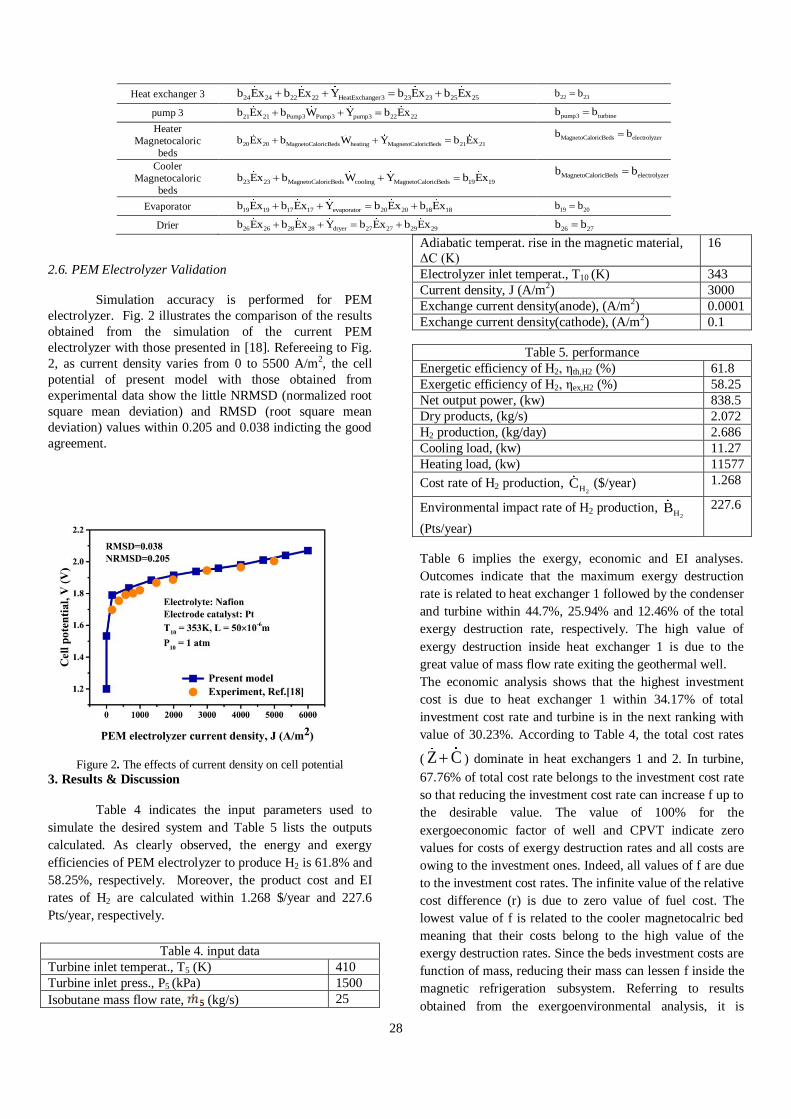
2.6. PEM Electrolyzer Validation
Simulation accuracy is performed for PEM
electrolyzer. Fig. 2 illustrates the comparison of the results
obtained from the simulation of the current PEM
electrolyzer with those presented in [18]. Refereeing to Fig.
2, as current density varies from 0 to 5500 A/m2, the cell
potential of present model with those obtained from
experimental data show the little NRMSD (normalized root
square mean deviation) and RMSD (root square mean
deviation) values within 0.205 and 0.038 indicting the good
agreement.
Figure 2. The effects of current density on cell potential
3. Results & Discussion
Table 4 indicates the input parameters used to
simulate the desired system and Table 5 lists the outputs
calculated. As clearly observed, the energy and exergy
efficiencies of PEM electrolyzer to produce H2 is 61.8% and
58.25%, respectively. Moreover, the product cost and EI
rates of H2 are calculated within 1.268 $/year and 227.6
Pts/year, respectively.
Table 4. input data
Turbine inlet temperat., T5 (K) 410
Turbine inlet press., P5 (kPa) 1500
Isobutane mass flow rate, (kg/s) 25
Adiabatic temperat. rise in the magnetic material,
ΔC (K)
16
Electrolyzer inlet temperat., T10 (K) 343
Current density, J (A/m2) 3000
Exchange current density(anode), (A/m2) 0.0001
Exchange current density(cathode), (A/m2) 0.1
Table 5. performance
Energetic efficiency of H2, ηth,H2 (%) 61.8
Exergetic efficiency of H2, ηex,H2 (%) 58.25
Net output power, (kw) 838.5
Dry products, (kg/s) 2.072
H2 production, (kg/day) 2.686
Cooling load, (kw) 11.27
Heating load, (kw) 11577
Cost rate of H2 production, 2HC ($/year) 1.268
Environmental impact rate of H2 production, 2HB
(Pts/year)
227.6
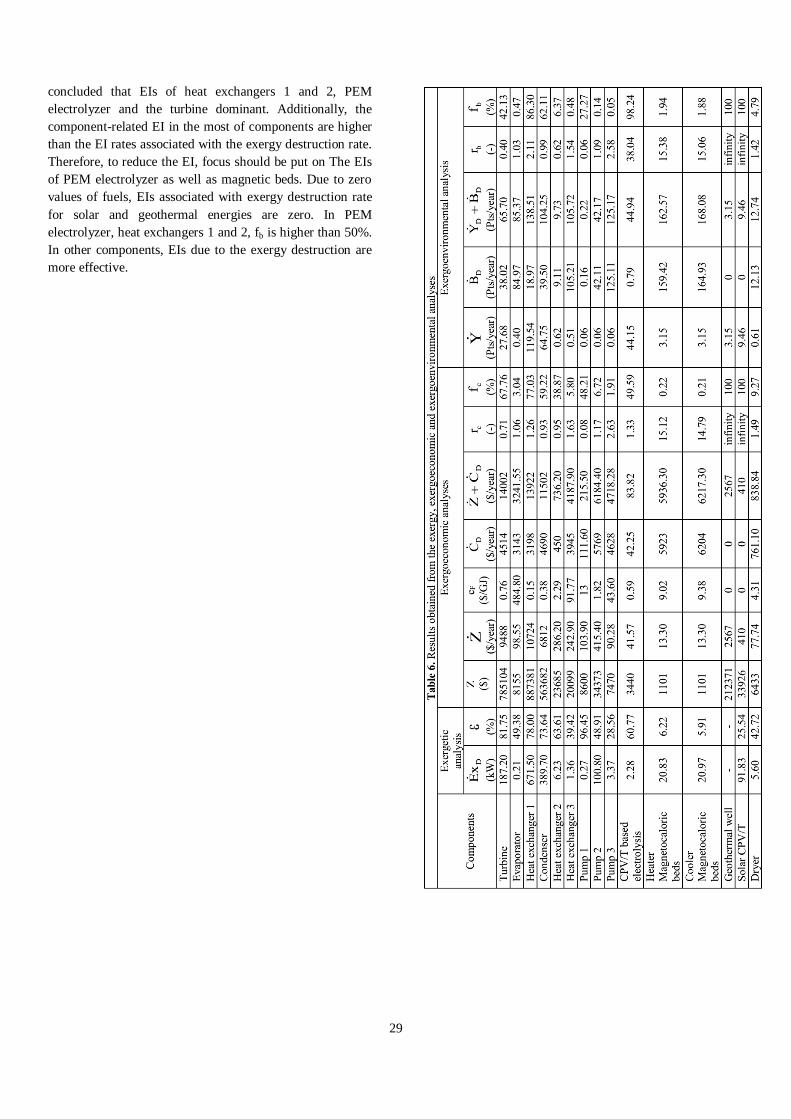
Table 6 implies the exergy, economic and EI analyses.
Outcomes indicate that the maximum exergy destruction
rate is related to heat exchanger 1 followed by the condenser
and turbine within 44.7%, 25.94% and 12.46% of the total
exergy destruction rate, respectively. The high value of
exergy destruction inside heat exchanger 1 is due to the
great value of mass flow rate exiting the geothermal well.
The economic analysis shows that the highest investment
cost is due to heat exchanger 1 within 34.17% of total
investment cost rate and turbine is in the next ranking with
value of 30.23%. According to Table 4, the total cost rates
( Z C ) dominate in heat exchangers 1 and 2. In turbine,
67.76% of total cost rate belongs to the investment cost rate
so that reducing the investment cost rate can increase f up to
the desirable value. The value of 100% for the
exergoeconomic factor of well and CPVT indicate zero
values for costs of exergy destruction rates and all costs are
owing to the investment ones. Indeed, all values of f are due
to the investment cost rates. The infinite value of the relative
cost difference (r) is due to zero value of fuel cost. The
lowest value of f is related to the cooler magnetocalric bed
meaning that their costs belong to the high value of the
exergy destruction rates. Since the beds investment costs are
function of mass, reducing their mass can lessen f inside the
magnetic refrigeration subsystem. Referring to results
obtained from the exergoenvironmental analysis, it is
29
concluded that EIs of heat exchangers 1 and 2, PEM
electrolyzer and the turbine dominant. Additionally, the
component-related EI in the most of components are higher
than the EI rates associated with the exergy destruction rate.
Therefore, to reduce the EI, focus should be put on The EIs
of PEM electrolyzer as well as magnetic beds. Due to zero
values of fuels, EIs associated with exergy destruction rate
for solar and geothermal energies are zero. In PEM
electrolyzer, heat exchangers 1 and 2, fb is higher than 50%.
In other components, EIs due to the exergy destruction are
more effective.
30
3.1. Parametric Assessment
Fig. 3 illustrates the turbine inlet temperat. and (T5) and
press. (P5) on the exergetic and product cost rate of PEM
electrolyzer. Results show that the increment of these
parameters do not affect the exergetic and cost criteria. As
T5 increases, the product cost of H2 increases within 7%.
This trend is due to the increment of product cost of exergy
unit in the condenser by 35% leading to the increasing of the
required fuel cost of PEM electrolyzer. As press. lines
indicate, the increase of P5, the cost of H2 production
decreases within 28% because the operation of the turbine is
improved and the product cost of exergy unit of the heating
load lowers within 23%.
Figure
3. The effects of turbine inlet temperature and press. on the PEM
electrolyzer efficiency and cost
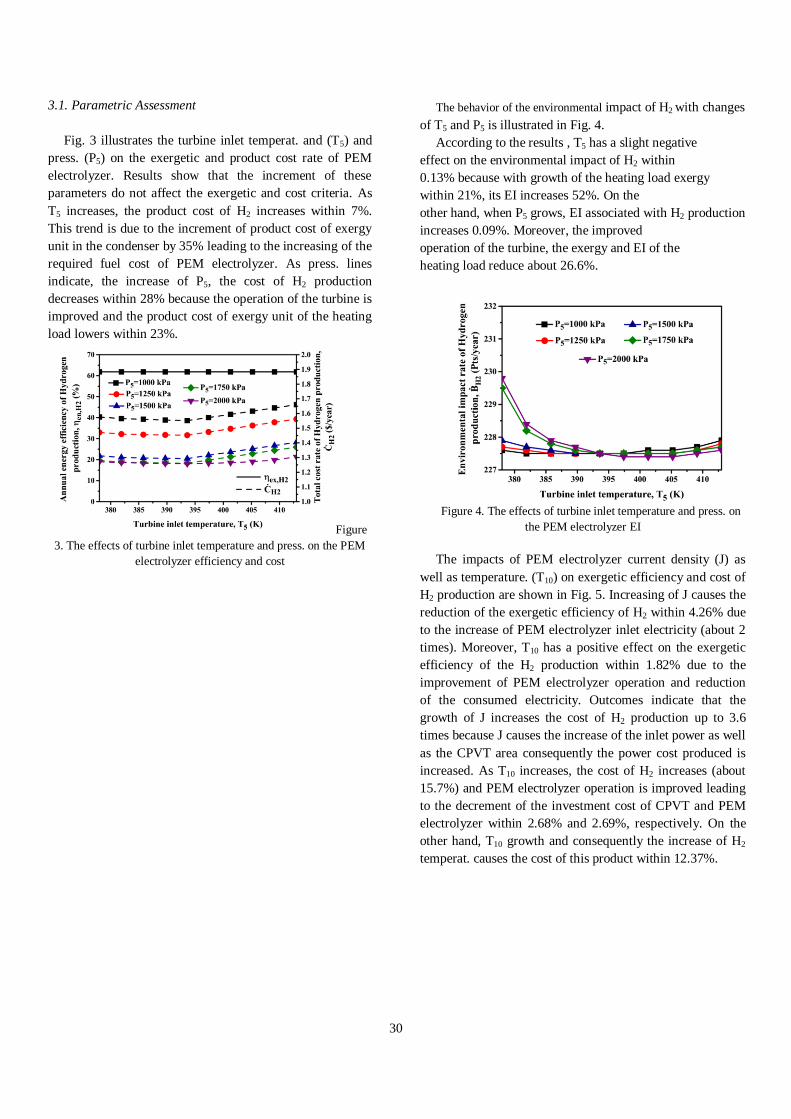
The behavior of the environmental impact of H2 with changes
of T5 and P5 is illustrated in Fig. 4.
According to the results , T5 has a slight negative
effect on the environmental impact of H2 within
0.13% because with growth of the heating load exergy
within 21%, its EI increases 52%. On the
other hand, when P5 grows, EI associated with H2 production
increases 0.09%. Moreover, the improved
operation of the turbine, the exergy and EI of the
heating load reduce about 26.6%.
Figure 4. The effects of turbine inlet temperature and press. on
the PEM electrolyzer EI
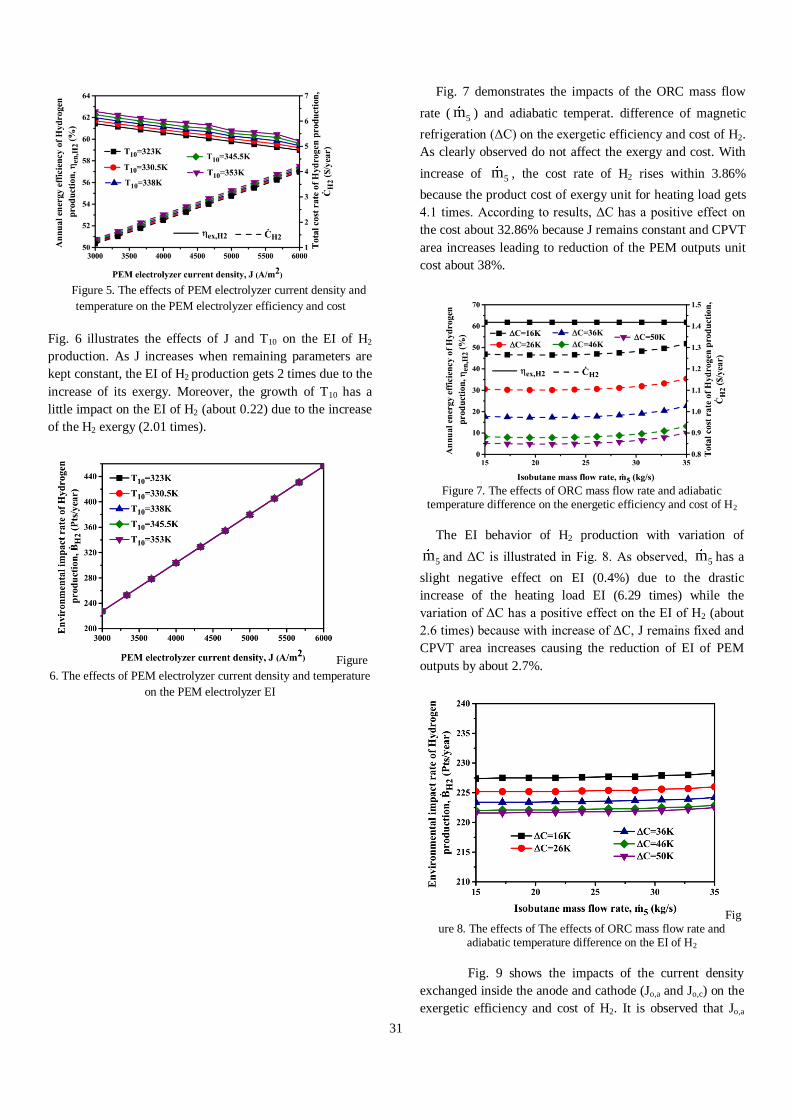
The impacts of PEM electrolyzer current density (J) as
well as temperature. (T10) on exergetic efficiency and cost of
H2 production are shown in Fig. 5. Increasing of J causes the
reduction of the exergetic efficiency of H2 within 4.26% due
to the increase of PEM electrolyzer inlet electricity (about 2
times). Moreover, T10 has a positive effect on the exergetic
efficiency of the H2 production within 1.82% due to the
improvement of PEM electrolyzer operation and reduction
of the consumed electricity. Outcomes indicate that the
growth of J increases the cost of H2 production up to 3.6
times because J causes the increase of the inlet power as well
as the CPVT area consequently the power cost produced is
increased. As T10 increases, the cost of H2 increases (about
15.7%) and PEM electrolyzer operation is improved leading
to the decrement of the investment cost of CPVT and PEM
electrolyzer within 2.68% and 2.69%, respectively. On the
other hand, T10 growth and consequently the increase of H2
temperat. causes the cost of this product within 12.37%.
31
Figure 5. The effects of PEM electrolyzer current density and
temperature on the PEM electrolyzer efficiency and cost
Fig. 6 illustrates the effects of J and T10 on the EI of H2
production. As J increases when remaining parameters are
kept constant, the EI of H2 production gets 2 times due to the
increase of its exergy. Moreover, the growth of T10 has a
little impact on the EI of H2 (about 0.22) due to the increase
of the H2 exergy (2.01 times).
Figure
6. The effects of PEM electrolyzer current density and temperature
on the PEM electrolyzer EI
Fig. 7 demonstrates the impacts of the ORC mass flow
rate ( 5m ) and adiabatic temperat. difference of magnetic
refrigeration (ΔC) on the exergetic efficiency and cost of H2.
As clearly observed do not affect the exergy and cost. With
increase of 5m , the cost rate of H2 rises within 3.86%
because the product cost of exergy unit for heating load gets
4.1 times. According to results, ΔC has a positive effect on
the cost about 32.86% because J remains constant and CPVT
area increases leading to reduction of the PEM outputs unit
cost about 38%.
Figure 7. The effects of ORC mass flow rate and adiabatic
temperature difference on the energetic efficiency and cost of H2
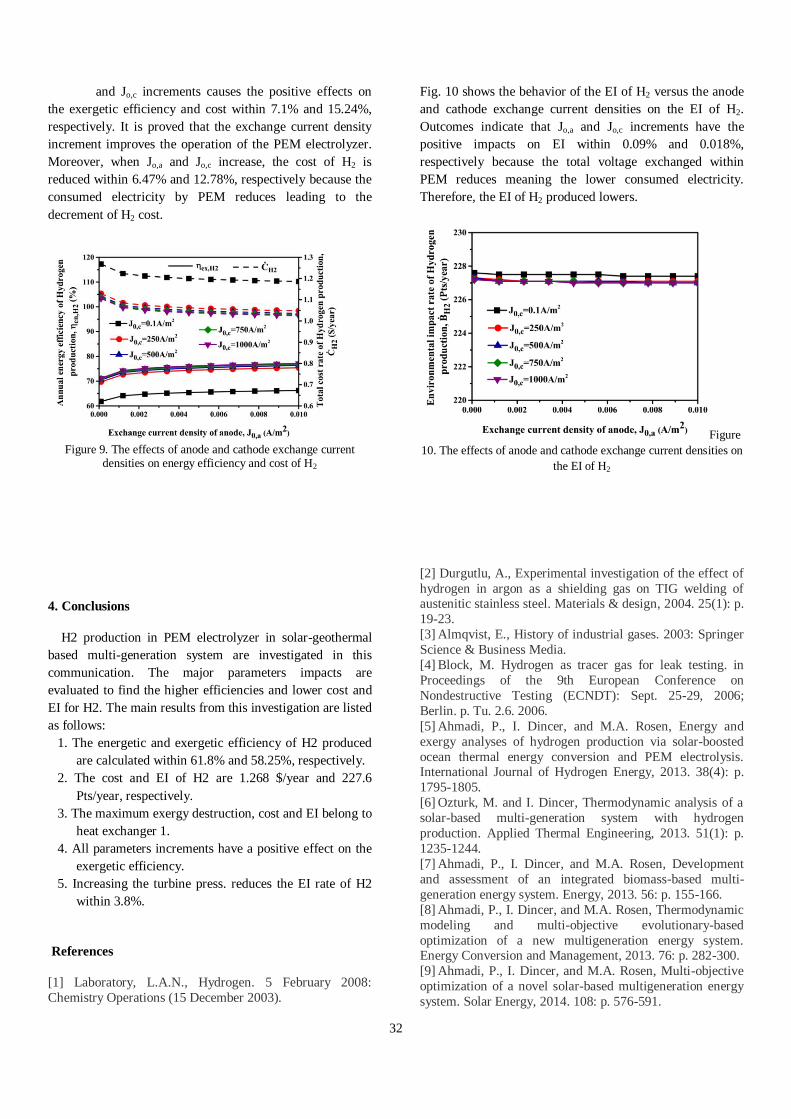
The EI behavior of H2 production with variation of
5m and ΔC is illustrated in Fig. 8. As observed, 5m has a
slight negative effect on EI (0.4%) due to the drastic
increase of the heating load EI (6.29 times) while the
variation of ΔC has a positive effect on the EI of H2 (about
2.6 times) because with increase of ΔC, J remains fixed and
CPVT area increases causing the reduction of EI of PEM
outputs by about 2.7%.
Figure 8. The effects of The effects of ORC mass flow rate and
adiabatic temperature difference on the EI of H2
Fig. 9 shows the impacts of the current density
exchanged inside the anode and cathode (Jo,a and Jo,c) on the
exergetic efficiency and cost of H2. It is observed that Jo,a
32
and Jo,c increments causes the positive effects on
the exergetic efficiency and cost within 7.1% and 15.24%,
respectively. It is proved that the exchange current density
increment improves the operation of the PEM electrolyzer.
Moreover, when Jo,a and Jo,c increase, the cost of H2 is
reduced within 6.47% and 12.78%, respectively because the
consumed electricity by PEM reduces leading to the
decrement of H2 cost.
Figure 9. The effects of anode and cathode exchange current
densities on energy efficiency and cost of H2
Fig. 10 shows the behavior of the EI of H2 versus the anode
and cathode exchange current densities on the EI of H2.
Outcomes indicate that Jo,a and Jo,c increments have the
positive impacts on EI within 0.09% and 0.018%,
respectively because the total voltage exchanged within
PEM reduces meaning the lower consumed electricity.
Therefore, the EI of H2 produced lowers.
Figure
10. The effects of anode and cathode exchange current densities on
the EI of H2
4. Conclusions
H2 production in PEM electrolyzer in solar-geothermal
based multi-generation system are investigated in this
communication. The major parameters impacts are
evaluated to find the higher efficiencies and lower cost and
EI for H2. The main results from this investigation are listed
as follows:
1. The energetic and exergetic efficiency of H2 produced
are calculated within 61.8% and 58.25%, respectively.
2. The cost and EI of H2 are 1.268 $/year and 227.6
Pts/year, respectively.
3. The maximum exergy destruction, cost and EI belong to
heat exchanger 1.
4. All parameters increments have a positive effect on the
exergetic efficiency.
5. Increasing the turbine press. reduces the EI rate of H2
within 3.8%.
References
[1] Laboratory, L.A.N., Hydrogen. 5 February 2008:
Chemistry Operations (15 December 2003).
[2] Durgutlu, A., Experimental investigation of the effect of
hydrogen in argon as a shielding gas on TIG welding of austenitic stainless steel. Materials & design, 2004. 25(1): p.
19-23.
[3] Almqvist, E., History of industrial gases. 2003: Springer
Science & Business Media.
[4] Block, M. Hydrogen as tracer gas for leak testing. in
Proceedings of the 9th European Conference on
Nondestructive Testing (ECNDT): Sept. 25-29, 2006;
Berlin. p. Tu. 2.6. 2006.
[5] Ahmadi, P., I. Dincer, and M.A. Rosen, Energy and
exergy analyses of hydrogen production via solar-boosted
ocean thermal energy conversion and PEM electrolysis. International Journal of Hydrogen Energy, 2013. 38(4): p.
1795-1805.
[6] Ozturk, M. and I. Dincer, Thermodynamic analysis of a
solar-based multi-generation system with hydrogen
production. Applied Thermal Engineering, 2013. 51(1): p.
1235-1244.
[7] Ahmadi, P., I. Dincer, and M.A. Rosen, Development
and assessment of an integrated biomass-based multi-
generation energy system. Energy, 2013. 56: p. 155-166.
[8] Ahmadi, P., I. Dincer, and M.A. Rosen, Thermodynamic
modeling and multi-objective evolutionary-based
optimization of a new multigeneration energy system. Energy Conversion and Management, 2013. 76: p. 282-300.
[9] Ahmadi, P., I. Dincer, and M.A. Rosen, Multi-objective
optimization of a novel solar-based multigeneration energy
system. Solar Energy, 2014. 108: p. 576-591.

33
[10] Bicer, Y. and I. Dincer, Development of a new solar
and geothermal based combined system for hydrogen
production. Solar Energy, 2016. 127: p. 269-284. [11] Gabbrielli, R., A novel design approach for small scale
low enthalpy binary geothermal power plants. Energy
Conversion and Management, 2012. 64: p. 263-272.
[12] Bejan, A. and G. Tsatsaronis, Thermal design and
optimization. 1996: John Wiley & Sons.
[13] Han, B., et al., Electrochemical performance modeling
of a proton exchange membrane electrolyzer cell for
hydrogen energy. International Journal of Hydrogen Energy,
2015. 40(22): p. 7006-7016.
[14] Ni, M., M.K. Leung, and D.Y. Leung, Energy and
exergy analysis of hydrogen production by a proton
exchange membrane (PEM) electrolyzer plant. Energy conversion and management, 2008. 49(10): p. 2748-2756.
[15 ] Esmaili, P., I. Dincer, and G. Naterer, Energy and
exergy analyses of electrolytic hydrogen production with
molybdenum-oxo catalysts. International Journal of
Hydrogen Energy, 2012. 37(9): p. 7365-7372.
[16] Meyer, L., et al., Exergoenvironmental analysis for
evaluation of the environmental impact of energy
conversion systems. Energy, 2009. 34(1): p. 75-89.
[17] Manesh, M.K., et al., New proced. for optimal design
and evaluation of cogeneration system based on advanced
exergoeconomic and exergoenvironmental analyses. Energy,
2013. 59: p. 314-333. 18.