high altitude aerial natural gas leak detection system library/research/oil-gas/natural gas... ·...
TRANSCRIPT
PSI-1454
High Altitude Aerial Natural Gas Leak Detection System
Semiannual Progress Report No. 2 Covering the Period
April 2005 through September 2005 for
Contract No. DE-FC26-04NT42268
Prepared by:
Mickey B. Frish, Richard T. Wainner, and Matthew C. Laderer Physical Sciences Inc.
20 New England Business Center Andover, MA 01810-1077
Prepared for:
Department of Energy
National Energy Technology Laboratory 626 Cochrans Mill Road
P.O. Box 10940 Pittsburgh, PA 15236-0940
October 2005
ACKNOWLEDGEMENT STATEMENT This Semiannual Progress Report was prepared with the support of the U.S. Department of Energy, under Award No. DE-FC26-04NT42268. However, any opinions, findings, conclusions, or recommendations expressed herein are those of the author(s) and do not necessarily reflect the view of the DOE.

DISCLAIMER This report was prepared as an account of work sponsored by an agency of the United States Government. Neither the United States Government nor any agency thereof, nor any of their employees, makes any warranty, express or implied, or assumes any legal liability or responsibility for the accuracy, completeness, or usefulness of any information, apparatus, product, or process disclosed, or represents that its use would not infringe privately owned rights. Reference herein to any specific commercial product, process, or service by trade name, trademark, manufacturer, or otherwise does not necessarily constitute or imply its endorsement, recommendation, or favoring by the United States Government or any agency thereof. The views and opinions of authors expressed herein do not necessarily state or reflect those of the United States Government or any agency thereof.

1
NETL Cooperative Research Project Progress Report
Report Prepared by: Mickey B. Frish, Richard T. Wainner, and Matthew C. Laderer
1. DoE Award Number: DE-FC26-04NT42268 Recipient: Physical Sciences Inc.
2. Project Title: High Altitude Aerial Natural Gas Leak Detection System Principal Investigator: B. David Green
3. Report Date: October 14, 2005
Reporting Period: April 2005 – September 2005
4. Executive Summary The objective of this program is to develop and demonstrate a cost-effective and power-
efficient advanced standoff sensing technology able to detect and quantify, from a high-altitude (> 10,000 ft) aircraft, natural gas leaking from a high-pressure pipeline. The advanced technology is based on an enhanced version of the Remote Methane Leak Detector (RMLD) platform developed previously by Physical Sciences Inc. (PSI). The RMLD combines a telecommunications-style diode laser, fiber-optic components, and low-cost DSP electronics with the well-understood principles of Wavelength Modulation Spectroscopy (WMS), to indicate the presence of natural gas located between the operator and a topographic target. The system includes an optical transceiver and an electronic controller. The transceiver transmits a laser beam onto a topographic target and receives some of the laser light reflected by the target. The controller processes the received light signal to deduce the amount of methane in the laser’s path.
The currently-available lightweight, handheld, battery-powered RMLD provides a
maximum range to the topographic target of 100 ft. For use in the airborne platform, we are modifying three aspects of the RMLD, by: 1) inserting an optical fiber laser amplifier to increase the transmitted laser power from 10 mW to 5W; 2) increasing the optical receiver diameter from 10 cm to 25 cm; and 3) altering the laser wavelength from 1653 nm to 1618 nm. The airborne system is expected to provide a minimum path-integrated methane concentration sensitivity of 1000 ppm-m, sufficient to detect the presence of a leak from a high capacity transmission line while discriminating against attenuation by ambient methane.
During the previous reporting period, covering the first six-months of the 24-month
project, we completed several initial inter-related tasks preparing for assembly and testing of the airborne sensors. These tasks were:
• Spectral Analysis, Wavelength Selection, and Sensitivity Estimate • Amplifier Selection and characteristics • Aircraft Selection • System Specification
2
• Optical Components Selection • Optical Components Configuration • Seed Laser Testing • DMD Algorithm Development
During the current reporting period, covering the second 6-months of the 24-month project, we:
• Received the optical fiber laser amplifier • Characterized the amplifier performance • Evaluated methane detection limits of the Amplified RMLD • Assembled and aligned the high-altitude optical transceiver • Combined the transceiver and amplified laser to form the complete sensor system • Commenced outdoor system tests
5. Results of Work During Reporting Period Overview of Technical Approach
The objective of this program is to develop and demonstrate a cost-effective and power-efficient advanced standoff sensing technology able to detect and quantify, from a high-altitude (> 10,000 ft) aircraft, natural gas leaking from a high-pressure pipeline. The advanced technology is based on an enhanced version of the Remote Methane Leak Detector (RMLD) platform developed previously by Physical Sciences Inc. (PSI). The RMLD combines a telecommunications-style diode laser, fiber-optic components, and low-cost DSP electronics with the well-understood principles of Wavelength Modulation Spectroscopy (WMS), to indicate the presence of natural gas located between the operator and a topographic target. The system includes an optical transceiver and an electronic controller. The transceiver transmits a laser beam onto a topographic target and receives some of the laser light reflected by the target. The controller processes the received light signal to deduce the amount of methane in the laser’s path.
The currently-available lightweight, handheld, battery-powered RMLD provides a
maximum range to the topographic target of 100 ft. For use in the airborne platform, we are modifying three aspects of the RMLD, by: 1) inserting an optical fiber amplifier to increase the transmitted laser power from 10 mW to 5W; 2) increasing the optical receiver diameter from 10 cm to 25 cm; and 3) altering the laser wavelength from 1653 nm to 1618 nm. With the first two changes, the laser power collected by the receiver at 10,000 ft range will be comparable to that collected by the present RMLD at 100 ft range, permitting use of the RMLD electronic platform with no additional modifications. Shifting the detection wavelength allows us to utilize a state-of-the-art erbium-doped fiber amplifier (EDFA) to achieve 5W of laser power. This wavelength also eliminates cross-sensitivity to standard atmospheric gases and trace gases associated with petrochemical refineries, transportation systems, utility power plants, and other industrial operations. It is expected to provide a minimum path-integrated methane concentration sensitivity of 1000 ppm-m. This detection scenario should be sufficient to detect the presence of a leak from a high capacity transmission line while discriminating against attenuation by ambient methane.
3
Previously Reported Work Completed During the previous reporting period, covering the first six-months of the 24-month
project, we completed several initial inter-related tasks preparing for assembly and testing of the airborne sensors. These tasks were:
• Spectral Analysis, Wavelength Selection, and Sensitivity Estimate • Amplifier Selection and characteristics • Aircraft Selection • System Specification • Optical Components Selection • Optical Components Configuration • Seed Laser Testing • DMD algorithm development
In the Spectral Analysis task, we compared the spectral absorbance from a methane leak
with absorbance by other atmospheric molecules. The outcome was selection of a wavelength (1618.0 nm or 6180.6 cm-1) for detecting methane that minimizes cross-sensitivities. With this wavelength selection, we were able to estimate the sensitivity to methane leaks, and specify and order the required laser amplifier. In the Aircraft Selection task, we searched for aircraft suitable for testing the airborne leak detection system and found one that is ideal. With knowledge of the aircraft dimensions and utilities, we could specify the components for the optical transmitter and receiver and design a configuration for straightforward installation in the aircraft. Finally, after purchasing these components, we began testing, starting with the un-amplified 1618 nm seed laser installed on an RMLD platform. We also implemented, on this platform, a novel audio algorithm enabling leak detection based on the rate of change of path integrated methane concentration.
Summary of Work Completed in Current Reporting Period
During the current reporting period, covering the second 6-months of the 24-month
project, we: • Received the Laser Amplifier • Characterized the Amplifier Performance • Evaluated Methane Detection Limits of the amplified laser system • Assembled and aligned the high-altitude optical transceiver • Combined the transceiver and amplified laser to form the complete sensor system • Commenced outdoor system tests
The task of characterizing the amplifier performance included verifying that its power and spectral output conformed with manufacturer’s specifications, and evaluating its output response to temporal modulation of wavelength and power input from the seed laser. We evaluated the methane detection limit of the amplified system in well-controlled laboratory conditions. These data provided a baseline for the best sensitivity that we would expect to obtain during field operation. In parallel with these activities, we assembled the optical transceiver according to the

4
design described in our previous report. With the aid of a visible laser we aligned the transceiver, and we tested its performance using the un-amplified seed laser. Finally, we installed the optical amplifier, completing the assembly of the high-altitude RMLD system. At the end of the reporting period we began testing the system, and demonstrated detection of laser light scattered from targets up to 2000 m distant. Details of these accomplishments follow. Amplifier Characterization
Characterization of the amplifier means quantifying the amplified laser power and
wavelength as a function of time as the amplifier responds to changes in power and wavelength of the seed laser. These characteristics determine the sensitivity to spectral absorption by methane, and thus determine the methane detection limits. To describe the characterization methodology, we first describe the fundamental measurement principles, and follow with a discussion of the un-amplified seed laser characteristics. We then compare the seed laser characteristics with those of the amplified laser. Principles of Wavelength Modulation Spectroscopy
TDLAS gas analyzers rely on well-known spectroscopic principles and sensitive
detection techniques. When electromagnetic radiation transits a path containing a target gas, the radiation is attenuated according to the Beer-Lambert relation: [ ]lNS(T)gPP )(exp 00, νννν −−= (1) where: Pν,0 is the power launched at frequency ν Pν is the power received at frequency ν ν is the electromagnetic frequency ℓ is the path length through the gas S(T) is the temperature-dependent absorption line-strength (a fundamental spectroscopic
property of the molecule) N is the target species number density, and g(ν - ν0) the pressure-dependent lineshape function, describes the frequency dependence of
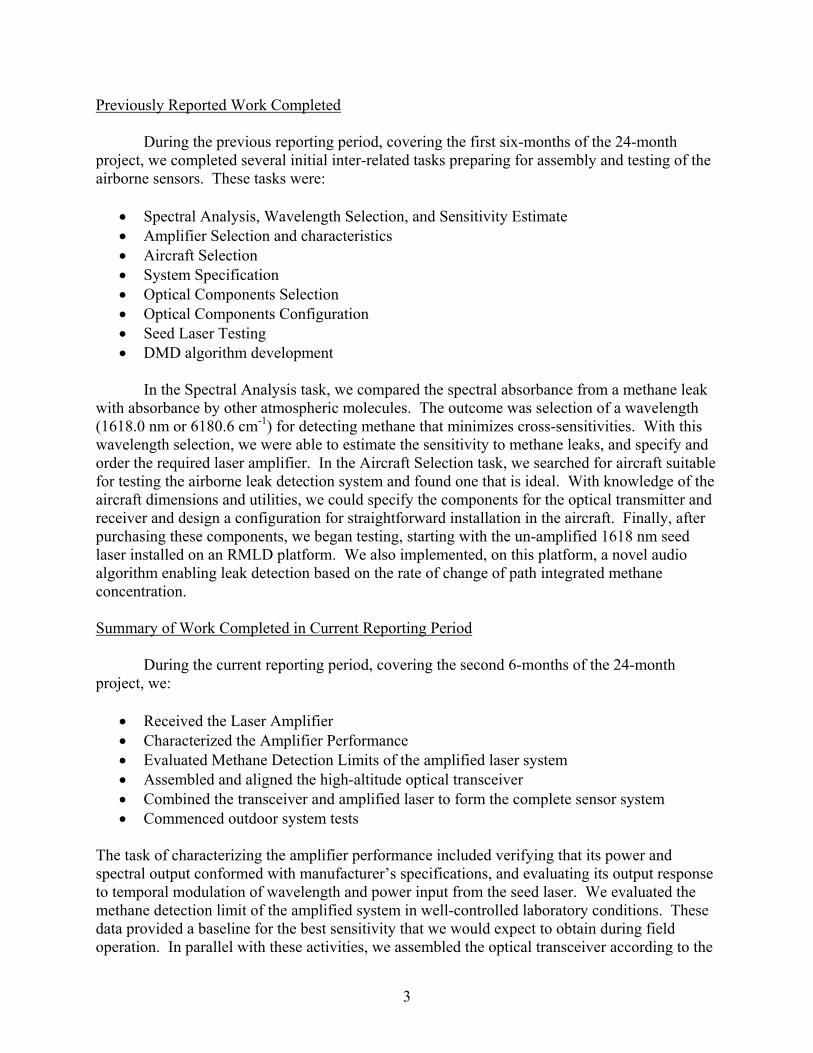
the absorption feature strength. The argument of the exponential function, i.e. S(T)g(ν - ν0)Nℓ = ln(Pν,0/ Pν), is the fractional change in the laser intensity across the measurement path and is conventionally known as the absorbance. The gas analyzer accurately measures the absorbance and, via calibration or calculation, deduces Nℓ. This measurement is usually expressed in units of ppm-m. Figure 1 shows the absorbance vs frequency of the 6180.6 cm-1 methane spectral feature, calculated using the HITRAN database. Note that this feature, which appears to be a single line at atmospheric pressure, resolves into a pair of lines at reduced pressure.
5
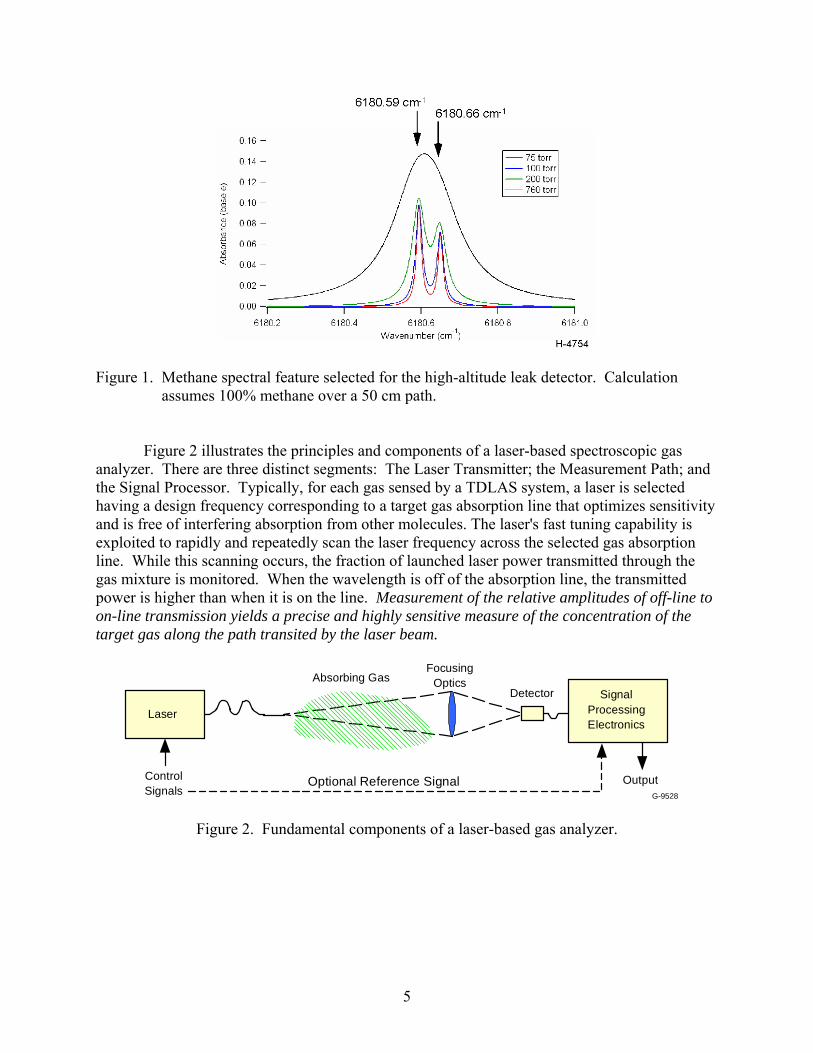
Figure 1. Methane spectral feature selected for the high-altitude leak detector. Calculation
assumes 100% methane over a 50 cm path. Figure 2 illustrates the principles and components of a laser-based spectroscopic gas analyzer. There are three distinct segments: The Laser Transmitter; the Measurement Path; and the Signal Processor. Typically, for each gas sensed by a TDLAS system, a laser is selected having a design frequency corresponding to a target gas absorption line that optimizes sensitivity and is free of interfering absorption from other molecules. The laser's fast tuning capability is exploited to rapidly and repeatedly scan the laser frequency across the selected gas absorption line. While this scanning occurs, the fraction of launched laser power transmitted through the gas mixture is monitored. When the wavelength is off of the absorption line, the transmitted power is higher than when it is on the line. Measurement of the relative amplitudes of off-line to on-line transmission yields a precise and highly sensitive measure of the concentration of the target gas along the path transited by the laser beam.
Laser
ControlSignals
SignalProcessingElectronics
Output
Detector
FocusingOpticsAbsorbing Gas
Optional Reference SignalG-9528
Figure 2. Fundamental components of a laser-based gas analyzer.
6
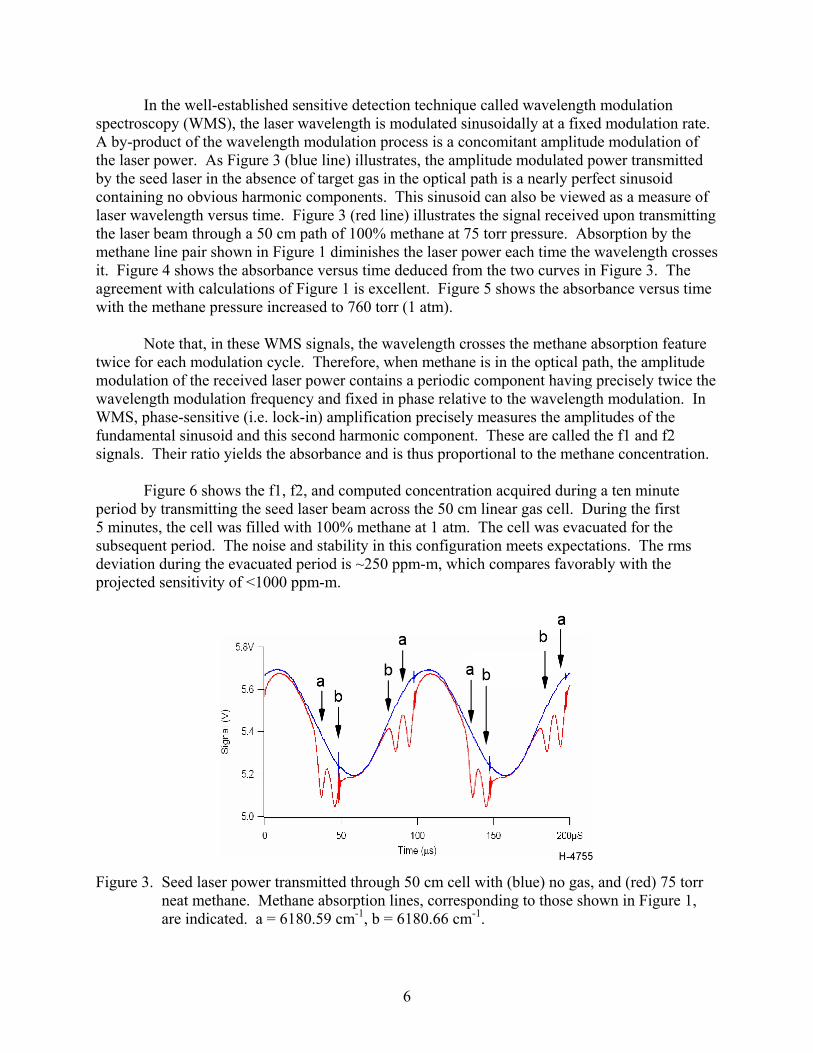
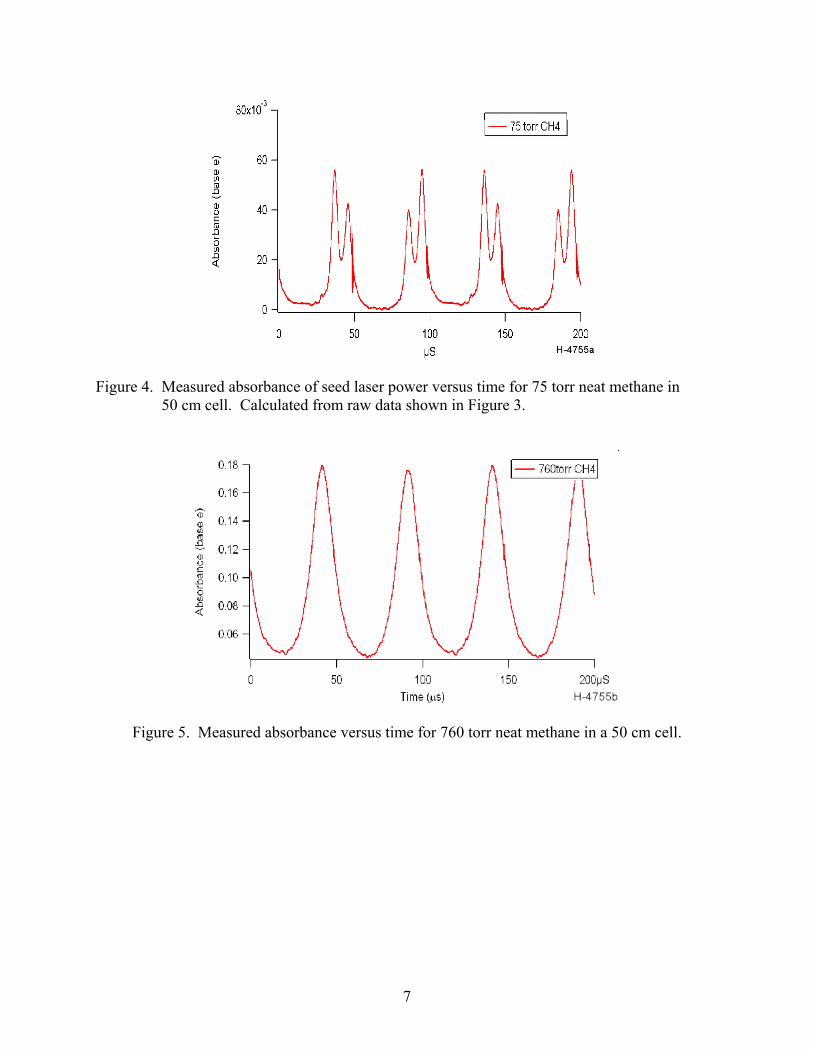
In the well-established sensitive detection technique called wavelength modulation spectroscopy (WMS), the laser wavelength is modulated sinusoidally at a fixed modulation rate. A by-product of the wavelength modulation process is a concomitant amplitude modulation of the laser power. As Figure 3 (blue line) illustrates, the amplitude modulated power transmitted by the seed laser in the absence of target gas in the optical path is a nearly perfect sinusoid containing no obvious harmonic components. This sinusoid can also be viewed as a measure of laser wavelength versus time. Figure 3 (red line) illustrates the signal received upon transmitting the laser beam through a 50 cm path of 100% methane at 75 torr pressure. Absorption by the methane line pair shown in Figure 1 diminishes the laser power each time the wavelength crosses it. Figure 4 shows the absorbance versus time deduced from the two curves in Figure 3. The agreement with calculations of Figure 1 is excellent. Figure 5 shows the absorbance versus time with the methane pressure increased to 760 torr (1 atm).
Note that, in these WMS signals, the wavelength crosses the methane absorption feature
twice for each modulation cycle. Therefore, when methane is in the optical path, the amplitude modulation of the received laser power contains a periodic component having precisely twice the wavelength modulation frequency and fixed in phase relative to the wavelength modulation. In WMS, phase-sensitive (i.e. lock-in) amplification precisely measures the amplitudes of the fundamental sinusoid and this second harmonic component. These are called the f1 and f2 signals. Their ratio yields the absorbance and is thus proportional to the methane concentration.
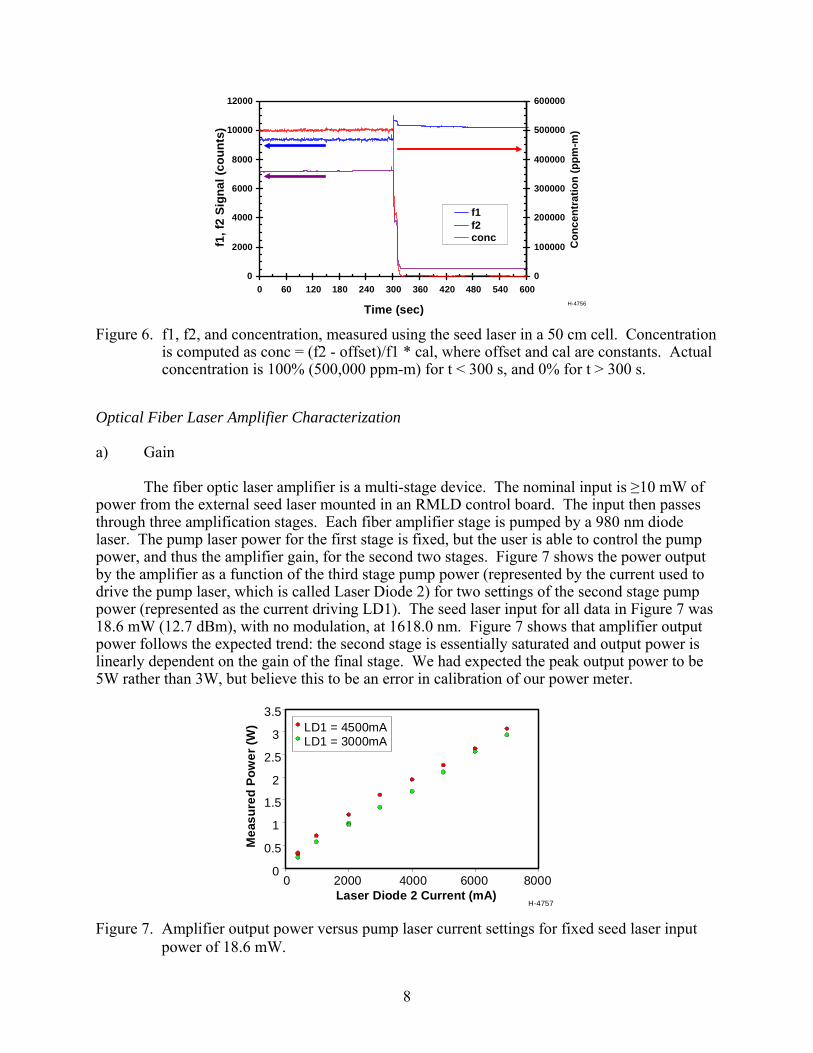
Figure 6 shows the f1, f2, and computed concentration acquired during a ten minute
period by transmitting the seed laser beam across the 50 cm linear gas cell. During the first 5 minutes, the cell was filled with 100% methane at 1 atm. The cell was evacuated for the subsequent period. The noise and stability in this configuration meets expectations. The rms deviation during the evacuated period is ~250 ppm-m, which compares favorably with the projected sensitivity of <1000 ppm-m.
Figure 3. Seed laser power transmitted through 50 cm cell with (blue) no gas, and (red) 75 torr
neat methane. Methane absorption lines, corresponding to those shown in Figure 1, are indicated. a = 6180.59 cm-1, b = 6180.66 cm-1.
7
Figure 4. Measured absorbance of seed laser power versus time for 75 torr neat methane in 50 cm cell. Calculated from raw data shown in Figure 3.
Figure 5. Measured absorbance versus time for 760 torr neat methane in a 50 cm cell.
8
0
2000
4000
6000
8000
10000
12000
0 60 120 180 240 300 360 420 480 540 600
Time (sec)
f1,f
2Si
gnal
(cou
nts)
0
100000
200000
300000
400000
500000
600000
Con
cent
ratio
n(p
pm-m
)
f1f2conc
H-4756
Figure 6. f1, f2, and concentration, measured using the seed laser in a 50 cm cell. Concentration
is computed as conc = (f2 - offset)/f1 * cal, where offset and cal are constants. Actual concentration is 100% (500,000 ppm-m) for t < 300 s, and 0% for t > 300 s.
Optical Fiber Laser Amplifier Characterization a) Gain The fiber optic laser amplifier is a multi-stage device. The nominal input is ≥10 mW of power from the external seed laser mounted in an RMLD control board. The input then passes through three amplification stages. Each fiber amplifier stage is pumped by a 980 nm diode laser. The pump laser power for the first stage is fixed, but the user is able to control the pump power, and thus the amplifier gain, for the second two stages. Figure 7 shows the power output by the amplifier as a function of the third stage pump power (represented by the current used to drive the pump laser, which is called Laser Diode 2) for two settings of the second stage pump power (represented as the current driving LD1). The seed laser input for all data in Figure 7 was 18.6 mW (12.7 dBm), with no modulation, at 1618.0 nm. Figure 7 shows that amplifier output power follows the expected trend: the second stage is essentially saturated and output power is linearly dependent on the gain of the final stage. We had expected the peak output power to be 5W rather than 3W, but believe this to be an error in calibration of our power meter.
0
0.5
1
1.5
2
2.5
3
3.5
0 2000 4000 6000 8000Laser Diode 2 Current (mA)
Mea
sure
dPo
wer
(W) LD1 = 4500mA
LD1 = 3000mA
H-4757
Figure 7. Amplifier output power versus pump laser current settings for fixed seed laser input
power of 18.6 mW.
9
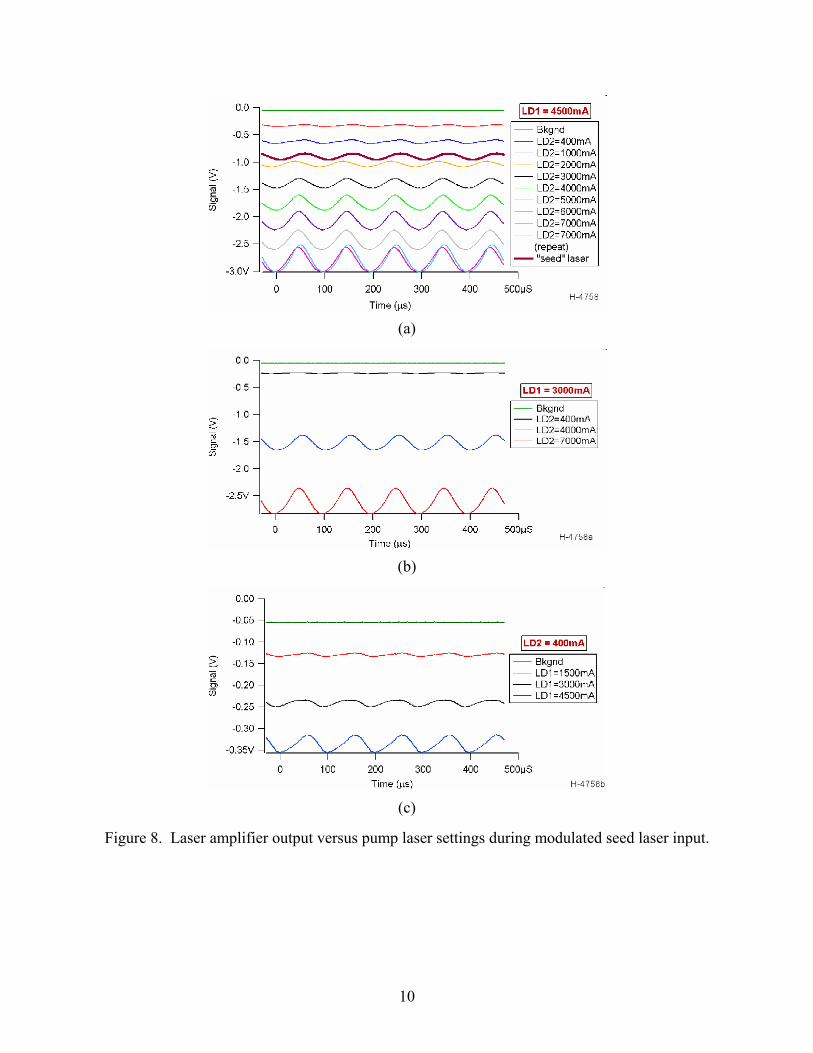
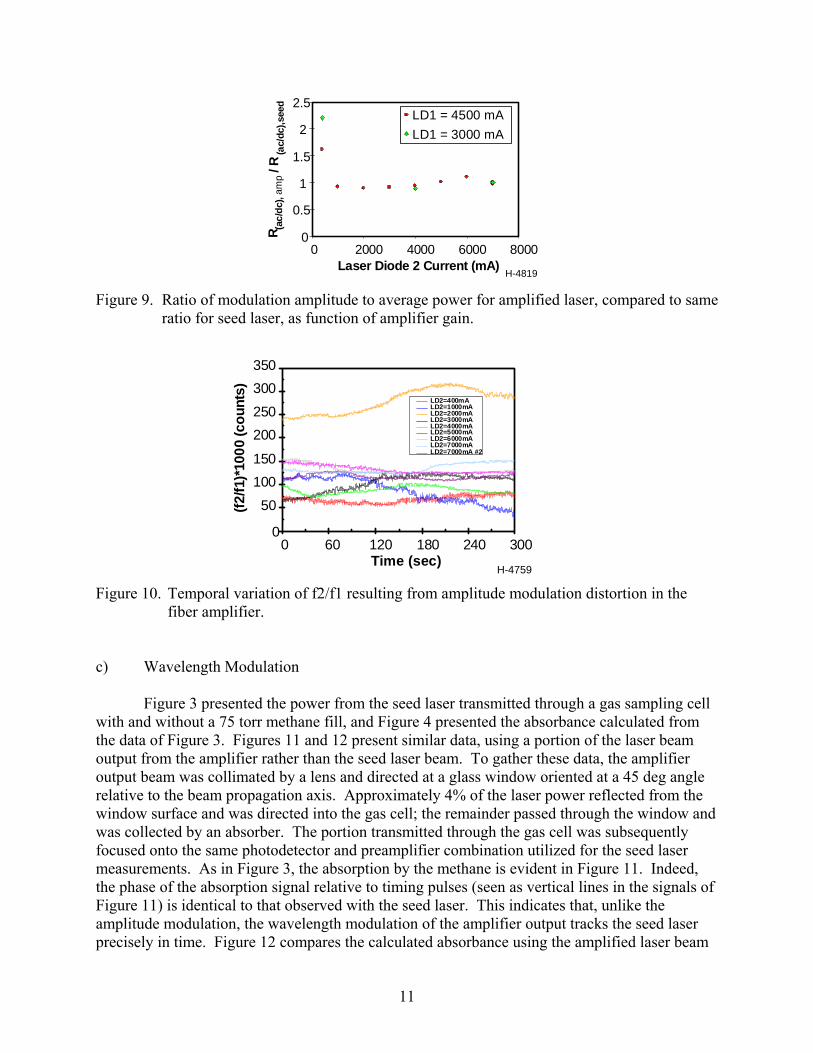
b) Amplitude Modulation Figures 8(a)-(c) show measurements of amplifier output power as functions of time in response to modulation of the seed laser input. These data were acquired by directing the amplifier output beam at a black scattering target and collecting a small amount of the scattered power with a 1 mm diameter InGaAs detector followed by an electronic pre-amplifier. The pre-amplifier output was recorded by a digital storage oscilloscope. The oscilloscope was synchronized with the modulation of the seed laser. The seed laser was monitored by using an optical fiber splitter to extract about 5% of the seed laser power into a second path that terminates at a second detector and pre-amplifier which provides input to a second oscilloscope channel. The seed laser signal is shown as one trace in Figure 8(a). Note that signal magnitude increases in a negative (downward) direction. The data of Figure 8 reveal several amplifier characteristics: 1) The amplifier output power exhibits amplitude modulation that roughly follows the amplitude modulation of the seed laser. This observation was not previously expected. Indeed, since Figure 7 indicates that the second stage of the amplifier appears to be saturated such that the output of the final stage is nearly independent of second stage gain, we had anticipated that variations of seed laser power would not be transmitted through the amplifier. This may be true for slowly varying inputs, but the dynamic response of the amplifier obviously transmits the 10 kHz amplitude modulation. Furthermore, the gain of the amplitude modulation is approximately the same as the overall amplifier gain. This is illustrated by Figure 9, where we plot the ratio of the modulation amplitude to the average power output from the amplifier, divided by the same ratio for the seed laser. This ratio is close to unity for all operating conditions (except very low gain). Although the seed laser amplitude modulation is transmitted by the amplifier, the amplifier output is not a perfect replica of the input. Visual examination of the data in Figure 8 shows that the amplifier output is generally shifted in phase compared to the input, and the output is distorted, i.e., the waveforms are not perfect sinusoids like the input. The implication of this latter observation is that the amplifier output power contains frequency components which can contribute to the f2 signal utilized to measure methane. If the distortion was invariant over time, then it would contribute a fixed offset to f2 that could be removed by subtraction. However, the distortion actually varies over time and can therefore be confused with a signal due to methane. The bottom trace in Figure 8(a) shows the amplifier output at maximum gain gathered at two distinct times separated by a few seconds. The deviation from perfect overlap is the indicator that the amplifier distortion varies over time. This variability is quantified in Figure 10, which plots the ratio f2/f1 for various settings of amplifier gain. We note that f1, which is a measure of the amplitude modulation at the fundamental frequency, is stable to better than 3%. However, even in the best case (maximum gain), the f2 signal exhibits drifts, with periods of minutes, having magnitudes that are nearly 20% of the average value. The implication of this drift for gas measurement will be discussed below, but first we describe the amplifier response to wavelength modulation.
10
(a)
(b)
(c)
Figure 8. Laser amplifier output versus pump laser settings during modulated seed laser input.
11
0
0.5
1
1.5
2
2.5
0 2000 4000 6000 8000Laser Diode 2 Current (mA)
R (ac/
dc),
amp
/R(a
c/dc
),see
dH-4819
LD1 = 4500 mALD1 = 3000 mA
Figure 9. Ratio of modulation amplitude to average power for amplified laser, compared to same
ratio for seed laser, as function of amplifier gain.
0
50100150
200250300350
0 60 120 180 240 300
(f2/f1
)*10
00(c
ount
s)
LD2=400mALD2=1000mALD2=2000mALD2=3000mALD2=4000mALD2=5000mALD2=6000mALD2=7000mALD2=7000mA #2
Time (sec)H-4759
Figure 10. Temporal variation of f2/f1 resulting from amplitude modulation distortion in the fiber amplifier.
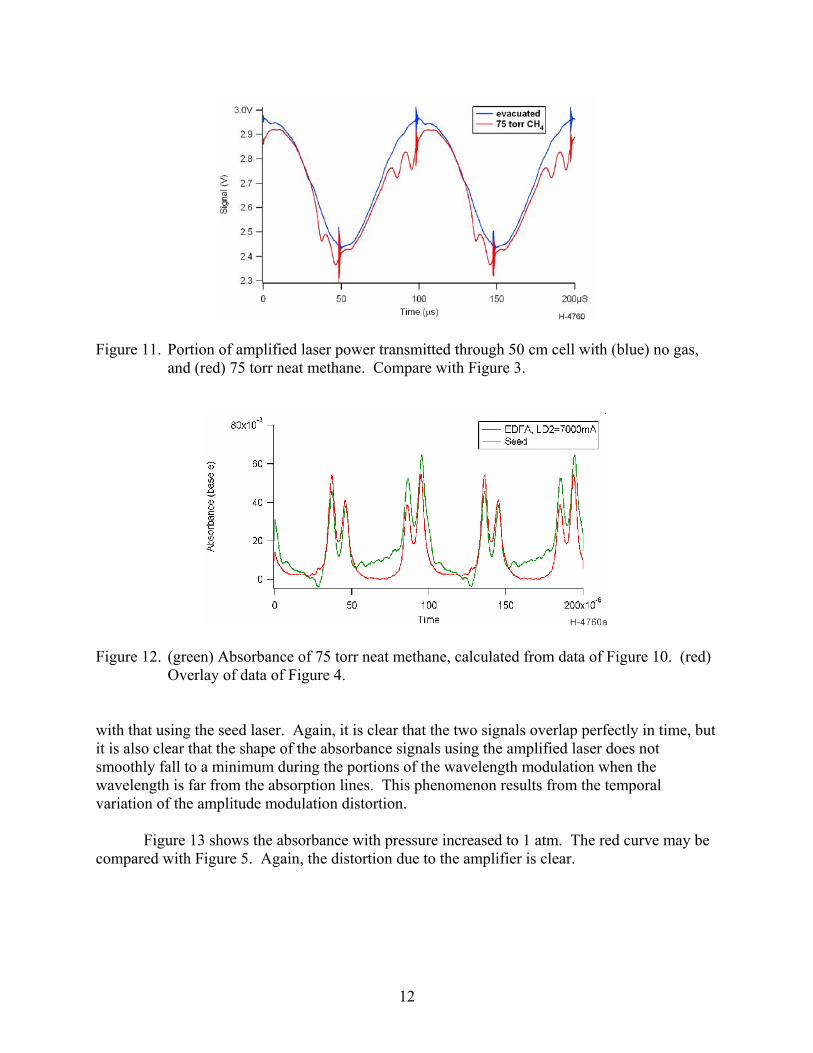
c) Wavelength Modulation Figure 3 presented the power from the seed laser transmitted through a gas sampling cell with and without a 75 torr methane fill, and Figure 4 presented the absorbance calculated from the data of Figure 3. Figures 11 and 12 present similar data, using a portion of the laser beam output from the amplifier rather than the seed laser beam. To gather these data, the amplifier output beam was collimated by a lens and directed at a glass window oriented at a 45 deg angle relative to the beam propagation axis. Approximately 4% of the laser power reflected from the window surface and was directed into the gas cell; the remainder passed through the window and was collected by an absorber. The portion transmitted through the gas cell was subsequently focused onto the same photodetector and preamplifier combination utilized for the seed laser measurements. As in Figure 3, the absorption by the methane is evident in Figure 11. Indeed, the phase of the absorption signal relative to timing pulses (seen as vertical lines in the signals of Figure 11) is identical to that observed with the seed laser. This indicates that, unlike the amplitude modulation, the wavelength modulation of the amplifier output tracks the seed laser precisely in time. Figure 12 compares the calculated absorbance using the amplified laser beam
12
Figure 11. Portion of amplified laser power transmitted through 50 cm cell with (blue) no gas,
and (red) 75 torr neat methane. Compare with Figure 3.
Figure 12. (green) Absorbance of 75 torr neat methane, calculated from data of Figure 10. (red) Overlay of data of Figure 4.
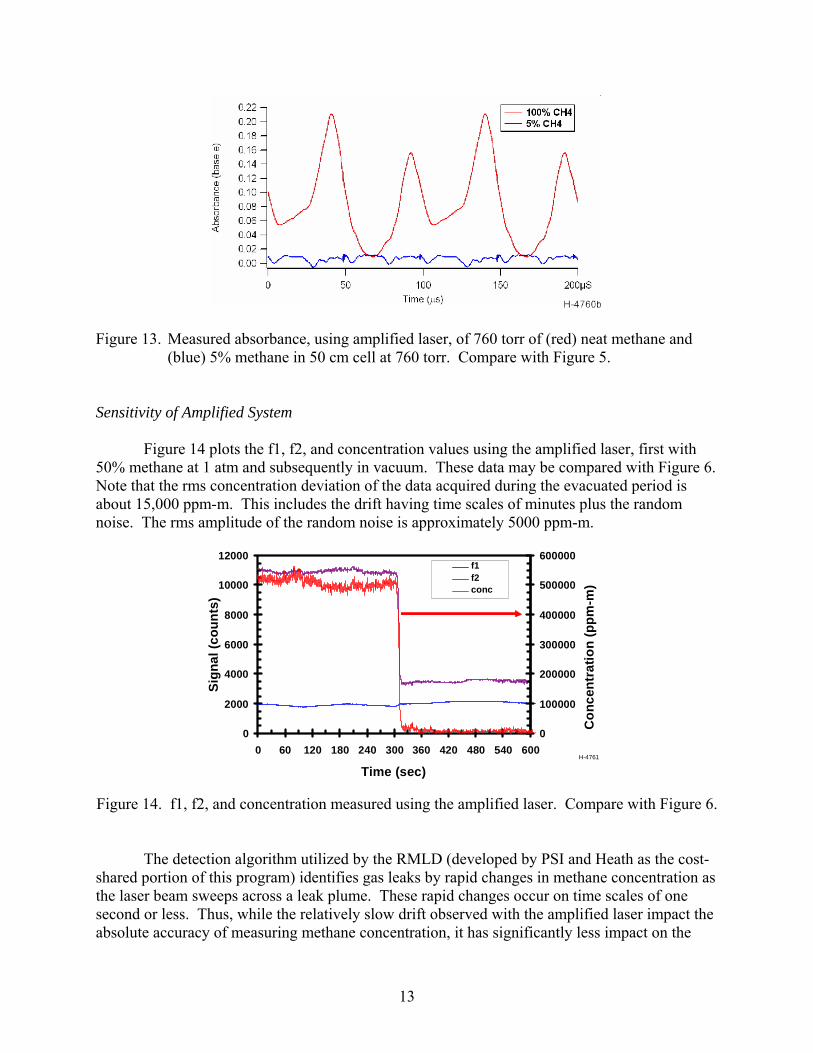
with that using the seed laser. Again, it is clear that the two signals overlap perfectly in time, but it is also clear that the shape of the absorbance signals using the amplified laser does not smoothly fall to a minimum during the portions of the wavelength modulation when the wavelength is far from the absorption lines. This phenomenon results from the temporal variation of the amplitude modulation distortion. Figure 13 shows the absorbance with pressure increased to 1 atm. The red curve may be compared with Figure 5. Again, the distortion due to the amplifier is clear.
13
Figure 13. Measured absorbance, using amplified laser, of 760 torr of (red) neat methane and (blue) 5% methane in 50 cm cell at 760 torr. Compare with Figure 5.
Sensitivity of Amplified System Figure 14 plots the f1, f2, and concentration values using the amplified laser, first with 50% methane at 1 atm and subsequently in vacuum. These data may be compared with Figure 6. Note that the rms concentration deviation of the data acquired during the evacuated period is about 15,000 ppm-m. This includes the drift having time scales of minutes plus the random noise. The rms amplitude of the random noise is approximately 5000 ppm-m.
0
2000
4000
6000
8000
10000
12000
0 60 120 180 240 300 360 420 480 540 600
Time (sec)
Sign
al(c
ount
s)
0
100000
200000
300000
400000
500000
600000
Con
cent
ratio
n(p
pm-m
)
f1f2conc
H-4761
Figure 14. f1, f2, and concentration measured using the amplified laser. Compare with Figure 6.
The detection algorithm utilized by the RMLD (developed by PSI and Heath as the cost-shared portion of this program) identifies gas leaks by rapid changes in methane concentration as the laser beam sweeps across a leak plume. These rapid changes occur on time scales of one second or less. Thus, while the relatively slow drift observed with the amplified laser impact the absolute accuracy of measuring methane concentration, it has significantly less impact on the
14
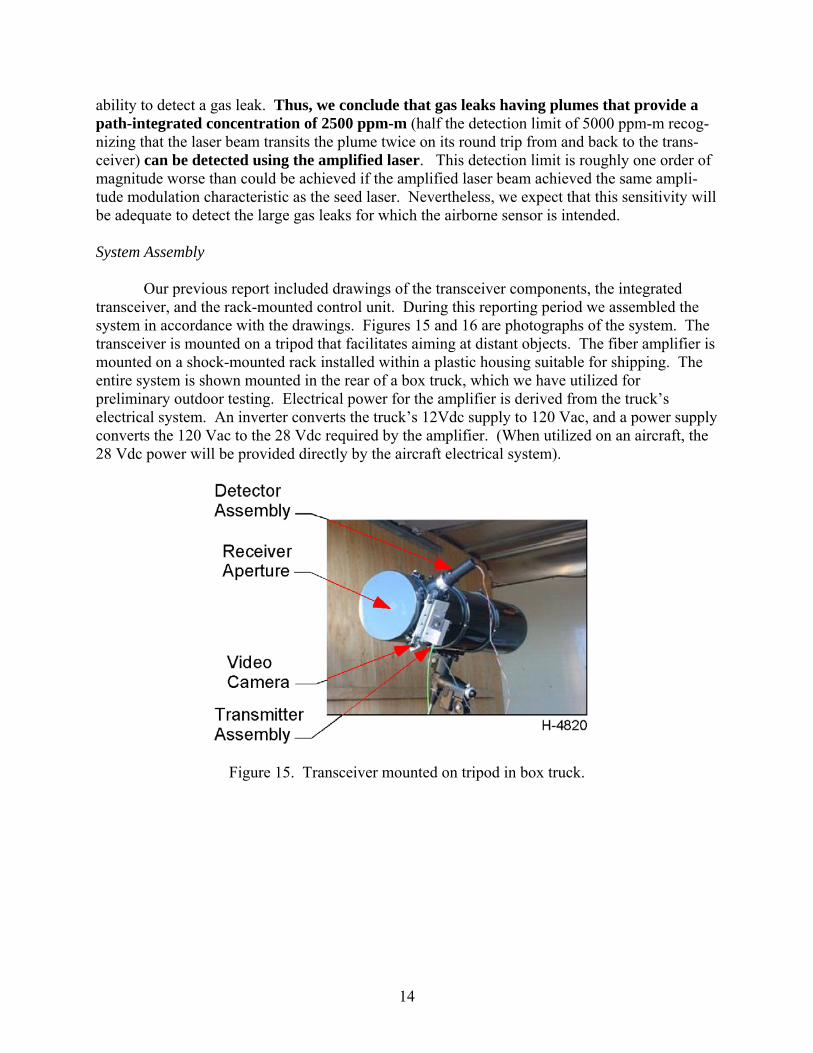
ability to detect a gas leak. Thus, we conclude that gas leaks having plumes that provide a path-integrated concentration of 2500 ppm-m (half the detection limit of 5000 ppm-m recog-nizing that the laser beam transits the plume twice on its round trip from and back to the trans-ceiver) can be detected using the amplified laser. This detection limit is roughly one order of magnitude worse than could be achieved if the amplified laser beam achieved the same ampli-tude modulation characteristic as the seed laser. Nevertheless, we expect that this sensitivity will be adequate to detect the large gas leaks for which the airborne sensor is intended. System Assembly Our previous report included drawings of the transceiver components, the integrated transceiver, and the rack-mounted control unit. During this reporting period we assembled the system in accordance with the drawings. Figures 15 and 16 are photographs of the system. The transceiver is mounted on a tripod that facilitates aiming at distant objects. The fiber amplifier is mounted on a shock-mounted rack installed within a plastic housing suitable for shipping. The entire system is shown mounted in the rear of a box truck, which we have utilized for preliminary outdoor testing. Electrical power for the amplifier is derived from the truck’s electrical system. An inverter converts the truck’s 12Vdc supply to 120 Vac, and a power supply converts the 120 Vac to the 28 Vdc required by the amplifier. (When utilized on an aircraft, the 28 Vdc power will be provided directly by the aircraft electrical system).
Figure 15. Transceiver mounted on tripod in box truck.
15
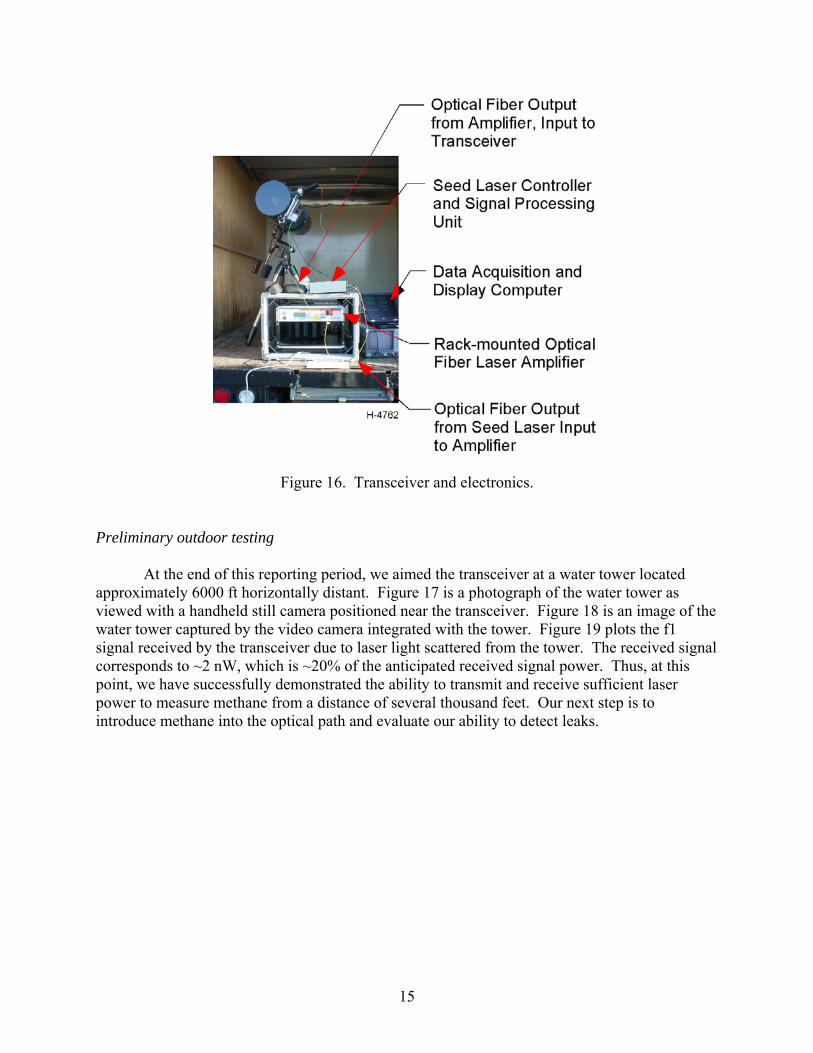
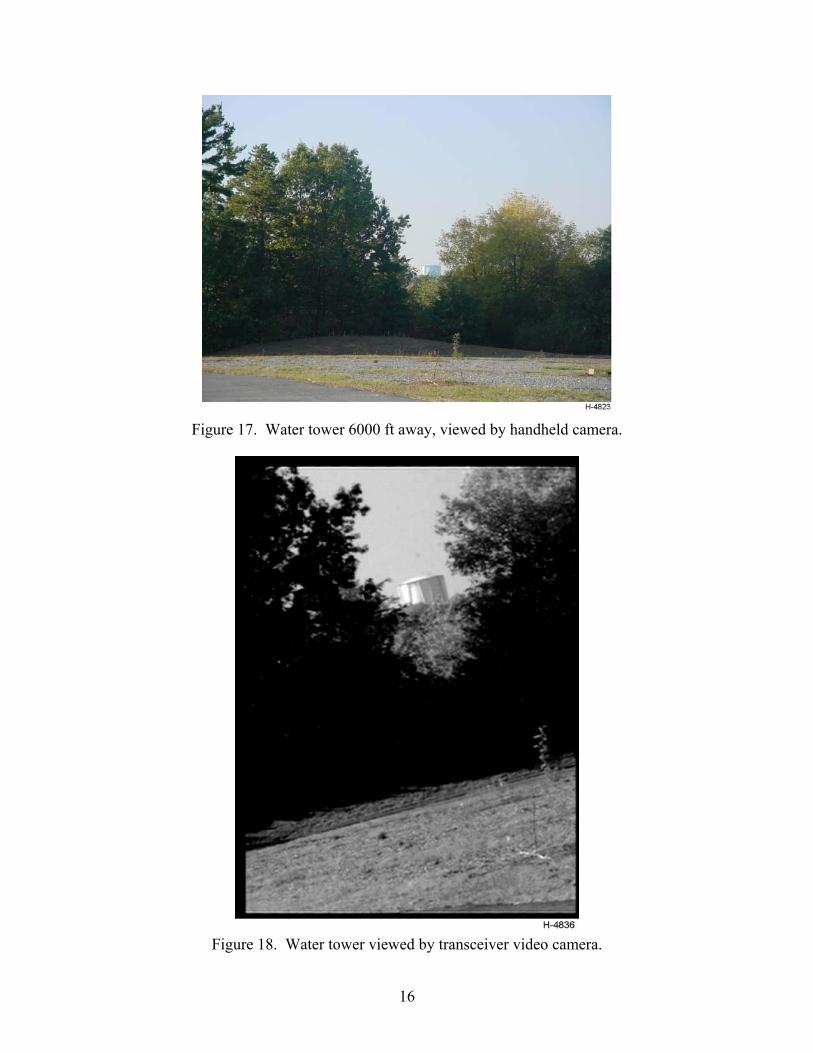
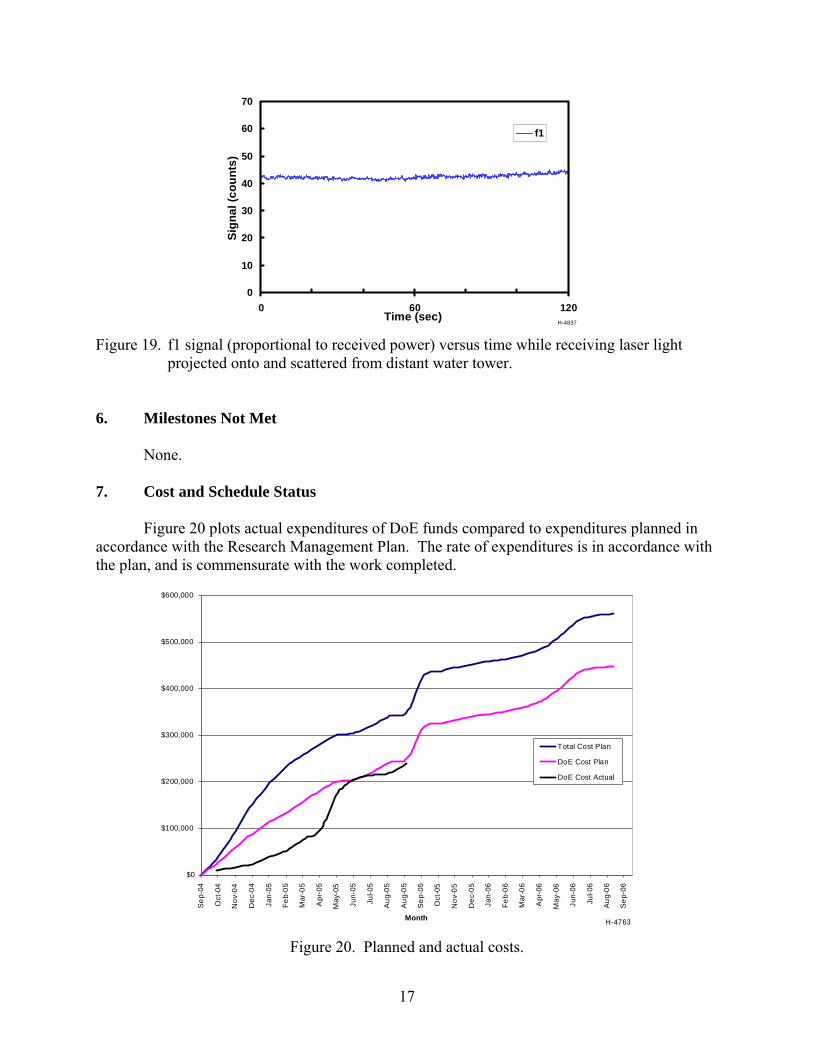
Figure 16. Transceiver and electronics. Preliminary outdoor testing At the end of this reporting period, we aimed the transceiver at a water tower located approximately 6000 ft horizontally distant. Figure 17 is a photograph of the water tower as viewed with a handheld still camera positioned near the transceiver. Figure 18 is an image of the water tower captured by the video camera integrated with the tower. Figure 19 plots the f1 signal received by the transceiver due to laser light scattered from the tower. The received signal corresponds to ~2 nW, which is ~20% of the anticipated received signal power. Thus, at this point, we have successfully demonstrated the ability to transmit and receive sufficient laser power to measure methane from a distance of several thousand feet. Our next step is to introduce methane into the optical path and evaluate our ability to detect leaks.
16
Figure 17. Water tower 6000 ft away, viewed by handheld camera.
Figure 18. Water tower viewed by transceiver video camera.
17
0
10
20
30
40
50
60
70
0 60 120Time (sec)
Sign
al(c
ount
s)
f1
H-4837 Figure 19. f1 signal (proportional to received power) versus time while receiving laser light
projected onto and scattered from distant water tower. 6. Milestones Not Met
None.
7. Cost and Schedule Status
Figure 20 plots actual expenditures of DoE funds compared to expenditures planned in accordance with the Research Management Plan. The rate of expenditures is in accordance with the plan, and is commensurate with the work completed.
$0
$100,000
$200,000
$300,000
$400,000
$500,000
$600,000
Sep
-04
Oct
-04
Nov
-04
Dec
-04
Jan-
05
Feb-
05
Mar
-05
Apr
-05
May
-05
Jun-
05
Jul-0
5
Aug
-05
Aug
-05
Sep
-05
Oct
-05
Nov
-05
Dec
-05
Jan-
06
Feb-
06
Mar
-06
Apr
-06
May
-06
Jun-
06
Jul-0
6
Aug
-06
Sep
-06
Month
Total Cost Plan
DoE Cost Plan
DoE Cost Actual
H-4763
Figure 20. Planned and actual costs.
18
8. Summary of Significant Accomplishments At the end of this reporting period, the essential elements of the aerial natural gas leak
detection system have been assembled. The fiber optic laser amplifier performance has been evaluated in the laboratory, and the amplifier has been integrated into the complete system. Preliminary outdoor tests have commenced. 9. Problems and Delays Previously reported delays have been resolved, and the project is currently on schedule. As described in this report, the system sensitivity to methane, when using the laser amplifier, is not a good as originally anticipated, but is expected to be adequate for the leak detection application. 10. Technology Transfer Activities The leak detection algorithm described herein has been provided to our cost-share and commercialization partner, Heath Consultants Inc. Heath is incorporating the algorithm into their handheld gas leak sensor product, the RMLD, which Heath licensed from PSI.