journal of membrane science & research fresh and
TRANSCRIPT

Keywords
Highlights
Abstract
Graphical abstract
173
Research Paper
Received 2020-03-10Revised 2020-08-18Accepted 2020-08-18Available online 2020-08-18
Solution blow spinningNanofiber membranePANPVDFMethylene blue removalAdsorption capacity
• Cheap, easy to fabricate and direct use of SBS-spun nanofibers for wastewater MB dye absorption.
• “No pre-treatment” use of PAN and PVDF nanofibers as comparatively effective for MB dye removal.
• Investigation of MB initial concentration and adsorption contact time of SBS-spun PAN and PVDF membranes for MB dye removal.
• Investigation of different adsorption isotherms (i.e., Langmuir, Freundlich, and Dubinin-Radushkevich) in predicting the maximum adsorption capacities of SBS-spun PAN and PVDF membranes for MB dye removal.
Journal of Membrane Science and Research 7 (2021) 173-184
Fresh and Uncalcined Solution Blow Spinning - Spun PAN and PVDF Nanofiber Membranes for Methylene Blue Dye Removal in Water
1 Chemical Engineering Department, Xavier University – Ateneo de Cagayan, Corrales Avenue, Cagayan de Oro City, 9000 Philippines2 Department of Chemical Engineering, University of San Carlos, Nasipit, Talamban, Cebu City, 6000 Philippines
Shierlyn S. Paclijan 1, Shenn Mae B. Franco 1, Rodrigo B. Abella 1, Jona Crishelle H. Lague 1, Noel Peter B. Tan 2,*
Article info
© 2021 MPRL. All rights reserved.
* Corresponding author:E-mail address: [email protected]; [email protected] (N.P.B. Tan)
DOI: 10.22079/JMSR.2020.122267.1356
1. Introduction
Dyes are organic compounds used by many industries that require coloring in their products such as in fabrics, food and beverages, and papers. With the increasing rate of industrialization, the usage of these dyes sequentially increases the release of dye waste in land and bodies of water [1]. Among these organic dyes produced, methylene blue (MB) is utilized in many products such as silk, cosmetics, and both in chemical and biological laboratory procedures. Even though it is not actively hazardous, harmful effects to humans are inevitable. These effects include vomiting, increased heart rate, Heinz body formation, cyanosis, quadriplegia, jaundice, and tissue necrosis [2].
Various way to remove dyes in solutions, are categorized into three
parts, namely biological, chemical, and physical means. Biological methods such as aerobic processes, anaerobic processes, or a combination of both are commonly used techniques in the removal of dye from bodies of water. However, these processes require strict operating conditions and are less efficient in dye removal [3]. Chemical methods, on the other hand, are based on electrochemical oxidation, advanced oxidation, and photocatalysis of dyes. Significant drawbacks of these processes include the requirement of highly efficient oxidative catalysts and the need for an additional oxidative agent [4]. Physical methods involve membrane separation technologies and adsorption methods. Among the physical techniques, adsorption has remained to be the widely used techniques toxic trace metals and persistent organic micro-
Journal of Membrane Science & Research
journal homepage: www.msrjournal.com
Freshly produced and uncalcined solution blow spun-poly (acrylonitrile) (PAN) and poly (vinylidene fluoride) (PVDF) nanofiber (NF) membranes were utilized as adsorptive membranes for methylene blue (MB) dye in water under batch adsorption. The effects of various initial dye solution concentrations (3-15 mg/L) and contact time (1-10 minutes) versus its adsorption capabilities of the nanofiber membranes were studied. Furthermore, adsorption isotherm that best fit the experimental data was determined. The equilibrium adsorption capacity, qe, for both nanofiber membranes increased with MB concentration of 3 - 7 mg/L but qe considerably decreased when such MB amounts increased to 15 mg/L. The highest qe obtained was 50.78 and 34.97 mg/g for PAN NF and PVDF NF membranes, respectively. Both NF membranes also showed high MB adsorption with increased contact time until equilibrium was reached. PAN demonstrated better adsorption capacity compared to PVDF at all levels of initial dye concentrations studied. Both nanofiber membranes are proposed to conform to the Dubinin-Radushkevich adsorption isotherm model. Using this model, the predicted values for the highest adsorption capacity, qmax, of PAN and PVDF NF membranes are 55.91 mg/g and 44.06 mg/g, respectively.

S.S. Paclijan et al. / Journal of Membrane Science and Research 7 (2021) 173-184
pollutants removal from water. It is a superior technique considering its cost,
design, and operation [5]. The use of nanofiber membranes is widely popular nowadays due to its
chemical nature, surface polarity, surface area, and structure. These unique
characteristics influence the attractive force between the adsorbate and adsorbent [6]. Numerous ways are developed to fabricate nanofiber
membranes. These methods include solution intercalation [7], centrifugal
spinning [8], melt blowing [9], and electrospinning [10]. However, these methods have their drawbacks, such as usage of large amounts of organic
solvents and limited for specific polymer/solvent pairs [7] for solution
intercalation which is environmentally unfriendly, low fiber efficiency for electrospinning [10], and strict thermoplastic polymers precursor for the case
of melt blowing. [9] Therefore, there is a need for a more straightforward and
economical, yet effective, method in producing nanofiber membranes as adsorbents for industrial wastes. The main advantage of solution blow
spinning over the electrospinning method is the high production rate. Such a
rate goes over thirty times greater than the conventional electrospinning. Solution blow spinning also does not need electricity to produce nanofibers
from the polymer precursor. Compared to electrospinning, it needs high
voltage (i.e., 10 – 2- kV), which implies some safety issues. On the other
hand, the main disadvantage of this technology is its selectivity of application
and the quality of the nanofibers can be different from electrospinning.
Solution blow spinning nanofibers may produce bundled nanofibers. An excellent method of producing the nanofiber membrane has emerged
in the past two decades. This process is called Solution Blow Spinning. Such
process is a hybrid of both melt-blowing and electrospinning. Solution blow spinning is a relatively new method to sythesize nano to microfibers using
polymer solutions without voltage requirements [11]. Such a method deposits
more polymers at a rapid rate. It also provides micro to nanosize fibers whose quality is the same as that of electrospinning [12]. Such technology depends
on the gas velocity, usually air as a fiber-forming mechanism by blowing
substrate solutions into a concentric nozzle to produce nanofibers [13]. Different types of polymer precursors have been used in Solution blow
spinning for nanofiber synthesis. Precursors range from synthetic [14] to bio-
based and biocompatible sources [15]. Solution blow spinning method has received attention because of its smooth operation with a high production rate
[16]. Solution blow spun nanofiber membranes manifest properties such as
high surface area-to-volume ration and porosity, capable for different solutions to air [17] and water pollution remediation [12, 18]. Another feature
of this technology is that it is able to produce nanofibers with cellulose
precursor and ceramic additives. Such ability was demonstrated in the work of Dadol et al. [19] for cellulose with PAN and Tan et al. [20] for TiO2 and
PVP.
In this study, solution blow spinning was used for producing different nanofibers, namely poly (acrylonitrile) and poly (vinylidene fluoride). They
are investigated for their potential as adsorbents for MB dye in solutions.
PAN and PVDF nanofiber membranes were chosen in this study since these two polymers are commonly used in the production of many commercial
membranes. They are also easily fabricated through solution blow spinning
technique. These nanofiber materials are similar to those investigated for the efficient capture of PM2.5 when embedded on commercial surgical masks
[21]. However, the uncalcined and freshly produced nanofiber membranes were directly used as adsorbents for MB dye. These membranes are unique
from other existing adsorption studies since no pretreatments of the
membrane were carried out. Therefore this type of membrane production
addresses the need for a simple, rapid, and industrially scalable process. There
are two significant values in this work. 1) This is the first time that a solution
blow spun PAN and PVDF nanofiber membranes were utilized directly for adsorbing MB from simulated water. 2) Results showed that the performance
of both fresh and uncalcined PAN and PVDF nanofiber membranes are
competitive enough compared to some published performance of different materials for MB adsorption. If published, this research work will be a
benchmark for future cost-effective method of nanofiber membrane
fabrication for industrial wastewater. Furthermore, this study opens up more opportunities for the development of in-situ use of cost effective nanofiber
membranes.
2. Experimental
2.1. Materials
Poly (acrylonitrile) (PAN, Mw =150 kDa), Poly (vinylidene fluoride) (PVDF, Mw = 180 kDa), Dimethyl formamide (DMF) and acetone were all
purchased from Sigma-Aldrich. Methylene blue (MB), a cationic dye with CI
Classification Number of 52015 was obtained from Merteflor Enterprises with brand HiMedia. Sodium Hydroxide (NaOH), CAS-No. 1310-73-2, an
alkali metal hydroxide commonly known as caustic soda, was purchased from
Merteflor Enterprises branded EMSURE®. The distilled water used branded
as Absolute was purchased from local stores.
2.2. Solution blow spinning of PAN and PVDF
Precursor solutions were prepared by mixing 9% (w/v) PAN/DMF and
15% (w/v) PVDF/DMF with acetone by thoroughly mixing and heating above room temperature until a homogenous mixture was reached. Homogeneous
precursors were directly fed into the solution blow spinner’s inner concentric
nozzle with a feed rate of 10 mL/hr. Air at three bars was fed to the inner nozzle of the spray system. The needle used in this set-up was 21G (1.5” and
inner diameter of 0.514 mm). A vacuumized rotating drum (i.e., 38 cm.
working distance) was used to collect the nanofiber mats produced on a PET as substrate. A similar laboratory set-up was utilized by Salva et al. in
spinning cellulose-based (i.e., Carboxymethyl cellulose) polymer forming
into unique nanowhiskers [22].
2.3. Preparation of nanofiber adsorbent samples and MB dye solutions
The NF membrane samples were directly cut from the original nanofiber
mats. An estimated sample size of 5 cm by 5 cm was used for both NF
membranes in the batch adsorption. The PAN and PVDF membrane samples have a mass of 0.00703 g and 0.0082 g respectively. The samples obtained
were clean and free from any factors, which would give any unforeseen effect
on the withdrawn aliquot concentrations from the MB solution. Aqueous solution of MB dye was created by mixing 20 mg of methylene
blue in 1000 mL of distilled water. Serial dilutions were carried out for the
calibration of the UV-Vis Spectrophotometer. Such instrument was used in the determination of the exact MB concentration in every aliquot samples.
The initial MB dye concentrations of 3, 5, 7, 10, and 15 (i.e., in mg/L) were
investigated under batch adsorption experiments. The methylene blue solution was adjusted to pH 9 prior to this set-up using a 0.1M sodium hydroxide for a
more effective adsorption performance of MB [23].
2.4. Batch adsorption set-up
Figure 1 shows the experimental batch adsorption carried out in this study. First, a 150 mL of MB solution with a fixed concentration was mixed
into a 250-mL flask and placed in a Model G76 New Brunswick Scientific
Gyrotory Water Bath Shaker. The freshly prepared NF membrane was subsequently immersed inside the flask and the shaker rotated from 20 to 400
revolutions per minute (rpm). Aliquots were obtained after 1, 2, 4, 6, 8, and
10 minutes adsorption using a pipette for analysis. Samples obtained at different contact times were analyzed using UV-vis – Merck SpectroQuant®
Pharo 300 which quantitatively determines the absorbance of the analyte,
which is directly related to its concentration. The same procedure was applied for both types of NF membranes.
2.5. Characterizations
Scanning electron microscopy (SEM) using SEM Hitachi TM3030 Plus at an accelerating voltage of 15kV was used in the examination of the
nanofiber morphologies. Nanofiber average diameter and its pore size
distribution were carried out using Image J software. Chemical analysis of the
PAN and PVDF nanofiber membranes was determined using Fourier
transform infrared spectroscopy (FTIR). Thermal analyses such as
Thermogravimetric Analysis (TGA) and Differential scanning calorimetry (DSC) of nanofiber membrane was carried out in a Perkin Elmer STA 6000
and Perkin Elmer DSC 4000, respectively. Approximately 10 mg of sample
for TGA was heated from 30 to 350°C under N2 of a flow rate of 20 mL/min. DSC analysis used approximately 6 mg sample on a standard Al pan, heated
to 30°C for 5 minutes and subsequently heated to 445°C (i.e.,10°C/minute
heating rate) under N2 atmosphere of 20 mL/min flow rate.
2.6. Adsorption Studies
The amount of adsorption on the membrane at a certain time is defined as
the adsorption capacity, and it is numerically expressed as follows [24],
(1)
where Co = initial concentration of MB (mg/L), Ct = concentration of the solution at any time t, W = mass of nanofiber adsorbent (g), and V = volume
of sample solution (L).
174

S.S. Paclijan et al. / Journal of Membrane Science and Research 7 (2021) 173-184
2.7. Adsorption Equilibrium Isotherm
Adsorption mechanisms are mainly determined by well-established
isotherms [25]. Langmuir isotherm and Freundlich isotherms are two of the mostly utilized equations [24,26]. In Langmuir isotherm, chemisorption is the
mian mechanism. Such isotherm assumes actives sites on the surface are fixed
wherein a monolayer is formed. These actives sites are the ones attracted to the adsorbates, which is a reversible reaction and that reaches equilibrium
state [25,27]. Freundlich isotherm, on the other hand, is most useful for
physical adsorption particularly for liquids and assumes surface heterogeneity which means that adsorbate forms multilayer on the surface of the adsorbent
[25, 26, 28]. The linearized form of the two adsorption isotherms are;
(2)
(3)
where Ce = the equilibrium concentration of MB (mg/L) at equilibrium, qe = equilibrium adsorption capacity of NF membrane adsorbents (mg/g), and qm is
the maximum adsorption capacity of the NF membranes. KF and nF are the
isotherm constant and the intensity of the adsorption respectively [26,29].
Another adsorption isotherm is the Dubinin-Radushkevich model. This
model uses a heterogeneous surface of the adsorbent (i.e., NF membrane) for adsorption reaction. Such model further uses a Gaussian energy distribution
[30]. The isotherm is expressed in terms of its non-linear form.
(4)
where qe = equilibrium adsorption capacity (mg/g), qm= adsorption capacity at
maximum (mg/g), β = Dubinin-Radushkevich constant, and ∈ = Polanyi
potential. A linear form of the equation (eq’n 5) is used in obtaining the
maximum adsorption capacity wherein ln qe vs ∈2 is plotted.
(5)
The Polanyi potential is expressed as:
(6)
where R = gas constant 8.314 (J* mol-1 *K-1), and T = absolute temperature
(K). The mean free energy of adsorption, E (kJ/mol), used in identifying the
type of adsorption involved is expressed as:
(7)
If the mean free path value is between 8 -16 kJ/mol, chemisorption and ion-exchange are assumed to have happened during adsoprtion. While
Physisorption, on the other hand, is assumed if the mean free path value is
less than 8 kJ/mol [31].
Plotting 1/qe vs 1/Ce , ln qe vs ln Ce, and ln qe vs ∈2 for Langmuir,
Freudlich and Dubinin-Radushkevich isotherms respectively, allows getting
the best fit model for the experimental adsorption data.
3. Results and discussion
3.1. Morphologies of nanofibers and adsorption binding mechanism
The solution blow spinning process produced PAN NF membranes with larger diameters and pore sizes than the PVDF NF membranes as shown in
Table 1. This difference in fiber diameter and pore sizes may be attributed to parameters such as polymer content, solution concentration, feeding rate of
the prepared polymeric solution, and gas pressure [32].
Table 1
PAN and PVDF nanofiber diameters, pore sizes and porosity.
Nanofiber Average Diameter
(nm)
Average Pore Size
(µm)
Porosity
(%)
PAN 666.31+ 252.8 19 46
PVDF 94.1+4.6 2 34
Fig. 1. Batch adsorption set-up.
175

S.S. Paclijan et al. / Journal of Membrane Science and Research 7 (2021) 173-184
SEM images of the fresh and uncalcined nanofiber membranes are shown
in Figure 2 (i.e., PAN and PVDF nanofibers) for both the before and after
adsorption studies. Both PAN and PVDF nanofibers shown in Figures 2a and
2c were used with no prior treatment and showed smooth and uniform fiber
diameters. The nanofiber membranes after adsorption (see Figure 2b and d) showed rough fiber surfaces with significant clumping of PVDF nanofibers
(Figure 2d). The rough texture is attributed to the MB molecules adsorbed on
the nanofiber surface. As observed, nanofiber clumping of nanofibers happen. This is primarily due to the high aspect ratio of the nanofibers coupled with
the strong surface adhesion forces [33]. PVDF nanofibers have smaller fiber
diameters than the PAN nanofibers (see Table 1), which explains why more clumping can be observed on the former. This clumping reduces the available
surface area for MB adsorption resulting in a lower adsorption capacity for
PVDF compared to PAN as observed in the succeeding adsorption experiments.
The FTIR analysis of PAN NF membrane (see Figure 3 before) reflects
the functional groups of C=C at1629 cm-1, C-H at 1454 cm-1, and 1227 cm-1.
The nitrile peak C≡N (2243 cm-1), which should have been a moderately
active peak, could not be very well observed in this spectrum [34]. After
adsorption however (see Figure 3 after), small nitrile peak is seen on the FTIR analysis of PAN NF membrane, together with the peaks that can be attributed
mostly to methylene blue. These peaks include C-S-C at 1095 cm-1 and C=S+
at 1469 cm-1. PAN nanofibers’ nitrile group present is an electron-rich property, which acts as hydrogen bond acceptor [35] while MB has an
electron-deficient functionality on its structure at a protonated nitrogen state.
The attachment of MB onto the PAN nanofiber membrane then is most likely to occur during the adsorption process through an interaction with the
electron-rich PAN and electron-deficient MB. MB molecule absorption on
both FTIR Figures 3 and 4 were similar to the study of Pant et al. [36].
Fig. 2. SEM images of (a) PAN before adsorption, and (b) PAN after adsorption, (c) PVDF before adsorption,
and (d) PVDF after adsorption.
Fig. 3. FTIR Spectrum of PAN nanofiber membrane. Topmost is the MB molecule spectra, middle part is the “before” adsorption studies, and the
lowermost part represents “after” adsorption studies on methylene blue
176

S.S. Paclijan et al. / Journal of Membrane Science and Research 7 (2021) 173-184
The FTIR analysis in PVDF nanofiber before adsorption (see Figure 4
before) shows the presence of the different molecular functionalities based on
their absorption peaks. These absorption peaks include C-H2 at 3022 cm-1,
2980 cm-1, 1403 cm-1, C-C at 1185 cm-1, C-C-C at 878 cm-1, and C-F at 840
cm-1 [37]. After adsorption (Figure 4 after) as in the case of PAN, the peaks attributed to the MB dye such as C-S-C (1076 cm-1) and C-H3 (2919 cm-1,
2850 cm-1) are also detected. Comparing the peaks attributed to C-F (840 cm-
1) before and after the adsorption showed a decrease in its intensity, which implies the binding of MB through the fluoride atoms of PVDF nanofiber
membrane. The PVDF nanofiber membrane has two fluorine atoms that are
arranged symmetrically with a central carbon. The highly electronegative nature of the fluorine atom results in the high-energy bond with the low
electronegative functional group (i.e., in the form of nitrogen) present in the
methylene blue [38]. The attachment of MB to the surface of the PVDF NF membrane is responsible to this bonding during adsorption.
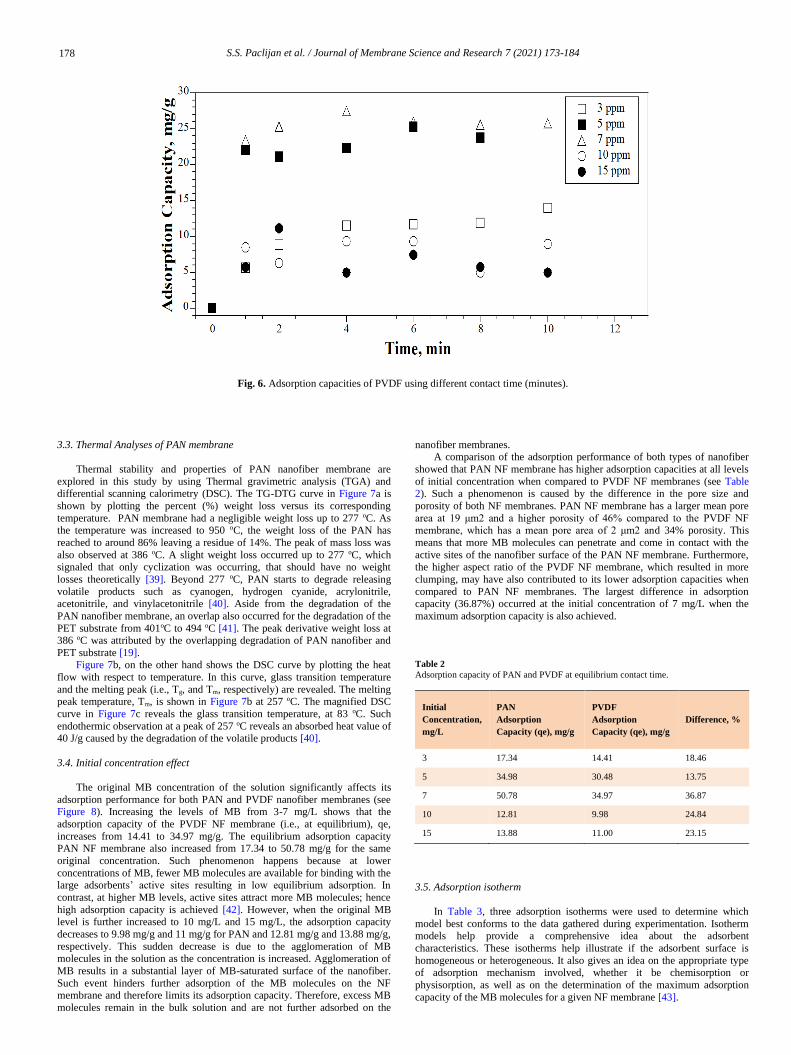
3.2. Contact time effect
MB adsorption behaviors on both PAN (see Figure 5) and PVDF (see
Figure 6) NF membranes showed an initial high rate of adsorption, followed
by a slower adsorption rate as contact time is increased. In both PVDF and
PAN nanofiber membranes, adsorption is fastest during the first sixty seconds
and proceeds more slowly in the next 10 minutes. The fastest adsorption
occurred during the first minute because most of the binding sites on the nanofiber surface are still available for adsorption. As contact time is
increased, further adsorption is slowed down because of the partial saturation
of the active sites on both nanofiber adsorbents. Adsorption rate is expected to further decrease until equilibrium is achieved, that is when the nanofiber
active sites are no longer available for binding.
Logarithmic regression is then employed to extrapolate and determine the contact time when the equilibrium is achieved. Results show that the PAN NF
membranes is expected to achieve equilibrium after 325.77 minutes, resulting
in a qm of 50.78 mg/g (See Supporting Information S1), while PVDF is expected to reach the equilibrium adsorption state after 226.73 minutes with
the highest adsorption capacity 34.97 mg/g (See Supporting Information S2).
The relationship of higher adsorption capacities being made at longer equilibrium contact times is the same for both nanofiber membranes.
Fig. 4. FTIR Spectrum of PVDF Nanofiber. Topmost is the MB molecule spectra, middle part is the “before” adsorption studies, and the
lowermost part represents “after” adsorption studies on methylene blue.
Fig. 5. Adsorption capacities of PAN using different contact time (minutes).
177
S.S. Paclijan et al. / Journal of Membrane Science and Research 7 (2021) 173-184
Fig. 6. Adsorption capacities of PVDF using different contact time (minutes).
3.3. Thermal Analyses of PAN membrane
Thermal stability and properties of PAN nanofiber membrane are
explored in this study by using Thermal gravimetric analysis (TGA) and differential scanning calorimetry (DSC). The TG-DTG curve in Figure 7a is
shown by plotting the percent (%) weight loss versus its corresponding
temperature. PAN membrane had a negligible weight loss up to 277 oC. As
the temperature was increased to 950 oC, the weight loss of the PAN has
reached to around 86% leaving a residue of 14%. The peak of mass loss was
also observed at 386 oC. A slight weight loss occurred up to 277 oC, which signaled that only cyclization was occurring, that should have no weight
losses theoretically [39]. Beyond 277 oC, PAN starts to degrade releasing
volatile products such as cyanogen, hydrogen cyanide, acrylonitrile, acetonitrile, and vinylacetonitrile [40]. Aside from the degradation of the
PAN nanofiber membrane, an overlap also occurred for the degradation of the
PET substrate from 401oC to 494 oC [41]. The peak derivative weight loss at 386 oC was attributed by the overlapping degradation of PAN nanofiber and
PET substrate [19]. Figure 7b, on the other hand shows the DSC curve by plotting the heat
flow with respect to temperature. In this curve, glass transition temperature
and the melting peak (i.e., Tg, and Tm, respectively) are revealed. The melting peak temperature, Tm, is shown in Figure 7b at 257 oC. The magnified DSC
curve in Figure 7c reveals the glass transition temperature, at 83 oC. Such
endothermic observation at a peak of 257 oC reveals an absorbed heat value of 40 J/g caused by the degradation of the volatile products [40].
3.4. Initial concentration effect
The original MB concentration of the solution significantly affects its
adsorption performance for both PAN and PVDF nanofiber membranes (see Figure 8). Increasing the levels of MB from 3-7 mg/L shows that the
adsorption capacity of the PVDF NF membrane (i.e., at equilibrium), qe,
increases from 14.41 to 34.97 mg/g. The equilibrium adsorption capacity PAN NF membrane also increased from 17.34 to 50.78 mg/g for the same
original concentration. Such phenomenon happens because at lower
concentrations of MB, fewer MB molecules are available for binding with the large adsorbents’ active sites resulting in low equilibrium adsorption. In
contrast, at higher MB levels, active sites attract more MB molecules; hence
high adsorption capacity is achieved [42]. However, when the original MB level is further increased to 10 mg/L and 15 mg/L, the adsorption capacity
decreases to 9.98 mg/g and 11 mg/g for PAN and 12.81 mg/g and 13.88 mg/g,
respectively. This sudden decrease is due to the agglomeration of MB
molecules in the solution as the concentration is increased. Agglomeration of
MB results in a substantial layer of MB-saturated surface of the nanofiber.
Such event hinders further adsorption of the MB molecules on the NF membrane and therefore limits its adsorption capacity. Therefore, excess MB
molecules remain in the bulk solution and are not further adsorbed on the
nanofiber membranes. A comparison of the adsorption performance of both types of nanofiber
showed that PAN NF membrane has higher adsorption capacities at all levels
of initial concentration when compared to PVDF NF membranes (see Table 2). Such a phenomenon is caused by the difference in the pore size and
porosity of both NF membranes. PAN NF membrane has a larger mean pore
area at 19 μm2 and a higher porosity of 46% compared to the PVDF NF
membrane, which has a mean pore area of 2 μm2 and 34% porosity. This
means that more MB molecules can penetrate and come in contact with the
active sites of the nanofiber surface of the PAN NF membrane. Furthermore, the higher aspect ratio of the PVDF NF membrane, which resulted in more
clumping, may have also contributed to its lower adsorption capacities when
compared to PAN NF membranes. The largest difference in adsorption capacity (36.87%) occurred at the initial concentration of 7 mg/L when the
maximum adsorption capacity is also achieved.
Table 2
Adsorption capacity of PAN and PVDF at equilibrium contact time.
Initial
Concentration,
mg/L
PAN
Adsorption
Capacity (qe), mg/g
PVDF
Adsorption
Capacity (qe), mg/g
Difference, %
3 17.34 14.41 18.46
5 34.98 30.48 13.75
7 50.78 34.97 36.87
10 12.81 9.98 24.84
15 13.88 11.00 23.15
3.5. Adsorption isotherm
In Table 3, three adsorption isotherms were used to determine which
model best conforms to the data gathered during experimentation. Isotherm models help provide a comprehensive idea about the adsorbent
characteristics. These isotherms help illustrate if the adsorbent surface is
homogeneous or heterogeneous. It also gives an idea on the appropriate type of adsorption mechanism involved, whether it be chemisorption or
physisorption, as well as on the determination of the maximum adsorption
capacity of the MB molecules for a given NF membrane [43].
178

S.S. Paclijan et al. / Journal of Membrane Science and Research 7 (2021) 173-184
Fig. 7. (a) TG-DTG, (b) DSC, and (c) magnified glass transition curves of PAN nanofiber membrane.
Using Microsoft Excel 2016, an equation for each isotherm used were
generated giving values for the slope (m), y-intercept (B) and the correlation
value (R2). The correlation value, R2, was obtained for all isotherm models used in order to evaluate the appropriateness of the adsorbent used for MB
dye adsorption [44]. Langmuir isotherm constants, qm, and KL were further
calculated using equation 2, Freundlich isotherm constants n and KF were obtained using equation 3 and Dubinin-Radushkevich isotherm constants, qm,
and E, were obtained using equations 5 and 7, respectively.
The Langmuir isotherm model (see Figure 9a) shows good fit of the adsorption data gathered for PAN NF membrane. This decision is based on
the highest correlation coefficient, R2 (see Table 3), compared to that of
Freundlich isotherm and Dubinin-Radushkevich isotherm models. Such result implies that the adsorption mechanism involved is chemisorption [44] and a
fixed number of active sites are present on NF surface membranes [6,45,46].
It also demonstrates that the MB molecules adsorbed forms a single layer
[6,45,47]. However, the data yielded a negative value for the maximum
adsorption capacity at -555.56 mg/g, which does not make physical sense.
The experimental data also highly correlates with the Freundlich isotherm model (see Figure 9b) but this model does not predict maximum adsorption
capacity. However, it provides the value for n, which measures the intensity
of the adsorption and KF, which is an indicator of adsorption capacity [48]. The physisorption phenomenon is also more attributed to the Freundlich
isotherm when correlation values are close to unity.
Although having the lowest correlation value compared to the two previously discussed, the batch adsorption data for PAN NF membrane also
conforms well to the Dubinin-Radushkevich isotherm R2 = 0.917 (see Figure
9c). Furthermore, this model gives a maximum adsorption capacity of 55.91 mg/g for the PAN NF membrane. Because of the negative adsorption
obtained from the Langmuir isotherm, the adsorption capacity using Dubinin-
Radushkevich isotherm was considered to be more realistic [49].
179

S.S. Paclijan et al. / Journal of Membrane Science and Research 7 (2021) 173-184
Table 3
Langmuir, Freundlich and Dubinin-Radushkevich adsorption isotherms parameters for MB adsorption of PAN and PVDF NF membrane.
PAN R2 m B qm, (mg/g) KL KF n E (kJ/mol)
Langmuir isotherm 0.978 0.1131 -0.0018 -555.56 -0.01591 - - -
Freundlich isotherm 0.9486 1.086 2.1428 - - 8.52 0.9208 -
Dubinin-Radushkevich isotherm 0.917 1.0x10⁻⁶ 4.0238 55.91 - - - 0.707
PVDF R2 m B qm, (mg/g) K n E (kJ/mol)
Langmuir isotherm 0.9951 0.1529 -0.0027 -370.37 -0.01765 - - -
Freundlich isotherm 0.9905 0.9522 0.7779 - - 0.4594 1.05 -
Dubinin-Radushkevich isotherm 0.9995 1.0x10⁻⁶ 3.7856 44.06 - - - 0.707
Fig. 8. Adsorption capacities of PAN and PVDF NF membranes at different initial concentrations of MB dye.
Fig. 9. Isotherm fitting using (a) Langmuir isotherm, (b) Freundlich isotherm and (c) Dubinin-Radushkevich using PAN membrane.
In PVDF NF membrane, the Dubinin-Radushkevich isotherm shows the best fit for its experimental data in Figure 10 with R2 =0.9995. Such fit
signifies that a pore-filling mechanism adsorption happens. And that a
multilayer of adsorbate is also formed [24]. Furthermore, the mean free energy of adsorption (E) obtained is equal to 0.707 kJ/mol, which indicates a
physisorption process. This free energy is the same type of force present is
Van der Waals forces, which falls between 0.4 and 4 kJ/mol [50]. This
isotherm model suggests that MB molecules form a multilayer on the PVDF
nanofiber membrane’s surface. The multilayer adsorption may possibly be
formed as well. Such formation is caused by the agglomeration of MB molecules as face-to-face dimers of methylene blue can form in dilute
concentrations. Subsequently, formation of higher aggregates occurs
eventually when dye concentration increases [51]. The maximum adsorption
capacity of the PVDF NF membrane obtained using the Dubinin-Radushkevich isotherm is 44.06 mg/g.
The obtained maximum adsorption capacities of the pristine PAN and
PVDF NF membrane using the Dubinin-Radushkevich isotherm model are 55.91 mg/g and 44.06 mg/g, respectively. These values are comparable or
even higher when compared to the adsorption capacities of some NF
membranes from different studies. However, the acquired maximum
adsorption capacity of the PAN and PVDF NF membranes used here are
significantly lower compared to the crosslinked sodium alginate NF
membrane [52], electrospun water-insoluble β-cyclodextrin-based fibers [46], and solution blow spun PMMA (Poly (methyl methacrylate)) nanofibers [10].
One reason for the low qm obtained in this study is that the NF membranes
used were not modified and functionalized, unlike those in the other MB
180

S.S. Paclijan et al. / Journal of Membrane Science and Research 7 (2021) 173-184
adsorption studies. Most, if not all, of the adsorbent membranes, used in
Table 4, are amended by calcination or by other forms of heat treatment. The
modification of the NF adsorbents and functionalization of groups present on
its surface increases the active sites available for binding with the MB
molecules, therefore, increasing the capability of the NF membranes for adsorption [53].
3.6. Recyclability test of nanofiber membranes
It is important to take into consideration the capacity of the PAN and
PVDF nanofiber membranes for recyclability. After the batch adsorption, the nanofiber membranes used were kept and isolated until they were dried. The
isolation was carried out by placing them in a container free from any
contaminants and was partially closed to allow moisture to escape from the nanofiber membranes. The dried membranes were transferred to transparent
plastic pouches and each pouch was labeled according to the type of
nanofiber membrane and methylene blue solution concentration. The solution concentration at which the nanofiber membranes have the highest adsorption
capacity for both PAN and PVDF nanofiber membranes was used for the
recyclability test. Hydrochloric acid (0.01M HCl) was used to increase the
acidity of the dye for the methylene blue removal. The nanofiber membranes
were subjected in an Erlenmeyer flask with 30 mL Hydrochloric acid and
were agitated for 30 minutes.
Results show that after the second cycle of adsorption as membranes
were post-recycled, the adsorption capacities of both nanofiber membranes
were reduced. PAN and PVDF NF membranes’ adsorption capacity after the
second cycle of adsorption was reduced to 18.34 mg/g and 16.22 mg/g,
respectively. The calculated recyclability efficiency of the PAN and PVDF NF membranes are 79.04% and 80.47%, respectively.
3.7. Feasibility study for the scale-up plant design
A scale-up plant design plan was proposed for a manufacturing facility
for the production of PVDF nanofiber membranes. The design aims to develop microfiltration membranes by means of solution blow spinning in
comparison to the currently available and used microfiltration membranes in
the world market. The potential markets include North America, Europe, Asia-Pacific, Latin America and the Middle East. These markets are the
leading countries that uses microfiltration membrane owing to the strict
regulation implemented for safe drinking water, rise in need of wastewater treatment in dye-contaminated waters for adsorption, filtration, and
desalination to cope up with the water shortage. The PVDF nanofiber
membrane microfilters produced from the design will be sold in rolls having
an area of 1.8 m2 of dimensions 300 mm x 6 m, and has a pore size of 1.59
microns. Other general requirements for microfiltration membranes are
summarized on Table 5.
Fig. 10. Isotherm fitting using (a) Langmuir isotherm, (b) Freundlich isotherm and (c) Dubinin-Radushkevich models using PVDF membrane.
Table 4
Adsorption Capacities of Methylene blue dye used in different adsorbents with Langmuir Isotherm model.
Adsorbent Amount (g) qm, (mg/g) Reference
Electrospun p-cresol formaldehyde and polystyrene NF membrane --- 5.88 x 10⁻³ [24]
Electrospun p-cresol formaldehyde and polystyrene NF membrane doped with zinc oxide
nanoparticles --- 7.85 x 10⁻³ [24]
Electrospun crosslinked gelatin/β- cyclodextrin NF membrane 0.01 47.4 [26]
Rice straws granular adsorbent 0.15 32.6 [43]
Electrospun Keratin Membrane 0.01 167 [54]
Crosslinked Sodium Alginate NF membrane 0.02 2357.87 [52]
Electrospun water-insoluble β-cyclodextrin-based fibers 0.014 826.45 [49]
Solution blow spun PMMA nanofibers 0.015 698.51 [10]
Electrospun PAN based activated carbon 0.007 72.46 [6]
Electrospun PAN with EDA grafting --- 94.07 [5]
Electrospun PAN NF membrane --- 42.662 [5]
Electrospun PVDF NF membrane with PDA 0.01 917.4 [55]
Modified PVDF NF membrane incorporated with HAPNP and PVP 0.12 10.83 [56]
Pristine PVDF NF membrane 0.12 2.89 [56]
Uncalcined solution blow spun PAN NF membrane 0.00703 55.91 This study
Uncalcined solution blow spun PVDF NF membrane 0.0082 44.06 This study
181

S.S. Paclijan et al. / Journal of Membrane Science and Research 7 (2021) 173-184
The manufacture of the PVDF membrane for microfiltration is separated
into three steps: solution preparation, product processing and air treatment
(Figure 11). For the solution preparation, raw materials are mixed together at
a desirable state. This is followed by product processing wherein the prepared
solution is introduced in the Solution blow spinning unit to undergo a process called solution blow spinning which uses compressed air at a pressure of 4
bars in blowing the polymer solution which causes the solvents to evaporate
and therefore forming fibers which are collected using PET (Poly ethylene terephthalate) substrate. The air that exits the Solution blow spinning unit will
no longer be treated as it falls below the limits set by the EPA (Environmental
Protection Agency), hence it will be released to the atmosphere. The proposed manufacturing facility will have two main structures
allotted for the administration and for the production comprising of sixteen
facilities with a total area of 225 square meters (15m by 15m). The total
annual production of the plant is 8,106 rolls, which are sold for PhP 4,312.19
per roll, which is 6.05% cheaper compared to what is sold on the world
market. The result of the economic analysis showed that the total capital
investment is PhP 43,446,000.00. The total production cost is equal to Php
21,184,630.00, which is contributed by the fixed costs, variable costs, plant overhead costs, and general expenses. The annual average net revenue is Php
13,770,013.51. The payback period for the original investment is 4 years.
Additionally, according to the Monte Carlo analysis, the plant has a 52% chance of being economically profitable. The project was designed to produce
PVDF nanofiber membranes for water treatment in an environmentally
sustainable, safe and cost effective process with an annual capacity of 14,590.8 m2, which is 0.63% of the total world gap (2,313,300 m2) posed by
the limited supply of PVDF nanofiber membranes in the world market.
Fig. 10. Before and after recyclability test comparison of PAN and PVDF NF membranes at 5 mg/L and 2 minutes contact time.
Table 5
PVDF Microfiltration Membranes Specification.
Parameter Standard Product-1
(Scienticfilters, 2020)
Standard Product-2
(Scienticfilters, 2020) Product
Pore size, µm 1.00 3.00 1.59
Thickness, mm 0.085-0.12 0.085-0.12 0.09
Maximum temperature,
(ºC) 123 123 420
Width, mm 300 300 300
Length, m 6 6 6
Fig. 11. Overall block flow diagram for PVDF nanofiber membrane production.
182

S.S. Paclijan et al. / Journal of Membrane Science and Research 7 (2021) 173-184
4. Conclusions
Varying the initial concentration has different effects on the behavior of
the adsorption capacity of both PAN and PVDF nanofiber membranes. At low
concentrations ranging from 3 to 7 mg/L, the adsorption capacity of both the nanofiber membranes increases until it reaches the highest adsorption
capacity of 34.97 mg/g for the PVDF NF membrane and 50.78 mg/g for the
PAN NF membrane. However, further increase of the initial concentration of the solution from 7 mg/L to 15 mg/L causes a decrease in the adsorption
capacities of both NF membranes, which is attributed to the agglomeration of
MB molecules in the solution as the initial concentration increases. Furthermore, rapid adsorption happens for the first minute of the adsorption
process. However, after the initial minute, the adsorption continued to occur
at a slower pace until it reached the state of equilibrium. The highest equilibrium adsorption capacity of the PAN NF membrane was obtained after
325.76 minutes, while it took 226.73 minutes for the PVDF NF membrane to
accomplish the highest equilibrium adsorption capacity. PAN NF membranes also exhibited higher adsorption capacity than the PVDF nanofiber membrane
for all levels of initial concentration of MB.
Both nanofiber membranes are proposed to conform to the Dubinin-
Radushkevich adsorption isotherm models. Using this model, the predicted
values for the maximum adsorption capacity of PAN and PVDF NF
membranes are 55.91 mg/g and 44.06 mg/g, respectively. The model also implies that physisorption is the main adsorption mechanism for both type of
nanofibers. Both pristine PAN and PVDF NF membranes produced by
solution blow spinning therefore demonstrated satisfactory adsorption capacities. However, heat treatment and functionalization may still be
employed in order to improve the adsorption performance of both nanofibers.
Acknowledgements
The researchers are grateful to the Balik Scientist Program of the
Department of Science and Technology, Philippines (BSP-DOST) through the
Philippine Council for Industry, Energy, and Emerging Technology Research and Development (PCIEERD) for the assistance and encouragement for
research and development in the country, to the Chemical Engineering and
Chemistry Departments of Xavier University- Ateneo de Cagayan laboratory
personnel and its faculty, and to the Xavier University College of Engineering
Parents and Faculty Association (XUCEPFA) for partially funding this
project. Our gratitude is extended to Mr. Michael Dempsey for proofreading and English language editing this manuscript.
Conflict of interest
The authors declare that they have no known competing financial interests or personal relationships that could have appeared to influence the
work reported in this paper.
Abbreviations
DMF Dimethyl formamide
DSC Differential scanning calorimetry
EDA Ethylenediamine
EPA Environmental Protection Agency
FTIR Fourier transform infrared spectroscopy
HAPNP Hydroxyapatite Nanoparticles HCl Hydrochloric acid
MB Methylene blue
NaOH Sodium Hydroxide NF Nanofiber
PAN Poly (acrylonitrile)
PDA Polydopamine PET Poly (ethylene terephthalate)
PMMA Poly (methyl methacrylate)
PVDF Poly (vinylidene fluoride) PVP Poly (vinylpyrrolidone)
SEM Scanning electron microscopy
TGA Thermogravimetric Analysis TG-DTG Thermogravimetric- derivative thermogravimetry
References
[1] F. M. D. Chequer, G. A. R. de Oliveira, E. R. A. Ferraz, J. C. Cardoso, M. V. B.
Zanoni, D. P. de Oliveira, Textile Dyes: Dyeing Process and Environmental Impact,
Eco-Friendly Textile Dyeing and Finishing. IntechOpen. 6 (2013) 151-176. DOI:
10.5772/53659.
[2] T. M. Albayati, A. A. Sabri, R. A. Alazawi, Separation of Methylene Blue as
Pollutant of Water by SBS-15 in a Fixed-Bed Column, Arab J. Sci. Eng. 41 (2015)
2409-2415. DOI: 10.1007/s13369-015-1867-7.
[3] R. Karthik, R. Muthezhilan, A. J. Hussain, K. Ramalingam, V. Rekha, Effective
Removal of methylene blue dye from water using three different low-cost
adsorbents, J. Desalination and Water Treatment. 57 (2016) 10626-10631.
DOI:10.1080/19443994.2015.1039598.
[4] G. Crini, E. Lichtfouse, Advantages and disadvantages of techniques use for
wastewater treatment, Envi. Chem. Letters. 17 (2019) 145-155. DOI:
10.1007/s10311-018-0785-9.
[5] S. Haider, F. F. Binagag, A. Haider, A. Mahmood, N. Shah, W. A. Al-Masry, S. U.
Khan, S. M. Ramay, Adsorption kinetic and isotherm of methylene blue, safranin T
and rhodamine B onto electrospun ethylenediamine-grafted-polyacrylonitrile
nanofibers membrane, J. Desalination and Water Treatment. 55 (2014) 1609-1619.
DOI:10.1080/19443994.2014.926840.
[6] A. S. Ibupoto, U. A. Qureshi, F. Ahmed, Z. Khatri, M. Khatri, M. Maqsood, R. Z.
Brohi, I. S. Kim, Reusable carbon nanofibers for efficient removal of methylene
blue from aqueous solution, Chem. Eng. Res. Des. 136 (2018) 744-752.
DOI:10.1016/j.cherd.2018.06.035.
[7] Z. Shen, G. P. Simon, Y. Cheng, Comparison of solution intercalation and melt
intercalation of polymer-clay nanocomposites, Polym. 43 (2002) 4251-4260.
DOI:10.1016/S0032-3861(02)00230-6.
[8] X. Zhang, Y. Lu, Centrifugal Spinning: An Alternative Approach to Fabricate
Nanofibers at Hogh Speed and Low Cost, Polym. Rev. 54 (2014) 677-701. DOI:
10.1080/15583724.2014.935858
[9] D. D. S. Parize, M. M. Foschini, J. E. de Oliveira, A. P. Klamczynski, G. M. Glenn,
J. M. Marconcini, L. H. C. Mattoso, Solution blow spinning: parameters
optimization and effects on the properties of nanofibers from poly(lactic
acid)/dimethyl carbonate solutions, J. Mater. Sci. 51 (2016) 4627-4638.
DOI:10.1007/s10853-016-9778.
[10] L. A. Mercante, M. H. M. Facure, D. A. Locilento, R. C. Sanfelice, F. L. Migliorini,
L. H. C. Mattoso, D. S. Correa, Solution Blow Spun PMMA Nanofibers Wrapped
with Reduced Graphene Oxide as Efficient Dye Adsorbent, New J. Chem. 41
(2017) 9087-9094. DOI:10.1039/C7NJ01703K.
[11] J. E. Oliveira, L. H. C. Mattoso, W. J. Orts, E. S. Medeiros, Structural and
Morphological Characterization of Micro and Nanofibers Produced by
Electrospinning and Solution Blow Spinning: A Comparative Study, Adv. Mater.
Sci. Eng. 1 (2013) 1-15, DOI:10.1155/2013/409572.
[12] M. Wojasinski, M. Pilarek, T. Ciach, Comparative studies of electrospinning and
solution blow spinning processes for the production of nanofibrous poly(L-lactic
acid) materials for biomedical engineering, Polish J. Chem. Tech. 16 (2014) 43-50.
DOI: 10.2478/pjct-2014-0028.
[13] X. Zhuang, L. Shi, K. Jia, B. Cheng, W. Kang, Solution Blown Nanofibrous
Membrane for Microfiltration, J. Membr. Sci. 429 (2013) 66-70.
DOI:10.1016/j.memsci.2012.11.036.
[14] J. L. Daristotle, A. M. Behrens, A. D. Sandler, P. Kofinas, Review of the Principles
and Applications of Solution Blow Spinning, ACS Appl. Mater. Interfaces. 8 (2016)
34951-34963. DOI:10.1021/acsami.6b12994. 34951-34963.
[15] A. M. C. Santos, M. F. Mota, R. S. Leite, G. A. Neves, E. S. Medeiros, R. R.
Menezes, Solution bow spun titania nanofibers from solutions of high
inorganic/organic precursor ratio, Ceram. Int. 44(2017) 1681-1689.
DOI:10.1016/j.ceramint.2017.10.096.
[16] E. S. Medeiros, G. M. Glenn, A. P. Klamczynski,W. J. Orts, L. H. C. Mattoso,
Solution Blow Spinning: A New Method to Produce Micro-and Nanofibers from
Polymer Solutions, J. Appl. Polym. Sci. 113 (2009) 2322-2330. DOI:113:2322-
2330.
[17] S. Subramanian, K. L. Tan, S. H. Lim, S. Ramakrishna, Electrospun Nanofibers for
Air Filtration Applications, Procedia Eng. 75 (2014) 159-163.
DOI:10.1016/j.proeng.2013.11034.
[18] J. Li, G. Song, J. Yu, Y. Wang, J. Zhu, Z. Hu, Preparation of Solution Blown
Polyamic Acid Nanofibers and Their Imidization into Polyimide Nanofiber Mats,
Nanomater. 7 (2017) 395-417. DOI:10.3390/nano7110395.
[19] G.C. Dadol, K.J.A. Lim, L.K. Cabatingan, N.P.B. Tan, Solution blow spinning–
polyacrylonitrile–assisted cellulose acetate nanofiber membrane. Nanotechnol. 31
(2020) 345602. DOI: 10.1088/1361-6528/ab90b4.
[20] N.P.B. Tan, L.K. Cabatingan, K.J.A. Lim, Synthesis of TiO2 nanofiber by solution
blow spinning (SBS) method. Key Engineering Materials. DOI:
10.4028/www.scientific.net/kem.858.122
[21] N. P. B. Tan, S. S. Paclijan, H. N. M. Ali, C. M. J. Hallazgo, C. J.F Lopez, Y. C
Ebora, Solution blow spinning (SBS) nanofibers for composite air filter masks.
ACS Appl. Nano Mater. 2 (2019) 2475-2483. DOI: 10.1021/acsanm.9b00207.
[22] J. M. Salva, D. D. Gutierrez, L. A. Ching, P. M. Ucab, H. Cascon, N. P. B. Tan,
Solution blow spinning (SBS) – assisted synthesis of well-defined carboxymethyl
cellulose (CMC) nanowhiskers, Nanotechnol. 29 (2018) 50LT01, DOI:
10.1088/1361-6528/aae2fc.
183

S.S. Paclijan et al. / Journal of Membrane Science and Research 7 (2021) 173-184
[23] B. Ali Fil, C. Ozmetin, M. Korkmaz, Cationic Dye (Methylene Blue) Removal from
Aqueous Solution by Montmorillonite, B. Korean Chem. Soc. 33 (2012) 3184-3190,
DOI:10.5012/bkcs.2012.33.10.3184.
[24] W. J. Fendi, J. A. Naser, Adsorption Isotherms Study of Methylene Blue Dye on
Membranes from Electrospun Nanofibers, Orient. J. Chem. 34 (2018) 2884-2894.
DOI:10.13005/ojc/340628.
[25] N. Ayawei, A. N. Ebelegi, D. Wankasi, Modelling and Interpretation of Adsorption
Isotherms, J. Chem. 2017 (2017) 1-11. DOI:10.1155/2017/3039817.
[26] Y. Chen, Y. Ma, W. Lu, Y. Guo, Y. Zhu, H. Lu, Y. Song, Environmentally Friendly
Gelatin/β-Cyclodextrin Composite Fiber Adsorbents for the Efficient Removal of
Dyes from Wastewater, Molecules. 23 (2018) 2473-2490.
DOI:10.3390/molecules23102473.
[27] D. M. Ruthven, Principles of Adsorption and Adsorption Processes. Canada: John
Wiley and Sons. 1984. DOI:10.1002/aic.690310335
[28] M. A. Al-Ghouti, D. A. Da’ana, Guidelines for the use and interpretation of
adsorption isotherm models: A review, J. Hazard. Mater. 393 (2020) 122383-
122482. DOI:10.1016/j.jhazmat.2020.122383
[29] C. J. Geankoplis, Transport Processes and Unit Operations, 3rd Edition, Boston,
Allyn and Bacon, Prentice-Hall International, Inc. 1993. DOI:
10.1002/aic.690260236.
[30] A. O. Dada, A. P. Olalekan, A. Olatunya, Langmuir, Freundlich, Temkin and
Dubinin–Radushkevich Isotherms Studies of Equilibrium Sorption of Zn2+ Unto
Phosphoric Acid Modified Rice Husk, J. Appl. Chem. 3 (2012) 38-45. DOI:
10.9790/5736-0313845.
[31] M. T. Amin, A. A. Alazba, M. Shafiq, Adsorptive Removal of Reactive Black 5
from Wastewater Using Bentonite Clay: Isotherms, Kinetics and Thermodynamics,
Sustainability. 7 (2015) 15302-15318. DOI:10.3390/su71115302.
[32] R. Vasireddi, J. Kruse, M. Vakili, S. Kulkarni, T. F. Keller, D. C. F. Monteiro, M.
Trebbin, Solution blow spinning of polymer/nanocomposite micro-/nanofibers with
tunable diameters and morphologies using a gas dynamic virtual nozzle, Sci. Rep. 9
(2019) 14297-14307. DOI:10.1038/s41598-019-50477-6.
[33] M. Zhou, K. Chen, X. Li, L. Liu, Q. Zeng, Y. Mo, L. Jin, L. Li, G. Su, J. Che, Y.
Tian, Clumping Stability of Vertical Nanofibers on Surfaces, Langmuir. J. Am.
Chem. Soc. 34 (2018) 11629-11636. DOI: 10.1021/acs.langmuir.8b02009.
[34] I. Karbownik, O. Rac-Rumijowska, M. Fiedot-Tobola, T. Rybicki, H. Teterycz, The
Preparation and Characterization of Polyacrylonitrile-Polyaniline (PAN/PANI)
Fibers, Mater. 12 (2019) 664-698. DOI:10.3390/ma12040664.
[35] D. R. Turner, A. J. Edwards, R. O. Piltz, Nitrile groups as hydrogen-bond acceptors
in a donor-rich hydrogen-bonding network, CrystEngComm 14 (2012) 6447-6451.
DOI:10.1039/C2CE26052B.
[36] B. Pant, G. P. Ojha, H. Y. Kim, M. Park, S. J. Park, Fly-ash-incorporated
electrospun zinc oxide nanofibers: Potential material for environmental remediation,
Environ. Pollut. 245 (2019) 163-172. DOI:10.1016/j.envpol.2018.10.122
[37] H. Bai, X. Wang, Y. Zhou, L. Zhang, Preparation and Characterization of
Poly(vinylidene fluoride) Composite Membranes Blended With Nano-crystalline
Cellulose, Prog. Nat. Sci: Mater. Int. 22 (2012) 250-257.
DOI:10.1016/j.pnsc.2012.04.011.
[38] Z. Li, W. Kang, N. Wei, J. Qiu, C. Sun, B. Cheng, Preparation of a polyvinylidene
fluoride tree-like nanofiber mat loaded with manganese dioxide for highly efficient
lead adsorption, RSC Advances. 7 (2017) 8220-8229. DOI:10.1039/C6RA27865E
[39] I. Alarifi, A. Alharbi, W. Khan, A. Swindle, R. Asmatulu, Thermal, Electrical and
Surface Hydrophobic Properties of Electrospun Polyacrylonitrile Nanofibers for
Structural Health Monitoring. Materials, 8 (2015), 7017–7031.
doi:10.3390/ma8105356
[40] A. Monahan, Thermal degradation of polyacrylonitrile in the temperature range
280–450°c. Journal of Polymer Science Part A-1: Polymer Chemistry, 4 (1966),
2391–2399. doi:10.1002/pol.1966.150041005
[41] A. Adnan, J. Shah, M. Jan, Effect of polyethylene terephthalate on the catalytic
pyrolysis of polystyrene: Investigation of the liquid products. Journal of the Taiwan
Institute of Chemical Engineers, 51 (2015), 96-102. 10.1016/j.jtice.2015.01.015.
[42] A. M. El-Wakil, W. M. Abou El-Maaty, O. Ahmed Abd Al-Ridha, Methylene Blue
Dye Removal from Aqueous Solution Using Several Solid Stationary Phases
Prepared from Papyrus Plant, J. Anal. Bioanal. Tech. 13 (2015) 1-7.
DOI:10.4172/2155-9872.S13-003.
[43] N. Fathy, O. El-Shafey, L. Khalil, Effectiveness of Alkali-Acid Treatment in
Enhancement the Adsorption Capacity for Rice Straw: The Removal of Methylene
Blue Dye, J. Phys. Chem. 2013 (2013) 1-15. DOI:10.1155/2013/208087.
[44] H. Moussout, H. Ahlafi, M. Azza, H. Maghat, Critical of linear and non-linear
equations of pseudo-first order and pseudo-second order kinetic model, Karbala
International J. Mod. Sci. 4 (2018) 244-254. DOI:10.1016/J.KIJOMS.2018.04.001.
[45] J. Yongbin, H. Xiangyuan, Z. Yi, J. Hongbing, Chemisorption and Physical
Adsorption Roles in Cadmium Biosorption by Chlamydomonas Reinhardtii,
Chinese J. Population, Resour. Envi. 8 (2010) 54-58.
DOI:10.1080/10042857.2010.10684991
[46] V. Meshko, L. Markovska, M. Mincheva, A. Rodrigues, Adsorption of Basic Dyes
on Granular Activated Carbon and Natural Zeolite, Adsorption of Dyes, 35 (2001)
3357-3366. DOI: 10.1016/S0043-1354(01)00056-2.
[47] R. Zhao, Y. Wang, X. Li, B. Sun, C. Wang, Synthesis of β-Cyclodextrin-Based
Electrospun Nanofiber Membranes for Highly Efficient Adsorption and Separation
of Methylene Blue, Appl. Mater. Interfaces. 7 (2015) 26649-26657.
DOI:10.1021/acsami.5b08403.
[48] Y. Zhang, J. Liu, X. Du, W. Shao, Preparation of reusable glass hollow fiber
membranes and methylene blue adsorption. J. Eur. Ceram. Soc. 39 (2019) 4891-
4900. DOI:10.1016/j.jeurceramsoc.2019.06.038.
[49] A. A. Inyinbor, F. A. Adekola, G. A. Olatunji, Kinetics, isotherms and
thermodynamic modeling of liquid phase adsorption of Rhodamine B dye onto
Raphia hookerie fruit epicarp. Water Resour. Ind. 15 (2016) 14-27.
DOI:10.1016/j.wri.2016.06.001.
[50] L. Liu, X. Luo, L. Ding, S. Luo, Application of Nanotechnology in the Removal of
Heavy Metal from Water, Nanomater. Rem. of Pollutants and Resour. Reutilization,
4 (2019) 83-147. DOI:10.1016/B978-0-12-814837-2.00004-4.
[51] S. L. Fornili, G. Sgroi, V. Izzo, Solvent isotope effect in the monomer-dimer
equilibrium of methylene blue, J. Chem. Soc., Faraday Transactions. 1 (1981) 3049-
3053. DOI:10.1039/F19817703049.
[52] Q. Wang, J. Ju, Y. Tan, L. Hao, Y. Ma, Y. Wu, H. Zhang, Y. Xia, K. Sui,
Controlled Synthesis of Sodium Alginate Electrospun Nanofiber Membranes for
Multi-occasion Adsorption and Separation of Methylene Blue, Carbohydr. Polym.
205 (2019) 125-134. DOI:10.1016/j.carbpol.2018.10.023.
[53] J. H. Kim, P. K. Park, C. H. Lee, H. H. Kwon, Surface modification of
nanofiltration membranes to improve the removal of organic micro-pollutants
(EDCs and PhACs) in drinking water treatment: Graft polymerization and cross-
linking followed by functional group substitution, J. Membr. Sci. 321 (2008) 190-
198. DOI:10.1016/j.memsci.2008.04.055.
[54] A. Aluigi, F. Rombaldoni, C. Tonetti, L. Jannoke, Study on Methylene Blue
Adsorption on Keratin Nanofibrous Membrane, J. Hazard. Mater. 268 (2014) 156-
165. DOI: 10.1016/j.jhazmat.2014.01.012.
[55] F. Ma, N. Zhang, X. Wei, J. Yang, Y. Wang, Z. Zhou, Blend-electrospun
poly(vinylidene fluoride) polydopamine membranes Self-polymerization of
dopamine and the excellent adsorption/separation abilities, J. Mater. Chem. 5 (2017)
14430-14443. DOI:10.1039/C7TA02845H
[56] J. Li, H. Zheng, H. Lin, B. Zhang, J. Wang, T. Li, Q. Zhang, Preparation of Three
Dimensional Hydroxyapatite Nanoparticles Poly(vinylidene fluoride) Blend
Membranes with Excellent Dye Removal Efficiency and Investigation of
Adsorption Mechanism, Chinese J. Polym. Sci. 37 (2019) 1234-1247.
DOI:10.1007/s10118-019-2271-7.
184