journal of membrane science - bioforce...
TRANSCRIPT

E
MNa
b
a
ARRAA
KMHQA
1
tpssbfdmasRpcfba
0d
Journal of Membrane Science 384 (2011) 157– 165
Contents lists available at SciVerse ScienceDirect
Journal of Membrane Science
jo u rn al hom epa ge: www.elsev ier .com/ locate /memsci
ffect of kinds of membrane materials on membrane fouling with BSA
asatoshi Hashinoa,b, Keisuke Hiramia, Toru Ishigamia, Yoshikage Ohmukaia, Tatsuo Maruyamaa,oboru Kubotab, Hideto Matsuyamaa,∗
Center for Membrane and Film Technology, Department of Chemical Science and Engineering, Kobe University, 1-1 Rokkodai, Nada-ku, Kobe 657-8501, JapanMicroza & Water Processing Division, Asahi-Kasei Chemicals Co. Ltd., Fuji, Shizuoka 416-8501, Japan
r t i c l e i n f o
rticle history:eceived 15 May 2011eceived in revised form 22 August 2011ccepted 12 September 2011vailable online 16 September 2011
eywords:embrane foulingollow fiber membraneuartz crystal microbalancetomic force microscopy
a b s t r a c t
Three kinds of membranes were prepared via non-solvent-induced phase separation using poly(ethylene-co-vinyl alcohol) (EVOH), polyether sulfone (PES) and poly(vinylidene fluoride) (PVDF), which are usedwidely membrane materials. The resulting membranes had structures with skin layers and macrovoids,and their molecular weight cut-offs (MWCOs) and pure water permeabilities were 45–130 kDa and70–100 L/(m2 bar h), respectively. In BSA filtration experiments, the EVOH membrane showed high rel-ative permeability after 60 min of filtration, while the PVDF membrane showed severe permeabilitydecline. The results of filtrations for BSA solution by three membranes could not be explained by thedifference of pure water permeabilities and initial MWCOs. The adsorption behaviors of BSA on thepolymers were examined using a quartz crystal microbalance with the dissipation monitoring (QCM-D)method. The order of BSA adsorption amounts on polymers measured by QCM-D was in agreement with
the order of BSA rejection during filtration. PVDF showed the highest adsorption amount and the mostrigid adsorption layer, while EVOH showed the lowest adsorption amount and the softest adsorptionlayer. Adhesion force measurements of PVDF–BSA and BSA–BSA were also conducted using atomic forcemicroscopy. The PVDF–BSA interaction was much stronger than the BSA–BSA interaction, indicating thatmembrane fouling resulted from the physicochemical interactions between polymers and BSA ratherthan that between BSA and BSA on the membrane surface.. Introduction
The application of membrane technology including microfiltra-ion (MF) and ultrafiltration (UF) membranes in water treatmentrocesses is increasing owing to this technology’s advantagesuch as complete particle removal, reduced chemical use andmall footprint [1]. The main limitation of the use of mem-rane technology in widespread water treatment is membraneouling, which causes a significant reduction of permeate fluxuring long term filtration [2]. On the basis of many studies onembrane fouling, it was determined that membrane fouling is
ttributed to natural organic matter (NOM) such as humic sub-tances and polysaccharide-like and/or protein-like substances [3].ecent studies have reported that hydrophilic NOM, includingolysaccharide-like and/or protein-like substances, are a signifi-ant cause of membrane fouling [4–6]. To better control membrane
ouling, it is necessary to elucidate the relationship between mem-rane fouling and membrane properties such as their structuresnd materials. Lee et al. examined MF/UF membrane fouling with∗ Corresponding author. Tel.: +81 78 803 6180; fax: +81 78 803 6180.E-mail address: [email protected] (H. Matsuyama).
376-7388/$ – see front matter © 2011 Elsevier B.V. All rights reserved.oi:10.1016/j.memsci.2011.09.015
© 2011 Elsevier B.V. All rights reserved.
NOM. They reported that the hydrophilic fraction of NOM causedsignificant flux decline, and that membrane roughness is a moreimportant factor in membrane fouling than hydrophilicity of themembrane [7]. Schäfer et al. also reported that membrane prop-erties of hydrophilic or hydrophobic membranes did not play amajor role in the filtration of mixed solutions of inorganic mat-ter and NOM [8]. On the other hand, Fan et al. examined membranefouling of hydrophilic and hydrophobic membranes with fraction-ated NOM based on hydrophilicity and charge. They reported thathydrophilic neutral NOM had higher fouling potential and thathydrophobic membranes showed a higher fouling rate comparedwith hydrophilic membranes [9]. Kimura et al. examined mem-brane fouling of different MF/UF membranes with NOM collectedfrom different origins. In their paper, it was reported that thehydrophilic fraction of NOM caused irreversible membrane foulingand hydrophilic membranes showed high antifouling properties[10]. One of the reasons for differences among the findings ofprevious studies is that membrane properties such as pore size,pure water flux and membrane structure, which also contribute to
membrane fouling, were not constant. Therefore, it is necessary toelucidate the influence of the membrane material itself, withoutany differences in membrane structures, to clarify the mechanismsunderlying membrane fouling.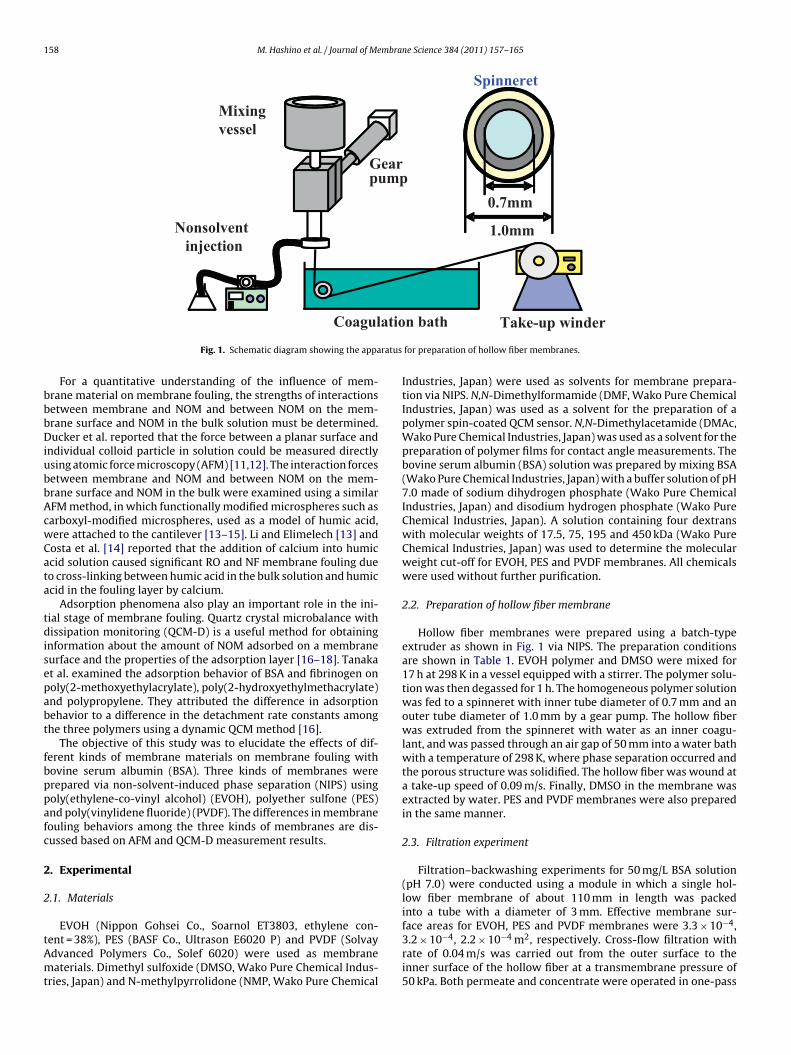
158 M. Hashino et al. / Journal of Membrane Science 384 (2011) 157– 165
Mixing vessel
Spinneret
Gear pump
Nonsolvent 0.7mm
1.0mminjection
atio
ratus
bbbDiubbAcwCata
tdisepabt
fbppafc
2
2
tAmt
Coagul
Fig. 1. Schematic diagram showing the appa
For a quantitative understanding of the influence of mem-rane material on membrane fouling, the strengths of interactionsetween membrane and NOM and between NOM on the mem-rane surface and NOM in the bulk solution must be determined.ucker et al. reported that the force between a planar surface and
ndividual colloid particle in solution could be measured directlysing atomic force microscopy (AFM) [11,12]. The interaction forcesetween membrane and NOM and between NOM on the mem-rane surface and NOM in the bulk were examined using a similarFM method, in which functionally modified microspheres such asarboxyl-modified microspheres, used as a model of humic acid,ere attached to the cantilever [13–15]. Li and Elimelech [13] andosta et al. [14] reported that the addition of calcium into humiccid solution caused significant RO and NF membrane fouling dueo cross-linking between humic acid in the bulk solution and humiccid in the fouling layer by calcium.
Adsorption phenomena also play an important role in the ini-ial stage of membrane fouling. Quartz crystal microbalance withissipation monitoring (QCM-D) is a useful method for obtaining
nformation about the amount of NOM adsorbed on a membraneurface and the properties of the adsorption layer [16–18]. Tanakat al. examined the adsorption behavior of BSA and fibrinogen onoly(2-methoxyethylacrylate), poly(2-hydroxyethylmethacrylate)nd polypropylene. They attributed the difference in adsorptionehavior to a difference in the detachment rate constants amonghe three polymers using a dynamic QCM method [16].
The objective of this study was to elucidate the effects of dif-erent kinds of membrane materials on membrane fouling withovine serum albumin (BSA). Three kinds of membranes wererepared via non-solvent-induced phase separation (NIPS) usingoly(ethylene-co-vinyl alcohol) (EVOH), polyether sulfone (PES)nd poly(vinylidene fluoride) (PVDF). The differences in membraneouling behaviors among the three kinds of membranes are dis-ussed based on AFM and QCM-D measurement results.
. Experimental
.1. Materials
EVOH (Nippon Gohsei Co., Soarnol ET3803, ethylene con-
ent = 38%), PES (BASF Co., Ultrason E6020 P) and PVDF (Solvaydvanced Polymers Co., Solef 6020) were used as membraneaterials. Dimethyl sulfoxide (DMSO, Wako Pure Chemical Indus-ries, Japan) and N-methylpyrrolidone (NMP, Wako Pure Chemical
n bath Take-up winder for preparation of hollow fiber membranes.
Industries, Japan) were used as solvents for membrane prepara-tion via NIPS. N,N-Dimethylformamide (DMF, Wako Pure ChemicalIndustries, Japan) was used as a solvent for the preparation of apolymer spin-coated QCM sensor. N,N-Dimethylacetamide (DMAc,Wako Pure Chemical Industries, Japan) was used as a solvent for thepreparation of polymer films for contact angle measurements. Thebovine serum albumin (BSA) solution was prepared by mixing BSA(Wako Pure Chemical Industries, Japan) with a buffer solution of pH7.0 made of sodium dihydrogen phosphate (Wako Pure ChemicalIndustries, Japan) and disodium hydrogen phosphate (Wako PureChemical Industries, Japan). A solution containing four dextranswith molecular weights of 17.5, 75, 195 and 450 kDa (Wako PureChemical Industries, Japan) was used to determine the molecularweight cut-off for EVOH, PES and PVDF membranes. All chemicalswere used without further purification.
2.2. Preparation of hollow fiber membrane
Hollow fiber membranes were prepared using a batch-typeextruder as shown in Fig. 1 via NIPS. The preparation conditionsare shown in Table 1. EVOH polymer and DMSO were mixed for17 h at 298 K in a vessel equipped with a stirrer. The polymer solu-tion was then degassed for 1 h. The homogeneous polymer solutionwas fed to a spinneret with inner tube diameter of 0.7 mm and anouter tube diameter of 1.0 mm by a gear pump. The hollow fiberwas extruded from the spinneret with water as an inner coagu-lant, and was passed through an air gap of 50 mm into a water bathwith a temperature of 298 K, where phase separation occurred andthe porous structure was solidified. The hollow fiber was wound ata take-up speed of 0.09 m/s. Finally, DMSO in the membrane wasextracted by water. PES and PVDF membranes were also preparedin the same manner.
2.3. Filtration experiment
Filtration–backwashing experiments for 50 mg/L BSA solution(pH 7.0) were conducted using a module in which a single hol-low fiber membrane of about 110 mm in length was packedinto a tube with a diameter of 3 mm. Effective membrane sur-face areas for EVOH, PES and PVDF membranes were 3.3 × 10⁻⁴,
3.2 × 10⁻⁴, 2.2 × 10⁻⁴ m2, respectively. Cross-flow filtration withrate of 0.04 m/s was carried out from the outer surface to theinner surface of the hollow fiber at a transmembrane pressure of50 kPa. Both permeate and concentrate were operated in one-pass
M. Hashino et al. / Journal of Membrane Science 384 (2011) 157– 165 159
Table 1Preparation conditions for hollow fiber membranes.
Membrane EVOH PES PVDF
Spinneret size (mm) 1.0/0.7 (outer/inner diameter)Polymer solution EVOH (16 wt%) PES (16 wt%) PVDF (16 wt%)
–DMSO –NMP –NMPSolution temperature (K) 298 298 298Polymer solution flow rate (m/s) 0.06 0.04 0.06Inner coagulant DI water DI water DI waterInner coagulant flow rate (m/s) 0.14 0.17 0.14Inner coagulant temperature (K) 298 298 298Take-up speed (m/s) 0.09 0.09 0.09
mmpfiAocBuoe
R
ws
2
dfiTim(
2
Pwd
Air gap (mm) 50
Bath composition Water
Bath temperature (K) 298
ode without recycling to feed tank. For each filtration experi-ent, deionized (DI) water was permeated as a feed at first and the
ure water permeability (J0) was measured. Then, BSA solution wasltrated and the permeability for BSA solution (J) was measured.fter 20 min of filtration, backwashing using DI water was carriedut at a pressure of 50 kPa for 1 min. The filtration–backwashingycle was repeated three times. During filtration of BSA solution,SA concentrations in feed and permeate solutions were measuredsing a spectrometer (Hitachi Co., U-2000, Japan) at a wavelengthf 280 nm. Rejection of BSA was calculated using the followingquation:
ejection [%] = C0 − C
C0× 100 (1)
here C0 and C are the concentrations of BSA in feed and permeateolutions, respectively.
.4. SEM observations
The EVOH, PES and PVDF hollow fiber membranes were freeze-ried using a freeze dryer (EYELA, FD-1000, Japan). The dry hollowber membranes were immersed in liquid nitrogen and fractured.he fractured hollow fiber membranes subjected to Au/Pd sputter-ng. Scanning electron microscope (SEM) images for hollow fiber
embranes were obtained using an accelerating voltage of 15 kVHitachi Co., JSM-5610LVS, Japan).
.5. Molecular weight cut-off curve measurement
Molecular weight cut-off (MWCO) curves for the EVOH, PES andVDF membranes were generated using dextrans with moleculareights of 17.5, 75, 195 and 450 kDa. Mixed solutions of 1000 mg/Lextran and 1000 mg/L ethylene glycol as an internal standard were
Fig. 2. Schematic diagram showing th
50 50Water Water298 298
filtrated by hollow fiber membrane. The concentrations of dextranand ethylene glycol in feed and permeate solutions were measuredby HPLC (Shimadzu Co., Japan) using a Shodex OHpak SB-805 HQcolumn (Showa Denko K.K, Japan). The rejections of dextran werecalculated according to Eq. (1).
2.6. Measurement of BSA adsorption on polymer film
Quartz crystal microbalance with dissipation monitoring (QCM-D) was used to measure the adsorbed amounts of BSA on EVOH,PES and PVDF films. The schematic diagram showing the QCM-Dmeasurement device is shown in Fig. 2. The method of preparationof polymer-coated QCM sensors is as follows. Piezoelectric quartzcrystal sensors with a fundamental resonant frequency of 4.95 MHzand a diameter of 14 mm (Q-Sense Co., QSX 301) were pre-cleanedusing UV/Ozone cleaner (BioForce Nanosciences Co., Pro Cleaner110). Then, sensors were spin-coated with 0.5 wt% polymer solu-tions (EVOH in DMSO, PES in DMF and PVDF in DMF) at 2000 rpmfor 60 s, followed by drying on a hot plate (KATHERM Co., C-MAGHP4) at 353 K for 30 min.
QCM-D measurements were conducted in a flow chamberequipped with EVOH-, PES- and PVDF-coated quartz crystal sen-sors. The buffer solution was fed into the flow chamber at a flowrate of 40 �L/min for more than 10 min to stabilize the sensor. Then,BSA solutions of 5–1000 mg/L were supplied for 30 min. When BSAwas adsorbed to the QCM sensor, the resonance frequency of thesensor decreased. The adsorbed amount per unit surface area of BSAon the QCM sensor (�m) is correlated to the change in frequency
(�f) in accordance with the Sauerbrey equation [19]:�m = −C�f
n(2)
e QCM-D measurement device.

1 mbrane Science 384 (2011) 157– 165
wftWtD
D
wcmc�
2
fibttCmsctmm(
NmiwaTwf[fstiaTatttpabi
2
nfiofiS
Table 2Properties of EVOH, PES and PVDF membranes.
Membrane EVOH PES PVDF
60 M. Hashino et al. / Journal of Me
here C is the mass sensitivity constant (=17.7 ng/cm2/Hz at = 4.95 MHz) and n is the overtone number (n = 3, 5, 7). If the adsorp-ion layer has a viscoelastic property, energy dissipation is caused.
hen driving power to the piezoelectric crystal oscillator is off,he amplitude of quartz crystal resonance decays exponentially.issipation factor D is defined by following equation [20]:
= 1�f�
(3)
here f is resonant frequency and � is decay time constant. Thehange in dissipation factor �D = D − D0 is obtained by the QCM-Deasurement, where D0 is the dissipation factor of the pure quartz
rystal immersed in the buffer solution. From the plot of �D againstf, information about the adsorption layer can be obtained.
.7. Adhesion force measurements
AFM was used to measure the interfacial forces between PVDFlm and BSA. PVDF film was used instead of a hollow fiber mem-rane to eliminate any effect of an inhomogeneous morphology ofhe porous membrane surface. PVDF powder was pressed underhe conditions of 523 K and 0.3 MPa using a press machine (Imotoo., 1MC-181D, Japan) and then PVDF film was prepared. Forceeasurements were conducted using BSA-modified 3-�m micro-
pheres made of silica (Corefront, Japan) attached to the top of aantilever made of SiN (Olympus, OMCL-RC800PSA-1, Japan) underhe conditions reported by Yamamura et al. [21]. The BSA-modified
icrospheres were attached to the top of the cantilever using aicromanipulator equipped with a scanning electron microscope
Shimazdu Co., Superscan SS-550, Japan).Force measurements were carried out in buffered water (1 mM
aHCO3, pH = 7.8) with the use of AFM apparatus (Seiko Instru-ents Inc., S-image SPA-400, Japan). After PVDF films were
mmersed in the buffer solution for 30 min, force measurementsere conducted at three different locations of a 20 �m × 20 �m
rea in the film and ten force curves were obtained at each location.he raw AFM data of cantilever deflection versus scanner positionere converted to force versus separation distance of colloid sur-
ace to film surface using the method reported by Yamamura et al.21]. Briefly, the cantilever deflection was converted to the loadingorce using the spring constant of the cantilever (0.05 N/m). Theeparation distance was calculated by subtracting the onset wherehe relationship between cantilever deflection and scanner positions linear from each scanner position. An approaching force curvend a retraction force curve were obtained by AFM measurements.he interaction force between PVDF film and BSA was expressed asdhesion forces with a maximum value of cantilever deflection inhe retraction force curves. The adhesion force is the force neededo separate the colloid probe from the PVDF film, which relates tohe easiness of BSA removal from the PVDF membrane surface byhysical cleaning. Furthermore, the interfacial force between BSAdsorbed on PVDF surface and BSA in bulk solution was determinedy measuring the adhesion force using PVDF film that had been
mmersed in 1000 mg/L BSA solution for 17 h.
.8. Air contact angle
The 15 wt% polymer solutions were cast on glass with a thick-ess of 1 mm, and then dried in a desiccator. The resultant polymer
lms were set on slide glass and immersed in water. An air dropletf 2 �L was added into the water and contact angles for polymerlms were measured using a contact angle meter (Kyowa Interfacecience, CA-A, Japan).Pure water permeability (L/(m2 h bar)) 70 ± 7.7 90 ± 10.2 100 ± 2.6MWCO (kDa) 110 45 130
3. Results and discussion
3.1. Hollow fiber membranes
SEM images of EVOH, PES and PVDF membranes prepared viaNIPS are shown in Figs. 3–5, respectively. The three membraneshad skin layers at the outer surfaces and macrovoid structures incross sections. These macrovoid structures are typical structuresof membranes prepared via NIPS method. The immersion of theouter surfaces in a water bath results in the formation of a skinlayer during NIPS. Because the resulting dense skin layers restrictwater to penetrating across sections of membrane, phase separa-tion proceeds slowly and leads to macrovoid formation. The purewater permeabilities of the three kinds of membranes are shown inTable 2. EVOH, PES and PVDF membranes showed pure water per-meabilities of 70, 90 and 100 L/(m2 bar h), respectively. These waterpermeabilities are not particularly different for three membranes.
Molecular weight cut-off (MWCO) curves for EVOH, PES andPVDF membranes are shown in Fig. 6. The MWCO curve for EVOHwas comparable to that for PVDF, while the PES membrane showedslightly higher rejection compared with the EVOH and PVDF mem-branes. Values for MWCO, which is defined as the molecular weightof dextran to be rejected by more than 90%, are also shown inTable 2. EVOH and PVDF membranes showed MWCO values of110 kDa and 130 kDa, respectively. The MWCO of PES membranewas 45 kDa. Three membranes had dense outer surfaces as shownin Figs. 3(f), 4(f), and 5(f) which contacted with dextran solutionsand could determine the extent of dextran rejection mainly. Thehydrophilicity of membrane may also influence the behavior ofthe solute adsorption on membrane and influence MWCOs. How-ever, by QCM-D measurements (not shown), dextran was hardlyadsorbed on all membranes. This indicates less effect of membranematerials on dextran adsorption on membranes. Thus, the MWCOsof EVOH, PES and PVDF membranes can be considered to representthe pore sizes on the outer surfaces of three membranes.
3.2. Filtration experiments with BSA solution
The results of filtration experiments with 50 mg/L BSA solu-tion using EVOH, PES and PVDF membranes are shown in Fig. 7.The membrane fouling properties were different among the threekinds of membranes. EVOH showed the highest relative perme-ability (J/J0) of 0.65 after 60 min filtration, as shown in Fig. 7(a). PESshowed slightly lower relative permeability of 0.6. On the otherhand, the relative permeability of PVDF decreased significantly to0.4 after 60 min of filtration. The backwashing operations using DIwater were carried out at the times shown by arrows and dashedlines in Fig. 7. No recovery of permeability was obtained by back-washing, for all membranes. The BSA rejection results for the threekinds of membranes are shown in Fig. 7(b). BSA rejection by PVDFdecreased from 65% to 50% with increased filtration time. PES mem-branes also showed decreased BSA rejection from 50% to 30%. Thesedecreases in the amounts of BSA rejection during filtration mightbe attributed to decreases in the amounts of adsorption sites onthe membrane surface with increasing filtration time. For EVOH
membrane, BSA rejections were about 10% during the 60 min offiltration.Although PVDF membrane showed higher pure water perme-ability than that of EVOH membrane as shown in Table 2, PVDF

M. Hashino et al. / Journal of Membrane Science 384 (2011) 157– 165 161
F tion;
n
ms(shtca
3
cia
�
wt
monolayer BSA are 2.5 mg/m2 for side-on type and 9.0 mg/m2 forend-on type [22]. The maximum adsorption amounts of BSA onEVOH, PES and PVDF were 3.34, 3.45 and 4.01 mg/m2, respectively,
Table 3Fitting parameters for Langmuir isothermal adsorption equation.
ig. 3. SEM images of the hollow fiber membrane made of EVOH. (a) Whole cross-secear the outer surface; (e) inner surface; (f) outer surface.
embrane showed severer flux decline than EVOH membrane ashown in Fig. 7(a). Moreover, the initial MWCO of PVDF membrane130 kDa) was larger than that of EVOH membrane (110 kDa) ashown in Table 2. However, BSA rejection by PVDF membrane wasigher than that of EVOH membrane as shown in Fig. 7(b). Fromhese results, the results of the BSA filtrations by three membranesannot be explained by the differences of pure water permeabilitiesnd initial MWCOs.
.3. QCM measurements
The adsorption isotherms of BSA on EVOH-, PES- and PVDF-oated quartz crystal sensors are shown in Fig. 8. The adsorptionsotherms were also calculated using the Langmuir isothermaldsorption equation:
= �maxcK
1 + cK(4)
here � and � max are adsorption amount and maximum adsorp-ion amount (mg/m2), respectively, c is the concentration of BSA in
(b) enlarged cross-section; (c) cross-section near the inner surface; (d) cross-section
the solution (mg/L) and K is a constant. The fitting parameters of� max and K used for calculation are shown in Table 3. The lines inFig. 8 are the calculated results from Eq. (4). PVDF showed a highermaximum adsorption compared with PES and EVOH. For PVDF, theconstant K, which is the ratio of adsorption rate to desorption rate,was ten times higher than that for EVOH. For all polymer mate-rials, the adsorption experimental data were in good agreementwith the results calculated by the Langmuir isothermal adsorptionequation, indicating that adsorption of BSA on these polymer filmswas monolayer adsorption. The theoretical adsorption amounts of
Polymer EVOH PES PVDF
� max (mg/m2) 3.34 3.45 4.01K (L/mg) 0.006 0.017 0.062

162 M. Hashino et al. / Journal of Membrane Science 384 (2011) 157– 165
Fig. 4. SEM images of the hollow fiber membrane made of PES. (a) Whole cross-section; (b) enlarged cross-section; (c) cross-section near the inner surface; (d) cross-sectionn
wstiBtabtaWowtamcp[
ear the outer surface; (e) inner surface; (f) outer surface.
hich are slightly higher than the value for side-on type but muchmaller than the value for end-on type. Thus BSA adsorptions inhis study are considered to be mainly monolayer adsorption. Its also noted that the order of maximum adsorption amounts ofSA on EVOH, PES and PVDF was in agreement with the order ofhe degree of fouling of the three membranes during filtration,s shown in Fig. 7(a). To determine the differences in adsorptionehaviors of BSA on EVOH, PES and PVDF, the hydrophilicities ofhese polymers were examined. Air contact angles for EVOH, PESnd PVDF were 132.5 ± 2.1, 114.6 ± 1.0 and 94.0 ± 1.1, respectively.ith increasing of air contact angle, hydrophilicity increases. The
rder of hydrophilicity of EVOH > PES > PVDF was in agreementith the adsorption behaviors of BSA on polymer films. The higher
he hydrophilicity of polymer film was, the lower the amount ofdsorption of BSA on polymer film. This result was also in agree-
ent with the result reported by Matthiasson that a hydrophilicellulose acetate membrane showed less adsorption of BSA com-ared with hydrophobic polyamide and polysulfone membranes23].
The 50 mg/L BSA solution was fed to the PVDF spin-coatedsensor, followed by rinsing by buffer solution. The changes inBSA adsorption amounts on PVDF film and desorption amountsachieved by rinsing with buffer solution are shown in Fig. 9. Asshown in this figure, the desorption amount was quite low. The per-centages of desorption achieved by rinsing of EVOH, PES and PVDFfilms were 5.9, 4.9 and 3.8%, respectively. These results indicatethat the interactions between BSA molecules and polymer filmswere strong and that BSA caused irreversible membrane fouling.This is the reason why no recovery of backwashing was observedfor EVOH, PES and PVDF membranes, as shown in Fig. 7(a).
The relationship between dissipation shift (�D) and frequencyshift (�f) from adsorption experiments with BSA solution andEVOH, PES and PVDF films is shown in Fig. 10. The behavior of PVDFfilm is different from those of EVOH and PES films. This difference in
the slopes of �D − �f plots is attributed to the different viscoelasticproperties of the adsorption layers. When the slope in this plot ishigh, a soft adsorption layer is formed, while a rigid layer is formedin the case of a low slope condition [24]. In the case of PVDF film,
M. Hashino et al. / Journal of Membrane Science 384 (2011) 157– 165 163
Fig. 5. SEM images of the hollow fiber membrane made of PVDF. (a) Whole cross-section; (near the outer surface; (e) inner surface; (f) outer surface.
0
20
40
60
80
100
1.0E+061.0E+051.0E+04
Molecular Weight [Da]
Rej
ectio
n [%
]
EVOHPESPVDF
Fig. 6. Molecular weight cut-off curves for EVOH, PES and PVDF membranes deter-mined using solutions of dextran with molecular weights of 17.5, 75, 195 and450 kDa.
b) enlarged cross-section; (c) cross-section near the inner surface; (d) cross-section
the low slope in the region of frequency shift of 0 to −12 Hz is dueto a rigid layer of BSA adsorbed on PVDF film. On the other hand, thehigh slope in the region of frequency shift of −12 to −25 Hz is due toa soft layer, which causes significant energy dissipation. EVOH andPES also show properties of soft adsorption layers. The differencesin the slopes of �D − �f plots can be explained as follows. In theinitial stage of adsorption of BSA onto PVDF film, BSA is deformedpromptly to become adsorbed on the PVDF surface because of theinteraction between hydrophobic parts of BSA and the hydrophobicPVDF, leading to formation of a rigid adsorption layer. With increas-ing amounts of adsorbed BSA, there are fewer adsorption sites onthe PVDF surface and BSA cannot be deformed easily because ofsteric hindrance, resulting in formation of a soft adsorption layer.On the other hand, soft adsorption layers were formed on EVOH and
PES films, because hydration layers in these polymer films controladsorption of BSA onto the polymer surface. Salgın et al. reportedthat BSA adsorbed onto a hydrophobic polyethersulfone mem-brane was deformed and BSA adsorbed onto a hydrophilic cellulose
164 M. Hashino et al. / Journal of Membrane Science 384 (2011) 157– 165
0.0
0.2
0.4
0.6
0.8
1.0J/
J0 [-
]
EVOHPESPVDF
(a)
0
20
40
60
80
100
6050403020100Time [min]
Rej
ectio
n [%
]
EVOHPESPVDF
(b)
F5l
tt
3
sPB7ff
Faa
0.0
0.5
1.0
1.5
2.0
2.5
3.0
3.5
4500350025001500500
time [s]
Am
ount
of a
dsor
bed
BSA
[mg/
L]
Buffer solution
BSA solution
Buffer solution
Desorption amount
Fig. 9. Time-course of adsorption of 1000 mg/L BSA solution on PVDF film and des-orption of BSA following membrane rinsing with buffer solution.
-0.5
0
0.5
1
1.5
0-5-10-15-20-25
Frequency shift [Hz]
Dis
sipa
tion
shift
[Hz]
EVOHPESPVDF
ig. 7. Relative permeability (a) and rejection (b) as a function of filtration time for0 mg/L BSA solutions using EVOH, PES and PVDF membranes. Arrows and dashed
ines in the figure show the backwashing process.
riacetate membrane had a globular structure like the BSA in solu-ion [25].
.4. Adhesion force measurements
The adhesion forces between PVDF–BSA and BSA–BSA mea-ured using AFM are shown in Fig. 11. The adhesion force betweenVDF and BSA was about −1.5 nN, while that between BSA and
SA was almost zero. Because BSA has a negative charge at pH.0, which is above the isoelectric point (4.8) [26], the interactionorce between BSA and BSA molecules is an electrostatic repulsiveorce, resulting in a slight adhesion force between BSA and BSA. The0
1
2
3
4
5
10008006004002000BSA concentration [mg/L]
Am
ount
of a
dsor
bed
BSA
[mg/
m2]
EVOHPESPVDF
ig. 8. Adsorption isotherms for BSA on EVOH, PES and PVDF films. pH = 7.0, temper-ture = 299 K, and adsorption time = 30 min. The solid, broken and dotted lines showdsorption isotherms calculated by using Langmuir isothermal adsorption equation.
Fig. 10. Relationship between dissipation shift and frequency shift induced byadsorption of 1000 mg/L BSA solution on EVOH, PES and PVDF films.
strong adhesion force between PVDF and BSA may be attributedto a hydrophobic interaction between the hydrophobic PVDF andhydrophobic parts of BSA, as mentioned above. Because the interac-tion between PVDF and BSA was strong, and that between BSA and
-1.5
-1
-0.5
0
0.5
1
45035025015050-50Distance [nm]
Forc
e [n
N]
PVDF-BSABSA-BSA
Fig. 11. Adhesion forces of BSA-modified microspheres to PVDF films with andwithout immersion in BSA solution.

mbra
BaAriBfptBrufd
4
bmmobwimpornacoBmaltustbts
iraw
A
tI(Ki
[
[
[
[
[
[
[
[
[
[
[
[
[
[
[
[
[
M. Hashino et al. / Journal of Me
SA was weak, the adsorption of BSA on PVDF film was monolayerdsorption under the conditions in this study, as shown in Fig. 8.
small amount of desorption of BSA from PVDF film, achieved byinsing the membrane with buffer solution, was observed, as shownn Fig. 9. This is also due to the strong interaction between PVDF andSA. Moreover these AFM results can explain the result obtained
ollowing filtration of BSA solution through PVDF membrane, inarticular, the fact that membrane fouling largely resulted fromhe physicochemical interaction of BSA and membrane, rather thanSA–BSA interaction on the membrane surface. Huisman et al. alsoeported that the hydrophobic interaction between a polysulfoneltrafiltration membrane and BSA dominated initial membraneouling, and that the interaction between BSA and BSA was pre-ominant in later membrane fouling [27].
. Conclusions
The influence of different kinds of membrane materials on mem-rane fouling with BSA was examined using EVOH, PES and PVDFembranes prepared by NIPS. The resultant EVOH, PES and PVDFembranes had membrane structure with a skin layer on the
uter surface and macrovoid in the cross-section. These mem-rane showed molecular weight cut-offs of 45–130 kDa and pureater permeability of 70–100 L/(m2 bar h). The membrane foul-
ng behaviors with BSA were different among the three kinds ofembranes. EVOH showed lower BSA rejection and high relative
ermeability, while severe decline of relative permeability wasbserved for PVDF membrane having higher BSA rejection. Theesults of filtrations for BSA solutions by three membranes couldot be explained by the properties of pure water permeabilitiesnd initial MWCOs of three membranes. The fouling behaviorsould be explained by the degree of BSA adsorption on polymers,btained using QCM-D measurements. Moreover, the degrees ofSA adsorption were related to the hydrophilicities of the poly-ers. Hydrophobic PVDF showed the highest amount of adsorption
nd a rigid adsorption layer, while hydrophilic EVOH showed theowest amount of adsorption and a soft adsorption layer. Fromhe adhesion force measurements for PVDF–BSA and BSA–BSAsing AFM, it was found that the PVDF–BSA interaction was muchtronger than the BSA–BSA interaction. These results also indicatehat the membrane fouling behaviors in this study were affectedy physicochemical interactions between polymers and BSA ratherhan an interaction between BSA and BSA on the membraneurface.
This study confirmed that membrane materials significantlynfluenced membrane fouling. The selection of membrane mate-ials in consideration of the interaction between membranend foulant contributes to controlling membrane fouling andidespread of membrane technology.
cknowledgments
This work was supported financially by Special Coordina-ion Funds for Promoting Science and Technology, Creation of
nnovation Centers for Advanced Interdisciplinary Research AreasInnovative Bioproduction Kobe), MEXT, Japan. We thank Dr.imura (Hokkaido University) and Dr. Yamamura who gave usnformation about AFM measurement.
[
ne Science 384 (2011) 157– 165 165
References
[1] S.S. Adham, J.G. Jacangelo, J.-M. Laîné, Characteristics and costs of MF and UFplants, J. AWWA 88 (1996) 22.
[2] H. Yamamura, S. Chae, K. Kimura, Y. Watanabe, Transition in fouling mechanismin microfiltration of a surface water, Water Res. 41 (2007) 3812.
[3] K.J. Howe, A. Marwah, K.P. Chiu, S.S. Adham, Effect of coagulation on the size ofMF and UF membrane foulants, Environ. Sci. Technol. 40 (2006) 7908.
[4] N. Lee, G. Amy, J.-P. Croué, Low-pressure membrane (MF/UF) fouling associatedwith allochthonous versus autochthonous natural organic matter, Water Res.40 (2006) 2357.
[5] N. Her, G. Amy, H.-R. Park, M. Song, Characterizing algogenic organic matter(AOM) and evaluating associated NF membrane fouling, Water Res. 38 (2004)1427.
[6] H. Yamamura, K. Kimura, Y. Watanabe, Mechanism involved in the evolution ofphysically irreversible fouling in microfiltration and ultrafiltration membranesused for drinking water treatment, Environ. Sci. Technol. 41 (2007) 6789.
[7] N. Lee, G. Amy, J.-P. Croué, H. Buisson, Identification and understanding of foul-ing in low-pressure membrane (MF/UF) filtration by natural organic matter(NOM), Water Res. 38 (2004) 4511.
[8] A.I. Schäfer, U. Schwicker, M.M. Fischer, A.G. Fane, T.D. Waite, Microfiltrationof colloids and natural organic matter, J. Membr. Sci. 171 (2000) 151.
[9] L. Fan, J.L. Harris, F.A. Roddick, N.A. Booker, Influence of the characteristics ofnatural organic matter on the fouling of microfiltration membranes, Water Res.35 (2001) 4455.
10] K. Kimura, H. Yamamura, Y. Watanabe, Irreversible fouling in MF/UF mem-branes caused by natural organic matters (NOMs) isolated from differentorigins, Sep. Sci. Technol. 41 (2006) 1331.
11] W.A. Ducker, T.J. Senden, R.M. Pashley, Direct measurement of colloidal forcesusing an atomic force microscope, Nature 353 (1991) 239.
12] W.A. Ducker, T.J. Senden, Measurement of forces in liquids using a force micro-scope, Langmuir 8 (1992) 1831.
13] Q.L. Li, M. Elimelech, Organic fouling and chemical cleaning of nanofiltrationmembranes; measurements and mechanisms, Environ. Sci. Technol. 38 (2004)4683.
14] A.R. Costa, M.N. de Pinho, M. Elimelech, Mechanisms of colloidal natural organicmatter fouling in ultrafiltration, J. Membr. Sci. 281 (2006) 716.
15] J.A. Brant, K.M. Johnson, A.E. Childress, Characterizing NF and RO membranesurface heterogeneity using chemical force microscopy, Colloids Surf. A 280(2006) 45.
16] M. Tanaka, A. Mochizuki, T. Shiroya, T. Motomura, K. Shimura, M. Onishi,Y. Okahata, Study on kinetics of early stage protein adsorption on poly(2-methoxyethlacrylate) (PMEA) surface, Colloids Surf A: Physicochem. Eng.Aspects 203 (2002) 195.
17] C. Liu, B.J. Meenan, Effect of air plasma processing on the adsorption behaviorof bovine serum albumin on spin-coated PMMA surfaces, J. Bionic Eng. 5 (2008)204.
18] J.T. Kim, N. Weber, G.H. Shin, Q. Huang, S.X. Liu, The study of �-lactoglobulinadsorption on polyethersulfone thin film surface using QCM-D and AFM, J. FoodSci. 72 (2007) 214.
19] G. Sauerbrey, The use of quartz oscillators for weighing thin layers and formicroweighing, Z. Phys. 155 (1959) 206.
20] M. Rodahl, B. Kasemo, A simple setup to simultaneously measure the resonantfrequency and the absolute dissipation factor of a quartz crystal microbalance,Rev. Sci. Instrum. 67 (1996) 3238.
21] H. Yamamura, K. Kimura, T. Okajima, H. Tokumoto, Y. Watanabe, Affinity offunctional groups for membrane surfaces, Implications for physically irre-versible fouling, Environ. Sci. Technol. 42 (2008) 5310.
22] M. Tanaka, A. Mochizuki, T. Motomura, K. Shimura, M. Onishi, Y. Okahata, In situstudies on protein adsorption onto a poly (2-methoxyethylacrylate) surface bya quartz crystal microbalance, Colloids Surf. A: Physicochem. Eng. Aspects 193(2001) 145.
23] E. Matthiasson, The role of macromolecular adsorption in fouling of ultrafiltra-tion membranes, J. Membr. Sci. 16 (1983) 23.
24] T. Indest, J. Laine, K.S. Kleinschek, L.F. Zemljic, Adsorption of human serumalbumin (HAS) on modified PET films monitored by QCM-D, XPS and AFM,Colloids Surf. A 360 (2010) 210.
25] S. Salgın, S. Takac , T.H. Özdamar, A parametric study onprotein–membrane–ionic environment interactions for membrane fouling,Sep. Sci. Technol. 40 (2005) 1191.
26] D.A. Musale, S.S. Kulkarni, Relative rates of protein transmission through
poly(acrylonitrile) based ultrafiltration membranes, J. Membr. Sci. 136 (1997)13.27] I.H. Huisman, P. Prádanos, A. Hernández, The effect of protein–protein andprotein–membrane interactions on membrane fouling in ultrafiltration, J.Membr. Sci. 179 (2000) 79.