journal of exercise science and physiotherapy (jesp) of positional release therapy and deep...
TRANSCRIPT

ISSN 0973-2020
i
Journal of Exercise Science and Physiotherapy (JESP) An official Peer Reviewed Journal of Exercise Fitness & Health Alliance, EFHA
(Published biannually in June & December)
Volume 9, No. 1: 2013
Contents
EDITOR’S PAGE ii
Original Papers
1. Prevalence of Glycemic Status, Obesity & Waist Circumference in Punjabi Type 2 Diabetics
Kumar, Ashok 1
2. Effect of Aerobic Dance on the Body Fat Distribution and Cardiovascular Endurance in Middle
Aged Women
Jaywant, S.P
6
3. Efficacy of Myofascial Release in Fibromyalgia
Thakur, Manisha, Narkeesh, A. & Kanimozhi 11
4. Effect of Wrist Manipulation & Cyriax Physiotherapy Training on Pain & Grip Strength in Lateral
Epicondylitis Patients Goyal, M., Kumar, Ashok, Monga, M. and Moitra, M.
17
5. Comparative Study of the Age Related Structural Changes in the Knee between Sportspersons and
Non Sportspersons
Saini, Gagandeep Kaur., Multani, N. K.
23
6. Comparison on Imagery and Self-Esteem of Various Level Footballers
Mazumder, S. & Ghosh, S.S. 31
7. Treatment of Plantar Fasciitis by Taping vs. Iontophoresis: A Randomized Clinical Trial
Goyal, M., Kumar, Ashok, Mahajan, N. and Moitra, M. 34
8. Effect of Positional Release Therapy and Deep Transverse Friction Massage on Gluteus Medius
Trigger Point - A Comparative Study
Doley , M,, Warikoo, D. & Arunmozhi, R.
40
9. Impact of Chronicity on Lipid Profile of Type 2 Diabetics
Singh, Gurdeep & Kumar, Ashok
46
10. Comparative Dose-Response Study of Stretching On Strength of Proximal (Hamstring) and Distal
(Calf) Muscle
Khan, M., Quddus, N., Chawla C, Anwer, S,
51
11. Effeciveness of Integrated Soft Tissue Mobilization on the Functional Outcome in Chronic Low
Back Pain Patients
Leo Aseer, Antony P, Subramanian, Iyer Lakshmi
57
12. A Case study of a Rare Case of Turner‘s Hypoplasia and Unilaterally Fused Deciduous and
Permanent Lateral Incisor Caused By Trauma
Verma, Leena
69
Instructions to Contributors a

Journal of Exercise Science and Physiotherapy, Vol. 9, No. 1, 2013. EDITOR’S PAGE
ii
Exercise Fitness And Health Alliance
(Indexed with IndMed/MedINDIA a portal of Indian Medical journals)
www.efha.in
Journal of Exercise Science and Physiotherapy
VOLUME 9, NO.1: 2013
EDITOR’S PAGE
I am happy that the Volume 9, No. 1 issue of the Journal of Exercise Science and Physiotherapy (JESP) is ready for the
readers and circulation. This issue of JESP contains twelve research reports on different important aspects of exercise science.
Kumar, Ashok from Patiala, Punjab studied the prevalence of glycemic status, obesity and waist circumference in Punjabi male
Type 2 Diabetics and concluded that prevalence of poor glycemic control and obesity exist but obesity and overweight were more
prevalent in Punjabi Type 2 diabetics and recommended that efforts should be made to control this in type 2 diabetics for their well
being and possibly to avoid the risk of disease like cardiovascular later in life. Jaywant from Mumbai, Maharashtra evaluated the
effect of Dance Aerobics on cardiovascular endurance and body fat percentage in middle aged women. She concluded that if a
person is aiming for just weight loss, then the dance aerobics is an ideal choice, however, if the person is aiming for improved
cardiovascular status, other physical exertional activities should be considered. Thakur et al from Punjab investigated the efficacy
of myofascial release on patients with fibromyalgia and its influence on pain and concluded that myofascial release is effective in
reducing pain. Goyal et al from Mullana, Haryana evaluated the effect of manipulation of wrist technique and Cyriax
physiotherapy training in reducing pain and improving grip strength in lateral epicondylitis. They concluded that the patients of
lateral epicondylitis procured more substantial benefits from wrist manipulation as compared to Cyriax physiotherapy after three
weeks. Saini & Multani from Patiala, Punjab compared the structural changes in the knee between age-matched sportspersons
and non sportspersons and concluded that sportspersons have less worsened structural knee changes, better knee joint range of
motion, muscle strength, physical activity levels and a better quality of life as compared to the age-matched non sportsperson peers.
Mazumder & Ghosh from Kalyani, West Bengal carried a comparison on imagery and self-esteem of various levels of
footballers and reported significant differences in the mean value of imagery and self-esteem between the district and state level
footballers. Goyal and associates from Mullana, Haryana studied the effect of combination of a Taping and Iontophoresis or
Taping alone in the treatment of Plantar Fasciitis pain.. They concluded that the use of Iontophoresis along with the Taping,
revealed a better management for pain and stiffness as compared to Taping alone. Doley and coworkers from Dehradun,
Uttarakhand compared the effectiveness of Positional Release Therapy & Deep Transverse Friction Massage On Gluteus Medius
Trigger Point and report that Deep transverse friction massage is a better choice of treatment in improving pain threshold in subjects
with gluteus medius trigger point. Singh & Kumar, Ashok from Patiala, Punjab studied the impact of chronicity of type 2
diabetes on lipid profile in type 2 diabetics and concluded from their results that the chronicity of Type 2 Diabetes mellitus disturb
the normal levels of lipid profile that is dyslipidemia if unchecked this may lead to atherosclerosis and ultimately Cardio-Vascular
Disease (CVD) and it is the commonest cause of death in type 2 diabetics. Khan et al from Delhi, compared the stretching induced
strength changes between the proximal and distal groups of muscles and concluded that Shorter stretching (2 minute) increases
maximum isometric voluntary contraction force in both muscles but relatively more in the calf. Leo Aseer & Subramaniam from
Tamilnadu analyzed the effectiveness of integrated soft tissue mobilization on the pain, lumbar spine mobility and the outcome on
functions in chronic low back pain (CLBP) and concluded that integrated soft tissue mobilization offered relatively moderate
improvement in the functional outcome than that observed in the control group. In the end A Case study of a Rare Case of Turner‘s
Hypoplasia and Unilaterally Fused Deciduous and Permanent Lateral Incisor Caused by Trauma is presented by Leena Verma
from Chandigarh.
S.K. Verma
Editor-in-Chief: Prof. (Dr.) S.K. Verma

Prevalence of Glycemic Status, Obesity & Waist Circumference in Punjabi Type 2 Diabetics – Kumar, Ashok
1
Prevalence of Glycemic Status, Obesity & Waist Circumference in
Punjabi Type 2 Diabetics Kumar,
Ashok
Assistant Professor, Department of Sports Science, Punjabi University Patiala (India),
Email: [email protected]
Introduction
Diabetes mellitus is a chronic
metabolic condition characterised
by
persistent hyperglycaemia with resultant
morbidity and mortality related primarily
to its associated complications. Despite the
association of obesity with poorer
glycemic control and cardiovascular
morbidity and mortality less attention has
been given to its management relative to
the attainment of glycemic targets. The
diabetes mellitus is becoming more and
more prevalent in Indian society. In India,
it is estimated that approximately 2% of
the population, 15 million people have
diabetes (Swami, 1984). The number of
cases is said to be rising by 5%-6% each
year and an estimated 300,000 people die
from diabetes and its related complications
(Herman et al., 1984). There are about
3.5 crore diabetics in India and the figure
will rise to about 5.2 crores by 2025.
Every 5th patient visiting a consulting
physician is a diabetic, and, every 7th
patient visiting a family physician is a
diabetic. Keeping in view the alarming
increase in the incidence and prevalence of
diabetics in India, WHO has declared
Abstract
Aim-To observe the prevalence of glycemic status, obesity and waist circumference in Punjabi
male Type 2 Diabetics. Materials & Methods-Two hundred forty type 2 diabetics Punjabi males
with age ranging from 30 to 70 years volunteered to participate in this study as subjects. The
glycemic status (fasting blood sugar & glycated haemoglobin, HbA1c), obesity (BMI) & waist
circumference (WC) were recorded with standard procedures. WHO criteria determined BMI
and WC categories. The statistical analysis was done by using SPSS version 16.0 and the level
of significance was <.05. Results-The mean age, height, weight, fasting blood sugar (FBS),
glycated haemoglobin (HbA1c), body mass index (BMI) and waist circumference (WC) of
studied type 2 diabetics were 50.75±11.4 years, 166.69±7.6cm, 75.88±11.8Kg, 146.37±28.6
(mg/dl), 7.34±1.2 (%), 27.29±3.6 and 102.82±8.0 (cm) respectively. Based on fasting blood
sugar, 10.4% studied type 2 diabetics had normoglycemia (FBS≤120mg/dl), 89.6% were
hyperglycemia (FBS≥120mg/dl). Based on glycated haemoglobin (HbA1c), 25.4% studied type 2
diabetics had good control of blood sugar (HbA1c≤6.5), 30.4% were average control (HbA1c
6.5-7.5), 26.7% were poor control (HbA1c 7.5-8.5) and 17.5% were morbid control. Based on
BMI, 26.7%, study type 2 diabetics were normal, 55% wer overweight, 14.5% was obese Class I,
3% were Obese Class II and 1.8% were Obese Class III. Based on waist circumference of the
sample population of type 2 diabetics 10.9% were obese, 24.1% had increased risk for metabolic
syndrome [action level I (WC ≥ 94cm)] and 61.7% had substantially increased risk [action level
II (WC ≥102cm)]. Conclusion-it was concluded that prevalence of poor glycemic control and
obesity exist but obesity and overweight were more prevalent in Punjabi Type 2 diabetics.
Keywords: FBS, HbA1c, BMI.

Journal of Exercise Science and Physiotherapy, Vol. 9, No. 1: 1-5, 2013
2
India as the ―Diabetic Capital of the
World‖ (Vijay, 2002). Thus the
management of diabetes is a big challenge
for health professionals. The quality of life
of diabetics decrease, resulting in a decline
in one's ability to give best to the society
and also increase in health-care cost. The
aim of the present research work was to
observe the prevalence of glycemic status,
obesity & waist circumference of Punjabi
type 2 diabetics.
Materials and Methods
Two hundred forty type 2 diabetics
Punjabi male with an age ranging from 30
to 70 years volunteered to participate in
this study as subjects. The glycemic status
(fasting blood sugar & glycated
haemoglobin, HbA1c), obesity (BMI) &
waist circumference (WC) were recorded
with standard procedure. WHO criteria
determined BMI and WC categories. The
statistical analysis was done by using
SPSS version 16.0 and the level of
significance was <.05.
Results
The mean age, height, weight, fasting
blood sugar (FBS), glycated haemoglobin
(HbA1c), body mass index (BMI) and
waist circumference (WC) of studied type
2 diabetics were 50.75±11.4 years,
166.69±7.6cm, 75.88±11.8Kg,
146.37±28.6 (mg/dl), 7.34±1.2 (%),
27.29±3.6 and 102.82±8.0 (cm)
respectively (Table 1). Table 1: Descriptive Statistics of Punjabi Type 2
Diabetics Variables
Age (years) 50.75±11.4
Height (cm) 166.69±7.6
Weight(kg) 75.88±11.8
FBS (mg/dl) 146.37±28.6
HbA1C (%) 7.34±1.2
Body Mass index, BMI 27.29±3.6
Waist Circumference (cm) 102.82±8.0
Based on fasting blood sugar, 10.4%
studied type 2 diabetics had
normoglycemia (FBS≤120mg/dl), 89.6%
were having hyperglycemia
(FBS≥120mg/dl) (Table 2).
Table 2: Percentage Distribution of Type 2 Diabetics
on the basis of Fasting Blood Sugar
Fasting Blood Sugar category
Up to 120 (mg/dl) 10.4% (25)
120 to 150 (mg/dl) 55% (132)
151 to 180 (mg/dl) 27.1% (65)
Above 180 (mg/dl) 7.5% (18)
Based on glycated haemoglobin
(HbA1c), 25.4% studied type 2 diabetics
had good control of blood sugar
(HbA1c≤6.5), 30.4% were having average
control (HbA1c 6.5-7.5), 26.7% were
having poor control (HbA1c 7.5-8.5) and
17.5% demonstrated morbid control
(Table 3).
Table 3: Percentage Distribution of Type 2 Diabetics
on the basis of HbA1c
HbA1c category
<6.5 25.4% (61)
6.5-7.5 30.4%(73)
7.5-8.5 26.7%(64)
>8.5 17.5%(42)
Based on BMI, 26.7%, study type 2
diabetics were normal, 55% were
overweight, 14.5% were obese Class I, 3%
were Obese Class II and 1.8% were Obese
Class III (Table 4).
Table 4: Percentage Distribution of Type 2 Diabetics
on the basis of BMI
BMI Category BMI range,kg/ m2
Normal 18.5 to 24.9 26.7% (66)
Overweight 25 to 29.9 55%(130)
Obese Class I 30 to 34.9 14.5%(35)
Obese Class II 35 to 39.9 3%(7)
Obese Class III over 40 1.8%(2)
Based on waist circumference of the
sample population of type 2 diabetics
10.9% were obese, 24.1% had increased
risk for metabolic syndrome [action level I
(WC≥94cm)] and 61.7% had substantially

Prevalence of Glycemic Status, Obesity & Waist Circumference in Punjabi Type 2 Diabetics – Kumar, Ashok
3
increased risk [action level II (WC
≥102cm)] (Table 5).
Table 5: Percentage Distribution of Type 2 Diabetics
on the basis of Waist Circumference
Waist circumference category
<90cm 3.3% (8)
≥90cm 10.9% (26)
≥94cm (action level I) 24.1% (58)
≥102cm (action level II) 61.7% (148)
The glycated haemoglobin (HbA1c)
was highly significantly and positively
related with fasting blood sugar (r=0.70
p<.01) of type 2 diabetics in the studied
sample. Similarly, the waist circumference
was also significantly positively related
with body weight (r=0.62 p<.01) and body
mass index (r=0.46 p<.01) (Table 6).
Table 6: Correlation (Pearson’s) among Glycemic and
Obesity variables
Variables FBS HbA1c BMI Waist
Circumference
Weight -.04 -.01 .80**
.62**
FBS - .70**
-.05 -.10
HbA1c - -.01 -.10
BMI - .46**
* significant at 0.05 level; **significant at 0.01 level
The high prevalence of obesity in this
population of diabetes suggests that
structured weight reduction should be an
integral part of attainment of glycemic
targets.
Discussion
The results shows that overweight
and obesity is common in the Punjabi type
2 diabetes patients. Obesity is a major
potentially modifiable risk factor for type
2 diabetes (Pinkney, 2002). This is similar
to the association between obesity and
diabetes shown in other studies (Kumar et
al., 2008 and Daoust et al., 2006). The
percentage of patients with central obesity
(abdomen) was higher than those with
general obesity indicating that early
detection and control of central obesity
might be more important in Asian
population. There is an indication of waist
circumference being an important indicator
of progression to diabetes (Gautier et al.,
2010). It is associated with poorer control
of blood glucose levels, blood pressure and
cholesterol, placing persons with diabetes
at higher risk for both cardiovascular and
microvascular disease. While studies have
well established the strong epidemiological
association between obesity and
development of diabetes (UKPDS, 1988),
little attention has been paid to the
significance of obesity in Punjabi
population with diabetes. This is important
because of the fact that obesity is an
independent risk factor for cardiovascular
disease (Rimm et al., 1995), an effect
likely to be mediated, at least in part
through its known associations with the
metabolic syndrome. Clinical evidence
suggests that the association of diabetes
with central obesity is stronger than the
association with general fat (Vazquez et
al., 2007). Waist circumference has been
used as measures of central obesity and
body mass index has been used as a
measure of general obesity. Studies have
indicated that central obesity might be
more important in the Indian population
(Kumar et al., 2008 and Daoust et al.,
2006). Central obesity has been associated
with decreased glucose tolerance,
alterations in glucose insulin homeostasis,
reduced metabolic clearance of insulin,
and decreased insulin-stimulated glucose
disposal (Vazquez et al., 2007). About
55% of the patients in our sample are
overweight as per the revised guidelines
for the measurement of obesity (by using

Journal of Exercise Science and Physiotherapy, Vol. 9, No. 1: 1-5, 2013
4
BMI) for Asian population (WHO Expert
Consultation 2004). Also, increased waist
circumference was more common. To
conclude, our study showed that obesity is
common in type 2 diabetics. Central
obesity is significantly more common in
our population. Both general and central
obesity is more common. It is known that
weight loss in overweight patients with
type 2 diabetes rapidly reverses the state
of insulin resistance and can restore
normal blood glucose concentrations
(Henry et al., 2004). A variety of
intervention studies show that patients
with type 2 diabetes who succeed in losing
weight often enjoy modest improvements
in glycemic control and cardiovascular
risk profiles, as long as the weight loss is
maintained (Williamson et al., 2000).
Conclusion: The results of this study
revealed that prevalence of poor glycemic
control and obesity exist but obesity
(abdominal) and overweight were more
prevalent in Punjabi Type 2 diabetics.
Therefore, efforts should be made to
control this in type 2 diabetics for their
well being and possibly to avoid the risk of
disease like cardiovascular later in life.
Financial Support: This is a part of a
major research project work financially
supported by University Grants
Commission, New Delhi, India.
Acknowledgment: The author thanks all
the subjects who voluntarily participated
in this study.
References
Daousi, C., Casson, I.F., Gill, G.V. 2006.
Prevalence of obesity in type 2 diabetes
patients in secondary care: association with
cardiovascular risk factors. Postgrad. Med.
J. 82: 280-284.
Gautier, A., Roussel, R., Ducluzeau, P.H. 2010.
Increases in waist circumference and weight
as predictors of type 2 diabetes in
individuals with impaired fasting glucose:
Influence of baseline BMI. Diabetes Care
33(8): 1850-1852.
Henry, R.R., Wiest-Kent, T.A. and Scheaffer, L.
1986. Metabolic consequences of very low-
calorie diet therapy in obese non-insulin-
dependent diabetic and nondiabetic subjects.
Diabetes, 35: 155–64.
Herman, W.H., Sinnock, P., Brenner, E.,
Brimberry, J.L., Langford, D., Nakashima,
A., Sepe, S.J., Teutsch, S.M. & Mazze, R.S.
1984. An Epidemiologic model for diabetes
mellitus: incidence, prevalence & mortality.
Diabetes Care, 7: 367-371.
Kumar, S., Mukherjee, S., Mukhopadhyay, P.
2008. Prevalence of diabetes and impaired
fasting glucose in a selected population with
special reference to influence of family
history and anthropometric measurements –
The Kolkata policeman study. JAPI, 56:
841-844.
Pinkney, J. 2002. Prevention and cure of type 2
diabetes.. B.M.J., 325: 232–3.
Rimm, E.B., Stampfer, M.J. and Giovannucci, E.
1995. Body size and fat distribution as
predictors of coronary heart disease among
middle-aged and older US men. Am. J.
Epidemiol., 141: 1117–27.
Swami Shankardevananda Saraswati. 1984.
In:Yogic management of asthma & diabetes.
Publisher: Bihar Scool of Yoga, Bihar, India
UK Prospective Diabetes Study (UPDS). 1988.
Characteristics of newly presenting type 2
diabetic patients: estimated insulin
sensitivity and islet b-cell function.
Multicentre study. Diabet. Med., 5: 444–8.
Vazquez, G., Duval, S., Jacobs, D.R. and
Silventoinen, K. 2007. Comparison of body
mass index, waist circumference, and
waist/hip ratio in predicting incident
diabetes: A meta-analysis. Epidemiol. Rev.
29: 115–128.
Gupta, V. 2002. Diabetes in Elderly Patients. JK
Practitioner, 91(4): 258-259.
WHO Expert Consultation. 2004. Appropriate
body-mass index for Asian populations and
its implications for policy and intervention
strategies. Lancet, 363: 157-63.

Prevalence of Glycemic Status, Obesity & Waist Circumference in Punjabi Type 2 Diabetics – Kumar, Ashok
5
Williamson, D.F., Thompson, T.J. and Thun, M.
2000. Intentional weight loss and mortality
among overweight individuals with diabetes.
Diabetes Care, 23: 1499–504.

Journal of Exercise Science and Physiotherapy, Vol. 9, No. 1: 6-10, 2013
6
Effect of Aerobic Dance on the Body Fat Distribution and
Cardiovascular Endurance in Middle Aged Women
Jaywant, P.J.
Asst. Professor, Dept of Physiology, Grant Government Medical College & Sir JJ Group of
Hospitals, Mumbai 400008. Email: [email protected]
Introduction
The aerobic dancing is a popular
means of exercise regimen, especially in
the urban population.Exercising to music,
non requirement of costly equipments or
space especially have made dance aerobics
very popular in urban areas. Numerous
studies carried out on aerobic dance and
its effect on body. These have yielded
mixed results of the aerobic dancing on
various physiological parameters of the
population (Kathleen & Rockefeller,
1979; Patricia, 1987; Williford et al,
1989; Garber et al 1992; Grant et al,
2002; Lehri, and Mokha, 2006; Pantelić
et al, 2007; Jakubec et al, 2008; Schiffer
et al, 2008; Angioi et al, 2009; Keogh et
al 2009; Leelarungrayub et al, 2011;
Hopkins et al, 1990). The difference may
be due to difference in the cadence and
impact of the various dance schedules
(Uchechukwu, 2009). The following study
considers the effect of dance aerobics on
the VO2max and body fat content on middle
aged women. The dance schedule followed
in the study was based on Cooper Protocol
(Bull, 1996).
Materials and Methods:
The study was carried out after
obtaining the Institutional Ethical
Committee Approval. The study was
carried out in two groups. Group I
consisted of 60 middle aged women who
practiced aerobic dance since atleast 6
months..Each session of aerobic dance
Abstract
Dance aerobics is a popular means of exercise in the urban population. This study evaluates effect
of Dance Aerobics on cardiovascular endurance and body fat percentage in middle aged women.
To ensure uniformity in the findings, Cooper Protocol, a standardised protocol for dance aerobics
was followed, ensuring optimal exercise intensity and minimal musculotendinous damage.
120 middle aged women divided in two groups were examined for VO2max and body fat
percentage .Group I comprised 60 women engaged in regular aerobic dance sessions, since 6
months. Group II did not engage in any exertional physical activity. Unpaired t test was used. p=
0.001 considered significant. Aerobic dancers exhibited i) no significant difference in VO2max
(p=0.00201) ii) lower fat percentage (p= 0.01462), indicating aerobics is highly effective in
weightloss, but effects on cardiovascular endurance are not pronounced. Increasing intensity of
existing protocol to achieve increased VO2max may hasten musculotendinous damage. This should
be considered before an individual selects aerobic dancing as fitness activity.
Keywords: Cooper Protocol, VO2max, Callipers

Effect of Aerobic Dance on the Body Fat Distribution and Cardiovascular Endurance …..in Women. – Jaywant, P.J.
7
lasted for one hour, thrice a week. Group
II consisted of 60 middle aged women not
engaged in any exertional physical
activity. Prior to testing, required pre-test
instructions were given to all volunteers
and the tests were properly explained and
demonstrated. The total body fat
percentage (Grzonkowski et al, 1989) and
VO2max (McArdle et al, 2010) respectively
was calculated in the two groups. The skin
fold thickness was measured by skin fold
calipers (Gause & Dey, 2005) at triceps,
subscapular region, suprailiac region,
abdomen and thighs. The following
precautions were followed while taking the
measurements by the skin fold callipers:
The volunteers were asked not to eat
or drink anything two hours prior to
measurement of body fat. The callipers
were placed on the exact site marked
before. The readings taken in the first 5
seconds only were considered. The
callipers were placed perpendicular to the
site measured. The sum of skin folds
reflected absolute or percentage changes in
body fat (McArdle et al, 2010).
Measurement sites for the callipers were
as follows
1. Triceps: Vertical fold in the
posterior midline of right upper
arm, half way between the tip of
shoulder and the tip of elbow; the
elbow remains in an extended,
relaxed position.
2. Subscapular: Oblique fold just
below the bottom tip of of right
scapula.
3. Iliac : Slightly oblique fold just
above the iliac crest
4. Abdominal : vertical fold 1 inch to
right of umbilicus
5. Thigh: vertical fold at the
midpoint of right thigh.
6. Biceps : vertical fold at the
midline of the right upper arm
Formula for prediction of fat from skin
fold:
% body fat = 8.997+ 0.24658 (3SKF) -
6.343 (gender) – 1.998 (race)
Where SKF = sum of skin folds
Gender = 0, female 1, male
Race = 0, white 1, black
The equation was age adjusted for
specific ages as the % body fat increases
with age.
The sum of skin folds reflects absolute or
percentage changes in body fat
(Bandyapadhyay, 2005).
Classification Men Women
Essential fat 2-4 10-12
Athletes 6-13 14-20
Fit 14-17 21-24
Acceptable 18-35 25-31
Obese 35 plus 31 pLus
The VO2max is the measure of
cardiovascular endurance of an
individual (McArdle et al, 2010). This
was measured using the Queens Step
Test (Chatterjee et al, 2005) - a three-
minute step test (each step 16.25
inches). The post exercise recovery
heart rate was calculated post each
stepping cycle to a four step cadence,
‗up up down down‘. The women
performed 22 step ups per minute,
regulated by a metronome set at 88
beats per minute. The step test began
after a brief demonstration and
practice. At the completion of 3
minutes, pulse rate was measured for
15 seconds, after 5 to 20 secs of
recovery (Uchechukwu, 2009). (STPULSE)

Journal of Exercise Science and Physiotherapy, Vol. 9, No. 1: 16-22, 2013
8
Recovery Heart Rate was converted to
beats per minute and calculated as.
VO2max = 65.81 – (0.1847 x STPULSE) for women
Results & Discussion
The results were tabulated and
analysed by SPSS software. The
unpaired t test was applied. p = 0.001
was considered significant.
Table 1: Comparison of aerobic dancers & working women
Variables
Aerobic dancer Working woman Mann-Whitney Test applied
Mean SD Mean SD z-value p-value Difference is-
Age (yrs) 38.07 5.22 37.92 3.80 -0.146 0.884 Not significant
Queens step test 38.88 5.33 35.19 5.48 -3.089 0.00201 Not Significant
SFT (%) 27.29 4.06 29.13 3.81 -2.442 0.01462 Significant
3 2 .8
2 8 .3
57.4
4 5
26.7
9 .8
0
10
2 0
3 0
4 0
50
6 0
70
A erob ic D ancers N on D ancers
Perc
en
tag
e (
%)
Good Average Below Average
Figure 1: Comparison of Queen's Step Test of Dancers
& Non-dancers
2 4 .6
15
6 7.2
58 .3
26.7
8 .2
0
10
2 0
3 0
4 0
50
6 0
70
8 0
A erob ic D ancers N on D ancers
Perc
en
tag
e (
%)
Fit Acceptable Obese
Figure 2: Comparison of Body Fat % of Dancers &
Non-dancers
The results show that though the
VO2max values are higher in the dancers
than the non dancers, the result is not
statistically significant (p=0.00201) [Fig.
I]. The values for the total body fat
percentage however are statistically
significant (p=0.01462) [Fig. 2].
The vigorous dance activity increases
the resting metabolism in the body cells.
There is facilitation of lipid mobilisation
and oxidation especially from the visceral
adipose tissue (Guyton and Hall, 1996).
There is probably an increase in estimated
daily energy expenditure in aerobic
dancers compared to working women that
creates a slightly negative energy balance
in aerobic dancers, causing calorie
expenditure, resulting in the weight loss.
This may be the cause of reduced body fat
in aerobic dancers.
VO2max is the measure of the
cardiorespiratory endurance of the
individual (McArdle et al, 2010). The
slightly increased values of VO2max in the
aerobic dancers may be due to decreased
peripheral resistance, increased cross
sectional diameter of the coronary arteries,
and improved tone of the ventilatory
musculature (McArdle et al, 2010).
Nitrous oxide released due to the shear
stress may be the reason for these effects.
However, for the significant change to
occur in VO2max the Critical Training
Threshold (Astrand et al, 2003, McArdle
et al, 2010). needs to be achieved. This
may not be achieved during a standard
Cooper Protocol Aerobic Dance session
(Bull, 1996).

Effect of Aerobic Dance on the Body Fat Distribution and Cardiovascular Endurance …..in Women. – Jaywant, P.J.
9
Conclusion: This is a very important fact
which needs to be considered before an
individual considers aerobic dance as a
fitness activity. If a person is aiming for
just weight loss, then the dance aerobics is
an ideal choice, however, if the person is
aiming for improved cardiovascular status,
other physical exertional activities may be
considered.
References
Alekel Lee; Clasey Jody L.; Fehling, Patricia C.;
Weigel Ronald M.; Boileau, Richard A.;
Erdman, John W.; Stillman, Rachel 1995.
Contributions of exercise, body composition,
and age to bone mineral density in
premenopausal women. Med. Sci. Sports
Exer., 27(11): 1477-1485.
Angioi, M, Metsios, G.S., Koutedakis, Y., Wyon,
M.A. 2009. Fitness in contemporary dance: a
systematic review, Int. J. Sports Med.,
30(7): 475-84.
Astrand, O., Rodahl, K., Dahl, H., Stromme, S. B.,
2003. Textbook of work physiology:
physiological basis of exercise, 4th edition‖:
165- 166.
Bandyapadhyay, Amit, 2008. Queens College Step
Test as an alternative to Harvard Step Test
In Young Indian Women. Int. J. Sports
Health Sci., year ? 15-20.
Birngum, Larry, Tommy, Boone, Beth, Huscle
2009. Cardiovascular responses to music
tempo during steady state exercise. J. Exer.
Physiology online 12(1): 50-57.
Bull, A. 1996. The Formal Description Of Aerobic
Dance Exercise :A Corpus-Based
Computational Linguistics Approach : 5 -10.
Doct Thesis,University of Leeds, UK,96
Chatterjee, S., Chatterjee, P., Bandyopadhyay, A.,
2005. Validity of Queen‘s College Step Test
for estimation of maximum oxygen uptake in
female students.‖ Ind. J. Med. 121: 32 – 35.
Darby, L.A., Browder, K.D., Reeves, B.D., 1995.
The effects of cadence, impact, and step on
physiological responses to aerobic dance
exercise. Res. Quart. Exer. Sports, 22-28.
Garber, C.E, McKinney, J.S, Carleton, R.A. 1992.
Is aerobic dance an effective alternative to
walk-jog exercise training? The J. Exer.
Phys. Fit., 32(2): 136-41.
Grant, S., Davidson, W., Aitchison, T., Wilson, J.,
2002. A comparison of physiological
responses and rating of perceived exertion
between high-impact and low-impact
aerobic dance sessions. Brit. J. Sports Med.
36(4): 276-80.
Grzonkowski, S 1989. Analysis of the results of
the measurements of adipose tissue in the
human body based on the study of skinfold
thickness‖. Epidemiology, 272-282.
Grzonkowski, S, Kupść, W., Piotrowski, W., 1989.
Analysis of the results of the measurements
of adipose tissue in the human body based
on the study of skinfold thickness.‖ J.
Epidem., 43(3): 272-82.
Guyton, A.C. and Hall, J.E. 1996. Textbook of
Medical Physiology. 9th edition. W. B.
Saunders Company, London. 80 -81.
Hopkins R, PE, Betty Murrah, M, Werner W. K.
Hoeger, Ed and R. Colbert Rhodes, 1990.
Effect of Low-Impact Aerobic Dance on the
Functional Fitness of Elderly Women. The
Gerontologist, 30(2): 189-192.
Jakubec, Aleš, Pavel, Stejskal, Liběna, K., Milan,
E., Iva, Ř., Michal, B., Milan, P. 2008.
Changes In Heart Rate Variability After A
Six Month Long Aerobic Dance Or Step-
Dance Programme In Women 40–65 Years
Old: The Influence Of Different Degrees Of
Adherence, Intensity And Initial Levels‖.
GYMNICA 38(2): 35-42.
Kathleen, A., Rockefeller, Burke, E. J. 1979.
Psycho-physiological analysis of an aerobic
dance programme for women.‖ British J.
Sports Medicine, 13: 77-80.
Kelley, G., Kristi, A., Kelley, S., Zung, V. T.
2004. Aerobic Exercise and Lipids and
Lipoproteins in Women: A Meta-Analysis of
Randomized Controlled Trials. J. Women’s
Health, 13(10): 1148-1164.
Keogh, J.W., .Kilding, A., Pidgeon, P, Ashley, L,
Gillis, D. 2009. Physical benefits of dancing
for healthy older adults: a review. J. Ageing
Physical Activity 17(4): 479-500.
Kojdab, Georg 2005. Molecular mechanisms of
vascular adaptations to exercise. Physical
activity as an effective antioxidant therapy?‖
Cardiovascular Research, 67: 187-197.
Koley, S. 2007. Association of Cardio respiratory

Journal of Exercise Science and Physiotherapy, Vol. 9, No. 1: 16-22, 2013
10
Fitness, Body Composition and Blood
Pressure in Collegiate Population of
Amritsar, Punjab, India‖. The Internet
Journal of Biological Anthropology, 1(1):
23-26.
Leelarungrayub, D., Saidee, K., Pothongsunun, P.,
Pratanaphon, S., Yankai, A., Bloomer, R.J.
2011. Six weeks of aerobic dance exercise
improves blood oxidative stress status and
increases interleukin-2 in previously
sedentary women.‖ J. Body Weight
Movement Therapy., 15(3): 355-62.
Lehri, A. and Mokha, R, 2006. Effectiveness of
Aerobic and Strength Training in Causing
Weight loss and Favourable Body
Composition in Females.” J. Exer. Sci. and
Physioth., 2: 96-99.
Mc Ardle, W., Katch, F., Katch, V. 2010. Exercise
Physiology, 7th edition: 245. 468-501 733-
758.568-569.820.888.
Nilsson Gause-, D., Dey, K. 2005. Percent body
fat estimation from skin fold thickness in the
elderly. Development of a population-based
prediction equation and comparison with
published equations in 75-year-olds. J.
Nutr., Health & Ageing, 9(1): 19-24.
Pantelić, S., Kostić, R., Mikalački, M., Ratomir
Đurašković, R., Nebojša Čokorilo, N., Ivana
Mladenović, I. ―The effects of a recreational
aerobic exercise Model on the functional
abilities of women‖ UDC 796.035.57:-
058.833 Physical Education and Sport, 5(1):
19 – 35.
Patricia, G.A. 1987. The effect of intensity
controlled aerobic dance exercise on aerobic
capacity of middle-aged, overweight women‖
Res. Nurs. and Health 10(6): 383-390.
Satwanti, P. Singh, I.P., Bharadwaj, H. 1980. Fat
distribution in lean and obese young Indian
women: A densitometric and anthropometric
evaluation. Am. J. Physical Anthropology,
53(4): 611–616.
Okura, T., Nakata, Y., Lee, D.J., Ohkawara, K.
and Tanaka, K. 2005. ―Effects of aerobic
exercise and obesity phenotype on
abdominal fat reduction in response to
weight loss‖ International Journal of
Obesity, 29: 1259–1266.
Schiffer, Thorsten, Schulte, Stefanie, Sperlich,
Billy 2008. ―Aerobic dance: health and
fitness effects on Middle-aged
premenopausal women”. Journal of Exercise
Physiologyonline(JEPonline), 11 (4): 25-33.
Uchechukwu, D., 2009. Post-exercise heart rate
recovery: an index of cardiovascular
fitness‖. J. Exer. Physiol., 12(1): 10-22.
Vajda I, Mészáros J, Mészáros Z, Prókai A, Sziva
A, Photiou A, Zsidegh, 2007. Effects of 3
hours a week of physical activity on body fat
and cardio-respiratory parameters in obese
boys. Sep.94(3): 191-8.
Vajda, I. 2007. Effects of 3 hours a week of
physical activity on body fat and cardio-
respiratory parameters in obese boys.” Acta
Physiologica Hungarica, 94(3): 191-198.
Varghese, M.A., Saha, P.N., Atreya, N., 1995.
Aerobic capacity of urban women
homemakers in Bombay.‖ Ergonomics. Sep;
38(9):1877-83.
Williford, T. H. N, Scharff-Olson, M., Blessing,
D. L. 1989. The physiological effects of
aerobic dance. A review. J. Sports Medicine,
Dec; 8(6): 335-45.

Efficacy of Myofascial Release in Fibromyalgia —Thakur et al
11
Efficacy of Myofascial Release in Fibromyalgia
Thakur1, Manisha, Narkeesh
2, A. & Kanimozhi
3 1PG student, Dept. of Physiotherapy, Dept. Punjabi University, Patiala-147001, Punjab. 2Associate Professor, Dept. Punjabi University, Patiala-147001, Punjab. 3Clinical Physiotherapist, Department of Physiotherapy, Punjabi University, Patiala-147001, Punjab.
Introduction
Fibromyalgia is defined as ―non
articular rheumatism characterized by
musculoskeletal pain, spasm, stiffness,
fatigue and severe sleep disturbances‖. It
is a syndrome of widespread pain,
decrease pain threshold and other
characteristic symptoms (Wolfe, 1996).
These other symptoms include chronic soft
tissue neck and back muscle pain that is
aching, throbbing or burning in nature
usually accompanied by neck, shoulder,
spine, shoulder or hip stiffness (Gray et
al., 1997). Fibromyalgia patients may also
experience undue fatigue, insomnia, joint
pain, headache, chest pain, irritable bowel
syndrome, jerky leg movements, numbness
and tingling in various body parts (Gray et
al., 1997). It is estimated to affect
approximately 3 to 6 million people and is
the third most prevalent rheumatologic
disorder. The majority of the affected
patients are women in the age range of 30
to 60 years (Goldenburg, 1998). It affects
women (3.4%) more frequently than men
(Wolfe et al., 1995). The cause of
fibromyalgia is unknown.
No evidence of an underlying
cause or pathophysiologic basis for
fibromyalgia currently exists although
myriad of mechanisms have been
proposed. Among the list of proposed
mechanisms include lack of physical
Abstract
Fibromyalgia is a syndrome of widespread pain, decreased pain threshold and other
characteristic symptoms. These other symptoms include undue fatigue, insomnia, joint pain,
headache, chest pain, irritable bowel syndrome, jerky leg movements, numbness and tingling in
various body parts. For the management of these symptoms many medical and
physiotherapeutic interventions are used. Myofascial release is an important technique which is
used to reduce these symptoms. Previous studies have been done to find out the effect of
myofascial release in fibromyalgia. But there are not much studies which elucidate how
myofascial release is effective in reducing these symptoms. The present study made an effort to
find out the efficacy of myofascial release on patients with fibromyalgia and how its influence
on VAS scale, Epworth Sleepiness Scale (ESS), Self Trait Anxiety Inventory (STAI) and
Fibromyalgia Impact Questionnaire. (FIQ). The mean, standard deviation, t value and t test for
all the variables were calculated. It was concluded that myofascial release has a significant
effect on VAS scale however there is reduction in ESS, STAI, FIQ but not upto significant
level.
Keywords: Fibromyalgia, Fatigue, Myofascial Release.
Journal of Exercise Science and Physiotherapy, Vol. 9, No. 1: 11-16, 2013
12
fitness, sleep deprivation, chronic muscle
spasm with ischemia, adenosine
monophosphate and creatine level
imbalances, neurohormonal imbalances
(Goldenberg, 1989). Genetic
abnormalities in the serotonin transporter
promoter gene have also been noted
(Neumann et al., 2002). There is an
increased association of catecholamine-o-
methyltransferase deficiency in
fibromyalgia (Gursoy et al., 2003).
Infectious agents have also been
linked to the development of fibromyalgia
as well as to that of the closely related
Chronic Fatigue Syndrome (CFS). Viral
agents, including hepatitis C (Buskila et
al., 1997), HIV (Simms et al., 1992) and
hepatitis B (Adak et al., 2005) have been
associated with fibromyalgia on
epidemiological and clinical grounds.
Besides this the etiology is also linked to
the levels of both serotonin and
norepinephrine. These were found to be
decreased in levels in the CerebroSpinal
Fluid (CSF) of fibromyalgia patients
(Russell et al., 1992). The cerebrospinal
fluid levels of the excitatory amino acid
neurotransmitters aspartate and glutamate,
which are involved in pain transmission
through the spinal cord, have been shown
to correlate with levels of pain in patients
with fibromyalgia, although absolute
levels were normal (Larson et al., 2000).
These etiological reasons produce various
symptoms of pain, sleep disturbances and
anxiety in the fibromyalgia patients.
Optimal management of these symptoms is
thus required to manage these.
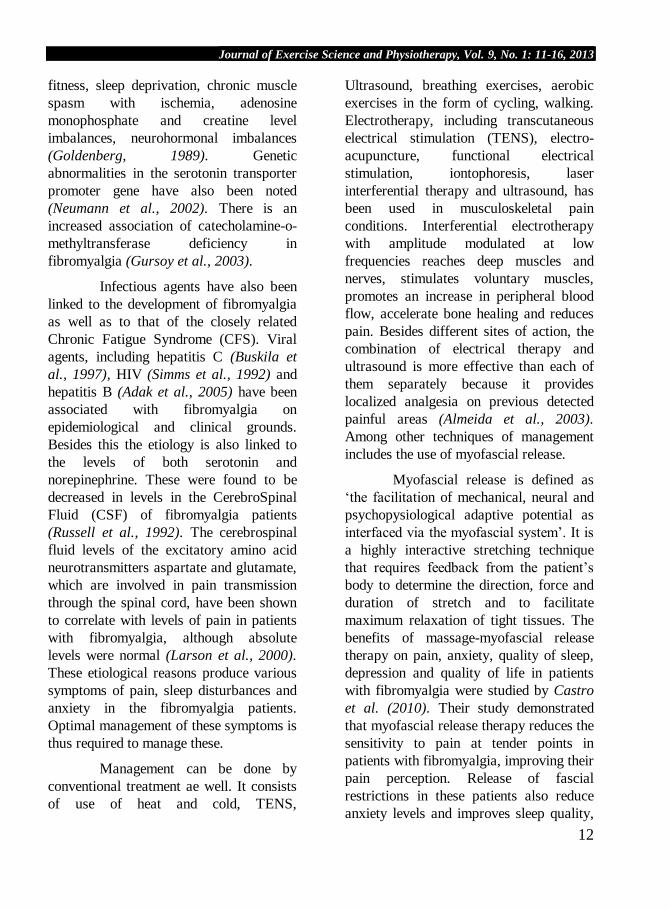
Management can be done by
conventional treatment ae well. It consists
of use of heat and cold, TENS,
Ultrasound, breathing exercises, aerobic
exercises in the form of cycling, walking.
Electrotherapy, including transcutaneous
electrical stimulation (TENS), electro-
acupuncture, functional electrical
stimulation, iontophoresis, laser
interferential therapy and ultrasound, has
been used in musculoskeletal pain
conditions. Interferential electrotherapy
with amplitude modulated at low
frequencies reaches deep muscles and
nerves, stimulates voluntary muscles,
promotes an increase in peripheral blood
flow, accelerate bone healing and reduces
pain. Besides different sites of action, the
combination of electrical therapy and
ultrasound is more effective than each of
them separately because it provides
localized analgesia on previous detected
painful areas (Almeida et al., 2003).
Among other techniques of management
includes the use of myofascial release.
Myofascial release is defined as
‗the facilitation of mechanical, neural and
psychopysiological adaptive potential as
interfaced via the myofascial system‘. It is
a highly interactive stretching technique
that requires feedback from the patient‘s
body to determine the direction, force and
duration of stretch and to facilitate
maximum relaxation of tight tissues. The
benefits of massage-myofascial release
therapy on pain, anxiety, quality of sleep,
depression and quality of life in patients
with fibromyalgia were studied by Castro
et al. (2010). Their study demonstrated
that myofascial release therapy reduces the
sensitivity to pain at tender points in
patients with fibromyalgia, improving their
pain perception. Release of fascial
restrictions in these patients also reduce
anxiety levels and improves sleep quality,

Efficacy of Myofascial Release in Fibromyalgia —Thakur et al
13
physical function and physical role.
Myofascial programme can be considered
as an alternative and complimentary
therapy that can achieve transient
improvements in the symptoms of these
patients. This study has used myofascial
release for achieving reduction in various
symptoms of pain, sleep disturbances and
anxiety in patients of fibromyalgia.
The interest in chronic pain has
increased considerably in the past decade.
Evaluation of the prevalence of pain in
populations has clinical and economic
relevance. Pain often is associated with
disability and is a major factor affecting
quality of life. Chronic musculoskeletal
pain is common in the general population,
with a prevalence of 35% to 50%
according to several studies from the
United States and Western Europe
(Brattberb et al., 1989). Chronic
Widespread Pain (CWP) is the cardinal
symptom of fibromyalgia (FM) syndrome.
It was given a standard definition by the
American College of Rheumatology
(ACR) committee. This definition
emphasized that axial pain was a constant
feature and that pain had to be present in
the upper and lower quadrants and the
right and left sides of the body (Croft et al.
1993).
A constellation of ancillary
symptoms may be present, including
headache, fatigue, sleep disturbances,
Irritable Bowel Syndrome (IBS),
paresthesias, fluctuation of symptoms in
response to changes in weather or stress
level, and other manifestations (White and
Harth 2001). Various treatment
approaches have evolved so far for the
effective management of the patients with
fibromyalgia. These approaches aim at
managing the different aspects of the
condition.
Because of the chronic and multi-
symptom character of FMS, the
recommended treatment for its patients is
based on the interdisciplinary approach,
with physical, pharmacologic, cognitive-
behavioral and educational interventions.
In the sphere of physical intervention,
physical therapy offers a great variety of
therapeutic modalities (i.e. kinesiotherapy,
hydrotherapy, electrothermal and
phototherapy, relaxation techniques,
massage therapy, and acupuncture) that
can be used to control FMS.
Materials & Methods
The present study is a randomized
control trial (RCT). The variables for the
study were the questionnaires including
Epworth Sleepiness Scale, Self Trait
Anxiety Inventory, Fibromyalgia Impact
Questionnaire and VAS scale. In this RCT
52 patients were randomly selected
between the age group of 25- 65 years and
were randomly divided into two groups.
Group 1 was designated as the
conventional group and received
conventional treatment, group 2 was
named as the experimental group as it was
administered the myofascial treatment
prgram. The study was performed in the
Out Patient Department (OPD) Of Punjabi
University, Patiala and various hospitals
of Patiala and Ludhiana. The patients of
the conventional group were given hot
packs, Interferential therapy, Ultrasound,
kneading free active exercises of neck,
shoulder and arm, breathing exercises.
Patients were asked to do 30 minutes walk
daily and were also asked to do cycling.

Journal of Exercise Science and Physiotherapy, Vol. 9, No. 1: 11-16, 2013
14
The treatment was continued for 2 weeks.
The patients of the experimental group
were given myofascial release techniques
including that for the posterior cervical
musculature, sternocleidomastoid, upper
trapezius, cranial base release, cross hand
release for back (erector spinae) and J
stroke. The same treatment was continued
for 2 weeks and the questionnaires were
got filled on 0 day, day 7 and day 14 of the
program. The data was analyzed using t
test. The results of the study have been
projected in the form of tables and graphs.
Results & Discussion
Significant changes were seen in the
VAS in the mean difference between 0-14th
days in the experimental group. However
no significant changes were seen in
Epworth Sleepiness Scale, Self Trait
Anxiety Inventory and Fibromyalgia
Impact Questionnaire when the
conventional group was compared with the
experimental group. The changes in the
values of VAS, ESS, STAI, and FIQ have
been shown in the graphs
Table 1.1: Mean and Standard deviation of age for the
subjects of the group A and group B
DEMOGRAPHIC
GROUP A GROUP B
Mean SD Mean SD
AGE 38.91 9.78 40.36 13.40
Table 1.2: Comparison of mean value for VAS at 0
day, 7th
day, 14th
day and MD (0 – 14th
) day between
Group A and Group B
VAS
GROUP A Vs GROUP B
t value P value
0 day -0.366 > 0.05
7th
day 0.964 > 0.05
14th
day 2.362 < 0.05
MD (0 – 14th
) day -2.823 < 0.05
Table 1.3 Mean and SD of ESS at 0 day, 7th
day, 14th
day and MD (0 – 14th
) day for the subjects of Group A
and Group B and Comparison of mean value for ESS at
0 day, 7th
day, 14th
day and MD (0 – 14th
) day between
Group A and Group B
ESS
Group A Group B Group A vs
Group B
Mean SD Mean SD t P
0 Day 12.36 0.67 11.73 0.65 2.26 0.05
7 Day 11.91 0.30 10.82 0.60 5.37 0.05
14
Day 11.18 0.60 10.18 0.40 4.57 0.05
MD
(0-
14) 1.18 0.60 1.55 0.69
-
1.32
0.05
Table 1.4 Mean and SD of STAI at 0 day, 7th
day,
14th
day and MD (0 – 14th
) day for the subjects of
Group A and Group B and Comparison of mean value
for STAI at 0 day, 7th
day, 14th
day and MD (0 – 14th
)
day between Group A and Group B
STAI
Group A Group B Group A vs
Group B
Mean SD Mea
n SD t P
0 Day 52.55 1.97 52.09 2.17 0.515 0.05
7 Day 51.91 2.39 51.36 2.38 0.537 0.05
14 Day 50.91 2.43 49.91 3.11 0.840 0.05
MD
(0-14) 1.64 1.03 2.18 2.36
-
0.703
0.05
Table 1.5 Mean and SD of STAI(y-2) at 0 day, 7th
day, 14th
day and MD (0 – 14th
) day for the subjects of
Group A and Group B and Comparison of mean value
for STAI(y-2) at 0 day, 7th
day, 14th
day and MD (0 –
14th
) day between Group A and Group B
STAI
(Y-2)
Group A Group B Group A vs
Group B
Mean SD Mean SD t P
0 Day 48.27 6.10 48.27 6.21 0.00 0.05
7 Day 47.36 6.55 47.36 6.68 0.00 0.05
Day 14 46.27 6.66 45.73 6.62 0.19 0.05
MD
(0-14) 2.00 1.00 2.55 1.29 -1.11 0.05

Efficacy of Myofascial Release in Fibromyalgia —Thakur et al
15
Table 1.6 Mean and SD of FIQ (y-2) at 0 day, 7th
day, 14th
day and MD (0 – 14th
) day for the subjects of
Group A and Group B and Comparison of mean value
for STAI(y-2) at 0 day, 7th
day, 14th
day and MD (0 –
14th
) day between Group A and Group B
FIQ Group A Group B Group A vs
Group B
Mean SD Mean SD t P
0 Day 77.91 10.96 77.82 13.41 0.02 0.05
7 Day 74.55 10.61 68.18 10.42 1.42 0.05
14 Day 68.91 13.06 62.64 12.48 1.15 0.05
Mean
Dev.
(0-14)
9.00 9.54 15.18 7.82 -1.71 0.05
In the present study myofascial
release was given at the sites of tender
points including posterior cervical
musculature, trapezius, pectoral region,
sternocleidomastoid, cranial base release,
gluteal fascia including J stroke as
explained by Castro et al. (2011). Various
questionnaires including Fibromyalgia
Impact Questionnaire, Epworth Sleepiness
Scale, Self Trait Anxiety Trait and Visual
Analogue scale were used. In order to find
out effect of myofascial release on these
scales an experiment was conducted on 22
subjects of age group 25-65 years.
Lofgren and Norrbrink (2009) in their
study included the women of 18-60 years
in his study. The present study took the
age group upto 65 years of age.
Conclusion
The present study concludes that
both the conventional and myofascial
treatments are helpful in reducing the
symptoms of pain, sleep disturbances and
anxiety in case of fibromyalgia. However
significant effects of myofascial release
were seen on pain and hence it is also a
reliable method for reducing pain in case
of fibromyalgia.
References
Adak, B., Tekeoglu, I. and Ediz, L. 2005.
‗Fibromyalgia frequency in hepatitis B
carriers‘. J. Clin. Rheumatol., 11: 157-9.
Taken from: Jacob, A. and Neumann, L.
2008. ‗Pathogenesis of fibromyalgia: A
review‘. Joint Bone Spine, 20: 1-7.
Almeida, T., Roizenblatt, S., Silva, A., Sergio. and
Tufik, S. 2003. ‗The Effect of Combined
Therapy (Ultrasound and Interferential
current) on pain and sleep in fibromyalgia‘.
Pain, 104: 665–672.
Buskila, D., Shnaider, A. and Neumann, L. 1997.
‗Fibromyalgia in hepatitis C virus infection.
Another infectious disease relationship‘.
Arch. Intern. Med., 157: 2497-500.
Brattberb, G., Thorslund, M. and Wikman, A.
1989. ‗The prevalence of pain in a general
population: the results of a postal survey in a
county of Sweden‘. Pain, 37: 215-222.
Taken from: Neumann, L. and Buskila, D.
2003. ‗Epidemiology of fibromyalgia‘.
Current Pain and Headache Reports, 7: 362-
368
Castro, S., Adelaida, M., Penarrocha, M.,
Gulliermo. M., Hernandez, S., Manuel, S.,
Fernandes, C. and Lorenzo, C. 2011.
‗Effects of myofascial release techniques on
pain, physical function, and postural
stability in patients with fibromyalgia: A
randomized controlled trial‘. Clin. Rehabil.,
25(9): 800-813.
Castro, A., Guillermo, A., Matarán, P., Jose, G.,
Manrique, G., Rubio, C. and Lorenzo, C.
2010. Benefits of Massage-Myofascial
Release Therapy on Pain, Anxiety, Quality
of Sleep, Depression and Quality of Life in
Patients with Fibromyalgia. Evidence-Based
Complementary & Alternative
Medicine.http://www.ncbi.nlm.nih.gov/pmc/
articles/PMC3018656
Croft, P., Rigby, A.S. and Boswell, R. 1993. ‗The
prevalence of chronic widespread pain in the
general population‘. J. Rheumatol., 20: 710–
713. Taken from: Neumann, L. and Buskila,
D. 2003. ‗Epidemiology of Fibromyalgia‘.

Journal of Exercise Science and Physiotherapy, Vol. 9, No. 1: 11-16, 2013
16
Current Pain and Headache Reports, 7: 362-
368.
Goldenberg, D.L. 1998. ‗Fibromyalgia and related
syndromes‘. Rheumatology. 15.1–15.12.
Taken from: Inanici, Fatima. and Yunus, B.
Muhammad. 2002 ‗Fibromyalgia Syndrome:
Diagnosis and Management Case Study and
Commentary‘, J. Clin. Outcome Manag.,
8(4): 55-67.
Gursoy, S., Erdal, E., Herken, H., Madenci, E.,
Alasehirli, B. and Erdal, N. 2003.
‗Significance of catecho-o-
methyltransferase gene polymorphism in
fibromyalgia. Rheumatol. Int., 23(3):
104-7.
Goldenburg, D.L. 1989. ‗Dignostic and therapeutic
challenges of fibromyalgia‘. Hosp. Pract.,
24: 39-52. Taken from: Cox, M. 1999. ‗Low
Back Pain: Mechanism, Diagnosis and
Treatment‘. 6th edition. William and Willian
Publisher, 254.
Larson, A.A., Giovengo, S.L., Russell, I.J. and
Michalek, J.E. 2000. ‗Changes in the
concentrations of amino acids in the
cerebrospinal fluid that correlate with pain in
patients with fibromyalgia: implications for
nitric oxide pathways‘. Pain, 87: 201-11.
Lofgren, M. and Norrbrink C. 2009. ‗Pain relief in
women with fibromyalgia: a cross over study
of superficial warmth stimulation and
transcutaneous electrical nerve stimulation‘.
J. Rehabil. Med , 41: 557–562.
Neumann, L., Buskilla, D. and Epsetin, R.P. 2002.
‗Conformation of an association between
fibromylagia and serotonin transporter
promoter region polymorphism and
relationship to anxiety related personality
traits‘. Arthritis Rheum., 46(3): 845-7.
Taken from Rothenburg, R. 2010.
‗Fibromyalgia pathophysiology and
treatment‘. Fibromyalgia frontiers, 18(1) :
5-12.
Russell, I.J., Vaeroy, H. and Javors, M. 1992.
‗Cerebrospinal fluid biogenic amine
metabolites in fibromyalgia/ fibrositis
syndrome and rheumatoid arthritis‘. Arthritis
Rheum., 35: 550-6.
Simms, R.W., Zerbini, C.A. and Ferrante, N.
1992. ‗Fibromyalgia syndrome in patients
infected with human immunodeficiency
virus‘. Am. J. Med., 92: 368-74. Taken from:
Jacob, A. and Neumann, L. 2008.
‗Pathogenesis of fibromyalgia: A review‘.
Joint Bone Spine, 20: 1-7.
Wolfe, F. 1996 ‗The fibromyalgia syndrome: A
consensus report on fibromyalgia and
disability‘. Rheumatology, 23: 534. Taken
from: Fredrickson. and Morris. ‗Challenging
admissiblity of post traumatic fibromyalgia
and future radiofrequency of facet joint
reinnervation claims‘. http://
www.lindjensen.com/CM/Articles/Challengi
ng Admissibility-Claims.pdf
Wolfe, F., Ross, K. and Anderson, J. 1995. ‗The
prevalence and characteristics of
fibromyalgia in the general population‘.
Arthritis Rheum., 38: 19–28.
White, K.P. and Harth, M. 2001. ‗Classification,
epidemiology and natural history of
fibromyalgia‘. Curr. Pain Headache
Reports, 5: 320-329.

Effect of Wrist Manipulation & Cyriax Physiotherapy Training on Pain & Grip Strength in Lateral Epicondylitis
Patients---Goyal et al
17
Effect of Wrist Manipulation & Cyriax Physiotherapy Training on
Pain & Grip Strength in Lateral Epicondylitis Patients
Goyal1, M., Kumar
2, Ashok, Monga
3, M. and Moitra
4, M.
1 Ass. Professor & Head, MM Institute of Physiotherapy & Rehabilitation, MM University, Mullana, Haryana,
India. E-mail: [email protected] 2Ass. Professor, Department of Sports Science, Punjabi University Patiala, Punjab, India.
3MPT Student, MM Institute of Physiotherapy & Rehabilitation, MM University, Mullana, Haryana, India 4Ass. Professor, MM Institute of Physiotherapy & Rehabilitation, MM University, Mullana, Haryana, India
Introduction
Lateral epicondylitis (LE) is the
second most frequently diagnosed
musculoskeletal upper extremity disorder
in a primary care setting (Harr &
Andersen, 2003). The most commonly
affected structure is the Extensor Carpi
Radialis Brevis (ECRB) tendon that is
characterized by the increased presence of
fibroblasts, vascular hyperplasia and
disorganized collagen and the average
duration of a typical episode of LE is 6
months – 2 years
(Stasinopoulos &
Johnson, 2004). Lateral epicondylitis
occurs 7 to 20 times more frequently than
medial epicondylitis (Brotzman & Wilk,
1996). The dominant arm is commonly
affected with the prevalence of 1-3% in
general population, but this increase to
19% at 30-60 years of age (Allender,
1974).The condition is not differing
between men and women (Vicenzino,
1996).
There has been a well defined
clinical presentation, the main complaints
being pain and decreased grip strength.
Diagnosis is simple and can be confirmed
by the tests that reproduce pain such as
palpation over the facet of the lateral
epicondyle, resisted wrist extension,
resisted middle finger extension and
passive wrist flexion (Kamein, 1990).
Traditional treatment program for people
with lateral epicondylitis have focused
primarily on the pain control by
ultrasound, anti-inflammatory medication,
iontophoresis or phonophoresis followed
by rehabilitation program which ranges
from flexibility to strengthening and
endurance training. Numerous treatments
Abstract
The purpose of the study was to evaluate the effect of manipulation of wrist technique
and Cyriax physiotherapy training in reducing pain and improving grip strength in lateral
epicondylitis. A total of 30 patients (male =16; female=14) were selected as subjects and they
were further divided into 2 groups. Each group comprising of 15 subjects (male=8; female=7).
Results of this study suggest that there was an improvement in the mean values of Numeric
Pain Rating Scale and Grip Strength after treatment in both groups. But the improvement was
statistically more significant in wrist manipulation group than the Cyriax physiotherapy
training receiving group. It was concluded that the patients of lateral epicondylitis procured
more substantial benefits from wrist manipulation as compared to Cyriax physiotherapy after
three weeks.
Keywords: Lateral Epicondylitis, Manipulation, Cyriax, Strength, Pain

Journal of Exercise Science and Physiotherapy, Vol. 9, No. 1: 17-22, 2013
18
have been tried for lateral epicondylitis
including drug therapies, corticosteroid
injection, electrical stimulation, laser,
acupuncture, counterforce bracing,
ergonomics, splintage etc. However no one
treatment has been reported to be
universally efficacious. Surgical treatment
is needed in 5-10% of patients who do not
respond after many months of conservative
treatment (Manchanda & Grover, 2008).
Manipulation has been frequently used for
the management of back and neck
complaints and is thought to be free
motion segment that have undergone
disproportionate displacement or are felt to
be hypo-mobile and causes muscle
relaxation. These mechanisms are thought
to be associated with distribution of
abnormal stresses within the joint,
resulting in pain, restriction of motion and
potential inflammation (Cooprestein,
2001; Shekelle et al., 1992) Manipulation
of wrist is capable of relieving symptoms
in lateral epicondylitis patients (Struijis et
al., 2003). Cyriax and Cyriax (1983)
suggested the use of deep transverse
friction massage in combination with
Mill‘s manipulation for the treatment of
LE. For it to be considered a Cyriax
intervention, the two components must be
used together in the order mentioned.
There are 40 different treatment methods
reported in literature to treat the LE. All
the treatment options have one aim of
reducing pain and improving function. It
suggests that the optimal treatment
strategy is not known. However to build
the evidence base for the physiotherapy
management of LE; the purpose of the
present study is to evaluate the effect of
Cyriax physiotherapy and manipulation of
wrist technique in reducing pain and
improving grip strength.
Materials & Methods:
Thirty patients of lateral epicondylitis
both males & females in the age range of 25
to 55 years were selected as subjects after
obtaining their consent based on inclusion
and exclusion criteria of the study. The
subjects were further divided into two
groups: Group-A (n=15) and Group-B (n
=15) respectively and received the
treatment for 3 times a week for 3 weeks.
Treatment Protocol: The subjects
of Group - A underwent the Cyriax
Physiotherapy in addition to pulsed
ultrasonic therapy at 20% duty cycle,
frequency 3MHz and an intensity of 1.2
W/cm2 for 5 min, given at the
tenoperiosteal junction of the ECRB.
Cyriax physiotherapy consisted of 10
minutes of deep transverse friction
massage (DTF) followed by a single
application of Mill‘s manipulation. For
DTF, the patient was positioned
comfortably with the elbow fully supinated
and in 90 degree of flexion. The
anterolateral aspect of the lateral
epicondyle was located (where the ECRB
originates and is the most common site of
pain in patients with lateral epicondylitis)
and the area of tenderness was identified.
DTF was applied with the side of the
thumb tip applying the pressure in a
posterior direction on the teno-osseous
junction. This pressure was maintained
while imparting DTF in a direction
towards the therapist‘s fingers, which were
positioned on the other side of the elbow
for counter pressure. DTF was applied for
10 minutes. After the numbing effect was
achieved, the tendon was prepared for

Effect of Wrist Manipulation & Cyriax Physiotherapy Training on Pain & Grip Strength in Lateral Epicondylitis
Patients---Goyal et al
19
Mill‘s manipulation (Cyriax & Cyriax,
1983). For Mill‘s manipulation; patients
were positioned comfortably in the seating
position with the affected extremity in 900
of abduction with the medial rotation
enough so that the olecranon faced up. The
therapist stabilized the patient‘s wrist in
full flexion and pronation with one hand,
while other hand was placed over the
olecranon. While assuming full wrist
flexion and pronation position, the
therapist applied high – velocity low –
amplitude thrust at the end range of elbow
extension.
The subjects of Group – B
underwent Manipulation of wrist in
addition to pulsed ultrasonic therapy at
20% duty cycle, frequency 3MHz and an
intensity of 1.2 W/cm2 for 5 min given at
the tenoperiosteal junction of the ECRB.
Thrust technique was performed as
follows – Each subject rested the forearm
of his or her affected side on a table with
the palmar side of the hand facing down.
The therapist sat at a right angle to the
subject‘s affected side and gripped the
subject‘s scaphoid bone between his
thumb and index finger reinforced by
placing the thumb and index finger of the
other hand. The therapist then extended the
subject‘s wrist dorsally at the same time
the scaphoid bone was manipulated
ventrally. This part of the maneuver was
repeated approximately 15 times. This
procedure was repeated about 20 times,
alternated by either forced passive
extension of the wrist or extension against
resistance. The duration of an intervention
session was 15 to 20 minutes. No
restrictions in use of the arm were imposed
(Struijis et al., 2003). Both the groups
also received graduated exercise therapy
regimen including stretching exercises and
progressive resisted exercises.
Statistics
The data was analyzed using
statistical computer software ‗SPSS 13
software package (version 13, SPSS Inc.
Chicago, USA)‘.The paired t – test and
unpaired t – test were used. The level of
significance was p<0.05.
Results & Discussion
The mean age and BMI of the
subjects of Group -A and Group-B were
45.87±9.086 years, 46.93±7.324 years,
27.041 ± 1.842 Kg/m2 and 27.21 ± 2.352
Kg/m2 respectively. It was found that the
difference in the mean values of age and
BMI between Group -A and Group-B
were not statistical significant (Table 1).
Table 1: Comparison of Age & BMI
Group A
(Mean±SD)
Group B
(Mean±SD)
t-value
Age(years) 45.87 ±9.086 46.93±7.324 0.354*
BMI(Kg/m2) 27.04± 1.842 27.21±2.352 0.229
*
*p<0.05
Table 2: Comparison of Scores (Unpaired t - test) of
NPRS & Grip Strength between two groups
Group A Group B t-
value
NPRS (cm)
(Mean±SD) before 8.20±0.775 7.93±0.961
after 3
wks 6.00±0.845 4.20±0.862 5.78*
Grip
Strength
(kg)
(Mean±SD)
before
5.13±0.99 15.00±1.195
after 3
wks 17.13±1.13 19.80±1.082 6.61*
*significant p<0.05; NPRS- Numeric Pain Rating Scale
Table 2 shows the comparison of
scores of Numeric Pain Rating Scale
(NPRS), Grip Strength between Group-A
and Group-B before and after three weeks
of treatment. It was found that before the
start of three week treatment programme

Journal of Exercise Science and Physiotherapy, Vol. 9, No. 1: 17-22, 2013
20
to the subjects of Group-A and Group-B
there was no statistical difference in the
scores of NPRS and Grip Strength. After
three weeks there was statistically
significant difference in the scores of
NPRS and Grip Strength in both the
groups but a greater improvement was
observed in Group-B as compared to
Group-A (Table 2). Further, it was found
that in Group-A there was a statistical
significant improvement in the scores of
NPRS & Grip Strength after three weeks
(Table 3).
Table 3 Paired t-test of NPRS & Grip Strength of
Group A
before after three
week
t-
value
NPRS
(Mean±SD) 8.20±0.775 6.00±0.845 20.58*
Grip
Strength
(Mean±SD)
15.13±0.990 17.13±1.125 14.49*
*significant p<0.05
Similarly, it was found that in Group-
B there was a statistically significant
improvement in the scores of NPRS &
Grip Strength after three weeks (Table 4).
Table 4 Paired t-test of NPRS & Grip Strength of
Group B
before after one
week t-value
NPRS
(Mean±SD) 7.93±0.961 4.20±0.826 31.59*
Grip
Strength
(Mean±SD)
15.00±1.195 19.80±1.082 27. 50*
*significant p<0.05
The results of the present study
shows that subjects in both the groups had
significant decrease in pain and increase in
grip strength. However, out of the two
groups, the Group-B receiving wrist
manipulation had a higher percentage of
change in both grip strength and reduction
in pain as compared to Group- A (Cyriax
physiotherapy). Therefore the null
hypothesis is rejected. The results of this
clinical trial are novel as no other studies
comparing Cyriax physiotherapy and
manipulation of wrist have been identified.
Both the groups in the present study had
equal number of subjects and there was no
significant difference found with respect to
their gender distribution, age and body
mass index. The reported success of
manipulation of wrist in the present study
is bolstered by the previously published
trials (Struijis et al., 2003; Manchanda
and Grover, 2008). Despite its broad
application, the mechanism by which
manipulation may work is poorly
understood. Manual therapy is used quite
often for spine and peripheral joints
despite of the inability of clinicians to
accurately diagnose the pathway at which
manipulation is targeted. In people with
low back pain and neck pain, spinal
manipulation is thought to free motion
segments that have undergone
disproportionate displacement and to relax
muscles by sudden stretching. Unwanted
muscle activity in people with low back
pain, in theory can cause a limited range of
motion to protect against sudden
movements. The advantages of the
manipulation of wrist are the potential
effectiveness over the short term and the
ability for patient to maintain his/her daily
activities without restrictions. The clinical
efficacy of manipulation therapy has been
demonstrated in randomized clinical trials
which report benefits in term of pain relief
and rapid restoration of function. This
may be due to direct effects on articular
structures, modulation of nociceptive
afferent transmission within the CNS and
psychological influences (Struijis et al.,
2003). The reported success of Cyriax

Effect of Wrist Manipulation & Cyriax Physiotherapy Training on Pain & Grip Strength in Lateral Epicondylitis
Patients---Goyal et al
21
physiotherapy in the present study
conflicts with previously published trials
(Stasinopoulos & Johnson 2004; Verhaar
et al., 1996). The authors did not offer any
description or reference regarding
technique; therefore, it is not clear if their
application of Cyriax physiotherapy
differed from aid physical therapists in
making clinical decisions as injections are
not delivered as part of physical therapy
treatment. Patients included in this study
were those clinically identified as having
the tenoperiosteal variety of lateral
epicondylalgia as it is hypothesized that
this form is best managed with Mill‘s
manipulation. The proposed mechanism of
Mill‘s manipulation is the lengthening of
scar tissue following the rupture of
adhesions due to the manipulation. This
increased length decreases tension on the
scar leading to less pain, effectively
converting a tear shaped like a ―V‖ into
one resembling a ―U‖. The resulting gap is
filled with fibrous tissue, resulting in
permanent lengthening and abolition of
pain. The application of friction massage
is said to provide the patient with
analgesia prior to the manipulation as well
as softening the scar. It has been
hypothesized that the mechanism of pain
relief secondary to friction massage may
be due to modulation of nociceptive
impulses at the spinal cord level, also
known as the gate control theory.
Currently, no published evidence exists to
prove the proposed mechanism as to what
actually occurs during and following
manual treatment with Cyriax
physiotherapy. Despite the considerable
evidence supporting the use of manual
therapy techniques in treating
musculoskeletal pain, there still exists no
consensus as to the exact mechanisms of
action there either (Cyriax & Cyriax,
1983). Recent evidence has indicated that
the central nervous system may play a role
in pain inhibition following joint
manipulation. Vicenzino (1996)
investigated the effects of a non-thrust
cervical lateral glide in patients with
chronic lateral epicondylalgia. This
technique was shown to result in increased
pain-free grip, pressure pain threshold, as
well as a sympathetic nervous system
response as indicated with measures of
skin conductance and blood flux. More
recently, Paungmali et al., (2003) found
similar results with improved pain-free
grip, pressure pain threshold, and
sympatho-excitation following
mobilization with movement directed at the
elbow. It should be noted that the above
studies captured outcomes only
immediately following treatment;
therefore, no generalization can be made
regarding long-term effects. Given the
results of these trials, the potential exists
for a similar sympathetic nervous system
response following the application of
Cyriax physiotherapy, which may explain
the technique‘s superiority in decreasing
pain and improving pain-free grip strength.
The comparisons between present study
results and those of previous trials should
be made with caution, as it is not possible
to determine which intervention made the
greatest contribution to the treatment
effect. The present study did not assign
patients to receive ultrasound, graduated
exercise regimen, Cyriax physiotherapy
and manipulation of wrist as an isolation
treatment. The absence of a true, no
treatment control group makes it difficult
to differentiate between treatment effect

Journal of Exercise Science and Physiotherapy, Vol. 9, No. 1: 17-22, 2013
22
and the natural course of the disorder, thus
threatening the internal validity of the
study. No long term follow- up data was
collected past 3 weeks; therefore the long-
term effects of the interventions in the
present study remain unknown. Future
research is needed that will determine the
long term effects of the interventions used
in the present study.
Conclusion
It was concluded that the patients of
lateral epicondylitis procured more
substantial benefits from wrist
manipulation as compared to Cyriax
physiotherapy.
References
Allender, E. 1974. Prevalence, incidence and
remission rates of some common rheumatic
diseases and syndromes. Scand. J.
Rheumatol., 3: 145-53.
Brotzman, S. B., and Wilk, E. K. 1996. Clinical
orthopedic rehabilitation. 2nd edition,
Pennsylvanian Mosby.
Cooprestein, E. 2001. Chiropractic technique
procedures for specific low back condition. J
Manipulative Physiol Ther. 24: 407-424.
Cyriax, H.J. and Cyriax J.P. 1983. Cyriax’s
illustrated manual of orthopedic medicine.
Oxford: Butterworth-Heinemann.
Harr, P.J., and Andersen, H.J. 2003.Physical &
Psychological risk factors for lateral
epicondylitis: a population based case –
referent study. Occup. Environ. Med. 60:
322 – 329.
Kamein, M. 1990. A rational management of
tennis elbow. Sports Med., 9: 173-91.
Manchanda, G.. and Grover, D. 2008.
Effectiveness of movement with mobilization
compared with manipulation of wrist in
case of lateral epicondylitis. Ind. J.
Physiotherapy and Occup. Therapy. 2(1):
1345-1348.
Paungmali, A., Vicenzino, B., and Hypoalgesic, M
2003. Sympatho-excitatory effects of
mobilisation with movement for lateral
epicondylalgia. Physical Therapy. 83(4):
374-383
Shekelle, P.G., Adams, A.H. and Chassin, M.R
1992. Spinal manipulation for low back
pain. Ann. Intern. Med., 117: 590-598.
Stasinopoulos, D., and Johnson, I.M. 2004. Cyriax
Physiotherapy for tennis elbow/ lateral
epicondylitis. Br. J. Sports Med., 38: 675 –
677.
Struijis, Peter, A.A., Pieter – Jan, Damen., Eric,
W.P. Bakker, Leendert Blankevoort,
Willem, J.J. Assendelft and Niek van Dijk,
C. 2003. Manipulation of the wrist for
management of lateral epicondylitis: A
Randomized Pilot Study. Phys. Ther., 83:
608-616.
Verhaar, J., Walenkamp, H., and Mameren, H.L.
1996. Local corticoid injection versus
Cyriax- type physiotherapy for tennis elbow.
J, Bone Joint Surg. 78: 128-32.
Vicenzino, B. 1996. Lateral epicondylalgia. A
review of epidemiology, pathophysiology;
aetiology and natural history. Physical
Therapy Reviews, 1: 23-34.

Comparative Study of the Age Related Structural Changes in the Knee between Sportspersons and Non Sportspersons-
Saini & Multani
23
Comparative Study of the Age Related Structural Changes in the
Knee between Sportspersons and Non Sportspersons
Saini1, Gagandeep Kaur., Multani
2, Narinder Kaur.
1Post graduate student of Sports Physiotherapy, Punjabi University, Patiala-147001, Punjab, India. 2Professor, Department of Physiotherapy, Punjabi University, Patiala-147001, Punjab, India.
Introduction
The most consistent knee structural
changes with increasing age are increase in
cartilage defect severity and prevalence,
cartilage thinning and increase in bone size
with inconsistent change in cartilage
volume (Ding et al, 2005). High-impact
and torsional loads may increase the risk
of degeneration of normal joints, and
individuals who have an abnormal joint
anatomy, joint instability, disturbances of
joint or muscle innervation, or inadequate
muscle strength or endurance probably
have a greater risk of degenerative joint
disease.
It is reported that exercise contributes
to cartilage healing and reduces risk for
injury, and that moderate exercise can
even decrease the number of cases
requiring arthroplasty. Conversely,
excessive (harsh) exercise may be
associated with increased cartilage damage
or degenerative changes. Despite the
presence of osteophytic changes in joint
cartilage of athletes performing mild
sports activities, these may not result in
osteoarthritis due to the adaptive feature of
joint cartilage. In contrast, the risk for
osteoarthritis is increased in professional
sportsmen exposed to acute repetitive
impact and torsional loading (Ozkan et al,
2007).
Abstract
Knee joint degeneration is the major cause of disability among the Indian population. The
structural changes subject to differ among the sportspersons and non sportspersons. The aim of
the study was to compare the structural changes in the knee between age-matched sportspersons
and non sportspersons. Thirty sportspersons and thirty non sportspersons aged ≥50 years were
randomly selected on the basis of selection criteria. Physical examination that included effusion,
tenderness, atrophy, knee joint range, lower extremity muscle strength, physical activity levels
and knee injury and osteoarthritis status was done in all the sixty subjects. Digital X ray
examination was then carried out for measurement of joint space width and Kellgren Lawrence
grading. Statistically significant difference was found in the joint space width and Kellgren
Lawrence grades between the sportspersons and non sportspersons. Also significant difference
was found in effusion, tenderness, atrophy, knee joint range, lower extremity muscle strength,
physical activity levels and knee injury and osteoarthritis status between the sportspersons and
non sportspersons. The study concluded that sportspersons have less worsened structural knee
changes, better knee joint range of motion, muscle strength, physical activity levels and a better
quality of life as compared to the age-matched non sportsperson peers.
Key words: Structural changes, joint space width, sportspersons, non sportspersons.
Journal of Exercise Science and Physiotherapy, Vol. 9, No. 1: 23-30, 2013
24
Therefore it is important to assess the
athlete‘s risk of physical exercise and
determine whether it is beneficial or
detrimental to the joint structure.
Consequently, the present study was
conducted to evaluate the age related
structural changes that occur in articular
cartilage particularly of weight-bearing
joints such as knee joint with special
reference to sporting activities.
An age-related increase in
calcification of the articular cartilage and
the menisci in the knee has been
demonstrated radiographically (Loeser,
2009). Accordingly, the age related
structural changes in the knee joint were
evaluated in the present study largely with
the help of radiographs. The measurement
of joint space width (JSW) on radiographs
is currently the best available surrogate for
evaluation of the progression of cartilage
destruction (Vignon et al, 2003) and the
Kellgren-Lawrence radiographic grading
scale is commonly used in epidemiologic
and clinical studies to define the presence
of and to estimate the severity of
osteoarthritis of the tibiofemoral joint
(Kizoksi et al, 2006). Therefore, the
present study compares the age related
structural changes in knee, between
sportspersons and non sportspersons, on
the basis of the measurement of joint space
width and the Kellgren-Lawrence
radiographic grading scale.
Participants: A comparative study was
conducted on a sample of 60 subjects.
They were divided into two groups:
Group A having non-sportspersons
and Group B having sportspersons.
The sample was collected from Patiala
and Chandigarh. Thirty intervarsity or
national level sportspersons aged ≥50
years, both men and women from
different sports volunteered to
participate in the group of
sportspersons. The criteri for the
selection of sportspersons were that
most of them had played for over a
decade and were still recreationally
active. The non-sportspersons group
containing thirty age matched subjects
was drawn from a random sample of
the population. All subjects signed the
consent form prior to participation in
the study. Exclusion criteria for both
groups, included subjects with history
of neurological problem, systemic
illness, major reconstructive surgery of
the lower extremities or involvement
of multiple major joints, subjects with
unilateral or bilateral TKR or any
inflammatory arthropathy, subjects in
whom radiographs are harmful or
contraindicated.
Materials & Methods:
All subjects recruited for the study
were assessed through clinical
examination and pre-participation
screening which included detailed
medical, social, personal and family
history and examination of the vital
signs. Anthropometric measurements,
namely, height and weight were carried
out by using anthropometric rod and
weighting scale. The scale for effusion
(Mckeag and Moeller, 2007) and scale
for tenderness (Hubbard and Berkoff,
1993) were used to assess the severity
of effusion and tenderness respectively.
Both active and passive range of

Comparative Study of the Age Related Structural Changes in the Knee between Sportspersons and Non Sportspersons-
Saini & Multani
25
motion of the knee joint was assessed
with the goniometer. The strength of
the lower extremity muscles were
assessed with a cable Tensiometer
(McArdle et al, 2001). The knee injury
and osteoarthritis outcome (KOOS)
score was used which covers 5 patient-
relevant dimensions: pain, other
symptoms, activities of daily living
(ADL), function in sports and
recreation (Sports/Rec), and knee-
related quality of life (QOL). KOOS is
a self-administered instrument that can
be used for short-term and long-term
follow-up of several types of knee
injuries including osteoarthritis.
(Lohmander et al, 2004) The General
Practice Physical Activity
Questionnaire was used to assess the
level of physical activity in the subjects
(Bull and Milton, 2010). Then the
subjects were made to undergo the
digital X-ray examination for
measurement of joint space width and
Kellgren Lawrence grading. This
technique is based on the MTP
(metatarsophalangeal) view which
measures the joint space width that can
be readily used to track longitudinal
changes in cartilage thickness
(Oksendahl et al, 2009). Digitalized
films of radiographs were read for
narrowing, sclerosis and osteophytes in
the medial compartment of each right
knee using the standard Kellgren and
Lawrence method for assessing
progression of radiographic OA: joint
space narrowing, sclerosis and
osteophytes were each graded on the
scale of 0 to 3 (normal, mild,
moderate and severe). Joint space
width (JSW) was determined as the
joint width in millimetres of the medial
knee compartment. The lower the
JSW, the more severe is the
radiographic progression of knee OA;
knee OA is the severe most when JSW
= 0.
Results & Discussion:
Unpaired t test was applied to
compare the age related structural changes
in knee joint between nonsportspersons
and sportspersons. Karl Pearson
correlation was used to find the correlation
between joint space width and the study
variables. Table 1: Demographic details of the participants in the
two groups
Study
Variables
Group A (Non
sportsperson)
Group B
(Sportsperson) t-
value Mean±SD Mean±SD
Age (yrs) 56.43±6.39 54±6.6 1.44
Height,
mtrs 1.67±0.08 1.70±0.10 1.37
Weight (kg) 67.36±8.81 75.16±12.35 2.81
BMI(kg/m2) 24.36±2.57 25.95±3.77 1.91
*p<0.05
Table 1 compares the demographic
details such as age, height, weight and
body mass index (BMI) between the non
sportspersons and sportspersons. Mean
and standard deviation were calculated and
statistically non-significant difference was
found for age and BMI, suggesting that the
two groups were homogenous.
Table 2 shows the comparison of
various parameters between the non
sportspersons and sportspersons.
Unpaired t-test was applied between
the group A and B. Statistically
significant difference was found in

Journal of Exercise Science and Physiotherapy, Vol. 9, No. 1: 23-30, 2013
26
tenderness, atrophy, effusion, knee
joint range of motion, knee muscle
strength, K/L grading, joint space
width, GPPAQ scores and KOOS
parameters.
Table 2: Comparison of the mean values of study variables between non sportspersons (group A) and sportspersons
(group B).
Study Variables
Group A (Non sportspersons) Group B (Sportspersons)
Mean SD SEM Mean SD SEM t-value
Tenderness 0.73 0.78 0.14 0.27 0.52 0.10 2.71*
Atrophy 1.46 0.64 0.11 1.03 0.57 0.10 2.69*
Effusion 0.63 0.89 0.16 0.13 0.57 0.10 2.58*
AROM flexion 114.0 10.70 1.95 122.17 8.68 1.58 3.24*
AROM extension 2.53 4.09 0.75 0 0 0 3.39*
PROM flexion 119.00 10.37 1.89 126.0 6.49 1.18 3.13*
PROM extension 0.50 1.53 0.28 0 0 0 1.79
Quadriceps strength 9.66 3.47 0.63 16.10 3.63 0.66 7.01*
Hamstrings strength 10.80 3.77 0.69 17.73 4.56 0.83 6.42*
K/L Grades 2.47 0.94 0.17 1.63 0.81 0.15 3.68*
Joint space width 1.18 0.51 0.09 2.24 1.09 0.20 4.80*
GPPAQ scores 2.50 0.86 0.16 3.0 0 0 3.18*
KOOS symptoms 78.29 18.38 3.35 90.71 9.21 1.68 3.30*
KOOS pain 80.46 17.19 3.13 93.97 6.96 1.27 3.99*
KOOS ADLs 78.18 19.67 3.59 94.16 8.96 1.63 4.04*
KOOS sports 55.50 36.33 6.63 81.33 19.30 3.52 3.44*
KOOS Qol 65.41 24.49 4.47 85.28 15.32 2.79 3.76*
*p<0.05
Table 3: Correlation of JSW with study
variables with reference to knee joint Parameters Correlation
(r)
JSW Vs Quadriceps strength 0.3700*
JSW Vs Hamstrings strength 0.3238*
Active knee flexion 0.3544*
Active knee extension -0.3715*
GPPAQ Scores 0.3490*
KOOS Symptoms 0.3788*
KOOS Pain 0.4002*
KOOS ADLs 0.3799*
KOOS Sports and recreation 0.4083*
KOOS QoL 0.4194*
*p<0.05
Table 3 depicts the statistically
significant relationship of JSW with all
variables studied with reference to knee
joint.
The present study compared the age
related structural knee changes between
sportspersons and non sportspersons. It
was found that participation in sports is
not associated with accelerated incidence
or severity of structural knee changes.

Comparative Study of the Age Related Structural Changes in the Knee between Sportspersons and Non Sportspersons-
Saini & Multani
27
Rather it is interesting to note that the non
sportspersons exhibited the worse
structural changes in their knees leading
towards the development of osteoarthritis.
These results are consistent with the other
studies of long distance running and
vigorous activity in independent cohort of
aging subjects (Panush et al, 1986; Lane
et al, 1986; Hannan et al, 2000;
Chakravarty et al, 2008). Even at the
elite-athlete level, data suggest that
running may not be an independent risk
factor of knee osteoarthritis (Kujala et al,
1995). Several other studies have also
suggested that participation in low to
moderate level recreational activities is
associated with decreased risk of knee
osteoarthritis (Manninen et al, 2001).
In contrast, a number of studies have
shown that participation in specific sports
at elite level does increase the risk of knee
OA. Associations are more pronounced for
premature symptomatic and radiographic
OA among participants in professional
ballet dancing, soccer and weight lifting
(Kujala et al, 1994; Teitz et al, 1998;
Spector et al, 1996).
Thus, it is important to critically
analyze the effects of sporting activities on
structure of knee joint, particularly age
related changes in articular cartilage that
could lead to the development of
osteoarthritis. The above mentioned
studies were mainly the case control
studies in which only symptomatic athletes
were included (Kujala et al, 1994). Other
studies had taken only high impact sports
and found high percentage of injuries
(Teitz et al, 1998). Conversely, in the
present study the sportspersons were
randomly selected who reported lower than
the expected number of injuries suggesting
less worsening of the age related structural
changes in the knee.
In addition to this, the radiological findings
of the present study have suggested that
the sportspersons have preserved knee
structure as compared to the non
sportspersons. These findings are well in
line with those of Chakravarty et al
(2008) who found that there were no
significant differences in the K/L grades
and JSW in the long distance runners after
two years of longitudinal study suggesting
that sporting activity is not associated with
increased structural changes in the knee.
Nonetheless, Spector et al (1996)
concluded that long term weight bearing
sports are associated with radiological
presence of hip and knee OA as measured
via Kellgren Lawrence grades.
Accordingly, the data collected in
present investigation, was analysed further
and the local factors with regard to knee
joint were compared between
sportspersons and non sportspersons,
demonstrating that sportspersons had
lesser tenderness, effusion grades and
atrophy of thigh muscles, and higher range
of active and passive knee joint motion,
stronger quadriceps & hamstirngs, better
physical activity levels (GPPAQ scores)
and lower incidence of knee injuries
(KOOS scores). All these factors might
have contributed to preserve the structure
of knee joint in sportspersons, signifying
that the sportspersons have less worsened
structural knee changes. For example, the
weaker quadriceps muscle of non
sportspersons as compared to the
sportspersons suggest the possibility that
the age-related quadriceps-dominant
muscle atrophy may play a role in the

Journal of Exercise Science and Physiotherapy, Vol. 9, No. 1: 23-30, 2013
28
pathogenesis of structural knee changes.
Ikeda et al (2005) holds the similar view.
The strength of the quadriceps is believed
to be important in stabilizing the knee joint
and protecting articular surfaces from high
loads (Urquhart et al, 2008). Another
important factor was physical activity
level. The sportspersons were fully active
with better joint space width (JSW) in
knee joint. Manninen et al (2001)
examined the association between physical
activity and risk of severe knee OA
requiring arthroplasty and found that the
risk decreased with increase in cumulative
hours of recreational physical exercise. More importantly, the present study
has established a strong relationship of
structural changes (JSW) in knee joint
with Lower extremity muscle strength,
knee joint range of motion, physical
activity levels and KOOS scores
suggesting that the larger JSW or better
said, less worsened structural knee
changes are strongly related with stronger
quadriceps &hamstrings, greater knee joint
range of motion, higher physical activity
levels and a lower knee injury profile.
These findings are supported by numerous
studies. Holla et al (2011) in their study
concluded that features of articular
degeneration are associated with lower
knee ROM in patients with early OA.
Ersoz and Erqun (2003) found
statistically significant negative
correlations between range of motion and
radiographic scores and suggested that
reduced ROM is associated with reduced
JSW. Various studies have been conducted
which suggest that atrophy or muscle
weakness is an important clinical factor in
determining the structural knee changes
(Slemenda et al, 1997; Valderrabano and
Steiger, 2011). Strong association between
pain and structural knee changes were
reported by Hart et al (1991); Duncan et
al, (2007) and Neogi et al (2009). Foley
et al (2007) measured the physical activity
level and physical work capacity and
assessed the structural knee changes by
MRI and suggested that knee cartilage
volume and tibial plateau area are dynamic
structures that can respond to physical
stimuli. Thus, findings of the present study
have demonstrated that the sportspersons
have less worsened structural degenerative
changes in the knees as compared to the
age-matched non sportspersons. The
muscle strength, knee joint range of motion
and physical activity levels are notably
higher in the sportspersons than the non
sports sportspersons. Also the better
scores of KOOS among the sportspersons
suggest that the sportspersons enjoy a
better quality of life as compared to the
non sportspersons. Therefore the
participation in sports should be
encouraged in order to minimize the risk of
progression of structural degeneration in
knee joint. References
Bull, F.C., Milton, K.E. 2010. A process
evaluation of a ―physical activity pathway‖
in the primary care setting. B.M.C. Public
Health. 10: 463.
Chakravarty, E.F., Hubert, H.B., Lingala, V.B.,
Zatarain, E., Fries, J.F. 2008. Long Distance
Running and Knee Osteoarthritis: A
Prospective Study. Am. J. Prev. Med. 35(2):
133–138.
Ding, C., Cicuttini, F., Scott, F., Cooley, H., Jones,
G. 2005. Association between age and knee
structural change: a cross sectional MRI
based study. Ann. Rheum. Dis. 64: 549–555.
Duncan, R., Peat, G., Thomas, E., Hay, E.,
McCall, I., Croft, P. 2007. Symptoms and

Comparative Study of the Age Related Structural Changes in the Knee between Sportspersons and Non Sportspersons-
Saini & Multani
29
radiographic osteoarthritis: not as discordant
as they are made out to be? Ann. Rheum.
Dis., 66: 86–91.
Ersoz, M. and Erqun, S. 2003. Relationship
between knee range of motion and Kellgren-
Lawrence radiographic scores in knee
osteoarthritis. Am. J. Phys. Med. Rehabil.,
82: 110-115.
Foley, Stela, Ding, Changhai, Cicuttini, Flavia;
Jones, Graeme. 2007. Physical activity and
knee structural change: a longitudinal study
using MRI. Medicine and Science in Sports
and Exercise., 39: 426-434.
Hannan, M.T., Felson, D.T., Pincus, T. 2000.
Analysis of the discordance between
radiographic changes and knee pain in
osteoarthritis of the knee. J.
Rheumatol., 27(6): 1513-7.
Hart, D.J., Spector, T.D., Brown, P., Wilson, P.,
Doyle, D.V., Silman, A.J. 1991. Clinical
signs of early osteoarthritis: reproducibility
and relation to x ray changes in 541 women
in the general population. Annals of the
Rheumatic Diseases., 50: 467-470.
Holla, J.F.M., Steultjens, M.P.M., Leeden, M.D.,
Roorda, L.D., Zeinstra, S.M.A.B. 2011.
Determinants of range of joint motion in
patients with early symptomatic
osteoarthritis of the hip and/or knee: an
exploratory study in the CHECK cohort.
Osteoarthritis and Cartilage., 19(4): 411-
419.
Hubbard, D.R., Berkoff, G.M. 1993. Myofascial
trigger points show spontaneous needle
EMG activity. Spine, 18: 1803–1807.
Ikeda, S., Tsumura, H., and Torisu, T. 2005. Age-
related quadriceps-dominant muscle atrophy
and incident radiographic knee
osteoarthritis. J. Orthop. Sci., 10: 121–126
Kijowski, R., Blankenbaker, D.G., Stanton, P.T.,
Fine, J.P., Smet, A.A.D. 2006. Radiographic
findings of osteoarthritis versus arthroscopic
findings of articular cartilage degeneration in
the tibiofemoral joint. Radiology, 239: 818-
824.
Kujala, U.M., Kaprio, J., Sarna, S. 1994.
Osteoarthritis of weight bearing joints of
lower limbs in former elite male athletes.
B.M.J., 308: 231-234.
Kujala, U.M., Kettunen, J., Paananen, H., Aalto,
T., Battie, M.C., Impivaara, O., Videman,
T., Sarna, S. 1995. Knee osteoarthritis in
former runners,soccer players, weight lifters,
and shooters. Arthritis Rheum., 38: 539-546.
Lane, N.E., Bloch, D.A., Jones, H.H., Marshall,
W.H., Wood, P.D., Fries, J.F. 1986. Long
distance running, bone mineral density and
osteoarthritis. J.A.M.A., 255(9): 1147-1151.
Loeser, R.F. 2009. Aging and Osteoarthritis. The
role of chondrocyte senescence and aging
changes in the cartilage matrix.
Osteoarthritis Cartilage, 17(8): 971–979.
Lohmander, L.S., Stenberg, A.O., Englund, M.,
Roos, H.. 2004. High Prevalence of Knee
Osteoarthritis, Pain, and Functional
Limitations in Female Soccer Players
Twelve Years after Anterior Cruciate
Ligament Injury. Arthritis & Rheumatism,
50(10): 3145–3152.
Manninen, P., Riihimaki, H., Heliovaara, M.,
Suomalainen, O. 2001. Physical exercise and
risk of severe knee osteoarthritis requiring
arthroplasty. Rheumatology, 40: 432-437.
McArdle, W.D., Katch, F.I., Katch, V.L. 2001.
Exercise Physiology. Energy, nutrition and
human performance. 5th ed. Lippincott
Williams and Wilkins: p502
Mckeag, D. and Moeller, J.L. 2007. ACSM‘s
primary care sports medicine. 2nd ed.
Lippincott Williams and Wilkins: p470
Neogi, T., Felson, D., Niu, J., Nevitt, M., Lewis,
C.E., Aliabadi, P., Sack, C., Torner, J.,
Bradley, L., Zhang, Y. 2009. Association
between radiographic features of knee
osteoarthritis and pain: results from two
cohort studies. B.M.J., 339: 2844.
Oksendahl, H.L., Gomez, N., Thomas, C.S.,
Badger, G., Hulstyna, M.J., Fadale, and
Fleming, B. 2009. Digital radiographic
assessment of tibiofemoral joint space width:
a variance component analysis. J. Knee
Surg., 22(3): 205–212.
Ozkan, C., Sarpel, Y., Biçer, O.S. 2007. The
effects of exercise on articular cartilage.
Acta. Orthop. Traumatol. Turc., 41 Suppl
2: 13-8.
Panush, R.S., Schmidt, C., Caldwell, J.R.,
Edwards, N.L., Longley. S, Yonker, R.,
Webster, E., Nauman, J., Stork, J.,
Pettersson, H. 1986. Is Running Associated
With Degenerative Joint Disease? J.A.M.A,
255(9): 1152-1154.

Journal of Exercise Science and Physiotherapy, Vol. 9, No. 1: 23-30, 2013
30
Slemenda, C., Brandt, K.D., Heilman, D.K.,
Mazzuca, S., Braunstein, E.M., Katz, B.P.,
Wolinsky, F.D. 1997. Quadriceps weakness
and osteoarthritis of the knee. Ann. Intern.
Med., 127: 97-104.
Spector, T.D., Harris, P.A., Hart, D.J., Cicuttini,
F.M., Nandra, D., Etherington, J., Wolman,
R.L., Doyle, D.V. 1996. Risk of
osteoarthritis associated with long-term
weight-bearing sports: a radiologic survey of
the hips and knees in female ex-athletes and
population controls. Arthritis Rheum., 39(6):
988-995.
Teitz, C.C., Kilcoyne, R.F. 1998. Premature
osteoarthrosis in professional dancers. Clin.
J. Sport Med., 8(4): 255-259.
Urquhart, D.M., Soufan, C., Teichtahl, A.J.,
Wluka, A.E., Hanna, F., Cicuttini, F.M.
2008. Factors that may mediate the
relationship between physical activity and
the risk for developing knee osteoarthritis.
Arthritis Research & Therapy, 10: 203.
Valderrabano, V., Steiger, C. 2011. Treatment and
Prevention of Osteoarthritis through
Exercise and Sports. J. Aging Res., Article
ID 374653, 1-6.
Vignon, E., Piperno, M., Graverand, M.P.H.L.,
Mazzuca, S.A., Brandt, K.D., Mathieu, P.,
Favret, H., Vignon, M., Vincent, F.M.,
Conrozier, T. 2003. Measurement of
radiographic joint space width in the
tibiofemoral compartment of the
osteoarthritic knee. Arthritis & Rheumatism,
48(2): 378–384.

Comparison on Imagery and Self-Esteem of Various Level Footballers---Mazumder & Ghosh
31
Comparison on Imagery and Self-Esteem of Various Level
Footballers Mazumder,
1 S. & Ghosh,
2 S.S.
1Research Scholar, Department of Physical Education, University of Kalyani, West Bengal, India,
Email. - [email protected] 2Assistant Professor, Post Graduate Govt. Institute for Physical Education, Banipur- 743233, North
24 PGS. West Bengal, India, Email. - [email protected]
Introduction
In sports, imagery and self-esteem
are well-known factors that may enhance
or improve sports skills. Most sporting
programs consist of mental practice, which
has been found to help the basic
development of athletes at lower skill
levels. The use of imagery for success is
not a clearly understood method because
its processes, including effective
techniques, are not defined. Athletes need
to mentally practice both imagery and self-
esteem. Imagery is influenced by many
factors including somatic anxiety,
motivation, emotions, and confidence. It
has been found that a factor like self-
esteem is one that athletes and coaches
consider as relevant for good performance.
Some studies found that many
people and athletes use imagery to increase
exercise and physical fitness as the
imagery helps the success of their exercise
(Hall, 2001). An athlete‘s enactment of
performance imagery is the normal
procedure in training programs. This
method is used more heavily by elite
athletes with higher self- esteem than non-
athletes. Studies suggest that imagery may
help athletes to build more self-confidence
in relation to performance. Kendall et al
(1990) demonstrated that imagery, in
combination with relaxation and selftalk,
increases the utilization of specific
defensive skills. Moreover, athletes who
displayed high selfconfidence and low
anxiety were able to perform under more
relaxing conditions to thereby enhance
their performances (Covassin, 2004).
Self- esteem is one of the most
frequently cited psychological factors
considered by many to be a key factor for
a successful performance stated that in
Abstract
The present study was conducted for the comparison on imagery and self-esteem of various levels of
footballers. Twenty five district level footballers (N1=25) and twenty five state levels footballers
(N2=25) of West Bengal were taken as the subjects for the present study. Thus total no of subjects
were (N=50) fifty only. The age group of the subjects ware ranged from 15 to 19 years. Imagery and
Self-Esteem were the variables for the present study. Imagery was measured by the Sports Imagery
Questionnaire (Cumming, 2002) and Self-Esteem was measured by the Rosenberg Self Esteem Scale
(1965). Mean and standard deviation of each variable were calculated. The means of respective
variables between two games were compared by using t-test. Statistical significance was tested at
0.05 level of confidence. The results of the present study showed that there was statistically
significant difference in the mean value of imagery and self-esteem between the district and state
level footballers.
Keywords: Imagery, Self-esteem, Sports Imagery Questionnaire, Rosenberg Self-esteem (RSE)
scale.

Journal of Exercise Science and Physiotherapy, Vol. 9, No. 1: 31-33, 2013
32
social cognitive theory, an individual‘s
degree of self- esteem influences
performance both directly and indirectly.
In earlier studies, it was found that
successful athletes exhibit higher self-
esteem than unsuccessful athletes
(Treasure et al, 1996). This study noted
that athletes who have higher self- esteem
during competitions are more likely to be
successful. It is also important to note that
confident athletes believe in their ability to
perform well and win (Covassin & Pero,
2004). Performance may be determined by
an individual‘s belief that he or she has the
ability to execute skills, which are required
by the situation and the responsiveness of
the environment. Therefore, the ability of
personal self- esteem strongly contributes
to success or failure. The present study
has been conducted to find out the
differences in the use of imagery and self-
esteem of various levels of footballers.
Materials & Methods
Twenty five district level male
footballers (N1=25) and twenty five state
level male footballers (N2=25) of West
Bengal were taken as the subjects for the
present study. The age group of the
subjects ranged from 15 to 19 years. For
the present project random group design
was adopted. Imagery and Self-Esteem
were the variables for the present study.
Imagery was measured by the Sports
Imagery Questionnaire and Self-Esteem
was measured by the Rosenberg Self
Esteem Scale (1965). The questionnaire
was separated into two parts: a simple
demographic part and a questionnaire for
imagery and Self-Esteem as detailed
below: Imagery Ability: The Sports
Imagery Questionnaire (Cumming, 2002)
is a questionnaire designed to assess an
athlete‘s imagery. The Sports Imagery
Questionnaire consisted of 30 items. The
responder was required to rate the
questions on a scale of 1 to 7, where
1=rare use of imagery and 7=extensive use
of imagery. An average frequency score
was calculated for each athlete. Self-
Esteem: The Rosenberg Self-esteem
(RSE) scale developed by Rosenberg
(1965) is a widely used self-esteem
measurement developed by Rosenberg.
The scale measures self-esteem, which is a
positive evaluation of one‘s attributes and
sense of self-worthiness. It consisted of 10
items. Participants indicate their
agreement-disagreement level for each
item along a four point Liker type scale,
ranging from ―strongly agree‖ to ―strongly
disagree‖. Higher score in the scale
indicate higher self-esteem. The maximum
possible score of the scale is 3 and the
minimum is 0. Total scores were
calculated for each athlete. Mean and
standard deviation were the descriptive
statistics and ‗T‘ test was used as
comparative statistics in the present study.
The level of significant difference was set
at p<0.05 level of confidence.
Results & Discussion
Table 1: Mean and Standard deviation of district and
state level footballers on imagery
Name Of The Group Mean ± S.D.
District 4.75 ± 0 .70
State 5.55 ± 0 .78
Comparison of the mean and standard
deviation of obtained data on Imagery as
measured by the Sports Imagery
Questionnaire (Cumming, 2002) of district
and state level footballers is presented in Table-1. The mean and standard deviation

Comparison on Imagery and Self-Esteem of Various Level Footballers--Mazumder, S. & Ghosh, S.S.
33
of Imagery of the district and state level
footballers were 4.75 ± 0.70 and 5.55 ±
0.78 respectively. Table-2 compares the
mean and standard deviation values of
self-esteem as measured by the Rosenberg
Self-esteem (RSE) scale of district and
state level footballers. The mean and
standard deviation on self-esteem of the
district and state level footballers were
20.69 ± 4.21 and 23.18 ± 4.17
respectively indicating higher self esteem
of state footballers. Table 2: Mean and Standard deviation of district and
state level footballers on self-esteem
Name Of The Group Mean ± S.D.
District 20.69 ± 4.21
State 23.18 ± 4.17
TABLE 3: Significance of the differences between
district and state level footballers on imagery
Group
Imagery
Mean
Differe
nce
Standard
Error
T-
Value
Mean±S.D
.
0.8 0.21
3.82*
District 4.75±0.70
State 5.55±0 .78
*Significant at 0.05 level of confidence: t (48) = * 2.009 TABLE 4: Significance of the differences between
district and state level footballers on self-esteem
GROUP
Self-
Esteem
Mean
Difference
Standard
Error
t-
value
Mean±SD
2.49 1.185 *
2.10 District 20.69±4.21
State 23.18±4.17
*Significant at 0.05 level of confidence: t (48) = *2.009 Statistical comparison of state and
district level footballers reveals the
existence of statistically significant
difference in imagery and self esteem
(tables 3 & 4). The results in general
indicate higher imagery and self esteem
status in case of state level footballers than
the district level footballers. This
differences may occurs due to the fact that
the state level footballers were more
experienced and had higher levels of
physical fitness and thus used imagery
during sports situations more so than
district level footballers. Again the
significant difference in self esteem may be
observed due to the fact that the state level
footballers had higher level of
participation experience, higher level of
game specific fitness and practices more
than the district level footballers.
References
Bandura, A. 1982. Self-reference thought: A
developmental analysis of self-efficacy. In
Flavell, J.H. & Ross, L.D. (Eds). Cognitive
social development: Frontiers and possible
futures (pp. 200-239). New York:
Cambridge University Press.
Covassin, T.,& Pero, S. 2002. The relationship
Between Self-Confidence, Mood State, And
Anxiety among Collegiate Tennis Players.
Journal of Sport Behavior, 27: 230-239.
Cumming, J.L. 2002. Competition athletes‘s use of
imagery and the deliberate practice
framework. Thesis Doctoral degree,
University of Western Ontario.
Hall, C.R. 1995. The motivation functions of
mental imagery for participation in sport and
exercise. Edited by J. Annett, B. Cripps, and
H. Streinberg, 15-21.Leicester, England:
British Psychological Society.
Kendall, G., Hrycailko, D., Martin, G.L., &
Kendall, T. 1990. The effects of an imagery
rehearsal, relaxation, and self-talk package
on basketball game performance. J. Sport &
Exercise Psychology, 12: 157-166.
Paivio, A. 1985. Cognitive and motivation function
of imagery in human performance. Canadian.
J. Application Sport Science. 10: 22-28.
Treasure, D.C., Monson, J.T. & Lox, C.L. 1996.
Relationship between self-efficacy, wrestling
performance, and affect prior to competition.
The Sport Psychologist, 10: 73-83.

Journal of Exercise Science and Physiotherapy, Vol. 9, No. 1: 34-39, 2013
34
Treatment of Plantar Fasciitis by Taping vs. Iontophoresis: A
Randomized Clinical Trial
Goyal,1 M., Kumar,
2Ashok, Mahajan,
3 N. and Moitra,
4 M.
1 Ass. Professor & Head, MM Institute of Physiotherapy & Rehabilitation, MM University, Mullana, Haryana,
India. E-mail: [email protected] 2 Ass. Professor, Department of Sports Science, Punjabi University Patiala, Punjab, India.
3 MPT Student, MM Institute of Physiotherapy & Rehabilitation, MM University, Mullana, Haryana, India 4Ass. Professor, MM Institute of Physiotherapy & Rehabilitation, MM University, Mullana, Haryana, India
Introduction
Plantar fasciitis (PF) has been
reported across a wide sample of the
community that includes both the athletic
and non – athletic population (Schepsis et
al., 1991). Plantar fasciitis represents the
fourth most common injury to the lower
limb (Ambrosius and Kondrachi 1992). In
the non- athletic population, it is most
frequently seen in weight bearing
occupations with unilateral involvement
most common in 70% of cases. In the
athletic population, 10% of all running
athletes involved in basketball, tennis,
football, long distance runner and dancers‘
have all noted high frequency of plantar
fasciitis. Obesity and pronated foot
posture are associated with chronic plantar
heel pain and may be risk factor of the
condition. 10% of the population at some
point in their lifetime experience plantar
heel pain (Riddle and Schappert 2004). In
2000 the foot and ankle special Interest
Group of the Orthopedic Section, APTA,
surveyed over 500 members and received
responses from 117 therapist. Of those
responding, 100% indicated that plantar
fasciitis was most common foot condition
seen their clinic (Delitto et al.,
2008).There is a little knowledge about the
clinical course of the condition and is
unknown approximately in 85% of the
cases (Roxas 2005). The commonly
prescribed treatment options are
conservative and surgical interventions
(Weil et al., 1994). Various treatment
strategies, including orthoses, stretching,
taping, extracorporeal shock wave
therapy, laser therapy and drug therapy in
the form of systemic medication, and
topical application, have been investigated
and have shown variable clinical benefit.
Studies have shown clinically relevant
Abstract
The purpose of the study was to observe the effect of combination of a Taping and Iontophoresis
or Taping alone in the treatment of Plantar Fasciitis pain. A total of 30 patients (male =16;
female=14) were selected as subjects and they were further divided into two groups. Each group
comprising of 15 subjects (male=8; female=7). The results of the present study show an
improvement in the mean values of Visual Analog Scale, and Foot Functional Index scores after
treatment in both groups. But it was found that an improvement was statistical significant more
in Taping and Iontophoresis group than Taping group alone. It was concluded that if the
patients of plantar fasciitis were treated with combination therapy (Taping & Iontophoresis) then
there was noticed significant recovery from pain and disability in them.
Keywords: Plantar Fasciitis, Iontophoresis, Taping, Pain

Treatment of Plantar Fasciitis by Taping vs. Iontophoresis: A Randomized Clinical Trial ----Goyal et al
35
improvements in PF symptoms using
Iontophoresis of Dexamethasone
(Gudeman et al., 1997) and acetic acid
(Japour et al., 1999). Non‐ steroidal
anti‐ inflammatory drugs have been
trialed, but did not show clinically
significant effects (Osborne and Allison
2006).
Low Dye taping supports the
longitudinal arch of the foot. It has been
shown to significantly reduce peak plantar
pressures of normal feet during gait,
especially the peak plantar pressure in the
medial midfoot, Low-Dye taping is applied
below the ankle and is hypothesized to
generate a supinating force that controls
the amount of pronation occurring at the
subtalar joint (Russo & Chipchase, 2001),
so it might be expected to play a role in the
management of PF.
No studies have
examined how taping interacts with drug
therapy during treatment of PF. The
purpose of the present study is to test the
combination therapy of Taping &
Iontophoresis on pain and disability in
plantar fasciitis patients.
Materials & Methods
The 30 patients of plantar fasciitis
both males & females in the age range of 24
to 58 years were selected as subjects after
obtaining their consent based on inclusion
and exclusion criteria of the study. The
subjects were further divided into two
groups: Group- A (n=15) and Group-B (n
=15).
Treatment Protocol: The subjects of
Group - A underwent the taping and
Iontophoresis. The Iontophoresis
comprises of an electric impulses from a
low-voltage galvanic current stimulation
unit to drive ions (0.9% NaCl) into soft
tissue structures. (Figure 1). Saline water
is made by 0.9% NaCl solution. Then the
solution is poured into a water bath.
Electrodes are fixed, red positive electrode
is placed under the metatarsals heads and
the black negative electrode is placed
under the calcaneal bone. Current is
applied using Uniphy Guidance -C
machine. A current up to 4 mA for 10
minutes and a total dose of 40mA is
delivered over a period of time determined
by the patient's sensitivity.
Figure 1.Showing Iontophoresis to the Patient
The taping procedure comprised of
LAYER1 - Patient lie in the prone
position, (1‖ or 2‖ sports/cloth tape spray
with tape adhesive prior to taping) Starting
behind small toe, coursing around back of
heel and adhere to inside of arch right
behind great toe. Before adhering to great
toe, slightly push down on joint behind
great toe to increase bowing of arch as
shown in figure 2.1
LAYER 2 - Apply 2‖ sport tape (cloth) to
bottom of foot with pressure up into the
arch. Tape should adhere to 1st layer of
tape on both sides of the foot. Can leave
heel open if choose. Repeat this 3-4 times
with each layer offset from the previous
about 1/2 the width of the tape until arch
is covered as shown in figure 2.2
LAYER 3 - Apply another strip of tape as
you did in the first layer (one strip only).
This will cover the ends of the 2‖ tape of

Journal of Exercise Science and Physiotherapy, Vol. 9, No. 1: 34-39, 2013
36
the second layer on each side of foot to
prevent peeling up (Figure 2.3).
The foot should be in ‗neutral position‘
i.e. foot in line with the ankle which is
in line with the knee.
Figure 2.1
Figur 2.2
Figur: 2.3
The training frequency of the
treatment session for both the groups and
for each treatment if for 1 week for one
time in a day. The Group B underwent the
taping treatment alone. The scores of VAS
(Visual Analog Scale) and stiffness (Foot
Functional Index) of each subject of
Group- A and Group- B were recorded
before and after 1-week.
Statistics
The data was analyzed using
statistical computer software ‗SPSS 13
software package (version 13, SPSS Inc.
Chicago, USA)‘.The paired t – test and
unpaired t – test was used. The level of
significance was p<0.05.
Results
The mean age and BMI of the
subjects of Group -A and Group-B was
41.33 ±12.11 years, 43.93±8.860 years,
30.05 Kg/m2 and 28.36 Kg/m
2
respectively. It was found that the
difference in the mean values of age and
BMI between Group -A and Group-B was
not statistical significant (Table 1).
Table 1: Comparison of Age & BMI
Group A Group B t-value
Age(years) 41.33±12.11 43.93±8.86
0
0.700
BMI(Kg/m2) 30.05 28.36 0.681
*significant p<0.05
Table 2: Comparison of Scores (Unpaired t - test) of
VAS & FFI between two groups
Group A Group B t-
value
VAS(Mean±SD) before 6.27±0.799 6.40±0.73
7
2.05*
after 1
week
3.87±0.834 4.93±0.88
4
FFI(Mean±SD) before
41.91±3.85
41.91±1.9
4
2.05*
after 1
week
23.44±3.63 32.70±2.2
0
*significant p<0.05
Table 2 shows the comparison of
scores of Visual Analog Scale (VAS) and
FFI between Group- A and Group- B
before and after one week. It was found
that before the start of one week treatment
programme to the subjects of Group- A
and Group- B there was no statistical
difference in the scores of VAS and FFI.
After one week there was statistical
significant difference in the scores of VAS
and FFI in both the groups but a greater

Treatment of Plantar Fasciitis by Taping vs. Iontophoresis: A Randomized Clinical Trial ----Goyal et al
37
improvement was observed in Group- A as
compared to Group- B (Table 2).
Further, it was found that in Group-A
there was a statistical significant
improvement in the scores of VAS & FFI
after one week (Table 3). Table 3. Paired t-test of VAS & FFI of Group A
before after one
week t-value
VAS(Mean±SD) 6.27±0.79 3.87±0.83 2.14*
FFI(Mean±SD) 41.92±3.85 23.45±3.63 2.14*
*significant p<0.05 Similarly, it was found that in Group-
B there was a statistical significant
improvement in the scores of VAS & FFI
after one week (Table 4). Table 4. Paired t-test of VAS & FFI of Group B
before after one
week
t-value
VAS(Mean±SD) 6.53±0.64 4.93±0.88 2.14*
FFI(Mean±SD) 41.92±1.94 32.70±2.20 2.14*
*significant p<0.05
Discussion
The result of present study shows that
subjects in both the groups had significant
decrease in pain and improvement in FFI.
However, out of the two groups, the
Group-A receiving Iontophoresis along
with Taping had a higher percentage of
change in both pain and stiffness as
compared to Taping alone. Therefore the
null hypothesis is rejected and thus
alternate hypothesis is accepted. As
Plantar Fasciitis is one of the conditions
which can be treated by a wide variety of
physiotherapy methods, it is still difficult
to formulate all proof guidelines for the
management of Plantar Fasciitis. Various
methods of treatment exist with own
claims of success without any attempts of
comparing the maximal effective methods.
Both the groups in present study had equal
number of subjects and there was no
significant difference found with respect to
their gender distribution, age and body
mass index. Radford et al., (2006) found a
short term effectiveness of low - dye
taping compared to sham ultrasound
(placebo) at reducing pain. The benefits of
taping found in this study are consistent
with research with mechanical adaptations.
And this change in mechanics reduces the
strain on plantar fascia by supportive tape
during standing and ambulation. So the
use of taping provides the mechanical
stability and support for the strained
plantar fascia. In the clinical setting taping
results in almost immediate changes in
symptoms. It is proposed that, during this
short term alleviation of symptoms, the
adjunct management options have time to
reach therapeutic thresholds. Taping can
be applied in either the acute or chronic
condition (Vicenzino et al., 1997). It may
be more cost - effective for acute cases of
plantar fasciitis (Young et al., 2001). Both
taping strategies (Low – dye taping and
calcaneal taping) were associated with a
reduction in pain for 1 week after plantar
fasciitis. Holmes et al., (2002) &
Vicenzino et al., (2000) demonstrated the
effectiveness of low - dye taping in
reducing pain in plantar heel pain patients.
The result of the present study is bolstered
by the study of Osborne and Allison
(2006) that showed the reduction in the
symptoms of plantar fasciitis patients.
Drooga et al., (2004) determines with his
study that Iontophoresis benefits with
vasodilatation due to attenuated addition
of molar concentrations of NaCl to the
iontophoresis solutions. Chorine is applied
as NaCl solution and has a sclerolytic
effect that reduces redundant scar tissue,
which increases extensibility of scar tissue
and connective tissue and used in
contracture indications. Drooga &

Journal of Exercise Science and Physiotherapy, Vol. 9, No. 1: 34-39, 2013
38
Sjoberga (2003) study the effect of ionic
strength of the vehicle on the nonspecific
vasodilatation during iontophoresis of
sodium chloride and deionized water. They
found that anodal and cathodal
iontophoresis induced a voltage over the
skin that was dependent on the ionic
strength of the test solution. The
nonspecific vasodilatation during anodal
iontophoresis was less pronounced than
during cathodal iontophoresis, and was
independent of the voltage over the skin.
The nonspecific vasodilatation in cathodal
iontophoresis was related to the voltage
over the skin, and was possibly mediated
by depolarization of local sensory nerves.
The result of the NaCl Iontophoresis along
with Taping group shows significantly
greater improvements in morning pain
where as such results could not be found
out when seen in taping alone. So this
study adds that drug delivered (NaCl)
when delivered via Iontophoresis in
combination with Low Dye taping, give
good short tern relief. The benefits of
taping are reduced when it is stopped,
however when it is combined with
Iontophoresis, treatment effects are
maintained. Future research is needed
using a control group to evaluate the
treatment approach used in the study and
also the long term benefits of the
intervention used.
Conclusion
It was concluded that if the patients is
given Iontophoresis along with the Taping,
a better management is seen for pain and
stiffness to those patients treated with
Taping alone.
References
Ambrosius H, and Kondracki M.P. 1992. Plantar
Fasciitis. European Journal of Chiropractic
40: 29 - 40.
Delitto Anthony, Dewitt Amanda John, Smith
Russell Jr., Torburn Leslie, 2008. Heel
Pain—Plantar Fasciitis: Clinical Practice
Guidelines Linked to the International
Classification of Function, Disability, and
Health from the Orthopaedic Section of the
American Physical Therapy Association, J.
Orthop Sports Phys. Ther. 38(4):A1-A18.
Drooga, E.J. and Sjöberga, F. 2003. Nonspecific
vasodilatation during transdermal
iontophoresis—the effect of voltage over the
skin. Microvascular Research, 65(3):172–
178.
Drooga Erik, J, Henricsona Joakim, Nilssonb Gert,
E, Sjöberg, Folke 2004. A protocol for
iontophoresis of acetylcholine and sodium
nitroprusside that minimises nonspecific
vasodilatory effects. Microvascular
Research 67(2): 197–202.
Gudeman S.D., Eisele S.A., Heidt R.S. Jr.,
Colosimo A.J., Stroupe A.L. 1997.
Treatment of plantar fasciitis by
iontophoresis of 0.4% dexamethasone. A
randomized, double-blind, placebo-
controlled study Am. J. Sports Med., 25(3):
312-6.
Holmes, C.F., Wilcox, D., Fletcher, J.P. 2002.
Effect of a modified, low - dye taping medial
longitudinal arch taping procedure on the
subtalar joint neutral position before and
after light exercise. J. Orthopaedics and
Sports Physical Therapy, 32: 194 - 201.
Japour, C.J.,Vohra, R., Vohra, P.K., Garfunkel, L.
and Chin, N. 1999. Management of heel pain
syndrome with acetic acid Iontophoresis J
American Podiatric Medical Association
89(5): 251-257.
Osborne, H.R. and Allison, G.T. 2006. Treatment
of plantar fasciitis by LowDye taping and
iontophoresis: short term results of a double
blinded, randomised, placebo controlled
clinical trial of dexamethasone and acetic
acid: Br. J. Sports Med. June; 40(6): 545–
549.
Radford, A.J., Landorf, B.K, Buchbinder, R. and
Cook, C. 2006. Effectiveness of low - Dye
taping for the short - term treatment of

Treatment of Plantar Fasciitis by Taping vs. Iontophoresis: A Randomized Clinical Trial ----Goyal et al
39
plantar heel pain: a randomised trial. B.M.C.
Musculoskeletal Disorders 7: 64-71.
Riddle, D.L. and Schappert, S.M. 2004. Volume
of ambulatory care visits and patterns of care
for patients diagnosed with plantar fasciitis:
a national study of medical doctors. Foot and
Ankle International, 25(5): 303 - 310.
Roxas, M. 2005. Plantar Fasciitis: Diagnosis and
Therapeutic considerations. Alternative
Medicine Review, 10(2): 83 - 93.
Russo, J Sonia and Chipchase, S Lucy. 2001. The
effect of low-Dye taping on peak plantar
pressures of normal feet during gait
Australian Journal of Physiotherapy 47:
214-220.
Schepsis, A.A.M.D., Leach, R.E.M.D., Gouyca,
J.M.D. 1991. Plantar Fasciitis: Etiology,
treatment, surgical results and review of the
literature. Clinical Orthopaedics and
Related Research, 266: 185 - 196.
Vicenzino, B., Feilding, J., Howard, R., Moore,
R., Smith, S. 1997. An investigation of the
antipronation effect of two taping methods
after application and exercise. Gait Posture,
5: 1 - 5.
Vicenzino, B., Griffiths, S.R., Griffiths, L.A.,
Hadley, A. 2000. Effect of antipronation tape
and temporary orthotic on vertical navicular
height before and after exercise. J.
Orthopaedics and Sports Physical Therapy,
30: 333 - 339.
Weil, LS., Gowlding, P.B, .Nutbrown, N.J. 1994.
Heel spur syndrome: a retrospective study of
250 patients undergoing a standardised
method of treatment. The Foot, 4: 69 - 74.
Young, C.C., Rutherford, S.D., Neidfeldt, W.M.
2001. Treatment of Plantar Fasciitis. Am.
Family Physician, 63: 467 - 474, 477 - 478.

Journal of Exercise Science and Physiotherapy, Vol. 9, No. 1: 40-45, 2013
40
Effect of Positional Release Therapy and Deep Transverse Friction
Massage on Gluteus Medius Trigger Point - A Comparative Study
Doley 1, M,, Warikoo
2, D. & Arunmozhi
3, R.
1Student Researcher, Department of Physiotherapy, Dolphin PG Institute of Biomedical & Natural Sciences,
Dehradun.
2Assistant Professor, Department of Physiotherapy, Dolphin PG Institute of Biomedical & Natural Sciences,
Dehradun. Email: [email protected] 3Associate Professor, Department of Physiotherapy, SBS PGI of Biomedical & Research, Dehradun. Email:
Introduction
Myofascial trigger points are
extremely common and become a painful
part of nearly everyone‘s life at one time
or other. Myofascial trigger point is
described as a hyperirritable spot in
skeletal muscle that is associated with a
hypersensitive palpable nodule in a taut
band. Myofascial trigger points are the
hallmark characteristics of Myofascial
pain syndrome and feature motor, sensory,
and autonomic components. Motor aspects
of active and latent trigger points may
include disturbed motor function, muscle
weakness as a result of motor inhibition,
muscle stiffness, and restricted range of
motion. Sensory aspects may include local
tenderness, referral of pain to a distant site
(Dommerholt et al., 2006; Travell, 1999).
The formation of a myofascial
trigger point may result from a variety of
factors such as a severe trauma, overuse,
overstress, psychological stress and joint
dysfunction. Recent studies have
hypothesized that the pathophysiology of
Myofascial pain syndrome and the
formation of Myofascial trigger point
result from injured or overloaded muscle
fibres leading to involuntary shortening
and loss of oxygen and nutrient supply
with increased metabolic demand on local
tissues (Dommerholt et al., 2006;
Fernandez C et al., 2005 and Malanga,
2010). Simons and Travell suggested that
trigger points in the muscle quadratus
lumborum and gluteus medius are
frequently found in low back pain. Trigger
points in the gluteus medius muscle refer
pain and tenderness along the posterior
Abstract
Study Objectives: To compare the effectiveness of Positional Release Therapy & Deep Transverse
Friction Massage On Gluteus Medius Trigger Point. Methods: 30 subjects were randomly recruited
from various hospitals and community center in Dehradun and Guwahati based on the inclusion
and exclusion criteria. The subjects were divided into two Groups (PRT (Group A) & DTFM
(Group B). Outcome Measure: Pressure pain threshold. Results: Both Groups A and B shown
significant improvement in pressure pain threshold when comparison is made within the group.
However Group B shown significant improvement in pressure pain threshold (p= 0.001) post
intervention between the group. Conclusion: Deep transverse friction massage is better choice of
treatment in improving pain threshold in subjects with gluteus medius trigger point.
Key Words: Myofascial Trigger Point, Myofascial Pain Syndrome, Strain Counter Strain,
Pressure Pain Threshold.

Effect of Positional Release Therapy and Deep Transverse Friction Massage on Gluteus Medius Trigger Point - A
Comparative Study---- Doley et al
41
crest of the ilium, to the gluteal (posterior
and lateral aspect) and sacral regions
which is commonly identified as low back
pain or lumbago (Simons, 1983; Travell,
1999).
Positional release technique or strain
counterstrain technique (PRT or SCS) is a
passive intervention aimed at relieving
musculoskeletal pain and related
dysfunction (Atienza Meseguer et al.,
2006; Chaitow, 2002; Ambrogio, 1997).
The classical description of this technique
was made by Jones in 1981 who
recommended the adoption of a position of
comfort of dysfunctional tissue exhibiting
tender points (Atienza et al., 2006).
Dardzinski et al (2006) found that the
strain counterstrain technique was
effective in reducing pain and improving
function in patients with localized
myofascial pain syndrome. Wong et al
(1994) reported that strain counter strain
reduced sensitivity to palpation and
increased strength in subjects exhibiting
tender points in the hip musculature. Deep
transverse friction massage (DTFM) is a
technique used by James Cyriax and
Gillean Russell to affect musculoskeletal
structures of ligament, tendon and muscle
to provide therapeutic movement over a
small area (Prentice, 2002). The technique
is applied at right angles to the fibres
comprising the tissue containing the lesion
in a relaxed and shortened position
(Boyling, 1994; Prentice, 2002). Hong et
al (1993) hypothesized that deep massage
can offer effective stretching and
mobilization of taut bands also reducing
pain and tenderness of myofascial trigger
point (Fernandez et al, 2006). Both
PRT and DTFM found separately to be
effective on reducing tenderness and pain
evoked by trigger points. Thus we set out
to examine which amongst these
techniques is most effective in treating
gluteus medius trigger point. Therefore the
purpose of the present study was to
compare the effects of Positional Release
Therapy and Deep Transverse Friction
Massage on Gluteus Medius Trigger
Point.
Materials & Methods
Thirty subjects were included
from various hospitals and community in
Dehradun and Guwahati based on the
inclusion and exclusion criteria and
divided into 2 groups Group A (n=15),
and Group B (n=15). Subjects presenting
with at least one area trigger point at
gluteus medius muscle between the ages of
20 -40 years were included. Before
participating, the subjects read and signed
informed consent form that was approved
by the Institutional review board. Pre
intervention measurements of pressure
pain threshold using algometer were
carried out for each patient. All the
subjects received interventions in alternate
days for 3 days. The PPT value was
measured on 3rd
day and 5th day prior to
treatment and the final reading was taken
on 7th day. Subjects were excluded from
the participation like any sensory
disturbances in the gluteus medius region,
Diagnosed disc prolapse, History of any
trauma or surgery of the lower back or hip
region, Diagnosed fibromyalgia syndrome,
If the subjects is undergoing any
myofascial pain therapy in the past one
month before the study, and Sacroiliac
joint dysfunction.
Procedure: Positional release
technique subjects were asked to lie prone

Journal of Exercise Science and Physiotherapy, Vol. 9, No. 1: 40-45, 2013
42
with the therapist standing on the same
side of the trigger point. Once the trigger
point was palpated on the gluteus medius
the therapist extend and abducts the hip
and supports the patient‘s leg on the
therapist thigh until reported pain reduces
by 70%. The hip is positioned in marked
external rotation for trigger points located
posterior to the mid axillary line and in
internal rotation for those located anterior
to mid axillary line. The position of
comfort was held for 90 sec. After the
release the subject was put back slowly
and passively to the neutral position
(Ambrogio, 1997; Chaitow, 2002).The
same procedure was repeated for 5 times.
Deep Transverse Friction
Massage subjects were asked to lie prone
with pillow placed under the thigh of the
involved side. The treatment area was
cleaned and dried before applying the
technique. The treatment was applied by
the therapist standing at the side of the
patient. Treatment was given by thumb
after the involved trigger point was
palpated on the gluteus medius with the
muscle in relaxed and shortened position
(hip extension and abduction). The thumb
was used by the therapist to apply friction
across the fibre of the muscle. Transverse
friction was applied with as much pressure
as the patient tolerated and the therapist‘s
thumb and the patient‘s skin was moved
together as one. The treatment was applied
for 10 minutes (Boyling and Palastanga,
1994).
Data was analysed by using SPSS
software (version-13). Paired t-test was
applied to compare the PPT within the
groups. Independent t-test was applied to
compare the PPT between the groups. The
p value was set at (≤0.05).
Results & Discussion
Table 1.1: Mean and SD of Age for the subjects of
Group A and Group B
Demographic
Group A Group B
Mean SD Mean SD
AGE 26.47 3.31 28.07 5.90
Table 1.2: Comparison of mean value for PPT at 1st,
3rd
, 5th
and 7th
day within Group A and Group B
PPT
Group A Group B
t p t p
1st v
3rd
-9.260 0.000 -16.84 0.00
1st v
5th
-12.36 0.000 -9.136 0.00
1st v
7th
-12.91 0.000 -17.62 0.00
Table 1.3: Comparison of mean value for PPT at 1st,
3rd
, 5th
and 7th
day between Group A and Group B PPT
GROUP A Vs GROUP B
t P
1st day -1.280 0.211
3rd
day -2.813 0.009
5th
day -2.981 0.006
7th
day -3.890 0.001
The study showed that there is
improvement in the pressure pain threshold
after the intervention in both the groups as
shown in Table 1.2 and Fig.1.1. This
improvement in pressure threshold was
found to be statistically significant with
p=.001. When comparison is made
between the group, Group B (Deep
Transverse Friction Massage) showed
more improvement in pressure pain
threshold as compared to Group A. Table
1.3 shows the mean value of the data
collected at 1st (pre) day had been found
statistically insignificant (p-value = .211)
and the data of 3rd, 5
th and 7
th day which
had been found statistically significant (p-
value= .009, .006, .001) when compared
between the group. Fig.1.2 and fig.1.3
Effect of Positional Release Therapy and Deep Transverse Friction Massage on Gluteus Medius Trigger Point - A
Comparative Study---- Doley et al
43
shows the improvement in the pressure
pain threshold after the intervention
between the Group A and Group B, which
clearly indicate that there is significant
improvement in Group B.
Discussion: Myofascial trigger points are
extremely common and become a painful
part of nearly everyone‘s life at one time
or other (Dommerholt et al., 2006).
Trigger point in gluteus medius muscle
cause referred pain that is commonly
identified as low back pain or lumbago. Its
three trigger point regions together refer
pain and tenderness primarily along the
posterior crest of the ilium, to the sacrum
and to the posterior and lateral aspect of
the buttock. Pain and tenderness may
extend to the upper thigh also (Prentice,
2002; Travell, 1999). After comparison
Group B (Deep transverse friction
massage (DTFM)) showed significant
effect on improving the pain threshold in
subjects with gluteus medius trigger point.
We compared transverse friction massage
with Positional release technique as some
therapist claims that transverse friction
technique places considerable strain on
their hand. However, DTFM was found to
be significantly effective than PRT.
Transverse friction massage
involves the application of friction and
pressure at depth to the offending lesion
which is considered to be the cause of pain
or reduced function (Cyriax, 1978). Force
is applied perpendicular to the fibres in an
attempt to separate each fibres,
mechanically, promotes local hyperemia,
analgesia, and reduction of adherent scar
tissue to ligament, tendon and muscle
structure. Deep transverse frictions cause
the stimulation of nociceptive endings
connected to Aδ fibres and
mechanoreceptors found in soft tissues
which are connected to large diameter Aβ
fibres. These large diameter fibres have an
effect on cells in the posterior horn of the
cord tending to inhibit forward
transmission of the small-diameter
nociceptive information, i.e. the ‗pain gate‘
is closed. Hence it is suggested that
presynaptic inhibition at cord level will
modulate peripheral pain and reduce its
perception (Watson, 1986; Bowsher,
1988). There may also be inhibition of
neurotransmission exerted from higher
centers, as the arrival of nociceptive
stimuli at certain central inhibitory nuclei
in the CNS (Raphe nuclei and
periaqueductal area of grey matter in the
midbrain) causes release of chemicals
from neurons at cord level which block the
action of nociceptive neurotransmitters
(encephalin, endorphin). Consequently, in
terms of modulation of pain, transverse
frictions can be justified on both counts as
they will cause presynaptic inhibition at
the cord level and inhibit pain by the
central production of encephalins (Boyling
and Palastanga, 1994). Massage
increases the blood circulation in the soft
tissue, thus enhances the excretion of
lactate or inflammatory substances and
facilitate secretion of endogenous opiates
(Yoon et al., 2012). This mechanism
explains the reason for the results in our
study where the pain threshold improved
significantly in the DTFM group.
Macgregor et al (2012) suggested
that massage resets sarcomere lengths.
Deep cross-friction massage facilitates the
proliferation of fibroblasts and results in
the facilitation of soft tissue healing and
realignment as pressure applied to the
muscle is increased (Yoon et al., 2012). It

Journal of Exercise Science and Physiotherapy, Vol. 9, No. 1: 40-45, 2013
44
is also reported that deep cross-friction
massage was effective on subacute non-
specific low back pain (Farasyn &
Meeusen, 2007). Hong and colleagues
(2006) reported that the best results in
decreasing pain from myofascial trigger
point were obtained with a deep pressure
soft tissue massage. These results support
our study where the pain threshold
improved significantly in DTFM group.
However the present study showed
significant effect in Group A (positional
release therapy) on pain threshold in
within group. In support of present study
Positional release technique is thought to
achieve its benefits by means of an
automatic resetting of muscle spindles
which would help to dictate the length and
tone into the affected tissues (Atienza
Meseguer et al., 2006). Simons proposed
that local pressure may equalize the length
of the sarcomeres in the involved Trp
(trigger point) and consequently decrease
pain. Strain-counterstrain technique is
usually applied with the targeted muscle in
a shortened position, and used to treat
tender points (Fernandez et al., 2006). It
might be that pain relief from strain-
counterstrain technique may result from
the stimulation of Aδ fibres (Atienza
Meseguer et al., 2006).
These reasons
supports the results of our study where the
pain threshold improved in the PRT group.
Wong and Schauer-Alvarez found in their
study that strain-counterstrain reduced
sensitivity to palpation in subjects
exhibiting tender points in hip musculature
(Atienza Meseguer et al., 2006).
Dardzinski et al found that the strain
counterstrain technique was effective in
reducing pain and improving function in
patients with localized myofascial pain
syndrome (Dardzinski et al., 2006).
Results of the present study demonstrates
that group B showed statistically
significant improvement in pressure pain
threshold when compared to group A.
Reduction in myofascial trigger point
tenderness after the application of PRT
could be due to the manual contact
component of the treatment and also due to
change in trigger point sensitivity rather
than any unintentional release of pressure
as suggested by Lewis C and Fryer and
Hodgson in their study. On the other hand
transverse friction massage not only
results in the resets of sarcomere
lengthening but it also helps in the
proliferation of the fibroblast which
thereby not only improves the soft tissue
healing but also realign the muscle fibres
by offering the effective stretching and
mobilization to the taut bands. This
mechanism could be the reason for better
result yielded in the DTFM group
Limitations of the study are small
sample size and no blinding was done in
the study. Future study can be done with
broader dimension, long term follow up
and with the use of other outcome measure
(range of motion and ODI scale).
Conclusion: The present study
demonstrates that both the technique is
effective in improving the pain threshold in
subjects with gluteus medius trigger point.
Our study highlights that deep transverse
friction massage is better choice of
treatment in improving pain threshold in
subjects with gluteus medius trigger point.
Acknowledgement: I am thankful to the
Chairman, HOD and all the faculty
members of the Dolphin PG Institute of
Biomedical & Natural Sciences, for their
constant help and support during my

Effect of Positional Release Therapy and Deep Transverse Friction Massage on Gluteus Medius Trigger Point - A
Comparative Study---- Doley et al
45
research work. I am eternally grateful to
the Chairman of Dolphin PG Institute of
Biomedical & Natural Sciences,
Dehradun, for providing me the space and
facilities during the research work.
References Atienza Meseguer, A., Fernandez, C., Navarro-
Poza, J.L., Blanco, C.R., Gandia, J.J B.
2006. Immediate effect of strain
counterstrain technique in local pain evoked
by tender points. Clinical Chiropractic, 9:
112-118.
Boyling, J.D., Palastanga, N. 1994. Grieve’s
Modern Manual Therapy, The Vertebral
Column. 2nd edition. Churchill Livingstone,
New York. 812-817.
Chaitow, L. 2002. Positional Release Therapy. 2nd
edition. Churchill Livingstone, Philadelphia,
USA.
D Ambrogio, J., Roth, G. 1997 Positional Release.
Assessment and Treatment of
Musculoskeletal dysfunction. Mosby.167 &
172.
Dardzinski, J A., Ostrov, B.E., Hamann, L S. 2006
Successful use of a strain counterstrain
technique with physical therapy: Myofascial
pain unresponsive to standard treatment.
Journal of Clinical Rheumatology, 6(4):
169-74
Dommerholt, J., Bron, C., Franssen, J. 2006.
Myofascial Trigger point: An evidence
informed review. The Journal of Manual
and Manipulative Therapy, 14(4):230-221.
Farasyn, A., Meeusen, R. 2007. Effect of
roptrotherapy on pressure pain thresholds in
patients with subacute non-specific low back
pain. Journal of Musculoskeletal Pain, 15:
41-53.
Fernandez, C., Blanco, C.A., Fernandez, J.,
Miangolarra, J. C. 2006. The immediate
effect of ischemic compression technique
and transverse friction massage on
tenderness of active and latent myofascial
trigger: a pilot study. Journal of Bodywork
and MovementTtherapies, 10: 3-9.
Fernandez, C., Carnero, J. F. 2004. Transverse
friction massage. A therapeutical alternative
for the treatment of the myofascial pain
syndrome. Fisioterapia, 26(3): 126-33.
Fernandez, C., Campo, M.S., Carnero, J.F. 2005.
Manual therapies in myofascial trigger point
treatment-a systemic review. Journal of
Bodywork and Movement Therapies, 9: 27-
34.
Hong, C.Z., Chen, Y.C., Pon, C.H., Yu, J. 1993.
Immediate effects of various physical
medicine modalities on pain threshold of an
active myofascial trigger point. Journal of
Musculoskeletal Pain, 1(2): 37-53.
Malanga, G.A., Cruzcolon, E.J. 2010. Myofascial
low back pain: A review. Physical Medicine
Rehabiitationl Clinics of North America, 21:
711-724.
Njoo, K.H., Does, E.V. 1994 The occurrence and
inter rater reliability of myofascial trigger
points in the quadratus lumborum and
gluteus medius : a prospective study in non-
specific low back pain patients and controls
in general practice. Pain, 58: 317-323.
Prentice, W.E. 2002. Therapeutic Modalities for
Physical Therapist. 2nd edition. McGraw
Hill Medical publishing division, New York.
430-431.
Simons, D.G., Travell, J.G. 1983. Myofascial
origins of low back pain. Postgrad Med,
73(2): 99-105.
Stasinopoulos, D., Johnson, M I. 2004 Cyriax
physiotherapy for tennis elbow/lateral
epicondylitis. British Journal of Sports
Medicine, 38: 675-677.
Travell, J., Simons, D. 1999. Myofascial pain and
dysfunction. The trigger point manual.
Upper half of body. 2nd edition (Vol1).
Lippincott Williams and Wilkins; 1-7, 71-
72, 19-21, 35, 116-121.
Travell, J., Simons, D. 1999. Myofascial pain and
dysfunction. The trigger point manual. The
lower extremities. 2nd edition. (Vol 2).
Lippincott Williams and Wilkins; 150-165.
Yoon, Y.S., Yu, K.P., Lee, K.J., Kwak, S.H., Kim,
J.Y. 2012. Development and application of a
newly designed massage instrument for deep
cross-friction massage in chronic non-
specific low back pain. Annals of
Rehabilitation Medicine, 36: 55-65.

Journal of Exercise Science and Physiotherapy, Vol. 9, No. 1: 46-50, 2013
46
Impact of Chronicity on Lipid Profile of Type 2 Diabetics Singh
1, Gurdeep & Kumar
2, Ashok
1Ph.D. Research Scholar, Department of Sports Science, Punjabi University Patiala, India, Email:
[email protected] 2Assistant Professor, Department of Sports Science, Punjabi University Patiala, India
Introduction
Dyslipidemia is one of the major
cardiovascular disease (CVD) risk factors
and plays an important role in the progress
of atherosclerosis, the underlying
pathology of CVD. The prevalence of
dyslipidemia in type 2 diabetes is double
with respect to the general population
(Haffner, 1998). In patients with type 2
diabetes, which is equivalent to CHD
(Juutilainen et al. 2005); it is most
commonly characterized by elevated TG
and reduced HDL-C (Goldberg, 2001).
These abnormalities can be present alone
or in combination with other metabolic
disorders. The prevalence of dyslipidemia
varies depending on the population
studied, geographic location,
socioeconomic development and the
definition used (Wood et al, 1972; Berrios
et al, 1997). Triglyceridemia has been
associated with increased risk of coronary
heart disease both in non-diabetic and type
2 diabetic subjects (Frank et al., 2002,
Sridhar, 2002). Remnants of triglyceride
rich lipoproteins seem to be extremely
atherogenic (Car et al., 2004). LDL
cholesterol is related to life style factors
such as diet and exercise (Khatit et al.,
2008). It has been associated with
metabolic syndrome (Analava et al.,
2007). The Pro-atherogenic properties of
small LDL particles may relate to their
ability to penetrate the arterial wall and
thereby making them more susceptible to
Abstract
Aim: To study the impact of chronicity of type 2 diabetes on lipid profile in type 2 diabetics.
Material & Methods: This study was conducted on 120 Punjabi male type 2 diabetics. Their
age ranged from 30 to 70 years. The subjects were categorized into three groups, on the basis of
the duration of detection of type 2 diabetes- group 1(below 4 years), group 2 (between 4 to 8
years) and group 3(above 8 years).Results: There was sharp and definite increase in the
percentage of patients having >200mg/dl total cholesterol after four years of diabetes mellitus
from 16% to 25% and then to 55% after 8 years of duration. The percentage of patients having
>150mg/dl of low density lipoproteins (LDL) after 8 years of diabetes mellitus was much high
(67%) as compared to group 1 (29%) and group 2 (49%) . There was also an increase in the
percentage of patients having <160mg/dl of triglycerides after four years of diabetes mellitus
from 14% to 37% of diabetes and then to 56% after 8 years. Conclusion: The chronicity of
Type 2 Diabetes mellitus disturb the normal levels of lipid profile that is dyslipidemia if
unchecked this may lead to atherosclerosis and ultimately Cardio-Vascular Disease (CVD) and
it is the commonest cause of death in type 2 diabetics.
Key words: Type 2 Diabetes Mellitus, Lipid profile, Dyslipidemia.

Impact of Chronicity on Lipid Profile of Type 2 Diabetics ----Singh & Kumar
47
oxidation, indirectly linked with coronary
artery disease (Goldfine and Beckman,
2008). Coronary artery disease represents
a wide spectrum from angina pectoris,
myocardial infarction and sudden death to
silent myocardial ischemia (Mozaffarian et
al., 2006). Silent myocardial ischemia has
a reported prevalence of 10-20% in
diabetic population as compared to 1-4%
in non-diabetic population (Ronald et al.,
2004). The present study was planned to
identify the impact of Chronicity on lipid
profile among type 2 diabetic Punjabi
population.
Material and Methods
This prospective study was conducted
on 120 type 2 diabetic patients. The age
limit was taken from 30 to 70 years. Only
male patients were selected on random
base as subjects. The study protocol was
reviewed and approved by the Ethics
Committee of Punjabi University, Patiala.
Following exclusion criteria was used-
patients with type 1 diabetes mellitus, any
liver, kidney or cardiac failure, neoplasm
and patients who were on any type of anti-
lipidemic therapy. The objectives of the
present study were thoroughly explained to
the subjects. Participants of the study were
divided into three groups according to the
duration of detection of diabetes mellitus.
In the first group patients with history of
type 2 diabetes mellitus below 4 years
were included; second group included 4-8
years and third group included above 8
years duration of type 2 diabetes mellitus.
The patient underwent a clinical
assessment, which included history (a
questionnaire) and clinical examination.
The variables of questionnaire were age,
sex, marital status, personal history
(occupation, education, socio-economic
status) exercise status, smoking status and
family history (including family history of
diabetes). The serum was separated
immediately after obtaining the blood
sample (overnight fasting) using
centrifugation for 10 minutes. Lipid
Profile [Total Cholesterol (TC), HDL &
Triglycerides (TG)] were measured using
Blood Analyzer by the qualified laboratory
technician. The appropriate chemical
testing kits were used. LDL was calculated
by using Friedewald formula: LDL= TC –
(TG/5) - HDL.
Results & Discussion
Among 120 patients with diabetes
below 4 years of onset, 21(48%) had total
cholesterol levels <150mg/dl while
16(36%) had total cholesterol levels 150–
200mg/dl and 7(16%) had >200mg/ dl.
Among those with diabetes for 4-8 years,
15(30%) had total cholesterol <150 mg/dl
while 12(25%) had 150-200mg/dl and
22(45%) had levels >200mg/dl. Among
those with diabetes for above 8 years,
5(19%) had total cholesterol levels <
150mg/dl while 7(26%) had 150-200mg/dl
and 15(55%) had >200mg/dl.
Among 120 patients with diabetes below 4
years of onset, 10(23%) had HDL -
cholesterol levels <40mg/dl while
34(77%) had >40mg/dl. Among those
with diabetes for 4-8 years, 19(39%) had
HDL cholesterol <40mg/dl while 30(61%)
had >40mg/dl. Among those with diabetes
for above 8 years, 17(63%) had HDL
cholesterol <40mg/dl while 10(37%) had
>40mg/dl.
Among 120 patients with diabetes
below 4 years of onset, 31(71%) had
LDL-cholesterol levels <150mg/dl while

Journal of Exercise Science and Physiotherapy, Vol. 9, No. 1: 46-50, 2013
48
13(29%) had >150mg/dl. Among those
with diabetes for 4-8 years, 25(51%) had
LDL cholesterol levels <150mg/ dl and 14
24(49%) had LDL cholesterol >150mg/dl.
Among those with diabetes for above 8
years, 9(33%) had LDL cholesterol <150
mg/dl while 18(67%) had LDL cholesterol
levels >150mg/dl. Among 120 patients
with diabetes below 4 years of onset,
38(86%) had triglyceride levels from 40-
160 mg/dl while 6(14%) had >160mg/dl.
Among those with diabetes for 4-8 years,
31(63%) had triglycerides from 40-160
mg/dl while 18(37%) had >160mg/dl.
Among those with diabetes for above 8
years, 12(44%) had triglycerides 40-160
mg/dl while 15(56%) had >160mg/dl.
Table: Duration of Type 2 diabetes and lipid profile of different groups. Group Group 1, (below 4 years) Group 2, (4-8 years) Group 3, (above 8 years)
TC (mg/dl)
<150
150-200
>200
21(48%)
16(36%)
7(16%)
15(30%)
22(45%)
12(25%)
5(19%)
7(26%)
15(55%)
135±5.9
168±8.2
202±2.0
141±2.2
177±6.9
214±3.7
148±4.1
181±3.3
222±5.2
HDL (mg/dl)
<40
>40
10(23%)
34(77%)
19(39%)
30(61%)
17(63%)
10(37%)
39±3.5
52±5.4
35±3.0
47±2.8
31±4.2
44±3.6
LDL (mg/dl)
<150
>150
31(71%)
13(29%)
25(51%)
24(49%)
9(33%)
18(67%)
121±4.1
145±7.2
134±5.4
157±3.9
140±2.0
169±4.7
TG (mg/dl)
40-160
>160
38(86%)
6(14%)
120±7.2
160±2.9
31(63%)
18(37%)
143±3.7
171±4.7
12(44%)
15(56%)
147±5.3
183± 2.0
TC- total cholesterol, HDL- high density lipoproteins, LDL-low density lipoproteins, TG- triglycerides
The Patients with diabetes have a
higher degree of atherosclerosis burden
due to dyslipidemia than the people
without diabetes (Mohsin et al., 2007).
New National Cholesterol Education
Programme (NCEP) guidelines raise the
risk factors of patients with diabetes
without known CHD to CHD equivalent, a
guideline substantiated by the results of
numerous studies (Alexander et al., 2003).
For example in Finnish East West Study,
patients with diabetes, without known
heart disease had 20% chance of having a
cardiac event over a 7 years time period
(Haffner et al., 2000). In Canadian
patients with type 2 diabetes a Chart audit
study revealed that 55% of patients with a
diagnosis of <2 years had dyslipidemia.
This population rose to 16% in patients
with diabetes for >15 years (Harris et al.,
2005). The United Kingdom Prospective
Study (UKPDS) calculated risk score for
CVD, which indicates both the duration
and the degree of glycemic control
(Guzder et al., 2005). Talat et al, (2003)
found that duration of diabetes was
associated with higher incidence of
dyslipidemia. In that study they found
elevated total cholesterol, low density

Impact of Chronicity on Lipid Profile of Type 2 Diabetics ----Singh & Kumar
49
lipoprotein and triglycerides. Our study is
consistent with that.
Conclusion: The chronicity of Type 2
Diabetes mellitus can disturb the normal
levels of lipid profile which can lead to
dyslipidemia. The advanced dyslipidemia
can progress the atherosclerosis and
ultimately Cardio-Vascular Disease
(CVD), commonest cause of death in type
2 diabetics.
REFERENCES American Diabetes Association. 2007.
Standards of Medical Care in Diabetes.
Diabetes Care, 30: 4-41.
Frank, B, Stampfer, J, Steven, M. 2002.
Elevated risk of cardiovascular disease
prior to clinical diagnosis of type 2
diabetes. Diabetes Care, 25: 1129-34.
Sridhar, RG. 2002. Diabetes in India:
snapshot of a panorama. Current
Science, 83: 1-2.
Car, J, Patel, H, Majeed, A. 2004. Diabetes
care in developing countries. Can. Med
.Assoc. J., 176: 209-12.
Khatit, M, Quazi, S. 2008. Risk factors of
type 2 diabetes mellitus in rural wardha:
a community bared study. International
Journal of Diabetes in Developing
Countries, 28: 79-82.
Analava, M., Bhattacharya, D. 2007. Dietary
Influence on Type 2 Diabetes (NIDDM).
J. Hum. Ecod; 21:139-47.
Goldfine and Beckman: 2008. Life and Death
in Denmark: Lesson About Diabetes and
Coronary Heart Disease. Circulation,
117: 1914-7.
Mozaffarian, D., Martijn, B., Alberto, A.,
Mer, J. 2006. Trans Fatty Acids and
cardiovascular diseases. NEJM, 354:
1601-13.
Ronald, M, Krauss, M. 2004. Lipids and
Lipoproteins in Patients with type 2
Diabetes. Diabetes Care, 27: 1496-
1504.
Mohsin, R., Badar, B., Saeed, A., Rehman,
A. 2007. Type 2 Diabetes: the
relationship between the serum
cholesterol and triglycerides.
Professional M Ed J., 14: 337-43.
Alexander, C.M., Landsman, P.B., Tentsch,
S.M. 2003. Third National Health and
Nutritional Examination Survey
(NHANES III), National Cholesterol
Education Program (NCEP). NCEP
defined metabolic syndrome, diabetes,
and prevalence of coronary heart disease
among NHANES III participants age 50
years and older diabetes. 52: 1210-4.
Haffner, S.M., Lehto, S., Ronnemaa, T. 2000.
Mortality from coronary heart disease in
subjects with type 2, diabetes and in non
diabetic subjects with and without prior
myocardial infarction. N. Engl. J. Med.,
339: 229-34.
Harris, S.B., Ekoe, J.M., Zanowiez, Y. 2005.
Glycemic control and morbidity in the
Canadian primary care setting (Result of
the diabetes in Canada evaluation
study). Diabetes Resllin. Pract., 70: 90-
7.
Guzder, R.N., Gatting, W., Mullee, M.A.
2005. Prognostic value of the
framingham cardiovascular risk
equation and the UKPDS risk engine for
coronary heart disease in newly
diagnosed type-2 diabetes: Results from
a united kingdom study. Diabetes Med.,
22: 554-62.
Talat, N., Khan, A., Gulsena, M., Bilal, B.
2003. Dyslipidemias in Type 2 Diabetes
Mellitus Patients in a Teaching Hospital
of Lahore, Pakistan. Pak. J. Med. Sci.,
19: 283-6.
Berrios, X, Koponen, T., Huiguang, T,
Khaltaev, N., Puska, P., Nissinen, A.
1997. Distribution and prevalence of
major risk factors of non-communicable
diseases in selected countries: the WHO

Journal of Exercise Science and Physiotherapy, Vol. 9, No. 1: 46-50, 2013
50
Inter-Health Programme. Bull. World
Health Organ, 75: 99-108.
Goldberg, I.J. 2001. Clinical review 124:
Diabetic dyslipidemia: causes and
consequences. J. Clin. Endocrinol.
Metab. 86: 965-971.
Haffner, S.M. 1998. Management of
dyslipidemia in adults with diabetes.
Diabetes Care, 21: 160-78.
Juutilainen, A., Lehto, S., Ronnemaa, T.,
Pyorala, K., Laakso, M. 2005. Type 2
diabetes as a "coronary heart disease
equivalent": an 18-year prospective
population-based study in Finnish
subjects. Diabetes Care, 28: 2901-2907.
Wood, P.D., Stern, M.P., Silvers, A., Reaven,
G.M, von der Groeben, J. 1972.
Prevalence of plasma lipoprotein
abnormalities in a free-living population
of the Central Valley, California.
Circulation, 45: 114-126.

Comparative Dose-Response Study of Stretching On Strength of Proximal (Hamstring) and Distal (Calf) Muscle -Khan
et al
51
Comparative Dose-Response Study of Stretching On Strength of
Proximal (Hamstring) and Distal (Calf) Muscle
Khan1, M., Quddus
2, N., Chawla
3 C, Anwer
4, S,
1Physiotherapist, Ability Physiotherapy Clinic, New Delhi, India.
e-mail: [email protected] 2Assistant Professor, Jamia Hamdard, New Delhi, India, email: [email protected] 3Director, Ability Physiotherapy Clinic, New Delhi, India, e-mail: [email protected] 4Asst. Professor, Padmashree Dr. D. Y. Patil College of Physiotherapy, Pimpri, Pune - 411018,
Maharashtra, India. e-mail: [email protected]
Introduction
Stretching is traditionally used as part
of a warm-up to increase flexibility or
pain-free range of motion (ROM) about a
joint in an attempt to promote better
performances and/or reduce the risk of
injury (Shellock and Prentice, 1985;
Smith, 1994; Fowles et al., 2000). Athletic
trainers and other rehabilitation
professionals also recommend that their
athletes or patients stretch before
performing strengthening exercises or
strength assessment tests (Bixler and
Jonese, 1992). However, authors of recent
systematic reviews and many original
studies have suggested that pre exercise
stretching may temporarily compromise a
muscle's ability to produce force (Behm,
2001; Young and Elliott, 2001; Thacker
et al., 2004; Shrier, 2004). It is possible
that this short-term effect of stretching on
muscle force production may affect the
performance of various rehabilitation
strengthening exercises. More importantly,
pre exercise stretching may adversely
affect the results obtained by muscle
strength assessments and, in turn,
influence a clinician's decisions regarding
rehabilitation progression or return to play
(McHugh and Nesse, 2007; Herda et al.,
2009). Fowles et al (2000) reported that
30 minute of passive stretching reduces
Abstract
Objective: To compare the stretching induced strength changes between the proximal and distal
groups of muscles. Methods: Twenty-eight recreationally active male individuals participated in
this study. They were assigned into Group A for proximal muscle (hamstring) and group B for
distal muscle (calf) with 14 subjects in each group. This study is an experimental trial of self-
stretching for 2 minutes (SS2). This stretch duration involved a 30 second stretch and a 20 second
relaxation period, intermittently. Maximum Isometric Voluntary Contraction Force (MIVCF) was
measured in both groups before (pretest) and immediately after (posttest) stretching. Change in
pre-stretching and immediately post-stretching MIVCF was compared between the two groups.
Results: Maximum Isometric Voluntary Contraction Force increased with SS2 in the hamstring by
1.31% and in calf muscle, it increased by 2.92%. However, these changes were statistically
insignificant between the two groups (p>0.05). Conclusion: Shorter stretching (2 minute)
increases maximum isometric voluntary contraction force in both muscles but relatively more in
the calf. Key Words: Stretching induced, strength, MIVCF, strain gauge

Journal of Exercise Science and Physiotherapy, Vol. 9, No. 1: 51-56, 2013
52
isometric torque by 28% and a 9% force
deficit was still present at 1 hour post
stretching. The reason for this reduction in
muscle strength was thought to be mainly
due to changes (decrease) in
musculotendinous stiffness and altered
motor control strategies (decreases in
muscle activation) (Behm, 2001; Knudson
et al., 2001).
In a study by Ryan et al (2008) it
was suggested that shorter durations of
stretching may not diminish muscle
activation in the plantar flexors. In
contrast, larger muscle groups such as the
leg extensors have demonstrated
reductions in muscle activation after 8
minute of stretching. Therefore, it is
possible that the stretching induced
decreases in muscle activation may be
muscle specific, such that the suboptimal
activation of the larger, proximal muscles
may be amplified after stretching, whereas
the near fully activated, distal muscles
require longer durations of stretch to
diminish muscle activation. Since then, no
study has been done to test this hypothesis.
The present study involved the
comparison of a proximal muscle and
distal muscles regarding strength loss after
stretching. It is hypothesized that self-
stretching would result in transient acute
reduction in muscle strength and stretch
induced strength loss would be greater for
proximal muscle (Hamstring muscle) as
compared to distal muscle (Calf muscles).
Materials & Methods
Subjects: A total of 28 male subjects
with mean age 24.89 years were studied.
Fourteen in group A participated in
stretching and strength measurement of the
proximal muscle (hamstring) and 14 in
group B participated in stretching and
strength measurement of distal muscle
(calf). Inclusion criteria were; 20-30 years
age group, subjects lacking at least 20 -
degrees of active knee extension with the
hip in 90 degrees of flexion during active
knee extension test for group A and for
group B subjects having not more than 20
degrees of active dorsi-flexion in long
sitting position with back supported
against wall (Worrell, 1994). All the
subjects were recreationally active
(engaging in 1 to 5 hours of regular
physical activity, not involving stretching
exercises, per week). No one reported any
current or ongoing neuromuscular diseases
or musculoskeletal injuries specific to
ankle, knee, or hip joints. None of the
participants were competitive athletes. The
study has the approval of Institutional
Ethical Committee, Jamia Hamdard, New
Delhi and written consent was obtained
from all the participants. All subjects were
recruited from Majeedia Hospital, New
Delhi.
Study design: This was a pretest
posttest experimental group designed to
evaluate the effect of stretching on
reduction of muscle strength and the
comparison of a proximal muscle and
distal muscles regarding strength loss after
stretching. This study includes pre
intervention assessment, Intervention and
post intervention assessment.
Pre intervention assessment: Active
range of motion and MIVCF were
measured. All the procedures were
explained to the subjects prior to
assessment.
(A). AROM measurement: Active range of
motion (AROM) was measured using
Universal Goniometer.

Comparative Dose-Response Study of Stretching On Strength of Proximal (Hamstring) and Distal (Calf) Muscle -Khan
et al
53
1. For Hamstring muscle: Active knee
extension test was performed (Sullivan et
al., 1992; Worrell et al., 1992). Subjects
were made to lie supine. Hip joint was
kept at 90 degrees of flexion. Immovable
arm was placed parallel to long axis of the
thigh. Fulcrum was placed at the lateral
condyle of the femur. Movable arm was
placed parallel to long axis of the leg.
Subjects were asked to actively extend the
leg up to maximum range. Lack in full
extension at knee was noted.
2. For calf muscle: Subjects were
made to lie in the supine position. Fulcrum
of the goniometer was placed over the
lateral malleolus. Immovable arm was
placed parallel to the fibula. Movable arm
was placed parallel to the lateral border of
the foot. Subjects were asked to actively
dorsiflex the foot from neutral ankle
position (i.e. 90 degrees angle between foot
and leg). The range, through which foot
moved, was noted.
(B). Isometric strength measurement: The
MIVCF was measured using electronic
strain gauge device (Gold tech-model
GTH, ENF Act 1985). It is a reliable and
valid tool to measure muscle strength
(Kennedy, 1965; Tiainen et al., 2004;
Vivodtzev et al., 2006).
1. For Hamstring muscle: Subjects were
made to sit on quadriceps table with arms
resting on thighs. Thighs were tied to
quadriceps table with the help of a strap.
Hip joint was kept at 90 degrees of flexion
and knee joint at 60 degrees
of flexion.
Strain gauge was attached to subject‘s leg.
Then he was asked to flex the knee with
maximum effort and hold it for 5 seconds
(Fig 1).
2. For Calf muscle: Subjects were made to
lie supine on a metallic couch. One roll of
bed sheet was kept below the knee to put it
in 20 degrees of flexion. Strain gauge was
attached to subject‘s foot. Ankle was kept
at neutral position, having 90
degrees
angle between foot and leg.
Figure 1: Measurement of isometric contraction of
Hamstring muscle
Subjects were asked to plantar flex
the foot with maximum effort and hold it
for 5 seconds (Fig 2).
Figure 2: Measurement of isometric contraction of
Calf muscle
Figure 3: Subject doing self stretching of hamstring
muscl
Same procedure was used to measure post
intervention assessment for isometric
strength. Assessment was done
immediately after the stretching.
Intervention

Journal of Exercise Science and Physiotherapy, Vol. 9, No. 1: 51-56, 2013
54
(A). For Hamstring stretching: Subjects
were asked to stand facing the wall or
quadriceps table, depending on their
height. They were asked to do anterior
pelvic tilt and then place the heel of the leg
to be stretched on the table, and further
instructed to keep their hands on their hips,
hold their head in a neutral position, look
forward, keep the stretched leg fully
extended, extend their cervical and
thoracic spine and retract their scapulae
while maintaining an anterior pelvic tilt.
Then they were asked to move their trunks
forward at the pelvis until they perceived a
hamstring stretching sensation without
pain (Fig 3).
(B). For calf stretching: Subjects were
made to stand in walk standing position
with right lower limb behind the left. Knee
of the right lower limb was kept extended;
subjects leaned forward over a couch, with
foot completely in contact with the ground.
They were asked to lean forward till they
felt the stretch in calf region but not pain
(Fig 4).
Figure 4: Subject doing self stretching of calf muscle
(Runners’ stretch)
Protocol of stretching: The subject
was asked to stretch the muscle till subject
felt the stretch but not pain. This position
was instructed to be maintained for 30
seconds and then release it for 20 seconds
for a total of 2 minute of time under
stretch (Safran, 1989).
Data Analysis
Statistical analysis was done using
SPSS 15.0 Software (SPSS Inc., Chicago,
USA). ―Paired t-test‖ was used to find
difference in strength before and after
stretching in each group. For between
group analyses an independent t-test was
used. A statically significant difference
was defined as p< 0.05.
Results & Discussion
There was a significant difference (p<
0.05) in the means of Pre stretching
MIVCF values between Group A and
Group B. On the other hand, there was no
significant difference (p> 0.05) observed
in the changes in MIVCF after 2 minute of
stretching in Group A and Group B.
However, 2 minute stretching of
Hamstrings demonstrated an increase
(insignificant) in MIVCF by 1.31%, and in
calf muscle and MIVCF was found to
increase (insignificant) by 2.92%. Between
the groups analysis revealed insignificant
difference (p > 0.05) in the changes in
MIVCF after 2 minute of stretching in
between Group A and Group B (Table 1). Table 1: Comparison of mean changes of
Maximum Isometric Voluntary Contraction Force
(MIVCF) after 2 minute of stretching between group A
and group B
GROUP
A
GROUP
B
t-test
t p
Mean changes
in MIVCF
(Kg.)
0.15 0.95 0.2
8
0.47
8
This study was designed to
investigate the effect of stretching on
reduction of muscle strength and the
comparison of a proximal muscle and
distal muscles regarding strength loss after
stretching. The hypothesis stated that the
self-stretching would result in transient

Comparative Dose-Response Study of Stretching On Strength of Proximal (Hamstring) and Distal (Calf) Muscle -Khan
et al
55
acute reduction in muscle strength and
stretch induced strength loss would be
greater for proximal muscle (Hamstring
muscle) as compared to distal muscle
(Calf muscles). Results of the present
study found that shorter stretching (2-
minute) of hamstring muscle does not have
any statistically significant effect on
MIVCF although it was found to increase
clinically. Therefore, if an athlete stretches
his hamstrings prior to sporting event for
short duration (2-minute), it will not
deteriorate his performance rather it could
be beneficial. Shorter stretching (2-minute)
of calf muscle resulted in statistically
significant increase in MIVCF (11%);
therefore shorter stretching (2-minute) of
calf muscle could be beneficial prior to
sporting event. By comparing the two
results it is concluded that calf muscle
seems to be relatively more responsive to
stretching than the hamstrings.
In present study stretching of
hamstring muscle resulted in increase in
MIVCF, which is contrary to most of the
previous studies, which have shown acute
reductions in muscle strength, but their
stretching durations were different from
our study (Worrell et al., 1994; Fowles et
al., 2000; Herda et al., 2009;). Studies
by Fowles et al. (2000), Herda et al.
(2009) and Worell et al. (1994)
demonstrated significant decreases in
strength after 30, 20, 10 minutes of
stretching, respectively. Thirty minutes
stretching protocol of Fowles et al. (2000)
caused greatest decrease in strength (28%
decrease), followed by 20-min protocol of
Herda et al. (2000) that resulted in 10%
decrease and a 10 min protocol of Worell
et al. (1994) resulted in 7% decrease.
However, Reyan et al. (2008) found no
changes in voluntary activation (VA) in
the plantar flexors when examining the
acute effects of only 10-min of stretching,
but longer durations of stretching have
elicited decreases in VA in the plantar
flexors and leg extensors. The findings of
the present study are consistent with the
findings of Reyan et al (2008) and
suggest that shorter durations of
stretching do not diminish muscle
activation in plantar flexors. No study has
compared the acute effects of stretching
on proximal and distal muscles.
Proximal/larger muscles are sub optimally
activated whereas the distal/smaller
groups of muscles are fully activated
(Kent-Braun and Le Blanc, 1996). Motor
unit number is different for proximal and
distal muscles. This may be the reason of
geting different response from proximal
and distal muscles.
Future scope of research
1. EMG could be used in the same study
to evaluate action potentials so as to find
out the reasons for increase in the strength
with 2-min stretching.
2. Since response of stretching may vary
with different joint angles and muscle
lengths, therefore further studies are
needed to compare proximal and distal
muscle at different joint angles.
3. More studies are needed to examine
athletes under controlled conditions and
with sophisticated equipment like
dynamometer.
4. Further studies can be done in which
the subjects can be recruited with precise
amount of muscle tightness, same body
stature, and body weight etc.
Conclusion: Shorter stretching (2 minute)
increases maximum isometric voluntary
contraction force in both muscles but more

Journal of Exercise Science and Physiotherapy, Vol. 9, No. 1: 51-56, 2013
56
in the calf. This stretching has beneficial
effects on muscle performance.
Acknowledgement: Authors acknowledge
that there is no conflict of interest of any
authors and no funding was provided by
any agency for this study.
References Behm,, D.G., Button, D.C. and Butt, J.C. 2001.
Factors affecting force loss with prolonged
stretching. Can. J. Appl. Physiol., 26(3):
261-72.
Bixler, B. and Jonese, R.L. 1992. High-school
football injuries: effects of a post-half-time
warm-up and stretching routine. Fam. Pract.
Res. J, 12: 131-139.
Fowles, J.R., Sale, D.G. and MacDougall, J.D.
2000. Reduced strength after passive stretch
of the human plantar flexors. J. Appl. Physiol,
89(3): 1179-88.
Herda, T.J., Ryan, E.D., Smith, A.E, Walter, A.A.,
Bemben, M.G., Stout, J.R., et al. 2009. Acute
effects of passive stretching versus vibration
on the neuromuscular function of the plantar
flexors. Scand. J. Med. Sci. Sports, 19(5):
703-13.
Kennedy, W.R. 1965. The development and
comparison of an electrical strain gauge
dynamometer and a cable tensiometer for
objective muscle testing. Arch. Phys. Med.
Rehabil., 12: 793-803.
Kent-Braun, J.A. and Le Blanc, R. 1996.
Quantification of central activation failure
during maximal voluntary contractions in
humans. Muscle Nerve, 19(7): 861-9.
Knudson, D, Bennett, K., Corn, R., Leick, D. and
Smith, C. 2001. Acute effects of stretching
are not evident in the kinematics of the
vertical jump. J. Strength Cond. Res., 15: 98-
101.
McHugh, M.P. and Nesse, M. 2007. Effect of
stretching on strength loss and pain after
eccentric exercise. Medicine & Science in
Sports & Exercise, 40(3): 566-573.
Ryan, E.D., Beck, T.W., Herda, T.J., Hull, H.R.,
Hartman, M.J., Stout, J.R. and Cramer, J.T.
2008. Do practical durations of stretching
alter muscle strength? A dose-response study.
Medicine & Science in Sports & Exercise,
40(8): 1529-1537.
Safran, M.R., Seaber, A.V. and Garrett, W.E. Jr.
1989. Warm-up and muscular injury
prevention: an update. Sports Med, 8: 239-
249.
Shellock, F.G. and Prentice, W.E. 1985. Warming-
up and stretching for improved physical
performance and prevention of sports-related
injuries. Sports Med., 2: 267-278.
Shrier, I. 2004. Does stretching improve
performance? A systematic and critical review
of literature. Clin, J, Sport Med, 14: 267-273.
Smith, C.A. 1994. The warm-up procedure: to
stretch or not to stretch. A brief review. J.
Orthop. Sports Phys. Ther, 19: 12-17.
Sullivan, M., Dejulia, J.J. and Worrell, T.W.
1992. Effect of pelvic position and stretching
method on hamstring muscle flexibility. Med.
Sci. Sports Exerc, 24: 1383-1389.
Thacker, S.B., Gilchrist, J., Stroup, D.F. and
Kimsey, C.D. Jr. 2004. The impact of
stretching on sports injury risk: a systematic
review of the literature. Med. Sci. Sports
Exerc, 6(3): 371-378.
Tiainen, K., Sipila, S.., Alen, M., and Heikkinen,
E. 2004. Heritability of maximal isometric
muscle strength in older female twins. J.
Appl. Physiol., 96: 173–180.
Vivodtzev, I., Pépin, J.L., Vottero, G., Mayer, V.,
Porsin, B., Lévy, P., 2006. Improvement in
Quadriceps strength and dyspnea in daily task
after 1 month of electrical stimulation in
severely deconditioned and malnourished
COPD. Chest, 129(6): 1540-8.
Worrell, T.W., Smith, T.L., and Winegardner, J.
1994. Effect of Hamstring Stretching on
Hamstring Muscle performance. J. Orthop.
Sports Phys. Therp., 20(3): 154-9.
Worrell, T.W., Sullivan, M.K., and Dejulia, J.J.
1992. Reliabilty of an active knee extension
test for determining hamstring muscle
flexibility. J. Sport Rehabil., 1:181-187.
Young, W. and Elliott, S. 2001. Acute effects of
static stretching, proprioceptive
neuromuscular fascilitation stretching, and
maximum voluntary contractions on explosive
force production and jumping performance.
Res. Q. Exerc. Sport, 72: 273-279.

Effeciveness of Integrated Soft Tissue Mobilization on the Functional Outcome in Chronic Low Back Pain Patients-
Antony Leo Aseer & Iyer, Lakshami Subramanian
57
Effectiveness of Integrated Soft Tissue Mobilization on the
Functional Outcome in Chronic Low Back Pain Patients
Antony Leo Aseer. P
1, Iyer Lakshmi, Subramanian
2
1Reader in Physiotherapy, Sri Ramachandra University, Chennai, Tamilnadu 2Faculty of Physiotherapy-Sri Ramachandra University, Chennai, Tamilnadu
Introduction
The commonest symptom in
musculoskeletal pathologies is low back
pain and is considered as a most common
health disorder in modern society. The
causes include a wide variety of
pathologies of lumbar spine and
surrounding structures. Research by
Anderson suggests that 70 to 85 % of the
population will come across low back pain
at least once in their lives. Almost 90% of
the acute low back pain show better
improvements regardless of the therapy;
remaining 10% are prone to develop
chronic low back pain. Overall 90% of
social costs are accounted for low back
disorders (Anderson, 1996). This is one of
the causes for long term absenteeism from
work (Hazard, 1996) increased loss of
work, sickness compensation, long term
disability for long periods, need for social
support and a functional restoration
programs.
Depending on the duration of
symptoms, low back pain can be classified
as acute, sub-acute or chronic. According
to European guidelines, chronic low back
pain is defined as low back pain and
discomfort, located below the costal
margin and above the inferior gluteal
folds, with or without radiating leg pain,
persisting for a minimum of 12 weeks
(Airaksinen, 2004). The 2nd
most known
Abstract
The experimental study is aimed to analyze the effectiveness of integrated soft tissue
mobilization on the pain, lumbar spine mobility and the outcome on functions in chronic low
back pain (CLBP). Irrespective of low back pathologies, soft tissues are vulnerable for
dysfunction and paves way for pain-spasm vicious cycle. Very few studies in CLBP are being
performed to explore its effect and integrated approaches in soft tissue mobilization were not
studied. Totally sixty participants were randomized into control and experimental groups in the
present study. Baseline measurements of pain severity, lumbar spine mobility and Oswestry
disability Index (ODI) were measured. The control group received treatment in the form of
strengthening program and stretching maneuvers. The experimental group received the all form
of soft tissue mobilization. After three weeks of follow up, all the measurements were taken
again. The experimental group showed significant improvement as compared to the control
group in terms of lumbar spine mobility, reduction of disability and moderate improvement in
pain severity. This study adds the importance of integrated soft tissue mobilization in recovery
from CLBP. It further establishes soft tissue mobilization as a part of functional mobilization in
rehabilitating CLBP.
Keywords: chronic low back pain, soft tissue mobilization, lumbar spine mobility, ODI

Journal of Exercise Science and Physiotherapy, Vol. 9, No. 1: 57-68, 2013
58
reason to visit the physician is noted to be
chronic low back pain (Hart, 1995 &
Swedlow, 1992). In India, approximately
35% people suffer from chronic back pain
(Andersson, 1999).
The lumbosacral region consists
of 5 lumbar vertebrae and 5 sacral
vertebrae fused together. These structures
are an important weight bearing
components supporting the trunk and
upper body in postures of sitting, standing.
The lumbar region is structured is such a
way so as to provide maximum mobility of
the spine. In order to protect the structures
around this region, many ligaments and
muscles surround it. The important
structures in stabilizing the lumbosacral
region include the erector spinae group,
mutlifidus, abdominals, thoracolumbar
fascia, iliopsoas and gluteus medius. The
thoracolumbar fascia is an important
passive structure which runs along the
length of the back and provides stability
during contraction of various groups of
muscles at the back.
The four primary soft tissues of the
body are epithelial, muscular, nervous and
connective tissue. All these soft tissue
structures have individual and unique
functions which, when integrated work as
a dynamic biomechanical unit (Keller,
1999). Grieve (1981) has emphasized that
these structures are functionally
interdependent upon each other. Grieve
also states that most abnormalities
presenting as joint pain may be the
expression of an underlying imbalance of
the whole musculoskeletal system, i.e.,
articulation, ligaments, muscles, fascial
planes and inter muscular septa, tendons
and aponeurosis.
For chronic low back pain a model
proposed by Helene Langevin et al in
2006 is pathophysiological model, which
suggests a multivariate causes and
pathological process is complex in chronic
low back pain.
The several models of
abnormal movement patterns include that
of pain – spasm –pain model by Roland
(1986) and pain adaptation model
describing selective increased activity of
antagonist muscle causing decreased range
of motion by Lund (1991). The pain
spasm pain cycle is a protective
mechanism of the body to injury (Scott,
2004). Due to injury the nociceptors
around the injured area get stimulated and
send signals to the brain via the spinal
cord where pain is perceived. Thus the
brain sends signals to the surrounding
muscles to contract in order to protect the
area. This constant muscle contraction
causes a decrease in circulation causing
hypoxia due to the lack of blood
circulation and oxygen and tissue damage.
This leads to muscle spasm which further
increases pain. This study suggests that
abnormal movement patterns-
hypomobility or hypermobility leads to
fibrosis of connective tissue directly or
indirectly via injury and inflammation
respectively. The pathological changes in a
muscle, during the initial phases of
immobilization is shortening of muscle and
associated connective tissue leading to true
shortening of the muscle fibers. Hence,
they propose that due to the limited
activity in chronic low back pain,
connective tissue fibrosis leads to altered
muscle activation patterns, muscle spasm,
neutrally mediated inflammation and micro
trauma. The altered mechanical loads lead
to the connective tissue plasticity causing

Effeciveness of Integrated Soft Tissue Mobilization on the Functional Outcome in Chronic Low Back Pain Patients-
Antony Leo Aseer & Iyer, Lakshami Subramanian
59
fibrosis in connective tissues like ligaments
and joint capsules.
Mostly chronic low back pain without
specific pathological changes suffer from
musculoskeletal dysfunction and treating
these disturbances causes decrease in pain
in many (Rosomoff, 1989). With the above
beliefs one can conclude that whatever
may be the reason of chronic low back
pain, the ultimate brunt bearer are the soft
tissue structures which need to be
addressed during the due course of
treatment.
With the advent of physiotherapy,
many tried to find out the effects of
conventional therapy as against surgical
treatment to treat chronic low back pain.
The studies finding the efficacy of
modalities in chronic low back pain,
include transcutaneous electrical nerve
stimulation (TENS) (Lucie, 1991 &
Marchand, 2003), interferential therapy
(Werners, 1999), laser (Bjordal, 2003)
and short wave diathermy (Sweetman,
1993). Many of those disabled with
chronic low back pain do seek for
treatment. Although many treatment
modalities do promise relief of pain, not
much evidence is present as to its true
potential in relieving and curing the
disability. With the question of
immobilization during rehabilitation; many
concluded the beneficial use of exercises
(Hagen, 2000, Kuukkanen, 2000,
Mannion, 2001, Moseley, 2002, Peterson,
2002, Aure, 2003, Liddle, 2004, Jousset,
2004, Niemisto, 2003 &). Interest then
emerged in the role of manual therapy,
mobilization and massage (Furlan, 2002,
Hemmila, 2002, Aure, 2003, Cherkin,
2003, Chiradejnant, 2003, Harvey, 2003,
Licciardone, 2003, Walach, 2003,
Assendelft, 2004, Jette, 2006).
Manual medicine or therapy infers
to hands on treatment which includes
gentle stretching of joint or mobilization to
improve spinal joint mobility (Greenman,
1996). The effects of massage in non-
specific low-back pain was studied by
Furlan et al (2010), who concluded that
massage might be useful in sub-acute and
non-specific chronic low-back pain
patients. The primary purpose of these
approaches is to treat symptomatic soft
tissues. Soft tissue mobilization offers a
functional approach, ultimately improving
the patients‘ capacity to maintain balanced
posture and improving body mechanics.
The integrated approach encompassing
evaluation of soft tissues system and
application of specifically directed manual
therapy techniques to facilitate
normalization of soft tissue dysfunction is
called functional mobilization (Pustaver,
1995). Soft tissue techniques causing
mechanical stretching of the soft tissues,
leading to connective tissue remodeling,
encouraging circulation, enhancing venous
and lymphatic return, also showing
neurologic effects of release of endogenous
opioids thus relieving musculoskeletal
pain. To intervene specific musculoskeletal
dysfunctions, manual treatments along
with tailored exercises are in need
(Bookhout, 1996).
An experimental study conducted
by Geisser et al in 2005, aimed at
examining the efficacy of manual therapy
with specific exercise program for treating
CLBP and disability. The tailored exercise
program was compared with nonspecific
program comprising stretching of soft
tissues, aerobic fitness and manual

Journal of Exercise Science and Physiotherapy, Vol. 9, No. 1: 57-68, 2013
60
therapy. Manual therapy with specific
exercise reported better results and further
studies are needed to examine the effects
on improved function.
Evidences suggest that manual
therapy and specific exercises showed
positive impact in pain and disability. But
no such evidence has specified the effects
of manual therapy alone. Also several
studies have analyzed few soft tissue
structures but lack an integrated approach
considering the skin, fascia, muscle,
connective tissue, and neuromuscular
component.
With the above views, emphasizing
the need for further research, this study
aims at analyzing the effectiveness of
integrated soft tissue mobilization on the
pain, mobility and functional outcome in
chronic low back pain patients.
Materials and Methods
The experimental study was approved
by the ethics committee of Sri
Ramachandra University.
Study participants: Patients coming
to the outpatient physiotherapy department
of Sri Ramachandra Hospital were
included. Chronic low back pain patients
referred for physiotherapy by the
orthopedic department were considered.
Patients diagnosed as having low back
ache for more than 3 months of duration
with age group between 18 to 45 years
were recruited. Subjects with previous
spinal surgeries, neurological disorders,
congenital spinal conditions and
Spondyloarthropathies were excluded.
Study design & Size: Randomized control
trial and using a two sample comparison
of means needed sample size of 70
subjects. To account for possible loss, 60
subjects were recruited. Simple
randomization method was used to allocate
the subjects into two groups, namely the
control group and the experimental group.
Outcome measures - The baseline
measures includes, visual analogue scale
(VAS) - Self-report of rating scale of pain
intensity of their average or usual pain.
VAS has good reliability and concurrent
validity when compared to other methods
(Donald, 2003). Modified Schober‘s test
(MST) was used to measure lumbar spine
mobility of flexion and extension measures
in pre and post treatment period as a
measure of functional mobility. (Macrae,
1969, Domjan, 1990).
The revised Oswestry Disability
Index (ODI) by Davidson et al (2002) was
used as a functional outcome measure.
This is a self-report questionnaire; the
patient is instructed to fill it out. The
patient follows the general instructions
given at the top of the questionnaire. Each
section had 6 possible answers. Statement
1 was graded as 0 point; statement 6 was
graded as 5 points. A score of 50 was
considered to indicate 100% disability.
The disability scores between 0%-20%
denoted minimal disability, 20%-40%
denoted moderate disability, 40%-60%
indicate severe disability, 60%-80%
denotes crippled and 80%-100% denotes
bedriden status.
A total of 77 subjects enrolled for the
study. Of these, 7 subjects refused to
participate, 10 subjects were not regular
until follow up. After recruitment on
eligibility, informed consent was obtained
on explaining the treatment to be given.
All subjects were given self-report
measures and outcome measures. Subjects
in the control group received exercises
which included core strengthening of the

Effeciveness of Integrated Soft Tissue Mobilization on the Functional Outcome in Chronic Low Back Pain Patients-
Antony Leo Aseer & Iyer, Lakshami Subramanian
61
lumbo-pelvic complex (Sahrman, 2002 &
Bookhout, 1997) includes abdominal
progression; hip extensor in prone, hip
abductor and external rotator training in
side lying, multifidus strengthening and
stretching exercises. The stretches
included quadriceps, lumbar extensors,
hamstring and prone lying on elbows.
The experimental group received an
integrated Soft tissue mobilization
including muscle energy technique, trigger
point release, myofascial release,
thoracolumbar lateral, longitudinal stretch,
deep longitudinal inhibitory pressure.
Trigger points were released by applying
deep pressure with the thumb/ olecranon
process at the tender points along the
piriformis and gluteus medius muscles and
pressure was gradually released as pain
reduced. Post isometric relaxation was
taught by asking the patient to contract the
back extensor muscles isometrically in
supine position and then relaxing it.
Mechanical stretching was done by
thoracolumbar lateral, longitudinal stretch
given to the patient in prone position.
Thoracolumbar deep pressure with thumbs
or thumb reinforced by hand given over
the involved muscle. Each patient in the
experimental group was treated with soft
tissue mobilization three times in a week.
Both the groups were given a pain relief
modality given to the patients as a usual
treatment approach in the outpatient
department. Exercises were continued as a
home program and reviewed regularly.
After three weeks, follow up of the self-
report measures and outcomes were
administered.
The data collection started at baseline
comprising of the patient profile, pain
severity using VAS, functional mobility of
the patient using MST and ODI
questionnaire. Post intervention values
were got after three weeks of intervention.
The process of data analysis consisted of
baseline comparison between the control
and the experimental groups, post
treatment assessments between the groups,
pre and post treatment comparison of
various variables in the control and the
experimental group.
Results & Discussion
The effectiveness of integrated Soft
tissue mobilization on pain, functional
mobility and functional outcome was
analyzed using inferential statistics (two-
tailed test). The data analysis was done
using SPSS and statistical significance
level was set. In the study, sixty
participants participated of which 19 were
males and 41 were females. All the 60
subjects were followed up till the end of
the study (each group n=30). All the
participants were regular for follow up and
there is no missing data. In the control
group 11 participants were male and 19
participants were females with a mean age
of 35.57 yrs. In the experimental group 8
males and 22 females participated with the
mean age of 36.03 yrs (Table 1). Overall
31.7% of males and 68.3% of females
participated in the study.
Table-1 Patient demographics
GROUP N Mean SD SEM
AGE
Control 30 35.57 7.718 1.409
Experimental 30 36.03 7.779 1.420

Journal of Exercise Science and Physiotherapy, Vol. 9, No. 1: 57-68, 2013
62
Table- 2 Gender distribution between groups
GROUP
Total Contrl Expmntl
Gender Male N 11 8 19
% 36.7 26.7 31.7
Female N 19 22 41
% 63.3 73.3 68.3
Total N 30 30 60
% 100.0 100.0 100.0
Table- 3a - Pre (VAS_1) and Post (VAS_2) Comparison
of VAS in the control group
Mean N SD Mean
Diff. T p
VAS_1 6.67 30 1.446
2.10 ±
1.54 7.47 .000
VAS_2 4.57 30 1.547
Table 3b: Pre (VAS_1) and Post (VAS_2) Comparison
of VAS in Experimental Group
Mean N SD Mean
Diff. T p
VAS_1 6.77 30 1.501
1.63 ±
1.37
6.5
0
.00
0
VAS_2 5.13 30 1.548
The mean value for pain severity
(VAS) for the control group was 6.67 and
after intervention the mean value of VAS
was 4.57. The pain severity noted to be
declined with a difference of 2.10. The
mean value for pain severity (VAS) for the
experimental group was 6.77 and after
intervention the mean value of VAS was
5.13.The pain severity was observed to
decline significantly with a mean reduction
of 1.6 (p=0.000). Compared to the
experimental group, control group showed
greater improvement in pain severity as
evidenced by mean reductions in VAS
scores. Table-4 (a) Lumbar flexion range in the control group
Mean N SD SEM
MS_FLEXION_1 4.87 30 1.306 .238
MS_FLEXION_2 6.00 30 1.313 .240
The functional mobility tested by
MST in the control group showed a mean
flexion of 4.87 pretest and 6 in post-test
showing a significant increase (p=0.000). Table-4 (b) Lumbar flexion range in Experimental
group
Mean N SD SEM
MS_FLEXION_1 5.67 30 1.155 0.211
MS_FLEXION_2 6.37 30 1.377 0.251
The experimental group showed a
mean of 5.67 before and 6.37 after
intervention in the range of flexion with a
significant difference.(p=0.000).Overall
the lumbar flexion range has improved in
experimental group than control group. Table-5 (a) Lumbar extension range in Control group
Mean N SD Mean Diff. T p
MS_EXTENSION_1 3.77 30 .935 -.533±1.106 -2.64
.01
3
MS_EXTENSION_2 4.30 30 .988
The ranges for extension showed a
mean extension of 3.77 before and 4.30
after intervention in control group
(p=0.013). Table-5 (b) Lumbar extension range in Experimental
group
Mean N SD Mean Diff. T p
MS_EXTENSION_1 3.10 30 1.125
-
.333±0.479
-
3.81 .001
MS_EXTENSION_2 3.43 30 1.194
In the experimental group the mean
extension before intervention was observed
to be 3.10 and after intervention 3.43 with
a significant mean difference of
0.333±.479 (P<0.001). On comparing the
experimental group, control group was
found to show minimal improvement in the
lumbar extension range.
Table-6 (a) Oswestry Disability Index (ODI) in the
control group
Mean N SD Mean diff. T P
ODI_1 20.93 30 6.378 7.323 .000
ODI_2 14.50 30 6.061 6.433±4.812

Effeciveness of Integrated Soft Tissue Mobilization on the Functional Outcome in Chronic Low Back Pain Patients-
Antony Leo Aseer & Iyer, Lakshami Subramanian
63
The measures of ODI showed a mean
value of 20.93 before intervention and
14.50 after the follow up, with mean
difference of 6.433±4.812 (p=0.000). Table-6 (b) Oswestry Disability Index in the
Experimental group
Mean N SD
Mean
difference T P
ODI_
1 23.90 30 7.635 8.167±5.931 7.542 .000
ODI_
2 15.73 30 7.230
The experimental group showed a
mean ODI value of 23.90 before the
intervention and 15.73 after the
intervention with a mean difference of
8.167± 5.931 (p=0.000). Overall, the
functional outcome of ODI values shows
reduction in the disability index in the
experimental group than the control group.
Table- 7 (a) Measures of disability in control group
Mean N SD Mean
difference T P
D_1 41.87 30 12.757 12.867±9.623
7.323 0.000
D_2 29.00 30 12.123
The measure of disability calculated
with the help of ODI shows a mean value
of 41.87 pre-test and 29 post-test in the
control group. The mean difference is
12.867±9.623 (p=0.000). Table-7 (b) Measures of disability in experimental
group
Mean N SD
Mean
difference T P
D_1 47.80 30 15.271 .000
D_2 31.00 30 14.797 16.800±12.280 7.494
In the experimental group the mean
value of disability is 47.80 before and
31.00 after the intervention with mean
decrease of 16.800±12.280 (p=0.000).
The disability measures in the
experimental group are lower, when
compared to control group. Table-8 (a): Disability grade (pre test) in the control and the
experimental group
GROUP
Total Contrl Exptal
Dis_Grd_1
Minimal
N 1 2 3
%
within
GROUP
3.3% 6.7% 5.0%
Moderate
N 13 5 18
%
within
GROUP
43.3% 16.7% 30.0%
Severe
N 14 15 29
%
within
GROUP
46.7% 50.0% 48.3%
Crippled
N 2 8 10
%
within
GROUP
6.7% 26.7% 16.7%
Total
N 30 30 60
%
within
GROUP
100.0
% 100.0%
100.0
%
The disability grade distributions in
both groups are two participants in the
control group are in crippled category and
8 participants in the experimental group.
One in the control group and two subjects
in the experimental group are in minimal
disability category while in the moderate
disability category 13 in the control group
and 5 in the experimental group. Similarly
in severe disability category 14 subjects in
the control group and 15 in the
experimental group were observed. No
subjects were reported in the bedridden
category.
Table-8 (b) Disability grading (post test) in control and
experimental group
GROUP
Total Contrl Exptal
Dis_Grd_2 Minimal N 7 8 15

Journal of Exercise Science and Physiotherapy, Vol. 9, No. 1: 57-68, 2013
64
%
within
GROUP
23.3% 26.7% 25.0%
Moderate
N 18 15 33
%
within
GROUP
60.0% 50.0% 55.0%
Severe
N 5 5 10
%
within
GROUP
16.7% 16.7% 16.7%
Crippled
N 0 2 2
%
within
GROUP
.0% 6.7% 3.3%
Total
N 30 30 60
%
within
GROUP
100.0% 100.0% 100.0
%
The disability grade distributions in
both groups are as follows. Two
participants in the control group are in
crippled category as compared to 8
participants in the experimental group.
One in the control group and two in the
experimental group are observed in
minimal disability category. In the
moderate disability category 12 subjects
were observed in the control group and 5
in the experimental group while in the
severe disability category 14 in the control
group and 29 in the experimental group.
No subjects were observed to belong in the
bedridden category.
The experimental study analyzed
the effectiveness of integrated Soft tissue
mobilization on the functional outcome of
chronic low back pain patients, noted to
have decrease in pain score (VAS) in both
the control and the experimental groups.
Many studies have shown the effects of
exercises in pain decrement and functional
improvement in chronic low back pain as
against treatment received by a general
practitioner. Though conflicts do exist
with this thought; the European guidelines
suggest that exercises along with usual
physiotherapeutic methods are efficient in
the rehabilitation of chronic low back pain.
The study results also support a reduction
in pain and improved spinal mobility.
There was reduction of pain and improved
functional mobility in the experimental
group that is, those who received soft
tissue mobilization. Gert Bronfort et al in
2003 suggested mobilization can be an
option for the treatment of both low back
pains after a systemic review conducted
among ten randomized control trials. The
guidelines further suggest that there is
limited evidence of combined therapy of
massage with remedial exercises and
education for pain relief and functional
improvements. Even though the results
show a mean of 2.10 ± 1.54 in pain, -
1.133 ± .819 in flexion and -0.533±1.106
in the extension ranges in the control
group; mean of 1.63 ± 1.37 in pain and -
.700±1.055 in flexion and -0.333±.479 in
extension ranges in the experimental
group. There was a significant difference
in the results of pain and functional
mobility within the experimental group.
This agrees with similar finding reported
in previous studies done by Gert Bronfort
et al (2003) that concluded little evidence
that back exercise is superior to
mobilization. The functional performance
of the patients checked by Oswestry
Disability Index showed a mean difference
of 6.433±4.812 in the control group and
8.167±5.931 in the experimental group.
Gronbald et al (1997) tried to find out the
interrelationship between spinal
movements, performance tests, pain
severity and disability evaluation. They
concluded that there is moderately

Effeciveness of Integrated Soft Tissue Mobilization on the Functional Outcome in Chronic Low Back Pain Patients-
Antony Leo Aseer & Iyer, Lakshami Subramanian
65
significant (p < 0.01) inverse correlation
between disability evaluation and in all
performance tests in women population.
This could be a cause for not having a
similar correlation with functional
outcomes of modified Schobers Test and
that of Oswestry Disability Index.
The oswestry disability index
includes basic functional assessment of
movements. The process involved
comparing the original performance of
various tasks with noted restriction on
corresponding subsections.
A factor-analytic study was also
undertaken by Fisher & Johnston (1997)
determined two specific factors of
disability and changes in the disability
were reliably measured by the Oswestry
Disability Questuinnaire.
Francisco el al (2004) conducted
a correlational study and concluded
clinically significant decrement in pain
leading to almost recognizable changes in
disability and quality of life. Similarly in
the present study, % of disability with
ODI, there was a drastic change in
disability progressing from crippled to
severe- moderate- minimal disability in
both control and experimental groups. The
number of subjects in the crippled
category reduced from 2 to 0 in the control
group and from 8 to 2 in the experimental
group after intervention. In the severe
category the number of subjects decreased
from 14 to 5 in the control group and from
15 to 5 in the experimental group. The
number of subjects increased in both
minimal and moderate category after
intervention in both the control and
experimental groups. The progression
towards lesser disability was seen more in
the experimental group. Hence, the
integrated soft tissue mobilization showed
better functional outcome in chronic low
back pain subjects.
Soft tissue techniques although
used in practice by therapists, this
integrated approach encompassed
techniques addressing all soft tissue
structures involved in the pathophysiology
of back pain. Soft tissue mobilization
addresses a more efficient biomechanical
function because of release of fascial
tension (Ganong, 1978). It also provides
local and general vascular changes in the
vascular and lymphatic circulation.
Another model proposes that soft tissue
techniques lead to connective tissue
remodeling, encouraging circulation,
enhancing venous and lymphatic return,
also showing neurologic effects of release
of endogenous opioids thus relieving
musculoskeletal pain. These physiological
models suggest the importance of
implementing soft tissue techniques in
rehabilitating chronic low back pain. Even
though the intervention is for shorter
duration, the functional outcome in the
interventional group showed better
improvements. The functional outcomes
are the overall indicators and it is
considered to be an ultimate outcome in
any rehabilitation.
Hence, considering the above
physiological factors, importance of
manual techniques, the results of the study
seems to be justified. Soft tissue
mobilization to the low back region can
thus help in providing pain relief, mobility
and functional improvement. The
limitations include a relatively smaller
sample size in order to make the results
more valid and long term effects need to be
monitored. As not much has been studied

Journal of Exercise Science and Physiotherapy, Vol. 9, No. 1: 57-68, 2013
66
related to the integrated soft tissue
mobilization techniques towards outcomes
of pain, mobility within a larger
population of low back pain, there is much
scope in future to establish this through
research. Integrated soft tissue
mobilization forms an integral component
in rehabilitation of chronic low back pain
with optimal duration of training.
Conclusion: The experimental study on
the effects of integrated soft tissue
mobilization in chronic low back pain
subjects revealed a decrement in pain,
lumbar mobility and the overall functional
outcome in both the groups. In specific,
integrated soft tissue mobilization group
showed a moderate improvement in the
functional outcome than the control group.
The integrated soft tissue mobilization
plays an integral component in the
intervening chronic low back pain.
References Airaksinen, J.I., Brox, C., Cedraschi, J.,
Hildebrandt, J., Klaber-Moffett, F. Kovacs,
A.F., Mannion, S. Reis, J.B. Staal, H. Ursin,
G., Zanoli. 2006. European guidelines for
the management of chronic non-specific low
back pain; Low back pain: guidelines for its
management. Europ. Spine Journal; suppl
2:S 192-300.
Andersson, G.B.J. 1999. Epidemiological features
of chronic low-back pain. Lancet, 354: 581–
85.
Assendelft, W.J., Morton, S.C., Yu, E.I., Suttorp,
M.J., Shekelle, P.G. 2003. Spinal
manipulative therapy for low back pain. A
meta-analysis of effectiveness relative to
other therapies. Ann. Intern. Med., 138(11):
871-81.
Assendelft, W.J., Morton, S.C., Yu, E.I., Suttorp,
M.J., Shekelle, P.G. 2004. Spinal
manipulative therapy for low-back pain
(Cochrane Review). In: The Cochrane
Library, Issue 3. John Wiley & Sons,
Chichester, UK.
Aure, O.F., Nilsen, J.H., Vasseljen, O. 2003.
Manual therapy and exercise therapy in
patients with chronic low back pain: a
randomized controlled trial with 1-year
followup. Spine, 28(6): 525-31.
Bjordal, J.M., Couppe, C., Chow, R.T., Tuner, J.,
Ljunggren, E.A. 2003. A systematic review
of low level laser therapy with location-
specific doses for pain from chronic joint
disorders. Aust. J. Physiother., 49(2): 107-
16.
Bookhout, M.R. 1996. Exercise and somatic
dysfunction. Phys. Med. Rehabil. Clinics of
North America. 7: 845–62.
Bookhout, M.R. 1997. Exercise as an adjunct to
manual medicine. Handout and lecture
presented in Ann. Arbor., MI.
Cherkin, D.C., Eisenberg, D., Sherman, K.J.,
Barlow, W., Kaptchuk, T.J., Street, J., Deyo,
R.A. 2001. Randomized trial comparing
traditional Chinese medical acupuncture,
therapeutic massage, and self-care education
for chronic low back pain. Arch. Intern.
Med, 161(8): 1081-8.
Cherkin, D.C., Sherman, K.J., Deyo, R.A.,
Shekelle, P.G. 2003. A review of the
evidence for the effectiveness, safety, and
cost of acupuncture, massage therapy, and
spinal manipulation for back pain. Ann.
Intern. Med., 138(11): 898-906.
Chiradejnant, A., Maher, C.G., Latimer, J.,
Stepkovitch, N. 2003. Efficacy of "therapist
selected" versus "randomly selected"
mobilisation techniques for the treatment of
low back pain: a randomised controlled trial.
Aust. J. Physiother., 49(4): 233-41.16.
CMAJ (Oct 2004).
Domjan, L., Nemes, T., Balint, G.P., Toth, Z.,
Gomor, B. 1990. A simple method for
measuring lateral flexion of the dorsolumbar
spine. J. Rheumatol., 17: 663–665.
Donald, D. Price, Patricia A. McGrath, Amir Rafii
and Barbara Buckingham. 1983. The
validation of visual analogue scales as ratio
scale measures for chronic and experimental
pain. Pain, 17(1): 45-63.
Furlan, A.D., Brosseau, L., Imamura, M., Irvin, E.
2002. Massage for low-back pain: a
systematic review within the framework of
the Cochrane Collaboration Back Review
Group. Spine, 27(17): 1896-910.
Ganong: A Text Book Of Medical Physiology,
Ed3, Philadelphia, 1968, WB Sauders. A

Effeciveness of Integrated Soft Tissue Mobilization on the Functional Outcome in Chronic Low Back Pain Patients-
Antony Leo Aseer & Iyer, Lakshami Subramanian
67
manual of reflexive therapy of the connective
tissue, Scarsdale, NY, 1978, Sidney.
Gert Bronfort, Mitchell Haas, Roni L. Evans, , Lex
M. Bouter, 2004. Efficacy of spinal
manipulation and mobilization for low back
pain and neck pain: a systematic review and
best evidence synthesis; The Spine Journal,
4(3): 335-356.
Greenman, P.E. 1996. Principles of manual
medicine, 2nd ed. Baltimore: Williams and
Wilkins,
Grieve, G.P. 1981: Vertebral joint problems, New
York,. 1ST ed,Churchill Livingstone.
Grönblad, M., Hurri, H., Kouri, J.P. 1997.
Relationships between spinal mobility,
physical performance tests, pain intensity
and disability assessments in chronic low
back pain patients. Scandinavian Journal of
Rehabilitation Medicine, 29(1): 17-24.
Andersson, Gunnar, Stephen, L. Demeter, George
Smith, M. 1996. American academy of
orthopedic surgeons: Manual for orthopedic
surgeons in evaluating permanent physical
impairment. Chicago, Illinois, 1-30.
Hart, L.G., Deyo, R.A., Cherkin, D.C. 1995.
Physician office visits for low back pain:
frequency, clinical evaluation, and treatment
patterns from a U.S. national survey. Spine,
20: 11-9.
Hagen, E.M., Eriksen, H.R., Ursin, H. 2000. Does
early intervention with a light mobilization
program reduce long-term sick leave for low
back pain? Spine, 25(15): 1973-6.
Harvey, E., Burton, A.K., Klaber, Moffett, J,
Breen, A 2003. Spinal manipulation for low
back pain: a treatment package agreed by the
UK chiropractic, osteopathy and
physiotherapy professional associations.
Manual Therapy, 8: 46-51.
Hazard, R.G. 1996. Chronic low back pain and
disability: The efficacy of functional
restoration. Bull. Hosp. Joint Dis., 55: 213-
6.
Helene M., Langevin, Karen Sherman, J. 2006.
Pathophysiological model for chronic low
back pain integrating connective tissue and
nervous system mechanisms Elsevier,
06.033.
Hemmila, H.M., Keinanen-Kiukaanniemi, S.M.,
Levoska, S., Puska, P. 2002. Longterm
effectiveness of bone-setting, light exercise
therapy, and physiotherapy for prolonged
back pain: a randomized controlled trial. J.
Manipulative Physiol. Ther., 25(2): 99-104.
Jette, A. 2006. Toward a common language for
function, disability, and health. Phys. The.,
86(5): 726-734,
Jousset, N., Fanello, S., Bontoux, L., Dubus, V.,
Billabert, C., Vielle, B., Roquelaure, Y.,
Penneau-Fontbonne, D., Richard, I. 2004.
Effects of functional restoration versus 3
hours per week physical therapy: a
randomized controlled study. Spine, 29(5):
487- 93.
Keller, R.B., Atlas, S.J., Soule, D.N., Singer,
D.E., Deyo, R.A. 1999. Relationship
between rates and outcomes of operative
treatment for lumbar disc herniation and
spinal stenosis. J. Bone Joint Surg. Am., 81:
752-62.
Fisher, K. & Johnston, M. 1997. Validation of the
Oswestry Low Back Pain Disability
Questionnaire, its sensitivity as a measure of
change following treatment and its
relationship with other aspects of the chronic
pain experience Physiotherapy Theory and
Practice, 13(1): 67-80.
Kovacs, Francisco, M., Abraira, Víctor, Zamora,
Javier, Teresa, Gil del Real, María, Llobera,
Joan, Fernández, Carmen. 2004. Correlation
Between Pain, Disability, and Quality of
Life in Patients With Common Low Back
Pain; Spine, 29(2): 206-210.
Kuukkanen, T., Malkia, E. 2000. .Effects of a
three-month therapeutic exercise programme
on flexibility in subjects with low back pain.
Physiother. Res. Int., 5(1): 46- 61.
Licciardone, J.C., Stoll, S.T., Fulda, K.G., Russo,
D.P., Siu, J., Winn, W., Swift, J., Jr. 2003.
Osteopathic manipulative treatment for
chronic low back pain: a randomized
controlled trial. Spine, 28(13): 1355-62.
Liddle, S.D., Baxter, G.D., Gracey, J.H. 2004.
Exercise and chronic low back pain: what
works? Pain, 107(1-2): 176-90.
Lucie, Milne, Sarah, Robinson, Vivian, M.,
Marchand, Serge, Shea, Beverley; Wells,
George; Tugwell, Peter. 1991. Efficacy of
the Transcutaneous Electrical Nerve
Stimulation for the Treatment of Chronic
Low Back Pain: A Meta-Analysis, Pain,
47(1): 53-63.

Journal of Exercise Science and Physiotherapy, Vol. 9, No. 1: 57-68, 2013
68
Lund, J.P., Donga, R., Widmer, C.G., Stohler,
C.S. 1991. The pain adaptation model: a
discussion of the relationship between
chronic musculoskeletal pain and motor
activity. Can. J. Physiol. Pharmacol., 69(5):
683–94.
Macrae IF, Wright V. 1969. Measurement of back
movement. Ann. Rheum. Dis., 28: 584–589.
Mannion, A.F., Taimela, S., Muntener, M.,
Dvorak, J. 2001. Active therapy for chronic
low back pain part 1. Effects on back muscle
activation, fatigability, and strength. Spine,
26(8): 897-908.
Davidson, M. and Jennifer, L. Keating. 2002. A
Comparison of Five Low Back Disability
Questionnaires: Reliability and
Responsiveness. Physical Therapy, 82(1): 8-
24.
Michael, E. Geisser, Elizabeth A. Wiggert,
Andrew J. Haig, M.D., Miles, O. Colwell,
2005. A Randomized Controlled Trial Of
Manual Therapy And Specific Adjuvant
Exercise For Chronic Low Back Pain Clin. J.
Pain,. 21(6): 463–470.
Moseley, L. 2002. Combined physiotherapy and
education is efficacious for chronic low back
pain. Aust. J. Physiother, 48(4): 297-302.
Niemisto, L., Lahtinen-Suopanki, T., Rissanen, P.,
Lindgren, K.A., Sarna, S., Hurri, H. 2003. A
randomized trial of combined manipulation,
stabilizing exercises, and physician
consultation compared to physician
consultation alone for chronic low back pain.
Spine, 28(19): 2185-91.
Petersen, T., Kryger, P., Ekdahl, C., Olsen, S.,
Jacobsen, S. 2002 .The effect of McKenzie
therapy as compared with that of intensive
strengthening training for the treatment of
patients with subacute or chronic low back
pain: A randomized controlled trial. Spine,
27(16): 1702-9.
Pustaver, M.R. and Mathews. 1995. Etiology and
conservative management of mechanical low
back pain J. Manipulative Physiol. Ther.,
18(6): 419.
Richard, A., Deyo, James, Weinstein, N. 2001.
Primary care, low back pain, N. Engl. J.
Med, 344( 5): 363-370.
Roland, M.O. 1986. A critical review of the
evidence for a pain–spasm–pain cycle in
spinal disorders. Clin. Biomech., 1(2): 102–
9.
Rosomoff, H.L., Fishbain, D.A., Goldberg, M.,
Santana, R., Rosomoff, R.S. 1989. Physical
findings in patients with chronic intractable
benign pain of the neck and/or back. Pain.,
37: 279–87.
Sahrman, S.A. 2002. Diagnosis and treatment of
movement impairment syndromes. St. Louis:
Mosby.
Scott, F., Nadler, Kurt Weingand, and Roger, J.
Kruse; 2004. The Physiologic Basis and
Clinical Applications of Cryotherapy and
Thermotherapy for the Pain Practitioner;
Pain Physician., 7: 395-399.
Serge Marchand , a, Jacques Charesta, Jinxue Lia,
Jean-René Chenarda, Benoit Lavignolleb
and Louis Laurencellec Is TENS purely a
placebo effect? A controlled study on chronic
low back pain 2003.
Swedlow, A.,, Johnson G., Smithline, N.,
Milstein, A. 1992. Increased costs and rates
of use in the California workers‘
compensation system as a result of self-
referral by physicians. N. Engl. J. Med., 327:
1502-6.
Sweetman, B.J., Heinrich, I., Anderson J.A.D
1993. A randomized controlled trial of
exercises, short wave diathermy, and traction
for low back pain, with evidence of
diagnosis-related response to treatment. J.
Orthopaedic-Rheumatology, 6: 159-66.
Walach, H., Guthlin, C., Konig, M. 2003. Efficacy
of massage therapy in chronic pain: a
pragmatic randomized trial. J. Altern.
Complement. Med., 9(6): 837-46.
Warwick, R., Williams, P. 1973. Gray's anatomy.
Philadelphia, Saunders.
Werners, R., Pynsent, P.B., Bulstrode, C.J. 1999.
Randomized trial comparing interferential
therapy with motorized lumbar traction and
massage in the management of low back
pain in a primary care setting. Spine, 24(15):
1579-84.

A Case study of a Rare Case of Turner’s Hypoplasia and Unilaterally Fused Deciduous and Permanent Lateral Incisor
Caused By Trauma –Verma, Leena
69
A Case study of a Rare Case of Turner’s Hypoplasia and
Unilaterally Fused Deciduous and Permanent Lateral Incisor Caused
By Trauma Verma, Leena
Sr. Asst. Prof., Dr. H.S. Judge Institute of Dental College, Punjab University, Chandigarh
Introduction Hypoplasia is defined as a
quantitative defect of enamel visually
and is histomorphologically identified
as an external defect involving the
surface of the enamel and associated
with reduced thickness of enamel
(Ozturk et al, 2004).Turner's
hypoplasia usually manifests as a
portion of missing or diminished
enamel, generally affecting one or
more permanent teeth in the oral
cavity. If it involves anterior teeth,
most likely cause is traumatic injuries
leading to primary incisors being
knocked out or driven into the alveolus
affecting the permanent tooth bud. The
affect of trauma are more pronounced
if it occurs prior to third year of life.
The topographic relationship of the
primary teeth to the permanent tooth
germ explains the potential for possible
developmental disturbances
(Andreasen & Andreasen, 1994). The
developmental defects of the
permanent successor tooth range from
mild alteration in enamel mineralization
in form of simple white or yellow
brown discoloration to crown
dilaceration, crown duplication, root
dilaceration, root duplication,
odontome like malformation, disturbed
eruption, partial or complete arrest of
root formation to severe sequestration
of the developing tooth germ
(Andreasen & Andreasen, 1994,
Shafer, 2007). Hypoplasia was
categorized into the following types by
Silberman et al (2010)
Type I hypoplasia: Enamel
discoloration, Type II hypoplasia
(Abnormal coalescence), Type III
hypoplasia (Some parts of enamel
missing due to hypoplasia) & Type IV
hypoplasia: A combination of previous
three types of hypoplasia. According
Abstract
Orofacial trauma is a serious orodental and general health problem that may have medical, esthetic
and psychological consequences for children and their parents. When the root of the primary tooth is
close to the unerupted permanent tooth, primary tooth trauma may result in developmental
disturbances and pulpal reaction in that permanent tooth. We report an unusual case of an 8 year old
girl who met with trauma at 15 months of age in which injury to the primary dentition resulted in
developmental disturbances in the crown of the permanent tooth and fusion between permanent and
deciduous tooth. Localized malformation of the crown and enamel hypoplasia was treated with a light-
cured composite resin restoration. The treatment of fused permanent and deciduous incisor is also
discussed.
Keywords: Enamel Hypoplasia, Fusion, Tooth Trauma

Journal of Exercise Science and Physiotherapy, Vol. 9, No. 1: 69-73, 2013
70
to them
both dentitions could be affected by
enamel hypoplasia; however, the
incidence is more severe in permanent
dentition. The characteristics of clinical
enamel hypoplasia include unfavorable
esthetics, higher dentin sensitivity,
malocclusion and dental caries
susceptibility (White & Pharaoh,
2006). The treatment challenge in this
type of injury is to promote a complete
oral rehabilitation in both esthetics and
function. A case report of a 8-year-old female
patient with chief complaint of anterior
malformed teeth and abnormally large
teeth in upper left maxillary region
following a traumatic injury while playing
is presented below.
CASE REPORT
Fig. 1.
An 8-year-old female patient reported
to the Department of Pedodontics and
Preventive Dentistry with chief complaint
of anterior malformed teeth and
abnormally large teeth in upper left
maxillary region. On clinical examination,
the maxillary left central incisor showed
yellowish brown discoloration with type
IV enamel hypoplasia (enamel
discoloration, abnormal coalescence, some
parts of enamel missing) and left
permanent lateral incisor was fused with
deciduous lateral incisor (Figure 1).
Fig. 2
The incisal aspect of the turner
hypoplstic tooth showed a portion of
missing or diminished enamel and the
fused deciduous and permanent lateral
incisor showed an extra cusp on the labial
surface and talons cusp palatally (Figure
2).
The maxillary central incisor
(hypoplastic tooth) was not tender on
percussion and no caries was detected
clinically. Patient had a history of trauma
at the age of 15 months, followed by
avulsion of left central incisor and
intrusion of left lateral incisor. Her
medical history was irrelevant with his
condition. Intraoral Periapical Radiograph
(IOPA) showed fusion of permanent left
lateral incisor with deciduous left lateral
incisor and diminished or missing enamel
on left central incisor. (Figure 3)
Fig. 3
The fused teeth <22-62> had an
irregular labial and lingual surface with an
incisal ditch with a labial groove. Both the

A Case study of a Rare Case of Turner’s Hypoplasia and Unilaterally Fused Deciduous and Permanent Lateral Incisor
Caused By Trauma –Verma, Leena
71
fused teeth were also caries free. The
periapical radiograph exhibited that only
the crowns of <22-62> were fused with
non union of their pulp chambers and root
canals.The pulp chamber of deciduous
lateral incisor was resorbed and there was
fusion of enamel only with permanent
lateral incisor. Occlusal view revealed
abberant morphology of permanent left
lateral incisor and also the presence of
irregular surface of left central incisor
(Figure-4).
Fig. 4
Orthopantomogram confirmed the
presence of fusion in deciduous and
permanent left lateral incisor and turner
hypoplasia in left central incisor along
with normal set of complementary teeth
(Figure-5).
Fig. 5
Fig. 6
A multidisciplinary approach was
adopted for the management of the case.
Esthetic treatment with palatal contouring
and light cure composite restoration was
performed on left central incisor.
Composite build up was done for the
proper shape of the teeth. Since the fusion
of deciduous and permanent teeth was of
only crown, therefore selective grinding of
the resorbed crown of deciduous lateral
incisor was done to give proper shape to
permanent lateral incisor and keep the
patient on regular follow up.(Figure 6)
Discussion
Hypoplasia is a disturbance that
occurs at the time when teeth are
developing and is associated with
macroscopic enamel defects. Traumatic
injuries to the primary dentition are very
common, affecting from 4-30% of all
children (Velasco, et al, 1997). If a
traumatic injury occurs to a deciduous
tooth during the period when the crown of
the succeeding permanent tooth is being
formed, there occurs disturbance in the
ameloblastic layer of the permanent tooth
and result in a hypoplastic tooth. The
effect of trauma is more pronounced if it
occurs prior to third year of life. This was
first discovered by Turner in 1912.These
single teeth are called Turner‘s teeth and
the condition is called Turner‘s
Hypoplasia. Diana Ribeiro et al (2009)

Journal of Exercise Science and Physiotherapy, Vol. 9, No. 1: 69-73, 2013
72
reported from their longitudinal study of 8
years that discolorations of enamel and/or
enamel hypoplasia (46.08%) were the
most prevalent sequelae on permanent
dentition due to traumatic injury. 7
Tooth fusion is defined as union
between the dentin and/ or enamel of two
or more separate developing teeth.1,2
The
fusion may be partial or total depending
upon the stage of tooth development at the
time of union . If the contact occurs before
the calcification stage, the teeth unite
completely and form one large tooth.
Incomplete fusion may be at root level if
the contact and union occurs after
formation of crown. Fusion can occur at
the level of enamel or enamel and dentin,
which results in the formation of one
clinically enlarged crown. Fused teeth can
have separated pulpal space, one pulp
chamber and two canals or take the form
of a large bifid crown with one pulpal
space. Etiology of fusion is not fully
explained. Some authors state that it is a
result of physical forces that lead to the
necrosis of epithelial tissue between the
two joining buds, they come into contact
and fuse.5, 6
.According to other authors,
fusion is a result of the persistence of the
interdental lamina between the two buds
during embryological development. Fusion
may be unilateral or bilateral and most
commonly occurs in primary teeth with
more predilection for anterior teeth.7
Fusion may occur between two normal
teeth or between a normal tooth and a
supernumerary tooth. Clinically fused
anterior teeth frequently have a groove or
notch on the incisal edge that goes in
buccolingual direction and
radiographically, the dentin of fused teeth
always appears to be joined in some region
with separate pulp chambers and canals.
In the rare case report we reported
here, the patient had a history of trauma in
their deciduous dentition below the age of
3 years and had type-IV enamel
hypoplasia (enamel discoloration,
abnormal coalescence, some parts of
enamel missing) along with fusion of
deciduous left lateral incisor and
permanent left lateral incisor. The brown
discoloration occurs due to disturbances in
ameloblastic layer, leading to defective
matrix formation caused by traumatic
injuries, but the stretched inner enamel
epithelium continues to induce the
differentiation of new odontoblasts and
hence the dentine formation is not
disrupted. The fusion between deciduous
lateral and permanent lateral incisor also
occurred due to traumatic injury in the
deciduous dentition which had led to
fusion between the two teeth.
Thus, this a rare case report in
which following trauma to deciduous
dentition, there occurs fusion between
deciduous lateral and permanent lateral
incisor and turner‘s hypoplasia in
permanent central incisor. This is a rare
occurrence not yet reported so far.
Conclusion: An injury to a young child‘s
teeth can be physically and emotionally
traumatic. The dentist must take time to
carefully examine and analyze not only the
damage itself, but also the possibilities of
sequelae to the permanent tooth germ and
the overall health of the child. For this
reason, treatment of trauma in primary
dentition must include long-term follow-up
of sequelae in the permanent dentition.The
case we report here stresses the
importance of traumatic injuries to

A Case study of a Rare Case of Turner’s Hypoplasia and Unilaterally Fused Deciduous and Permanent Lateral Incisor
Caused By Trauma –Verma, Leena
73
primary dentition because of their effects
on the permanent tooth germ. References
Ozturk, N, Zafar, S., Ozturk, B. 2004. Faculty of
Dentistry, University of Selcuk, Konya,
turkey. An interdisciplinary approach for
restoring function and esthetic in patient
with amelogenesis imperfecta and
malocclusion: A clinical report. J. Prosthetic
Dentistry, 92(2): 112-115.
Andreasen, F.M. & Andreasen, J.O. 1994.
Textbook and color atlas of traumatic
injuries to the teeth. Mosby Co; p. 457-94.
Shafer's textbook of oral pathology, 5 edition: page
75 Publisher: Elsevier 2007
Golpaygani, V.M., Mehrdad, K., Mehrdad, A.,
Ansari, G. 2009. An evaluation of the rate of
dental caries among hypoplastic and normal
teeth: A case control study. Res. J. Biol. Sci.,
4: 537–41.
White, S.C. & Pharaoh, M.J. 2006. Oral
radiologyth Principles and Interpretation 5th
edition page: 345-346. Publisher: Elsevier
Velasco, L.F.L., Araujo, F.B, Ferreira, E.S.,
Velasco, L.E.L. 1997. Esthetic and
functional treatment of a fused permanent
tooth: A case report. Quintessence Int., 28:
677-80.
Andreasen, J.O. 1971. The effect of traumatic
injuries to primary teeth on their permanent
successor. Scand. J. Dent. Res., 145: 229. do Espírito Santo Jácomo, D.R., Campos, V. 2009.
Prevalence of sequelae in the permanent
anterior teeth after trauma in their
predecessors: a longitudinal study of 8 years.
Dent Traumatol., 25(3): 300-4.


Instructions to contributors—Journal of Exercise Science & Physiotherapy
a
Instructions to Contributors
Journal of Exercise Science and Physiotherapy
(JESP) is a scientific peer reviewed journal, publishing
research studies and review articles in the field of sports
injuries, physiotherapy, exercise physiology, sports
rehabilitation, diseases and exercise, sports psychology,
nutrition, physical education, sports biomechanics,
kinesiology and sports education.
JESP is published annually in June but is
planned to be published biannually in the near future.
Articles written in English should be sent to the editor of
JESP. The research paper for publication in the journal
could be sent not only in typed manuscript form but also
through the Internet using email attachment. Keeping in
view the postal delays, authors, therefore, are encouraged to
submit their research material/articles as email directly to
Mission
JESP aims to present easy access to the scientific
knowledge for health & sport conscious individuals. The
purpose is to minimise the problems like the delays in
publishing process of the articles by drawing advantage
from electronic medium.
Instructions to Authors
The articles may be submitted to the Editor,
JESP (email: [email protected] OR
[email protected]). Manuscripts are considered if they are
submitted only to JESP and therefore should not be under
consideration for publication elsewhere, either in part or in
whole. Authors are responsible for the scientific context and
legal aspects of the articles. Editors may make necessary
changes to articles in accordance with ―Instructions to
Authors‖. Normally the complete research paper should not
exceed 15 typed pages including tables and figures;
however under exceptional circumstances this limit can be
relaxed. There is no page and reference limitation for the
review articles. All files related to manuscripts should be
submitted electronically. Internet transmission and e-mail
attachments are preferred; CD-ROM is acceptable for large
files. Text files should be in Microsoft Word 6.O and later
versions. Each figure, table, photograph or other image
should be submitted electronically. The manuscripts should
be submitted in Times New Roman font, 12-point type,
double-spaced with 3 cm margins on all sides. The reference
style used by the Journal is the Harvard System of
referencing.
Format for Research Article
Include the following sections in research
articles without page space:
Title: Capital letters.
Authors: Surname followed by initials and
institution(s) where the study was conducted.
Abstract Include an abstract of not more than 150
words that includes objectives, methods, results and
conclusions.
KEY WORDS: To assist in indexing the journal, list up to
6 key words (not from title), which your article could be
indexed.
INTRODUCTION
METHODS
RESULTS
DISCUSSION
CONCLUSION
ACKNOWLEDGMENTS: Provide information sufficient
to identify sources of support, technical assistance, and
intellectual contributions not associated with authorship.
REFERENCES: Each citation in the text must be noted by
surname and year in parentheses and must appear in the
reference section as an alphabetic order. Example for
citation in the text; a) for single author (Gür, 1999), b) for
two authors (Gür and Akova, 2001), c) more than two
authors (Gür et al., 2000).
Journal Article:
Akova, B., Sürmen-Gür, E., Gür, H., Dirican,
M., Sarandöl, E. and Kücükoglu, S. 2001. Exercise-induced
oxidative stress and muscular performance in healthy
women: role of vitamin E supplementation and endogenous
estradiol. European Journal of Applied Physiology, 84:
141-147.
Journal Article, Article not in English:
Seker-Aygül, Z., Akova, B. and Gür, H. 2001.
The relationship of stress and stress management factors
with injury in soccer players. Turkish Journal of Sports
Medicine, 36: 71-80. (In Turkish: English abstract).
Journal Article in press:
Gür, H., Cakin, N., Akova, B., Okay, E. and
Kücükoglu, S 2002. Concentric versus combined
concentric- eccentric isokinetic training: Effects on
functional capacity and symptoms in patients with
osteoarthrosis of the knee. Archives of Physical Medicine
and Rehabilitation, in press.
Journal Article in electronic format:
Weigand, D.A., Carr, S., Petherick, C. and
Taylor, A. 2001. Motivational climate in Sport and
Physical Education: The role of significant others.
European Journal of Sports Science (serial online) 1(4),
(13 screens/inclusive page), October. Available from URL:
http://www.humankinetics.com/ejss
Book:
Guyton, A.C. and Hall, J.E. 1996. Textbook of
medical physiology. 9th edition. W. B. Saunders Company,
London.
Chapter in edited book:

Instructions to contributors—Journal of Exercise Science & Physiotherapy
c
Wilson, C.H. 1984. Exercise for arthritis. In:
Therapeutic exercise. Ed: Basmajian, J.V. 4th edition.
Baltimore: Williams and Wilkins. 529-545.
Thesis:
Özyener, F. 2000. Effects of work intensity on
dynamics of pulmonary gas exchange during exercise in
humans. Doctoral thesis, University of London, London.
79.
Thesis not in English:
Özer, Ö. 2001. The effect of muscle exercise to
oxygen kinetics in chronic smokers. Doctoral thesis,
University of Uludag, Bursa. 1-54. (In Turkish: English
abstract).
LEGENDS
AUTHOR BIOGRAPHY: Please include a
brief biography, approximately 50 words per author, for
each author including (1) academic title/degrees, (2)
institution affiliation, (3) research focus, (4) post and e-mail
addresses.
TABLES, FIGURES, etc.: The location within
the article where e.g. figures and tables appear should be
indicated in the text. These materials (e.g. table, figure)
should be submitted separately from the text document.
Each item should be produced in Microsoft Office (Word,
Excel, or PowerPoint), GIF or JPEG format. Submit each
item separately and number sequentially as (main author)
Figure 1.jpg, (main author) Figure2.jpg, and so on, for
example, GurFigure1.jpg and GurTable1.doc.
FORMAT FOR REVIEW ARTICLE
Include the following sections in research articles without
page space:
TITLE: Capital letters.
AUTHORS: Surname followed by initials and
institution(s) where the study was conducted.
ABSTRACT Include an abstract of not more than 300
words.
KEY WORDS: To assist in indexing the journal, list up to
6 key words (not from title), which your article could be
indexed
MAIN TEXT
CONCLUSION
ACKNOWLEDGMENT
REFERENCES: Each citation in the text must be noted by
surname and year in parentheses and must appear in the
reference section as an alphabetic order. Example for
citation in the text; a) for single author (Gür, 1999), b) for
two authors (Gür and Akova, 2001), c) more than two
authors (Gür et al., 2000). See the reference section of
research article for detail.
LEGENDS
AUTHOR BIOGRAPHY: For detail see the author
biography section of research article.
TABLES, FIGURES, etc.: For details see the tables,
figures, section of research article.
REVIEW AND PUBLISHING POLICY
Upon receipt of a manuscript the editor will
notify the main author that the submission has been
received. The manuscript will undergo a blinded review
process. Under this process the editor will forward
(electronically) the manuscript to two independent
reviewers. Normally the review process will take
approximately 4 weeks. After the review process has been
completed the main author will be notified via E-mail either
of acceptance, revision or rejection of the manuscript. If the
main author has not been informed of the results of the
review process after 8 weeks from the date of confirmation
of receipt of the manuscript (by the editor), the author
should notify the editor-in-chief directly. If revision was
recommended, this should be completed and returned to the
editor within 4 weeks; failure to return the revised
manuscript within the allotted time span will lead to
rejection of the manuscript. When a manuscript has been
accepted for publication it will be forwarded to the editor-
in-chief for final approval. The editor-in-chief will work
with the main author to make necessary revisions in order
for the manuscript to appear in the Journal of Exercise
Science and Physiotherapy. The final proof of the
manuscript will be sent to the main author as an E-mail
attachment. If the main author requires any minor changes
to the finished work, these should be submitted
electronically to the editor-in-chief within one week.
Manuscript accepted in the first half of the year will be
published not later than the second half of the year.
Processing fee of Rs. 400 per printed page will be charged
from the author.
Checklist for Authors
Double-space manuscript text and use 3cm
margins on all sides, and Times New Roman,
12-point type, English and SI units.
Include with text a title, abstract, key words,
figure and table lists, figure and table legends.
Submit all materials electronically.
Include complete author names, addresses, e-
mail, phone and fax numbers.
Include a short (~50 words) author biography
for each author.
Editor-in-Chief,
JESP