jordan insurance federation - test.jif.jotest.jif.jo/systemfiles/assets/binder2.pdf · jordan...
TRANSCRIPT


Jordan Insurance Federation
Annual Report 2014
Page No. Description Table No.
1-2 Growth in Insurance Business 2014 Charts
3 Insurance Business for the Year 2013-2014 Table (1)
4 Insurance Operations For The Year 2014- (Total Premiums & Paid Claims) Table (2)
6 Insurance Branches Results As in 31/12/2014 Premiums, Abroad Reinsures Premiums Share, Paid
Claims, Abroad Reinsurers Claims Share, Net Technical Profit (Loss), Loss Ratio Table (3)
7 Balance Sheet for The Jordanian Insurance Companies for The Year 2013-2014 Table (4)
8 Income Statement for The Jordanian Insurance Companies for The Year 2013-2014 Table (5)
9 Growth of Premiums for all Classes 2004-2014 Table (6)
10 Growth of Paid Claims for all Classes 2004-2014 Table (7)
11 Written Premiums of Jordan Insurance Market 2013-2014 Table (8)
12 Paid Claims of Jordan Insurance Market 2013-2014 Table (9)
13 Companies Shares % in Gross Premiums for the year of 2014 Chart
14-15 Underwritten Premiums 2014-Companies Share of all Classes Table (10)
16 Motor Underwritten Premiums 2014 Table (11)
17-20 Companies Classification & Share of Gross Written Premiums for The Year 2014 Table (12)
21 Companies Share of Paid Claims for The Year 2014 Chart
22-23 Paid Claims 2014-Companies Share of all Classes Table (13)
24 Motor Paid Claims 2014 Table (14)
25-28 Companies Classification & Share of Paid Claims for The Year 2014 Table (15)
29-30 Net Profit (Loss) for Jordan Insurance Companies as Per Class for The Year 2014 Table (16)
31 Motor Net Profit (Loss) as in 31/12/2014 Table (17)
32-35 Insurance Companies According to Profit (Loss) as Per Class for The Year 2014 Table (18)
36 Total Assets/Investments/Paid-up Capital/ Shareholders' Equity/ Retained Earnings (Accumulated
Profit & (Loss)) 2014 Table (19)
37 Insurance Companies According to Total Assets, Investments, Paid Up Capital for The Year 2014 Table (20)
38 Classification of The Insurance Companies According to Shareholders' Equity, Retained Earnings,
Statutory Reserve, Voluntary Reserve of 2014 Table (21)
39 Insurance Companies According to Fixed Assets and Other Assets 2014 Table (22)
40 Insurance Companies According to Statutory & Voluntary Reserves 2014 Table (23)
41 Insurance Companies Balance Sheet Indicators as in 2014 Table (24)
42 Insurance Companies Balance Sheet Indicators as in 2013 Table (25)
43-44 Gross Administrative Expenses for Insurance Companies Distributed on Insurance Underwriting
Branches for The Year 2014 Table (26)
45 Gross Administrative & General Expenses for Jordan Insurance Companies for The Year 2014 Table (27)
46 % of Takaful Insurance From Gross Insurance Premiums (Allocated to Insurance Branches) 2009-2017 Table (28)
47 % of Takaful Insurance From Gross Insurance Paid Claims (Allocated to Insurance Branches) 2009-2014 Table (29)
48 Takaful Insurance Business (Premiums, Paid Claims) Allocated to Insurance Branches 2014 & 2013. Table (30)
49 Takaful Insurance Business (Profit (Loss)) Allocated to Insurance Branches 2014 & 2013 Table (31)
50 Jordanian, Arab and Foreign Shares in Insurance Companies Paid up Capitals for the year 2014 Table (32)

Structure of the Jordanian Insurance Sector 2014 -2015 *
Insurance Directorate
25 Insurance Companies
Ministry of Industry, Trade and Supply
Jordan Insurance Federation
Composite Companies(Non-Life, Life & Medical)
Composite Companies(Non-Life & Medical)
Life Insurance Companies Non-Life Insurance Companies
Jordan International InsuranceJordan French InsuranceJordan InsuranceIslamic InsuranceArabia Insurance - JordanNational InsuranceMiddle East InsuranceArab Life & Accidents InsuranceJerusalem InsuranceUnited InsuranceArab Jordanian Insurance GroupAl Nisr Al Arabi InsuranceAl Yarmouk InsuranceDelta InsuranceEuro Arab Insurance Group
Arab Union International InsuranceArab Orient InsuranceFirst InsuranceJordan Emirates InsuranceAl Manara InsuranceThe Mediterranean & Gulf InsurancePhiladelphia InsuranceArab Assurers
MetLife Alico Holy Land Insurance
(15) Insurance Co. (8) Insurance Co. (1) Insurance Co.(1) Insurance Co.
Insurance Support Services **931
Agents584
Brokers149
Coverholders1
Bancassurance11
Actuaries19
Insurance Consultant
31
Reinsurance Broker
23
Companies Administrating Insurance Business
16
Non-resident *** Reinsurance Brokers
39
Loss Adjusters & Surveyors
58
The number of employees in Jordanian insurance sector in 2014 increased by 1,1% to reach 2831 employee compared to 2799 employee in 2013 (These numbers include the employees in Jordan Insurance Federation and in the 25 insurance companies members in the Federation excluding sales agents).There are (931) corporation provides insurance support services including insurance agents, brokers, loss adjusters, actuaries, consultants, reinsurance brokers and companies administrating insurance business (TPA), bancassurance, coverholders and non-resident reinsurance brokers.
Number of employees in insurance sector: *****
* Insurance Commission was cancelled according to act No. (17) of 2014 (Restructuring, Governmental Entities. All Insurance) Commission tasks and authorities were transfered to Insurance Directorate in Ministry of Industry and Trade.
** Source: the initial yearly report issued by former Insurance Commission.*** Non-resident reinsurance broker is a reinsurance broker not resident in Jordan, also didn`t take it as his bussiness headquarter and he`s licensed or registered
to practice reinsurance business outside Jordan and to provide his services to any insurance company inside Jordan according to decision No. (3) for the year 2008 issued by general manager of Insurance Commission.
**** The number of employees in the Jordanian insurance sector excludes the number of employees in Insurance Directorate/ former Insurance Commission for the years 2013 & 2014 because the actual employees number is unavailable of Insurance Directorate after the cancellation of Insurance Commission according to act No. (17) of 2014 & transfering it`s duties & responsibilities to the Ministry of Industry & Trade.
***** The number of insurance companies in Jordan in 2012 was 28 companies and in 2013 Gerasa General Assembly decided to liquidate voluntry the company on May/ 2013 and early 2014 Insurance Commission decided to annualled Arab German Insurance Co. & Al Barakah Takaful which decreased the number to be 25 insurance companies.

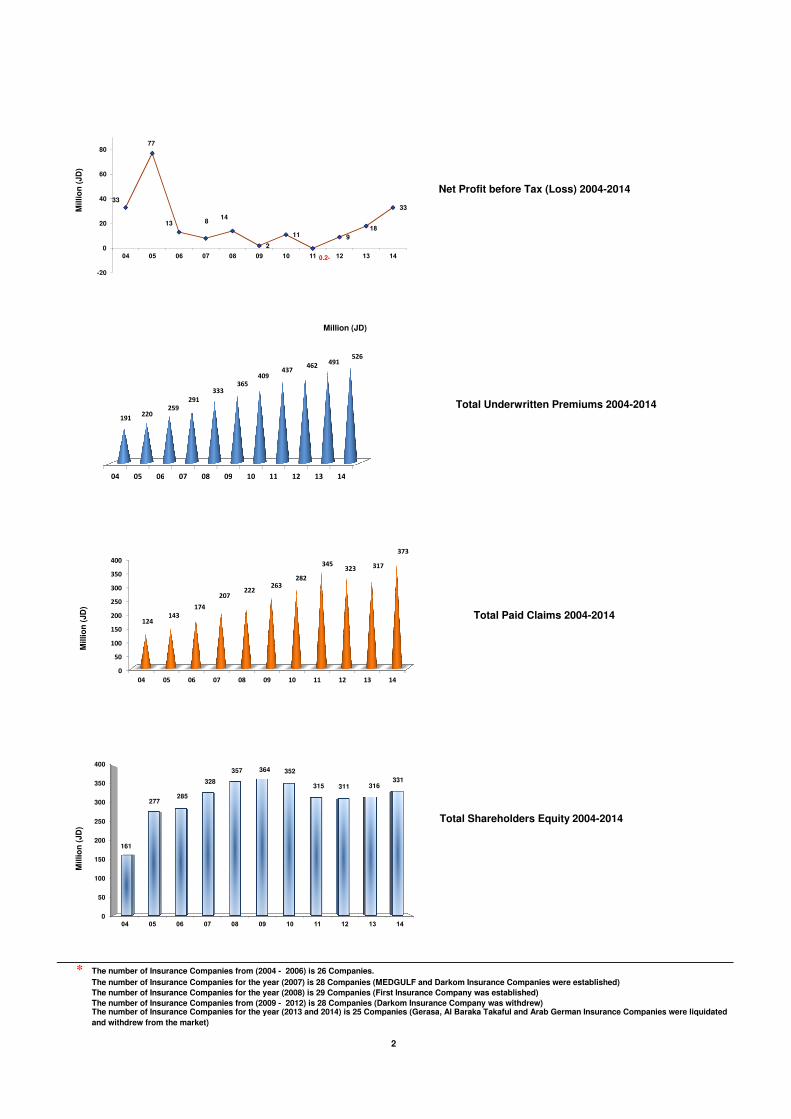
Growth in Insurance Business 2004- 2014 *
Millio
n (
JD
)M
illio
n (
JD
)
Paid Up Capital 2004-2014
Total Assets 2004-2014
85
131
207
245
304287
296 295280 281
269
0
50
100
150
200
250
300
350
04 05 06 07 08 09 10 11 12 13 14
361
525 547
627666
695 719 724 739
798843
0
200
400
600
800
1000
04 05 06 07 08 09 10 11 12 13 14
*
Million (JD)
1
The number of Insurance Companies for the year (2013 and 2014) is 25 Companies (Gerasa, Al Baraka Takaful and Arab German Insurance Companies were liquidated
and withdrew from the market)
The number of Insurance Companies from (2004 - 2006) is 26 Companies.
The number of Insurance Companies for the year (2007) is 28 Companies (MEDGULF and Darkom Insurance Companies were established)
The number of Insurance Companies for the year (2008) is 29 Companies (First Insurance Company was established)
Total Retained Earnings (Accumulated Losses) 2004-2014
The number of Insurance Companies from (2009 - 2012) is 28 Companies (Darkom Insurance Company was withdrew)
Investments 2004-2014
Millio
n (
JD
)
22
52
12 97
-1-11 -13
-18
-12
14
-30
-20
-10
0
10
20
30
40
50
60
04 05 06 07 08 09 10 11 12 13 14
04 05 06 07 08 09 10 11 12 13 14
264
410 410
457471 485 474
455 471500
524
Millio
n (
JD
)
Net Profit before Tax (Loss) 2004-2014
Million (JD)
Total Underwritten Premiums 2004-2014
33
77
13 814
2
11
-0.2
9
18
33
-20
0
20
40
60
80
04 05 06 07 08 09 10 11 12 13 14
04 05 06 07 08 09 10 11 12 13 14
191220
259
291
333
365
409437
462491
526
*
Millio
n (
JD
)M
illio
n (
JD
)
The number of Insurance Companies for the year (2013 and 2014) is 25 Companies (Gerasa, Al Baraka Takaful and Arab German Insurance Companies were liquidated
and withdrew from the market)
The number of Insurance Companies for the year (2007) is 28 Companies (MEDGULF and Darkom Insurance Companies were established)
The number of Insurance Companies for the year (2008) is 29 Companies (First Insurance Company was established)
The number of Insurance Companies from (2009 - 2012) is 28 Companies (Darkom Insurance Company was withdrew)
Total Shareholders Equity 2004-2014
Total Paid Claims 2004-2014
The number of Insurance Companies from (2004 - 2006) is 26 Companies.
0
50
100
150
200
250
300
350
400
04 05 06 07 08 09 10 11 12 13 14
124143
174
207222
263
282
345323
317
373
0
50
100
150
200
250
300
350
400
04 05 06 07 08 09 10 11 12 13 14
161
277285
328
357 364 352
315 311 316331
2

%Change20132014
7.1%490.931.905525.708.172Total Underwritten Premiums
4.7%316.144.954330.941.898Non-Life Premiums (General Insurances)
11.9%47.437.14253.096.513Life Premiums
11.2%127.349.809141.669.761Medical Premiums
17.6%317.028.993372.917.551Total Paid Claims
26.8%182.180.892231.018.185Non-Life Paid Claims (General Insurances)
16.5%24.507.37128.542.839Life Paid Claims
2.7%110.340.729113.356.527Medical Paid Claims
4.6%316331Shareholders' Equity
8.7%327.9356.4Total Technical Provisions
-4.6%281.3268.3Paid Up Capital
6%644687Total Shareholders' Equity&Technical Provisions
5.6%797.7842.5Total Assets
5%499.8524.4Investments
214%-12.514.2Retained Earnings (Accumulated Losses)
61.4%25.541.1Net Technical Profit (Loss) Before Tax
58.7%2234.9Net Technical Profit (Loss) Inside Jordan
30.3%0.50.7Net Technical Profit (Loss) of Branches Outside Jordan
58%22.635.6Net Technical (Loss) Profit (Inside & Outside Jordan)
79.2%18.433.1Net Profit (Loss) (After Tax and Fees)
3
* Source: Financial Annual Reports for (25) Insurance Companies.
Insurance Business for the Year 2014*
(JD)
Milloin JD
Table (1)

Tbl. 1-2
JD JD
Branch / Year 2014
(25 Companies)
Change%
2013
Branch Share
of Total
Premiums 2014
2013
(25 Companies)
Change%
2012
Branch Share
of Total
Premiums
2013
Branch / Year 2014 (25
Companies)
Change%
2013
Branch
Share of
Total Paid
Claims 2014
2013
(25 Companies)
Change%
2012
Branch
Share of
Total Paid
Claims 2013
Marine Insurance** 28,658,379 2% 5.5% 28,086,631 -6.8% 5.7% Marine Insurance* 7,074,414 10.3% 1.9% 6,411,414 -45.7% 2.0%
Fire Insurance 69,119,571 1.1% 13.1% 68,339,553 12.7% 13.9% Fire Insurance 42,142,299 230.5% 11.3% 12,750,863 1.7% 4.0%
Motor Insurance 212,529,078 5.4% 40.4% 201,672,152 4.3% 41.1% Motor Insurance 175,678,591 9.5% 47.1% 160,388,032 6.6% 50.6%
Compulsory (Third Party Liability Ins.) 145,626,143 6.8% 27.7% 136,353,271 1.6% 27.8% Compulsory (Third Party Liability Ins.) 115,527,438 10.2% 31% 104,821,634 -3.7% 33.1%
Comprehensive (Own Damage)Ins. 66,902,935 2.4% 12.7% 65,318,881 10.5% 13.3% Comprehensive (Own Damage)Ins. 60,151,153 8.3% 16.1% 55,566,398 -11.6% 17.5%
Credit Insurance 699,052 75.7% 0.1% 397,979 29.6% 0.1% Credit Insurance 717,123 -10.7% 0.2% 803,072 -4.2% 0.3%
General Accident Insurance*** 19,935,818 13% 3.9% 17,648,639 10.6% 3.6% General Accident Insurance** 5,405,758 195.8% 1.4% 1,827,511 -15.6% 0.6%
Total General Insurances 330,941,898 4.7% 63% 316,144,954 5.2% 64.4% Total General Insurances 231,018,185 26.8% 61.9% 182,180,892 -8.5% 57.5%
Life Assurance 53,096,513 11.9% 10.1% 47,437,142 8.4% 9.7% Life Assurance*** 28,542,839 16.5% 7.7% 24,507,371 1.0% 7.7%
Medical Insurance 141,669,761 11.2% 26.9% 127,349,809 8.4% 25.9% Medical Insurance 113,356,527 2.7% 30.4% 110,340,729 10.6% 34.8%
Total Life & Medical Insurances 194,766,274 11.4% 37% 174,786,951 8.4% 35.6% Total Life & Medical Insurances 141,899,366 5.2% 38.1% 134,848,100 8.8% 42.5%
Total Premiums 525,708,172 7.1% 100% 490,931,905 6.3% 100% Total Paid Claims 372,917,551 17.6% 100% 317,028,992 -1.9% 100%
4
*** Life Assurance claims in 2014 include the amounts paid for surrender and maturity policies in an amount of JD (6.786.466).
* Marine insurance claims in 2014 include Aviation Paid Claims with an amount of JD (226.423).
*** General Accident Insurance for 2014 include Liability insurance in an amount of JD (6.667.689) in addition to other insurances.
* Source: annual reports 2014 for insurance companies.
** Marine insurance premiums in 2014 include Aviation insurance with an amount of JD (3.172.700) and 7 insurance companies
practice it.
** General Accident Claims for 2014 include Liability insurance paid claims in an amount of JD (300.835) in
addition to other insurances.
Paid Claims
For (25) Insurance Companies (JD)
Total Premiums & Paid Claims
Table (2)
Insurance Operations For the Year 2014 *
Underwritten Premiums

Table (2)
Gross Premiums & Paid Claims and percentages % Shares According to Branches for the year 2014 (JD)
Tbl. 2-2
5
Insurance branch Premiums
2014 Change%
2013 Branch share from General Insurances
Branch share from total Premiums
Paid Claims 2014
Change% 2013
Branch share from General Insurances
Branch share from total Paid Claims
Marine Insurance 28,658,379 2% 8.7% 5.5% 7,074,414 10.3% 3.1% 1.9%
Fire Insurance 69,119,571 1.1% 20.9% 13.1% 42,142,299 230.5% 18.2% 11.3%
Motor Insurance 212,529,078 5.4% 64.2% 40.4% 175,678,591 9.5% 76% 47.1%
Compulsory (Third Party Liability Ins.) 145,626,143 6.8% 44.0% 27.7% 115,527,438 10.2% 50% 31%
Comprehensive (Own Damage)Ins. 66,902,935 2.4% 20.2% 12.7% 60,151,153 8.3% 26% 16.1%
Credit Insurance 699,052 75.7% 0.2% 0.1% 717,123 -10.7% 0.3% 0.2%
General Accident Insurance 19,935,818 13% 6% 3.9% 5,405,758 195.8% 2.3% 1.4%
Total General Insurances 330,941,898 4.7% 100% 63% 231,018,185 26.8% 100% 61.9%
Insurance branch Premiums
2014 Change%
2013
Branch share from Life & Medical
Insurances
Branch share from total Premiums
Paid Claims
2014 Change%
2013
Branch share from Life & Medical
Insurances
Branch share from total Paid Claims
Life Assurance 53,096,513 11.9% 27.3% 10.1% 28,542,839 16.5% 20.1% 7.7%
Medical Insurance 141,669,761 11.2% 72.7% 26.9% 113,356,527 2.7% 79.9% 30.4%
Total Life & Medical Insurances 194,766,274 11.4% 100% 37% 141,899,366 5.2% 100% 38.1%
Total 525,708,172 7.1% 100% 372,917,551 17.6% 100%

201320142013201420132014201320142013201420132014
5,262,8505,613,22922.314.95,019,2885,702,2656,411,4147,074,41422,879,38922,863,72828,086,63128,658,379Marine & Aviation Insurance
479,7558,240,16186.382.73,377,4732,627,733160,388,032175,678,5914,005,4155,277,774201,672,152212,529,078Motor Insurance
-14,562,059-5,684,30196.989.92,820,9482,130,105104,821,634115,527,4382,536,2093,297,079136,353,271145,626,143Compulsory (Third Party Liability Ins.)
15,041,81513,924,46265.167.5556,525497,62855,566,39860,151,1531,469,2061,980,69565,318,88166,902,935Comprehensive (Own Damage)
3,944,2913,699,22245.542.1
10,524,67234,762,36812,750,86342,142,29951,766,87650,835,88568,339,55369,119,571Fire Insurance
3,408,0772,729,70822.330.6751,3584,396,2941,827,5115,405,75811,424,22513,265,10917,648,63919,935,818General Accident Insurance
525,257357,356-158-18.546,246103,769803,072717,123192,593450,320397,979699,052Credit Insurance
13,620,23020,639,67682.479.419,719,03747,592,429182,180,892231,018,18590,268,49892,692,816316,144,954330,941,898Total General Insurances
2,409,7687,974,38391.282.942,068,31444,074,197110,340,729113,356,52749,796,46960,006,254127,349,809141,669,761Medical Insurance
5,957,5956,288,30649.947.511,827,85113,439,50124,507,37128,542,83915,888,85617,270,18647,437,14253,096,513Life Assurance
8,367,36314,262,68981.274.453,896,16557,513,698134,848,100141,899,36665,685,32577,276,440174,786,951194,766,274Total Life & Medical Insurances
21,987,59334,902,3658277.773,615,202105,106,127317,028,992372,917,551155,953,823169,969,256490,931,905525,708,172Total
6
BranchUnderwritten Premiums Net Technical Profit (Loss)
Insurance Branches
Table (3)
Premiums, Abroad Reinsurer´s Premiums Share,Paid Claims,Abroad Reinsurer’s Paid Claims Share,
Net Technical Profits (Loss) and Loss Ratio (Jordan) For 2014-2013 (JD)
Abroad Reinsurer’s
Claims Share% Loss Ratio *
* Loss Ratio of the market = net claims cost / net premiums revenue %.
Abroad Reinsurerُs
Premiums Share Paid Claims
Percentage
Change %
13
Financial Assets at Fair Value Through Profit or Loss 15
Financial Assets at Fair Value Through Other Comprehensive Income -4
-6
-81
1.7
5
0
Total Investments 5
37
16
0
3
18
-3
-8
Other Assets 11
Others 22
5.6
3
13
Net Mathmatical Provision 10
Other Technical Provisions 0
Deficit in Premiums Provision -28
9
-6
3
-6
5
28
7
Loans -33
Deferred Tax Liability -16
Other Liabilities 2
Others -51
7
-4.6
-79
13
8
-1
0
-130
Retained Earnings (Accumulated) Profit & Losses 214
Period´s Profit (Loss)
Others 64
5
37
5
Others -33
6
87,104,70773,363,495
11,186Other Investments
Details
Due from Reinsurers
82,635,021
Deferred Tax Assets
Treasury Stocks
Table (4)
Financial Assets at Amortized Cost
Investments in Subsidaries & Associates
Property Investments
205,815,656
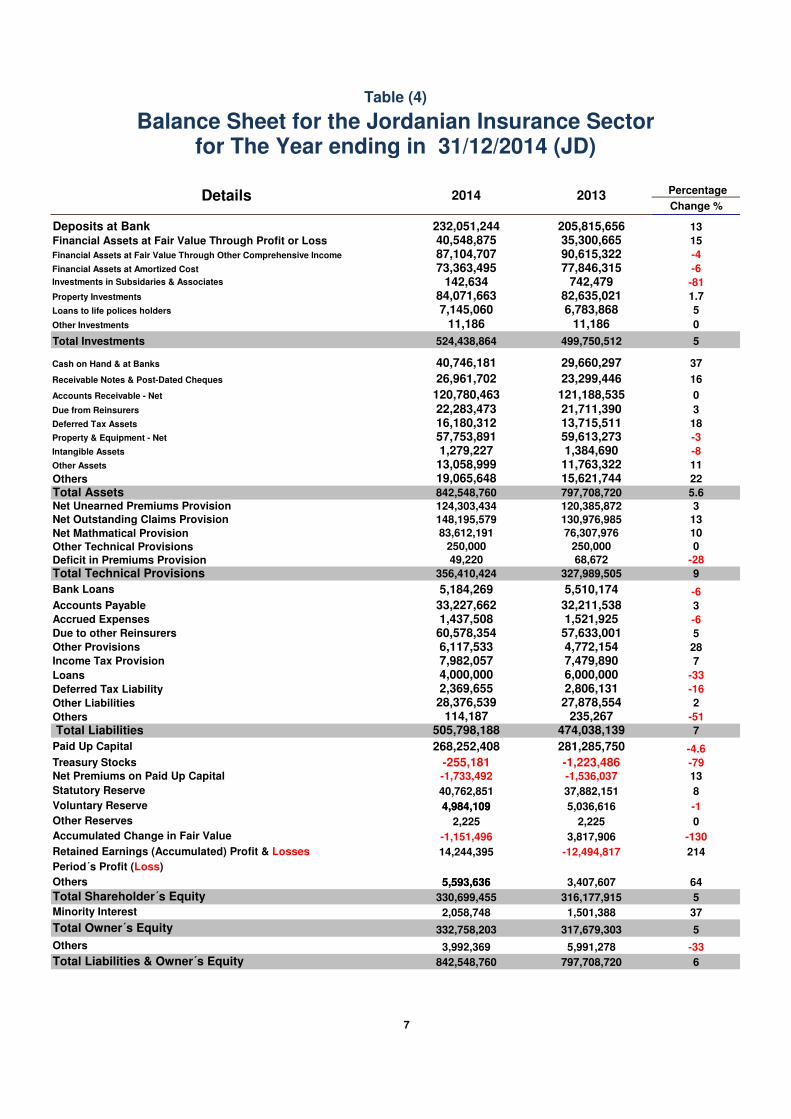
Balance Sheet for the Jordanian Insurance Sector
Deposits at Bank
for The Year ending in 31/12/2014 (JD)
Intangible Assets
Total Assets
Net Outstanding Claims Provision
Accrued Expenses
Total Liabilities
232,051,244
Receivable Notes & Post-Dated Cheques
2014 2013
6,783,868
40,746,181
7,145,060
90,615,32277,846,315
Loans to life polices holders
40,548,875
Statutory Reserve
Property & Equipment - Net
Total Technical Provisions
Accounts Payable
Voluntary Reserve
Net Unearned Premiums Provision
Bank Loans
Paid Up Capital
Net Premiums on Paid Up Capital
Income Tax Provision
Total Shareholder´s Equity
14,244,395
7,982,057
Due to other Reinsurers
Other Provisions
1,437,508
6,117,53360,578,354
Other Reserves
Accumulated Change in Fair Value
330,699,455
-12,494,817
3,407,607
332,758,203
40,762,851
27,878,554
-1,536,037
114,187
4,984,1094,984,109
2,225
268,252,408
-255,181
28,376,539
-1,151,496
37,882,151
-1,733,492
505,798,188
5,036,616
2,225
3,992,369
797,708,720
1,501,388
Total Liabilities & Owner´s Equity
5,991,278
2,058,748
317,679,303
842,548,760
Minority Interest
Total Owner´s Equity
7
3,817,906
316,177,915
5,593,6365,593,636
59,613,273
250,000
22,283,473
49,220
250,000
5,184,269
1,384,690
21,711,39013,715,511
13,058,9991,279,227
842,548,760
33,227,662
524,438,864
57,753,89116,180,312
148,195,579
124,303,434
26,961,702
356,410,424
Accounts Receivable - Net
29,660,297
84,071,663
499,750,512
142,634
120,780,463
23,299,446
742,479
121,188,535
Cash on Hand & at Banks
35,300,665
11,186
11,763,322
83,612,191 76,307,976
19,065,648 15,621,744
120,385,872
130,976,985
797,708,720
68,672
1,521,925
281,285,750
-1,223,486
474,038,139235,267
327,989,505
4,772,15457,633,001
2,806,1312,369,6556,000,0007,479,890
5,510,174
32,211,538
4,000,000

Percentage
Change %
7
9
6
-63
16
Net Change in Premiums Shortage Provision -96
8
6
18
Interests Revenues -4
Gain (Losses) from Financial Assets & Investments 3
Other Revenues related to underwriting accounts 31Net-change in fair value for financial assests at fair value through income statements
profit & Loss -31
Profit of financial assests at fair value through comprehesive income -9
Revenue of property investment
Investments revenue related to underwriting accounts 21
Other Revenues -2
8
Paid Claims 18
Maturity & Surrender of Policies 9
Subrogation (Recoveries) 11
Reinsurer´s Share 48
7
-36
12
30
7
7
4
Allocated Employees Expenses 9Others 551
4
-4
1
11
5
-32Low Losses in Fixed Assets -407Doubtful Debts Expense (Amortized Cost)) -91Banks Interests & Expenses -55Doubtful Debts Provision -12Bad Debts -89Other Provisions 36
-4
61
14
79.3
320,948,136
8
Depreciation
Other Expenses
335,077,650Net Cost of Claims
1,980,391
926,512
90,000
Allocated Administrative Expenses 18,633,542 16,645,535
7,511,280
19,788,600Acquisition Policies Fees
Underwriting Administrative Expenses
102,229
211,625,564
129,933
34,605,434
370,076,974
227,038,293
5,488,009
18,484,237
1,307,088
Net Paid Claims
Excess of Loss Premiums
123,632
315,813,091
1,081,391
Net Change in Outstanding Claims Provision
315,229,315
84,993
1,760,007
14,758,648 15,424,949
-440,329
299,422,265
24,559,340
17,527,113
Details 2014 2013
for the Year ending in 31/12/2014 (JD)
535,262,071
334,555,228
117,929,529
371,611,469
8,073,293
Total Revenues
Income Statement for Insurance Companies
Reinsurer´s Share
Net Written Premiums
Net change in Unearned Premiums Provision 10,552,311
Total Written Premiums*
7,310,744
2,297,856
111,744
54,163
Paid Commissions
33,453,150 30,076,073
398,842,872
2,495,190
323,352,907
20,652,777
39,650
200,000
180,824
354,251
8,833,447
3,858,754
8,896,920
3,471,999
967,291
-904
* The total written premiums include the branchs premiums of two insurance companies who have outside jordan branches.
160,000
22,675,423
18,446,47233,083,069
Income Tax Provision 7,012,076
Net Profit After Tax
8,006,730
41,089,799
Table (5)
3,917,559
-19,452
7,304,214Net Change in Mathmatical Provision 6,278,844
200,706,843 184,841,102
Doubtful Debts Expense
Unallocated Administrative Expenses
500,654,193
5,014,171 4,759,897
2,895,881
7,142,309
6,809,503 6,260,033
19,971
1,207,406
Net Profit(Loss) Before Tax
Total Expenses
Employees Expenses (Unallocated)
25,458,548
294
23,670,290
799,00068,500
1,641,429
31,777,908
2,931,765 2,986,486
79,787,711
26,991,244
2,404,388
17,171,056
7,080,047
Issuing Fees
Commissions Received
Net Earned Premiums Income
25,989,702

2014201320122011201020092008200720062005
28,658,37928,086,63130,150,13730,738,029
24,613,91025,570,63029,305,37423,659,20822,480,53921,176,828
1,344,7791,287,8242,164,5491,668,361
1,070,048746,0951,009,692923,0081,059,3631,140,827Less (Local) reinsurers premiums*
22,863,72822,879,38924,363,51525,545,676
20,167,07821,466,43223,992,65118,732,26218,034,76317,151,314Less (Abroad) reinsurers premiums*
4,449,8723,919,4183,622,0733,523,9923,376,7843,358,1034,303,0314,003,9383,386,4132,884,687Net retained premiums*
69,119,57168,339,55360,651,00457,369,056
56,342,88554,354,41447,261,45142,107,23835,157,91129,697,050
14,697,25612,608,34011,033,52911,489,787
11,763,57613,347,6338,767,0246,058,8145,904,3454,024,830Less (Local) reinsurers premiums*
50,835,88551,766,87646,200,21342,858,018
41,841,09138,431,71136,255,60133,859,23227,347,59224,174,670Less (Abroad) reinsurers premiums*
3,586,4303,964,3373,417,2623,021,2512,738,2182,575,0702,238,8262,189,1921,905,9741,497,550Net retained premiums*
212,529,078201,672,152193,332,018184,688,009176,714,739150,027,926139,192,995129,986,435121,046,810100,961,858
13,241,09612,717,51812,498,60412,610,958
11,667,5559,941,4428,140,4509,687,40513,182,7045,688,014Less (Local) reinsurers premiums*
5,277,7744,005,4154,598,2253,791,688
4,123,1054,183,2674,865,8154,412,9714,374,5604,330,062Less (Abroad) reinsurers premiums*
194,010,208184,949,219176,235,189168,285,363160,924,079135,903,217126,186,730115,886,059103,489,54690,943,782Net retained premiums*
19,935,81817,648,63915,953,29617,432,140
18,414,83117,591,23115,291,69713,943,18211,234,0628,680,770
2,394,0592,170,9381,708,8981,955,271
2,302,6681,671,9302,209,9012,046,9791,442,109769,322Less (Local) reinsurers premiums*
13,265,10911,424,2259,863,23710,375,332
10,830,92411,563,5299,076,9378,004,9595,400,2585,762,573Less (Abroad) reinsurers premiums*
4,276,6504,053,4764,381,1615,101,5375,281,2394,355,7724,004,8593,891,2444,391,6952,148,875Net retained premiums*
699,052397,979307,160455,009
464,035607,708766,946784,230766,198577,577
Less (Local) reinsurers premiums*
450,320192,59292,398115,839
116,73385,31055,7359,555235,686211,349Less (Abroad) reinsurers premiums*
248,732205,387214,762339,170347,302522,398711,211774,675530,512366,228Net retained premiums*
330,941,898316,144,954300,393,615290,682,243276,550,400248,151,909231,818,463210,480,293190,685,520161,094,083
31,677,19028,784,62027,405,58027,724,37726,803,84725,707,10020,127,06718,716,20621,588,52111,622,993Less (Local) reinsurers premiums*
92,692,81690,268,49785,117,58882,686,55377,078,93175,730,24974,246,73965,018,97955,392,85951,629,968Less (Abroad) reinsurers premiums*
206,571,892197,091,837187,870,447180,271,313172,667,622146,714,560137,444,657126,745,108113,704,14097,841,122Net retained premiums*
53,096,51347,437,14243,766,88040,800,332
38,038,11234,877,79735,868,38829,180,01125,153,74022,905,628
2,589,1091,964,9651,936,1332,336,883
1,962,5913,120,5192,238,5571,404,152763,408473,319Less (Local) reinsurers premiums*
17,270,18615,888,85613,409,46412,719,707
11,917,1139,501,2049,929,6117,001,0736,132,9995,039,707Less (Abroad) reinsurers premiums*
33,237,21829,583,32128,421,28325,743,74224,158,40822,256,07423,700,22020,774,78618,257,33317,392,602Net retained premiums*
141,669,761127,349,809117,506,160105,948,171
94,026,91482,123,55065,336,47951,817,04442,897,53735,848,123
861,193920,1331,022,8071,257,000
624,881591,28092,49482,63682,289149,913Less (Local) reinsurers premiums*
60,006,25449,796,46953,212,35051,168,383
36,954,42132,839,28023,724,40320,116,68216,791,37911,981,385Less (Abroad) reinsurers premiums*
80,802,31476,633,20763,271,00353,522,78856,447,61248,692,99041,519,58231,617,72626,023,86923,716,825Net retained premiums*
525,708,172490,931,905461,666,655437,430,746408,615,426365,153,256333,023,330291,477,348258,736,797219,847,834
35,127,49231,669,71830,364,52031,318,26029,391,31929,418,89922,458,11820,202,99422,434,21812,246,225Less (Local) reinsurers premiums*
169,969,256155,953,822151,739,402146,574,643125,950,465118,070,733107,900,75392,136,73478,317,23768,651,060Less (Abroad) reinsurers premiums*
320,611,424303,308,365279,562,733259,537,843253,273,642217,663,624202,664,459179,137,620157,985,342138,950,549Net retained premiums*
*
**
9
Table (6)
General Accident Insurance premiums in 2014 include Liability Insurance premiums with an amount of J.D (6.667.689)in addition to other Insurances.
Growth of Premiums for All Classes 2005- 2014 (JD)
Marine Insurance premiums in 2014 include Aviation insurance premiums with an amount of (3.172.700)JD.
TOTAL NON-LIFE INSURANCES
CREDIT INSURANCE
MOTOR INSURANCE
GENERAL ACCIDENT INSURANCE**
MARINE & AVIATION INSURANCE*
FIRE INSURANCE
TOTAL UNDERWRITTEN PREMIUMS
LIFE ASSURANCE
MEDICAL INSURANCE

2014201320122011201020092008200720062005
7,074,4146,411,41411,809,6205,003,0894,684,0696,532,2608,231,7675,512,8323,560,4543,535,048
697,825977,209329,530160,349230,675307,968385,722214,657204,229173,171Recoveries
80,417-242,75710,472189,22235,458697,753152,631293,46880,084213,654Less Local Reinsurers Share
5,702,2655,019,28810,913,2193,793,7673,668,7934,792,4217,083,3873,174,3262,770,0512,679,319Less (Abroad)Reinsurers Share
593,907657,674556,399859,751749,143734,118610,0271,830,381506,090468,904Retained Claims
42,142,29912,750,86312,534,89825,569,29711,234,68318,587,76712,513,18325,228,34921,218,35111,607,891
472,164274,925202,3901,490,208243,719439,024 168,762 479,600 183,209 156,184Recoveries
5,336,149742,3561,110,7695,957,9841,937,7641,768,8221,656,5672,252,578965,1591,247,869Less Local Reinsurers Share
34,762,36810,524,67210,149,64717,991,6318,035,80115,769,5608,929,48020,945,36718,558,3097,937,791Less (Abroad)Reinsurers Share
1,571,6181,208,9101,072,092129,4741,017,399610,3611,758,3741,550,8041,511,6742,266,047Retained Claims
175,678,591160,388,032171,699,125190,783,410160,331,459147,058,192131,991,111122,735,277103,299,96587,241,664
29,344,31225,754,97127,527,43428,378,30723,270,63523,435,69020,526,64317,003,01714,687,13410,861,117Recoveries
4,105,6003,170,3993,690,3624,426,1984,637,0593,084,3063,335,1874,348,8025,163,8483,980,656Less Local Reinsurers Share
2,627,7333,377,4734,270,6084,340,0764,428,9963,366,7833,734,0465,369,9464,744,7696,464,452Less (Abroad)Reinsurers Share
139,600,946128,085,189136,210,721153,638,829127,994,769117,171,413104,395,23596,013,51278,704,21465,935,439Retained Claims
5,405,7581,827,5112,165,1572,938,5642,658,0523,566,0971,701,5711,638,8041,729,1872,118,734
79,05560,21150,61231,36823,28245,99849,49225,0085,645724,109Recoveries
166,538272,132292,07690,399289,690205,036105,88373,125141,882291,342Less Local Reinsurers Share
4,396,294751,358489,4111,223,7991,058,1531,996,892575,526972,7701,104,886664,283Less (Abroad)Reinsurers Share
763,871743,8101,333,0581,592,9981,286,9271,318,171970,670567,901476,774439,000Retained Claims
717,123803,072838,458911,1122,093,502926,168505,017247,06191,872198,002
681,098863,548763,524830,749449,632198,168115,23498,082Recoveries
Less Local Reinsurers Share
103,76946,24662,292133,745592,576223,445217,790133,38690,457157,605Less (Abroad)Reinsurers Share
-67,744-106,72212,642-53,3821,051,294504,555171,99315,5931,41540,397Retained Claims
231,018,185182,180,892199,047,258225,205,472181,001,765176,670,484154,942,649155,362,323129,899,829104,701,339
31,274,45427,930,86428,873,49030,890,98124,217,94324,426,84821,245,85317,820,36415,080,21711,914,581Recoveries
9,688,7043,942,1305,103,67910,663,8036,899,9715,755,9175,250,2686,967,9736,350,9735,733,521Less Local Reinsurers Share
47,592,42919,719,03725,885,17727,483,01817,784,31926,149,10120,540,22930,595,79527,268,47217,903,450Less (Abroad) Reinsurers Share
142,462,598130,588,861139,184,912156,167,670132,099,532120,338,618107,906,29999,978,19181,200,16769,149,787Retained Claims
28,542,83924,507,37124,264,67421,368,20420,371,17019,465,00516,824,88313,994,72510,946,35110,275,554
88412,36019,0839,67362,09233,67046,7544,097Recoveries
2,002,4861,055,0391,727,3021,354,3881,092,171215,4911,744,123211,26485,89451,983Less Local Reinsurers Share
13,439,50111,827,8519,997,6739,255,1858,332,4277,500,1914,530,7375,127,1803,915,1002,815,678Less (Abroad)Reinsurers Share
13,099,96811,612,12112,520,61610,748,95810,884,48011,715,65310,503,2698,656,2816,945,3577,407,893Retained Claims
113,356,527110,340,72999,730,26998,361,03880,731,09867,268,02749,823,10838,126,94233,592,63327,866,828
1,344,4061,437,0291,542,3193,686,1692,426,3091,402,3682,330,150674,792695,980725,585Recoveries
347,227477,634703,348615,715576,029326,090186,97466,12345,402168,335Less Local Reinsurers Share
44,074,19742,068,31446,369,87146,034,42831,116,67725,128,06516,382,46114,481,42711,980,1817,618,322Less (Abroad)Reinsurers Share
67,590,69766,357,75251,114,73148,024,72646,612,08340,411,50430,923,52322,904,60020,871,07019,354,586Retained Claims
372,917,551317,028,992323,042,201344,934,714282,104,033263,403,516221,590,640207,483,990174,438,813142,843,721
32,619,74429,380,25330,434,89234,586,82326,706,34425,862,88623,622,75718,499,25315,776,19712,640,166 Recoveries
12,038,4175,474,8037,534,32912,633,9068,568,1716,297,4987,181,3657,245,3606,482,2695,953,839 Less Local Reinsurers Share
105,106,12773,615,20282,252,72182,772,63157,233,42358,777,35741,453,42750,204,40243,163,75328,337,450 Less (Abroad)Reinsurers Share
223,153,263208,558,734202,820,259214,941,354189,596,095172,465,775149,333,091131,534,975109,016,59495,912,266 Retained Claims
Growth of Paid Claims for All Classes 2005-2014 (JD)Table (7)
TOTAL NON-LIFE INSURANCES
MARINE & AVIATION INSURANCE*
CREDIT INSURANCE
GENERAL ACCIDENT INSURANCE**
MOTOR INSURANCE
FIRE INSURANCE
LIFE ASSURANCE***
*Marine Insurance Paid Claims in 2014 include Aviation insurance Paid Claims with an amount of JD (226.423)
Total Paid Claims
MEDICAL INSURANCE
10
**General Accident Paid Claims in 2014 include Liability Paid Claims in an amount of J.D (300.835) in addition to other insurances
***Life Assurance claims in 2014 include the amounts paid for surrender and maturity policies in an amount of J.D (6.786.466)

Arrange according Share of Arrange of
to Average Gross Premiums% Branch
Growth%2014201420142013
28,658,37928,086,631
1,344,7791,287,824Less (Local) reinsurers premiums*
22,863,72822,879,389Less (Abroad) reinsurers premiums*
4,449,8723,919,418Net retained premiums*
69,119,57168,339,553
14,697,25612,608,340Less (Local) reinsurers premiums*
50,835,88551,766,876Less (Abroad) reinsurers premiums*
3,586,4303,964,337Net retained premiums*
212,529,078201,672,152
13,241,09612,717,518Less (Local) reinsurers premiums*
5,277,7744,005,415Less (Abroad) reinsurers premiums*
194,010,208184,949,219Net retained premiums*
19,935,81817,648,639
2,394,0592,170,938Less (Local) reinsurers premiums*
13,265,10911,424,225Less (Abroad) reinsurers premiums*
4,276,6504,053,476Net retained premiums*
699,052397,979
Less (Local) reinsurers premiums*
450,320192,592Less (Abroad) reinsurers premiums*
248,732205,387Net retained premiums*
330,941,898316,144,954
31,677,19028,784,620Less (Local) reinsurers premiums*
92,692,81690,268,497Less (Abroad) reinsurers premiums*
206,571,892197,091,837Net retained premiums*
53,096,51347,437,142
2,589,1091,964,965Less (Local) reinsurers premiums*
17,270,18615,888,856Less (Abroad) reinsurers premiums*
33,237,21829,583,321Net retained premiums*
141,669,761127,349,809
861,193920,133Less (Local) reinsurers premiums*
60,006,25449,796,469Less (Abroad) reinsurers premiums*
80,802,31476,633,207Net retained premiums*
525,708,172490,931,905
35,127,49231,669,718Less (Local) reinsurers premiums*
169,969,256155,953,822Less (Abroad) reinsurers premiums*
320,611,424303,308,365Net retained premiums*
*
**11
Written Premiums of Jordan Insurance Market 2014 (JD)
2
TOTAL UNDERWRITTEN PREMIUMS
MEDICAL INSURANCE
3 13.1 7
FIRE INSURANCE
2
7.1
4 10.1
MOTOR INSURANCE
1
6
GENERAL ACCIDENT INSURANCE**
Credit Insurance
63
26.9
100
5
13
1.1
40.4 5.4
5 5.5
MARINE & AVIATION INSURANCE*
6
Table (8)
2
TOTAL (NON-LIFE) INSURANCES
75.77 0.1
4.7
3.9
General Accident Insurance premiums in 2014 include Liability Insurance premiums with an amount of J.D (6.667.689) in addition to other
Insurances.
Growth%
Marine Insurance premiums in 2014 include Aviation insurance premiums with an amount of J.D (3.172.700)
LIFE ASSURANCE
3
11.2 4
11.9
1

Arrange AccordingShare ofArrange of
to AverageGross Claims%Branch
Growth%2014201420142013
7,074,4146,411,414
697,825977,209Recoveries*
80,417-242,757Less Local Reinsurers Share*
5,702,2655,019,288Less (Abroad)Reinsurers Share*
593,907657,674Retained Claims*
42,142,29912,750,863
472,164274,925Recoveries*
5,336,149742,356Less Local Reinsurers Share*
34,762,36810,524,672Less (Abroad)Reinsurers Share*
1,571,6181,208,910Retained Claims*
175,678,591160,388,032
29,344,31225,754,971Recoveries*
4,105,6003,170,399Less Local Reinsurers Share*
2,627,7333,377,473Less (Abroad)Reinsurers Share*
139,600,946128,085,189Retained Claims*
5,405,7581,827,511
79,05560,211Recoveries*
166,538272,132Less Local Reinsurers Share*
4,396,294751,358Less (Abroad)Reinsurers Share*
763,871743,810Retained Claims*
717,123803,072
681,098863,548Recoveries*
Less Local Reinsurers Share*
103,76946,246Less (Abroad)Reinsurers Share*
-67,744-106,722Retained Claims*
231,018,185182,180,892TOTAL NON-LIFE INSURANCES
31,274,45427,930,864Recoveries*
9,688,7043,942,130Less Local Reinsurers Share*
47,592,42919,719,037Less (Abroad)Reinsurers Share*
142,462,598130,588,861Retained Claims*
28,542,83924,507,371
88412,360Recoveries*
2,002,4861,055,039Less Local Reinsurers Share*
13,439,50111,827,851Less (Abroad)Reinsurers Share*
13,099,96811,612,121Retained Claims*
113,356,527110,340,729
1,344,4061,437,029Recoveries*
347,227477,634Less Local Reinsurers Share*
44,074,19742,068,314Less (Abroad)Reinsurers Share*
67,590,69766,357,752Retained Claims*
372,917,551317,028,992 Total Paid Claims
32,619,74429,380,253Recoveries*
12,038,4175,474,803Less Local Reinsurers Share*
105,106,12773,615,202Less (Abroad)Reinsurers Share*
223,153,263208,558,734Retained Claims*
*
**
***
(Arrange of branches- Share of gross claims%- Growth%- Arrange according to average growth%)
Paid Claims of Jordan Insurance Market 2014 (JD)Table (9)
47.1
MOTOR INSURANCE
FIRE INSURANCE
11.3
1.95 10.3
MARINE & AVIATION INSURANCE*
4
Growth %
12
6
230.5
5
13
1 9.5
2195.81.5
MEDICAL INSURANCE
16.5
7 (10.7)
61.9
7.7
Life assurance claims in 2014 include the amounts paid for surrender and maturity policies in an amount of JD (6.786.466).
17.6100
30.42
General Accident Paid Claims in 2014 include Liability Paid Claims in an amount of J.D (300.835) in addition to other
Marine insurance paid claims in 2014 include aviation insurance paid claim with an amount of JD (226.423) and the amount of local reinsurance for 2013
represented the local reinsurance share from marine insurance branch recoveries.
2.7
7
26.8
GENERAL ACCIDENT INSURANCE**
CREDIT INSURANCE
6
LIFE ASSURANCE ***
3
0.2
4

Arab Orient Insurance; 18.1
Jordan Insurance; 9.9
Arabia Insurance - Jordan; 3.3
Jerusalem Insurance; 3.2
MetLife Alico; 2.9
Delta Insurance; 2.7
AL Manara Insurance; 2.2
Arab Jordanian Ins. Group; 2.1
Arab Orient Insurance; 2.1
Al Yarmouk Insurance; 1.9 Arab Assurers; 1.8
Jordan Emirates Insurance; 1.7
Philadelphia Insurance; 1.3Holy Land Insurance; 1.3
Arab Union International Ins.; 1.2
2014Companies Share % in Gross Written Premiums
Middle East Insurance; 7.3
First Insurance ; 4.9
AL-Nisr Al-Arabi Insurance; 4.9
Jordan French Insurance; 4.4United Insurance; 4.1
Islamic Insurance; 4.1
National Insurance; 4.0
MEDGULF Insurance; 3.6
Arab Life & Accidents Ins.; 3.5
Euro Arab Insurance Group; 3.5
13

Tbl. 1-2
201320142013201420132014201320142013201420132014201320142013201420132014
7,120,8137,132,4666,739,5397,997,703170,350312,3921,490,2021,532,09817,067,54913,060,0812,139,7572,568,1452,139,7572,568,145Jordan Insurance1
4,232,2314,516,6056,505,9027,362,077276,350227,341938,4091,218,0549,335,4299,711,8467,313,4286,986,139306,840177,0367,006,5886,809,103Middle East Insurance2
2,639,5472,697,2946,540,2106,995,709644,420385,3702,304,9085,193,357993,8451,561,660993,8451,561,660National Insurance3
3,462,5694,039,5227,436,1548,681,68588,940158,419184,558147,5572,138,9742,236,382474,944615,214104,370474,944510,844United Insurance4
2,511,9892,186,1455,149,7166,613,44353,27477,750267,432205,5891,100,1271,541,162144,814241,3752,6982,698142,116238,677AL Manara Insurance5
1,944,0842,029,7396,929,1438,023,6236,00067,608637,635630,8311,118,9231,259,406833,354689,760833,354689,760Arabia Insurance - Jordan6
3,836,3404,419,2216,541,7627,215,27362,67262,86451,10161,3121,097,9441,099,3482,297,4592,145,5172,297,4592,145,517Jerusalem Insurance7
-2,454-825186,914212,241540,422521,8121,459,2122,101,012586,605696,710586,605696,710AL-Nisr Al-Arabi Insurance8
3,040,9763,071,8125,710,5245,653,062206,373387,758605,6141,079,05496,79515,482924,9131,158,2652,827,6171,805,0311,684,948852,7531,142,669952,278Jordan French Insurance9
1,173,9641,426,4685,036,3584,021,25634,89133,735233,841102,007251,218277,077251,218277,077Arab Union International Ins.10
857,0651,198,9696,552,1077,839,807181,214240,96061,00473,974143,284176,9401,754,7041,929,491642,897694,681642,897694,681Delta Insurance11
5,400,6193,040,4206,159,5474,087,20896,510105,669409,104410,644307,596206,141307,596206,141Jordan Emirates Insurance12
239135,188115,752136,27254,1556,223,9876,102,045606,708559,569606,708559,569Al Yarmouk Insurance13
2,005,3521,608,2926,640,0524,950,90120,81133,692276,913254,8347,4919,6377,4919,637Holy Land Insurance14
2,918,5673,826,0727,780,2178,955,674-39161,679157,20860,02962,410626,5421,662,413592,672388,204592,672388,204Arab Life & Accidents Ins.15
1,081,2121,035,4104,739,5574,465,5479,97910,2943,9423,92599,187106,52245,53345,86445,53345,864Philadelphia Insurance16
1,326,9701,258,86100MetLife Alico17
92,7831,662-2132213076,810318,8202,209,9691,448,9992,029,6832,030,3881,077,8131,092,889951,870937,499Jordan International Ins.18
2,588,0113,510,6436,036,4317,322,650110,307128,191305,626295,013882,925971,075425,594700,5821,346424,248700,582Euro Arab Insurance Group19
2,318,2822,299,0836,173,4777,232,918406,635472,1682,055,0831,630,630909,916881,132909,916881,132Islamic Insurance20
1,592,5221,672,6616,842,4365,460,7114,4312,726121,59499,94241,47167,345484,594509,743275,835291,769275,835291,769Arab Assurers21
1,803,1881,395,6585,234,0975,327,580200,866180,530726,421989,001337,316311,474337,316311,474Arab Jordanian Ins. Group22
10,372,18011,113,07210,536,24912,311,7136,051,3827,201,042815,572876,7437,726,9768,979,7402,326,9902,671,31965,90282,8822,261,0882,588,437Arab Orient Insurance23
2,714,2573,015,8206,215,3406,779,67815,87048,620136,702127,4182,263,7711,935,830603,825610,846603,825610,846MEDGULF Insurance24
1,614,5451,665,9016,855,2998,327,603654,958621,251225,069563,9545,817,5574,725,7381,111,5341,670,145371,185860,072740,349810,073First Insurance 25
65,318,88166,902,935136,353,271145,626,143397,979699,05211,469,71213,268,1296,178,9276,667,68968,339,55369,119,57128,086,63128,658,3793,510,7323,172,70024,575,89925,485,679
14
Other Branches
Table (10)
Credit InsuranceCompulsory(Third Party
(Liability Insurance
Motor
Underwritten Premiums for 25 Insurance Companies
MarineFire& Other Property
Damages
Companies Share of All Classes 2014 (JD)
Companies
Total
No.Liability Marine + Aviation
Comprehensive
(Own Damages)
Aviation

2013201420142014201320142013201420132014201320142013201420132014
6,985,5498,190,20110.559.9151,794,54552,093,39217,066,33519,490,50711,654,44213,348,3595,411,8936,142,14834,728,21032,602,88513,860,35215,130,1691
7.367.2936,122,95438,316,7127,521,2058,294,6503,538,1544,137,3863,983,0514,157,26428,601,74930,022,06210,738,13311,878,6822
3.414.0216,737,88721,136,1103,614,9574,302,720412,100377,9933,202,8573,924,72713,122,93016,833,3909,179,7579,693,0033
3.724.1218,272,40221,633,2414,486,2635,754,4621,331,6571,296,3053,154,6064,458,15713,786,13915,878,77910,898,72312,721,2074
2.062.1910,112,45911,506,612885,107641,148885,107641,1489,227,35210,865,4647,661,7058,799,5885
3.233.2515,880,89817,110,3824,411,7594,409,4151,886,9441,456,5332,524,8152,952,88211,469,13912,700,9678,873,22710,053,3626
3.153.1615,447,57416,599,7301,560,2961,596,195191,148195,0811,369,1481,401,11413,887,27815,003,53510,378,10211,634,4947
4.524.9122,197,39125,786,18419,427,51722,254,40910,988,40312,789,0188,439,1149,465,3912,769,8743,531,775-3,27908
4.194.4420,573,78423,333,5747,160,97210,163,1101,281,1581,394,3435,879,8148,768,76713,412,81213,170,4648,751,5008,724,8749
1.641.248,054,1876,533,1281,323,915672,5851,323,915672,5856,730,2725,860,5436,210,3225,447,72410
2.432.6811,907,54614,078,1401,715,2711,923,318109,522156,8131,605,7491,766,50510,192,27512,154,8227,409,1729,038,77611
3.211.7015,751,7268,925,1883,378,3501,075,1063,378,3501,075,10612,373,3767,850,08211,560,1667,127,62812
1.931.909,488,36210,008,6322,385,9683,177,111162,358387,1792,223,6102,789,9327,102,3946,831,521239013
1.821.308,950,6196,857,356008,950,6196,857,3568,645,4046,559,19314
1,438,7041,490,9093.073.5315,070,46518,561,2102,930,7983,509,229647,497640,1362,283,3012,869,09312,139,66715,051,98110,698,78412,781,74615
1.401.316,879,8356,900,976900,4251,233,414900,4251,233,4145,979,4105,667,5625,820,7695,500,95716
3.042.9314,902,09715,421,70813,575,12714,162,84710,601,56710,978,6452,973,5603,184,2021,326,9701,258,8610017
2.122.1010,410,64211,026,5326,001,2887,226,341476,114508,8665,525,1746,717,4754,409,3543,800,19192,7621,98418
2.773.5013,621,71818,419,1943,272,8245,491,040558,623808,0952,714,2014,682,94510,348,89412,928,1548,624,44210,833,293
4.024.0819,759,78921,451,5667,896,3968,935,6353,260,0104,186,9864,636,3864,748,64911,863,39312,515,9318,491,7599,532,00120
2.541.7712,483,9429,328,1863,121,0591,223,28917,5488873,103,5111,222,4029,362,8838,104,8978,434,9587,133,37221
2.132.1210,476,29511,162,0402,174,4072,957,797319,897433,8881,854,5102,523,9098,301,8888,204,2437,037,2856,723,23822
17.5218.0686,019,53694,949,63648,190,18751,796,00748,190,18751,796,00737,829,34943,153,62920,908,42923,424,78523
3.593.5617,617,93918,701,6575,668,1746,183,4455,668,1746,183,44511,949,76512,518,2128,929,5979,795,49824
4.564.9222,397,31325,867,0866,118,3518,292,4946,118,3518,292,49416,278,96217,574,5928,469,8449,993,50425
8,424,2539,681,110100100490,931,905525,708,172174,786,951194,766,27447,437,14253,096,513127,349,809141,669,761316,144,954330,941,898201,672,152212,529,078
15
Gross Underwritten
Premiums for Branches
Outside Jordan
Compulsory (Third Party
Liability Ins.) & Comprehensive
(Own Damages)
Total Motor
MedicalNon Life InsurancesCompanies
Gross Underwritten
Premiums
Arab Jordanian Ins. Group
19 Euro Arab Insurance Group
Table (10)
Jordan Insurance
No
.
Underwritten Premiums for 25 Insurance Companies
Jordan French Insurance
Companies Share of All Classes 2014 (JD)
Life
Jordan Emirates Insurance
Al Yarmouk Insurance
Middle East Insurance
National Insurance
United Insurance
AL Manara Insurance
MetLife Alico**
Jordan International Ins.
Islamic Insurance
Arab Orient Insurance
MEDGULF Insurance
First Insurance
Total
Arab Assurers
Arab Union International Ins.
Arabia Insurance - Jordan
Philadelphia Insurance
AL-Nisr Al-Arabi Insurance
Arab Life & Accidents Ins.
Holy Land Insurance
Jerusalem Insurance
Delta Insurance
Tbl. 2-2
Marketُs Share %Medical+Life

20132014201320142013201420132014201320142013201420132014
13,860,35215,130,1697,120,8137,132,4666,739,5397,997,703986,0091,050,7915,753,5306,946,9121,548,7031,630,4184,204,8275,316,494Jordan Insurance1
10,738,13311,878,6824,232,2314,516,6056,505,9027,362,077937,8571,038,1405,568,0456,323,9371,151,5851,152,5544,416,4605,171,383Middle East Insurance2
9,179,7579,693,0032,639,5472,697,2946,540,2106,995,709867,8561,032,1735,672,3545,963,5361,103,557906,0994,568,7975,057,437National Insurance3
10,898,72312,721,2073,462,5694,039,5227,436,1548,681,6851,746,1482,060,3005,690,0066,621,3851,162,5421,289,5304,527,4645,331,855United Insurance4
7,661,7058,799,5882,511,9892,186,1455,149,7166,613,443793,591957,5054,356,1255,655,938722,022524,1923,634,1035,131,746AL Manara Insurance5
8,873,22710,053,3621,944,0842,029,7396,929,1438,023,6231,886,6402,031,5375,042,5035,992,086630,712611,9924,411,7915,380,094Arabia Insurance-Jordan6
10,378,10211,634,4943,836,3404,419,2216,541,7627,215,273948,676961,1125,593,0866,254,1611,212,5691,360,4044,380,5174,893,757Jerusalem Insurance7
-3,2790-2,454-8250-8250-738-87AL-Nisr Al-Arabi Insurance *****8
8,751,5008,724,8743,040,9763,071,8125,710,5245,653,062782,552735,4494,927,9724,917,613948,307968,7543,979,6653,948,859Jordan French Insurance9
6,210,3225,447,7241,173,9641,426,4685,036,3584,021,256836,734607,5534,199,6243,413,703382,020495,7983,817,6042,917,905Arab Union International Ins.10
7,409,1729,038,776857,0651,198,9696,552,1077,839,8071,805,3282,001,9884,746,7795,837,819303,438476,2954,443,3415,361,524Delta Insurance11
11,560,1667,127,6285,400,6193,040,4206,159,5474,087,2081,230,987573,0484,928,5603,514,1602,424,9091,860,3722,503,6511,653,788Jordan Emirates Insurance12
23902390000Al Yarmouk Insurance ***13
8,645,4046,559,1932,005,3521,608,2926,640,0524,950,901602,10367,0086,037,9494,883,8934,371,8934,433,8181,666,056450,075Holy Land Insurance14
10,698,78412,781,7462,918,5673,826,0727,780,2178,955,6741,931,7932,053,7545,848,4246,901,9201,188,9321,507,5334,659,4925,394,387Arab Life & Accidents Ins.15
5,820,7695,500,9571,081,2121,035,4104,739,5574,465,5471,237,6731,137,2713,501,8843,328,276640,060596,4682,861,8242,731,808Philadelphia Insurance16
92,7621,98492,7831,662-21322-21322322-21Jordan International Ins. *****17
8,624,44210,833,2932,588,0113,510,6436,036,4317,322,650867,859996,0465,168,5726,326,604893,8711,246,5384,274,7015,080,066Euro Arab Insurance Group18
8,491,7599,532,0012,318,2822,299,0836,173,4777,232,918912,9791,068,3505,260,4986,164,5681,082,0671,094,8304,178,4315,069,738Islamic Insurance19
8,434,9587,133,3721,592,5221,672,6616,842,4365,460,711661,827427,1096,180,6095,033,6023,363,9682,661,9002,816,6412,371,702Arab Assurers20
7,037,2856,723,2381,803,1881,395,6585,234,0975,327,580613,097654,6174,621,0004,672,9631,827,0941,516,8392,793,9063,156,124Arab Jordanian Ins. Group21
20,908,42923,424,78510,372,18011,113,07210,536,24912,311,7131,869,2472,029,8638,667,00210,281,8502,813,7812,973,0515,853,2217,308,799Arab Orient Insurance22
8,929,5979,795,4982,714,2573,015,8206,215,3406,779,678985,385978,8005,229,9555,800,878876,192725,7174,353,7635,075,161MEDGULF Insurance23
8,469,8449,993,5041,614,5451,665,9016,855,2998,327,6031,880,7302,029,6754,974,5696,297,928906,0201,222,0904,068,5495,075,838First Insurance 24
201,672,152212,529,07865,318,88166,902,935136,353,271145,626,14324,385,07124,492,089111,968,200121,134,05429,553,50429,255,51482,414,69691,878,540
*
**
*******
*****
16
Table (11)
As in 31/12/2014 Compared with 31/12/2013(JD)
Compulsory T.P.L from
Comprehensive
Comprehensive
(Own Damages)
Compulsory T.P.L Foreign
VehiclesTotal Motors
NO.
Compulsory T.P.L
/Jordanian Vehicles**
Total
Both minus figures of premiums for Al-Nisr Al-Arabi Insurance Co. & Jordan International Ins. refer to the amounts repaid to the insured after policy cancellation.
Source: Financial Reports of 25 Insurance Companies.
The T.P.L Jordanian Vehicles Premiums include T.P.L Policies issued by the Unified Bureau & T.P.L Tenders premiums & orange card policies.
Insurance companies which Motor Insurance license was annulled by the Insurance Commission: Insurance companies revoked voluntary their Motor Insurance license:
1- Al Barakah Takaful since 12/12/2011.
3- Jordan International Insurance Co. since 14/3/2012.
Total Compulsory/T.P.LCompany
Motor Underwritten Premiums for 24 Insurance Companies*
Total Jordanian Vehicles
1- Al Yarmouk Insurance Co. since 12/12/2011.
2- Arab German Insurance Co. since 16/10/2012.2- AL-Nisr Al-Arabi Insurance Co. since 1/1/2012.
3- Gerasa Insurance Co. from 3/1/2012 & later the abnormal general assembly of the company decided to liquidate
the company voluntary in May 2013

Tbl. 1-4
Classification of companies according to (Life & Medical Premiums)
2014
Companies
Classification of companies according to(Non Life Insurances Premiums)
Companies
2013
Companies Classification & Share of Gross Written Premiums (Jordan) As in 31/12/2014 (JD)
(Allocated according to non life insurance, life & medical insurance & total written premiums)
Table (12)
Classification of companies according to (Gross Premiums)
NO
.
2013 20132014
Companies
2014
Non Life
Insurance
2014
Companies Companies
2013
NO,
Life & Medical
Insurance
NO.
Ranking
NO
. Companies
Share%
Companies
Share%
2013
Gross
Premiums
20132014
Companies
2014
Companies
Share%Companies
Share%
Companies
Share%Ranking
Companies
Share%Ranking
1 Arab Orient Insurance* 43,153,629 13.04 11.97 1 1 Arab Orient Insurance* 51,796,007 26.59 27.57 1 1 Arab Orient Insurance 94,949,636 18.06 17.52 1
2 Jordan Insurance 32,602,885 9.85 10.98 2 2 AL-Nisr Al-Arabi Insurance 22,254,409 11.43 11.11 2 2 Jordan Insurance 52,093,392 9.91 10.55 2
3 Middle East Insurance 30,022,062 9.07 9.05 3 3 Jordan Insurance 19,490,507 10.01 9.76 3 3 Middle East Insurance 38,316,712 7.29 7.36 3
4 First Insurance 17,574,592 5.31 5.15 4 4 Metlife Alico 14,162,847 7.27 7.77 4 4 First Insurance 25,867,086 4.92 4.56 4
5 National Insurance 16,833,390 5.09 4.15 8 5 Jordan French Insurance 10,163,110 5.22 4.10 7 5 AL-Nisr Al-Arabi Insurance 25,786,184 4.91 4.52 5
6 United Insurance 15,878,779 4.80 4.36 6 6 Islamic Insurance 8,935,635 4.59 4.52 5 6 Jordan French Insurance 23,333,574 4.44 4.19 6
7 Arab Life & Accidents Ins. 15,051,981 4.55 3.84 10 7 Middle East Insurance 8,294,650 4.26 4.30 6 7 United Insurance 21,633,241 4.12 3.72 8
8 Jerusalem Insuranceا 15,003,535 3.98 4.39 5 8 First Insurance* 8,292,494 4.26 3.50 8 8 Islamic Insurance 21,451,566 4.08 4.02 7
9 Jordan French Insurance 13,170,464 3.91 4.24 7 9 Jordan International Ins. 7,226,341 3.71 3.43 9 9 National Insurance 21,136,110 4.02 3.41 10
10 Euro Arab Insurance Group 12,928,154 3.91 3.27 14 10 MEDGULF Insurance* 6,183,445 3.17 3.24 10 10 MEDGULF Insurance 18,701,657 3.56 3.59 9
11 Arabia Insurance-Jordan 12,700,967 3.84 3.63 13 11 United Insurance 5,754,462 2.95 2.57 11 11 Arab Life & Accidents Ins. 18,561,210 3.53 3.07 14
12 MEDGULF Insurance 12,518,212 3.78 3.78 11 12 Euro Arab Insurance Group 5,491,040 2.82 1.87 15 12 Euro Arab Insurance Group 18,419,194 3.50 2.77 16
13 Islamic Insurance 12,515,931 3.78 3.75 12 13 Arabia Insurance-Jordan 4,409,415 2.26 2.52 12 13 Arabia Insurance-Jordan 17,110,382 3.25 3.23 11
14 Delta Insurance 12,154,822 3.67 3.22 15 14 National Insurance 4,302,720 2.21 2.07 13 14 Jerusalem Insurance 16,599,730 3.16 3.15 13
15 AL Manara Insurance 10,865,464 3.28 2.92 17 15 Arab Life & Accidents Ins. 3,509,229 1.80 1.68 17 15 Metlife Alico 15,421,708 2.93 3.04 15
16 Arab Jordanian Ins. Group 8,204,243 2.48 2.63 19 16 Al Yarmouk Insurance 3,177,111 1.63 1.37 18 16 Delta Insurance 14,078,140 2.68 2.43 18
17 Arab Assurers 8,104,897 2.45 2.96 16 17 Arab Jordanian Ins. Group 2,957,797 1.52 1.24 19 17 AL Manara Insurance 11,506,612 2.19 2.06 21
18 Jordan Emirates Insurance 7,850,082 2.37 3.91 9 18 Delta Insurance 1,923,318 0.99 0.98 20 18 Arab Jordanian Ins. Group 11,162,040 2.12 2.13 19
19 Holy Land Insurance 6,857,356 2.06 2.83 18 19 Jerusalem Insurance 1,596,195 0.82 0.89 21 19 Jordan International Ins. 11,026,532 2.10 2.12 20
20 Al Yarmouk Insurance 6,831,521 1.77 2.25 20 20 Philadelphia Insurance* 1,233,414 0.63 0.52 23 20 Al Yarmouk Insurance 10,008,632 1.90 1.93 22
21 Arab Union International Ins. 5,860,543 1.77 2.13 21 21 Arab Assurers 1,223,289 0.63 1.79 16 21 Arab Assurers 9,328,186 1.77 2.54 17
22 Philadelphia Insurance 5,667,562 1.71 1.89 22 22 Jordan Emirates Insurance* 1,075,106 0.55 1.93 14 22 Jordan Emirates Insurance 8,925,188 1.70 3.21 12
23 Jordan International Ins. 3,800,191 1.15 1.39 23 23 Arab Union International Ins.* 672,585 0.35 0.76 22 23 Philadelphia Insurance 6,900,976 1.31 1.4 25
24 AL-Nisr Al-Arabi Insurance 3,531,775 1.07 0.88 24 24 AL Manara Insurance * 641,148 0.33 0.51 24 24 Holy Land Insurance 6,857,356 1.30 1.82 23
25 Metlife Alico* 1,258,861 0.38 0.42 25 25 Holy Land Insurance** 25 Arab Union International Ins. 6,533,128 1.24 1.64 24
330,941,898 100 100 194,766,274 100 100 525,708,172 100 100
* *
**
17
Non Life
Insurance
Companies
Total Total
Companies
NO,
Life & Medical
Insurance
The company doesn’t practice Life & Medical Insurance
The company practices Medical Insurance only.
Total
NO.
The company figuers represented personal accidents branch
bussiness.
Ranking
NO
. Companies
Share%
Companies
Share%
Gross
Premiums
CompaniesCompanies
Share%Companies
Share%
Companies
Share%Ranking
Companies
Share%Ranking

No.
Companies
Share%Ranking
Companies
2013
Written
Premiums
Written
Premiums
Table (12)
Companies Classification & Share of Gross Written Premiums Per Class As in 31/12/2014 (JD)
No.
Marine & Transport & Aviation Fire & Other Property Damages
Companies
Share%
Companies
Share%
Tbl. 2-4
2014Companies
2013 2014
Companies
Share%Ranking
1 Middle East Insurance 6,986,139 24.38 26.04 1 1 Jordan Insurance 13,060,081 18.89 24.97 1
2 Arab Orient Insurance 2,671,319 9.32 8.29 3 2 Middle East Insurance 9,711,846 14.05 13.66 2
3 Jordan Insurance 2,568,145 8.96 7.62 5 3 Arab Orient Insurance 8,979,740 12.99 11.31 3
4 Jerusalem Insurance 2,145,517 7.49 8.18 4 4 Al Yarmouk Insurance 6,102,045 8.83 9.11 4
5 Jordan International Ins. 2,030,388 7.08 7.23 6 5 National Insurance 5,193,357 7.51 3.37 6
6 Jordan French Insurance 1,805,031 6.30 10.07 2 6 First Insurance 4,725,738 6.84 8.51 5
7 First Insurance 1,670,145 5.83 3.96 7 7 United Insurance 2,236,382 3.24 3.13 9
8 National Insurance 1,561,660 5.45 3.54 8 8 AL-Nisr Al-Arabi Insurance 2,101,012 3.04 2.14 12
9 Islamic Insurance 881,132 3.07 3.24 9 9 MEDGULF Insurance 1,935,830 2.80 3.31 7
10 Euro Arab Insurance Group 700,582 2.44 1.52 17 10 Delta Insurance 1,929,491 2.79 2.57 11
11 AL-Nisr Al-Arabi Insurance 696,710 2.43 2.09 15 11 Arab Life & Accidents Ins. 1,662,413 2.41 0.92 19
12 Delta Insurance 694,681 2.42 2.29 11 12 Islamic Insurance 1,630,630 2.36 3.01 10
13 Arabia Insurance-Jordan 689,760 2.41 2.97 10 13 AL Manara Insurance 1,541,162 2.23 1.61 14
14 United Insurance 615,214 2.15 1.69 16 14 Jordan International Ins. 1,448,999 2.10 3.23 8
15 MEDGULF Insurance 610,846 2.13 2.15 13 15 Arabia Insurance-Jordan 1,259,406 1.82 1.64 13
16 Al Yarmouk Insurance 559,569 1.95 2.16 12 16 Jordan French Insurance 1,158,265 1.68 1.35 16
17 Arab Life & Accidents Ins. 388,204 1.35 2.11 14 17 Jerusalem Insurance 1,099,348 1.59 1.61 15
18 Arab Jordanian Ins. Group 311,474 1.09 1.20 18 18 Arab Jordanian Ins. Group 989,001 1.43 1.06 18
19 Arab Assurers 291,769 1.02 0.98 20 19 Euro Arab Insurance Group 971,075 1.40 1.29 17
20 Arab Union International Ins. 277,077 0.97 0.89 21 20 Arab Assurers 509,743 0.74 0.71 20
21 AL Manara Insurance 241,375 0.84 0.52 22 21 Jordan Emirates Insurance 410,644 0.59 0.60 21
22 Jordan Emirates Insurance 206,141 0.72 1.10 19 22 Holy Land Insurance 254,834 0.37 0.41 22
23 Philadelphia Insurance 45,864 0.16 0.16 23 23 Philadelphia Insurance 106,522 0.15 0.15 24
24 Holy Land Insurance 9,637 0.03 0.03 24 24 Arab Union International Ins. 102,007 0.15 0.34 23
25 MetLife Alico* 25 MetLife Alico*
28,658,379 100 100 69,119,571 100 100
*
No.
Companies
Share%Ranking
Total
CompaniesWritten
Premiums
Written
Premiums
No.
Companies
Share%
Companies
Share%
18
Companies
Total
Companies
Share%Ranking
The company licensed only Medical, Life Assurance and Personal Accidents.

Tbl. 3-4
Written Premiums
No.
Companies
Share%
Motor(Compulsory(Third Party Liability Insurance)&Comprehensive(Own Damages))
Companies
Share%
Companies
Share%Ranking
2014
RankingWritten
Premiums
2013
No.
CompaniesCompanies
Table (12)
Companies Classification & Share of Gross Written Premiums Per Class As in 31/12/2014 (JD)
2014 2013
General Accident
Companies
Share%
1 Arab Orient Insurance 8,077,786 40.52 38.91 1 1 Arab Orient Insurance 23,424,785 11.02 10.37 1
2 Jordan Insurance 1,844,490 9.25 9.41 2 2 Jordan Insurance 15,130,169 7.12 6.87 2
3 Middle East Insurance 1,445,395 7.25 6.88 4 3 Arab Life & Accidents Ins. 12,781,746 6.01 5.31 6
4 MetLife Alico 1,258,861 6.31 7.52 3 4 United Insurance 12,721,207 5.99 5.40 4
5 First Insurance 1,185,205 5.95 4.99 5 5 Middle East Insurance 11,878,682 5.59 5.32 5
6 Jordan French Insurance 1,094,536 5.49 3.98 7 6 Jerusalem Insurance 11,634,494 5.47 5.15 7
7 AL-Nisr Al-Arabi Insurance 734,053 3.68 4.12 6 7 Euro Arab Insurance Group 10,833,293 5.10 4.28 13
8 Arabia Insurance-Jordan 630,831 3.16 3.61 9 8 Arabia Insurance-Jordan 10,053,362 4.73 4.40 10
9 Islamic Insurance 472,168 2.37 2.30 11 9 First Insurance 9,993,504 4.70 4.20 15
10 Euro Arab Insurance Group 423,204 2.12 2.36 10 10 MEDGULF Insurance 9,795,498 4.61 4.43 9
11 National Insurance 385,370 1.93 3.65 8 11 National Insurance 9,693,003 4.56 4.55 8
12 Jordan International Ins. 318,820 1.60 0.44 22 12 Islamic Insurance 9,532,001 4.49 4.21 14
13 United Insurance 305,976 1.53 1.55 13 13 Delta Insurance 9,038,776 4.25 3.67 18
14 AL Manara Insurance 283,339 1.42 1.82 12 14 Jordan French Insurance 8,724,874 4.11 4.34 11
15 Delta Insurance 250,914 1.26 1.16 16 15 AL Manara Insurance 8,799,588 4.14 3.80 17
16 Arab Life & Accidents Ins. 219,618 1.10 1.26 15 16 Arab Assurers 7,133,372 3.36 4.18 16
17 Arab Jordanian Ins. Group 180,530 0.91 1.14 17 17 Jordan Emirates Insurance 7,127,628 3.35 5.73 3
18 MEDGULF Insurance 176,038 0.88 0.86 19 18 Arab Jordanian Ins. Group 6,723,238 3.16 3.49 19
19 Al Yarmouk Insurance 169,907 0.85 1.54 14 19 Holy Land Insurance 6,559,193 3.09 4.29 12
20 Arab Assurers 167,287 0.84 0.92 18 20 Philadelphia Insurance 5,500,957 2.59 2.89 21
21 Jerusalem Insurance 124,176 0.62 0.64 20 21 Arab Union International Ins. 5,447,724 2.56 3.08 20
22 Jordan Emirates Insurance 105,669 0.53 0.55 21 22 Jordan International Ins. 1,984 0.001 0.05 22
23 Arab Union International Ins. 33,735 0.17 0.20 23 23 Al Yarmouk Insurance*
24 Holy Land Insurance 33,692 0.17 0.12 24 24 AL-Nisr Al-Arabi Insurance*
25 Philadelphia Insurance 14,218 0.07 0.08 25 25 MetLife Alico**
19,935,818 100 100 212,529,078 100 100
***
19
Written Premiums
No.
The company annulled its motor insurance license.
Companies
Share%
Companies
Share%
Companies
Share%RankingRanking
Written
Premiums
No.
CompaniesCompanies
The company licensed only Medical, Life Assurance and
Personal Accidents.
Total
Companies
Share%
Total

Tbl. 4-4
RankingWritten
Premiums
Written
Premiums
2013
Companies
Share%Ranking
No.
Companies
Share%
No.
Companies CompaniesCompanies
Share%
Companies
Share%
Table (12)
Companies Classification & Share of Gross Written Premiums Per Class As in 31/12/2014 (JD)
20142014
Life2013
Medical
1 Jordan Insurance 13,348,359 25.14 24.57 1 1 Arab Orient Insurance 51,796,007 36.56 37.84 1
2 AL-Nisr Al-Arabi Insurance 12,789,018 24.09 23.16 2 2 AL-Nisr Al-Arabi Insurance 9,465,391 6.68 6.63 2
3 MetLife Alico 10,978,645 20.68 22.35 3 3 Jordan French Insurance 8,768,767 6.19 4.62 4
4 Islamic Insurance 4,186,986 7.89 6.87 5 4 First Insurance 8,292,494 5.85 4.80 3
5 Middle East Insurance 4,137,386 7.79 7.46 4 5 Jordan International Ins. 6,717,475 4.74 4.34 6
6 Arabia Insurance-Jordan 1,456,533 2.74 3.98 6 6 MEDGULF Insurance 6,183,445 4.36 4.45 5
7 Jordan French Insurance 1,394,343 2.63 2.70 8 7 Jordan Insurance 6,142,148 4.34 4.25 7
8 United Insurance 1,296,305 2.44 2.81 7 8 Islamic Insurance 4,748,649 3.35 3.64 8
9 Euro Arab Insurance Group 808,095 1.52 1.18 10 9 Euro Arab Insurance Group 4,682,945 3.31 2.13 15
10 Arab Life & Accidents Ins. 640,136 1.21 1.36 9 10 United Insurance 4,458,157 3.15 2.48 12
11 Jordan International Ins. 508,866 0.96 1.00 11 11 Middle East Insurance 4,157,264 2.93 3.13 9
12 Arab Jordanian Ins. Group 433,888 0.82 0.67 13 12 National Insurance 3,924,727 2.77 2.52 11
13 Al Yarmouk Insurance 387,179 0.73 0.34 15 13 MetLife Alico 3,184,202 2.25 2.33 14
14 National Insurance 377,993 0.71 0.87 12 14 Arabia Insurance-Jordan 2,952,882 2.08 1.98 16
15 Jerusalem Insurance 195,081 0.37 0.40 14 15 Arab Life & Accidents Ins. 2,869,093 2.03 1.79 17
16 Delta Insurance 156,813 0.30 0.23 16 16 Al Yarmouk Insurance 2,789,932 1.97 1.75 18
17 Arab Assurers 887 0.002 17 Arab Jordanian Ins. Group 2,523,909 1.78 1.46 19
18 AL Manara Insurance 18 Delta Insurance 1,766,505 1.25 1.26 20
19 Arab Union International Ins. 19 Jerusalem Insurance 1,401,114 0.99 1.08 21
20 Jordan Emirates Insurance 20 Philadelphia Insurance 1,233,414 0.87 0.71 23
21 Holy Land Insurance 21 Arab Assurers 1,222,402 0.86 2.44 13
22 Philadelphia Insurance 22 Jordan Emirates Insurance 1,075,106 0.76 2.65 10
23 Arab Orient Insurance 23 Arab Union International Ins. 672,585 0.47 1.04 22
24 MEDGULF Insurance 24 AL Manara Insurance 641,148 0.45 0.70 24
25 First Insurance 25 Holy Land Insurance
53,096,513 100 100 141,669,761 100 100
* *
20
Ranking
Total Total
Written
Premiums
Written
Premiums
Companies
Share%Ranking
No.
Companies
Share%
No.
Companies CompaniesCompanies
Share%
Companies
Share%
The Companies under No.18-25 don`t practice life insurance. The company under No. 25 dosen`t practice medical insurance.

Companies Share % in Paid Claims 2014
Arab Jordanian Ins. Group; 2.3Holy Land Insurance; 2.2
Delta Insurance; 2.2 MetLife Alico; 2.2
Philadelphia Insurance; 2 Arab Union International Ins.; 1.7
Al Yarmouk Insurance; 0.8
Arab Orient Insurance; 18.9
Jordan Insurance; 11.8United Insurance; 2.9
Jerusalem Insurance; 2.7
Arab Orient Insurance; 2.6
Arab Assurers; 2.5
Arab Jordanian Ins. Group; 2.3
Jordan Insurance; 11.8
Arab Life & Accidents Ins., 2.9
Jordan Emirates Insurance, 2.9
United Insurance; 2.9
Middle East Insurance; 5.1
Jordan French Insurance; 4.8
First Insurance ; 4.3
MEDGULF Insurance; 3.8
National Insurance; 3.7Arabia Insurance - Jordan; 3.6
Islamic Insurance; 3.5
AL-Nisr Al-Arabi Insurance, 3.5
Euro Arab Insurance Group, 3.4
MEDGULF Insurance; 3.8
AL Manara Insurance; 3.7
Arabia Insurance - Jordan; 3.6
21
Tbl. 1-2
201320142013201420132014201320142013201420132014201320142013201420132014
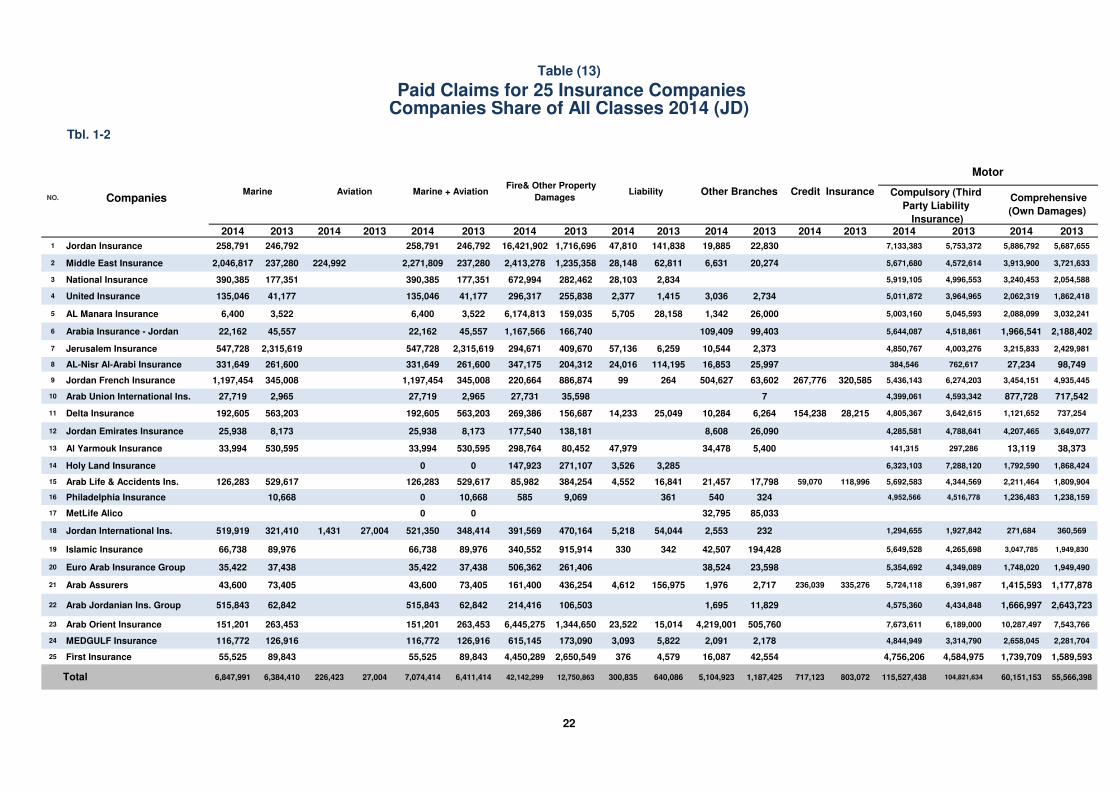
5,687,6555,886,7925,753,3727,133,38322,83019,885141,83847,8101,716,69616,421,902246,792258,791246,792258,791Jordan Insurance1
3,721,6333,913,9004,572,6145,671,68020,2746,63162,81128,1481,235,3582,413,278237,2802,271,809224,992237,2802,046,817Middle East Insurance2
2,054,5883,240,4534,996,5535,919,1052,83428,103282,462672,994177,351390,385177,351390,385National Insurance3
1,862,4182,062,3193,964,9655,011,8722,7343,0361,4152,377255,838296,31741,177135,04641,177135,046United Insurance4
3,032,2412,088,0995,045,5935,003,16026,0001,34228,1585,705159,0356,174,8133,5226,4003,5226,400AL Manara Insurance5
2,188,4021,966,5414,518,8615,644,08799,403109,409166,7401,167,56645,55722,16245,55722,162Arabia Insurance - Jordan6
2,429,9813,215,8334,003,2764,850,7672,37310,5446,25957,136409,670294,6712,315,619547,7282,315,619547,728Jerusalem Insurance7
98,74927,234762,617384,54625,99716,853114,19524,016204,312347,175261,600331,649261,600331,649AL-Nisr Al-Arabi Insurance8
4,935,4453,454,1516,274,2035,436,143320,585267,77663,602504,62726499886,874220,664345,0081,197,454345,0081,197,454Jordan French Insurance9
717,542877,7284,593,3424,399,061735,59827,7312,96527,7192,96527,719Arab Union International Ins.10
737,2541,121,6523,642,6154,805,36728,215154,2386,26410,28425,04914,233156,687269,386563,203192,605563,203192,605Delta Insurance11
3,649,0774,207,4654,788,6414,285,58126,0908,608138,181177,5408,17325,9388,17325,938Jordan Emirates Insurance12
38,37313,119297,286141,3155,40034,47847,97980,452298,764530,59533,994530,59533,994Al Yarmouk Insurance13
1,868,4241,792,5907,288,1206,323,1033,2853,526271,107147,92300Holy Land Insurance14
1,809,9042,211,4644,344,5695,692,583118,99659,07017,79821,45716,8414,552384,25485,982529,617126,283529,617126,283Arab Life & Accidents Ins.15
1,238,1591,236,4834,516,7784,952,5663245403619,06958510,668010,668Philadelphia Insurance16
85,03332,79500MetLife Alico17
360,569271,6841,927,8421,294,6552322,55354,0445,218470,164391,569348,414521,35027,0041,431321,410519,919Jordan International Ins.18
1,949,8303,047,7854,265,6985,649,528194,42842,507342330915,914340,55289,97666,73889,97666,738Islamic Insurance19
1,949,4901,748,0204,349,0895,354,69223,59838,524261,406506,36237,43835,42237,43835,422Euro Arab Insurance Group20
1,177,8781,415,5936,391,9875,724,118335,276236,0392,7171,976156,9754,612436,254161,40073,40543,60073,40543,600Arab Assurers21
2,643,7231,666,9974,434,8484,575,36011,8291,695106,503214,41662,842515,84362,842515,843Arab Jordanian Ins. Group22
7,543,76610,287,4976,189,0007,673,611505,7604,219,00115,01423,5221,344,6506,445,275263,453151,201263,453151,201Arab Orient Insurance23
2,281,7042,658,0453,314,7904,844,9492,1782,0915,8223,093173,090615,145126,916116,772126,916116,772MEDGULF Insurance24
1,589,5931,739,7094,584,9754,756,20642,55416,0874,5793762,650,5494,450,28989,84355,52589,84355,525First Insurance 25
55,566,39860,151,153104,821,634115,527,438803,072717,1231,187,4255,104,923640,086300,83512,750,86342,142,2996,411,4147,074,41427,004226,4236,384,4106,847,991
Marine
22
Total
NO.Compulsory (Third
Party Liability
Insurance)
Companies Aviation
Table (13)
Paid Claims for 25 Insurance CompaniesCompanies Share of All Classes 2014 (JD)
Other Branches Credit Insurance Comprehensive
(Own Damages)
Motor
Marine + Aviation Fire& Other Property
DamagesLiability

Tbl. 2-2
2014201420142014201320142013201420132014201320142013201420132014
3,450,4704,727,0648.6211.7927,337,03143,951,70513,767,84814,183,1429,273,3979,756,9994,494,4514,426,14313,569,18329,768,56311,441,02713,020,1751
4.445.0914,078,08718,980,8174,228,1174,675,3711,159,5611,674,8643,068,5563,000,5079,849,97014,305,4468,294,2479,585,5802
3.103.699,817,33613,754,3152,303,5483,503,275176,205366,9222,127,3433,136,3537,513,78810,251,0407,051,1419,159,5583
2.622.938,309,57010,939,1152,181,0233,428,148524,736571,7551,656,2872,856,3936,128,5477,510,9675,827,3837,074,1914
2.833.778,977,58314,049,925683,034770,406683,034770,4068,294,54913,279,5198,077,8347,091,2595
3.203.6410,132,41213,583,4973,113,4494,673,7321,170,4962,245,1731,942,9532,428,5597,018,9638,909,7656,707,2637,610,6286
3.192.6910,114,22110,035,276947,0431,058,59786,17469,397860,869989,2009,167,1788,976,6796,433,2578,066,6007
3.473.4710,985,54312,944,1709,518,07311,812,6973,468,1824,698,0696,049,8917,114,6281,467,4701,131,473861,366411,7808
5.824.7618,447,17317,767,7295,621,1926,686,815439,728311,8095,181,4646,375,00612,825,98111,080,91411,209,6488,890,2949
2.511.697,951,5086,297,9272,602,054965,6882,602,054965,6885,349,4545,332,2395,310,8845,276,78910
2.022.166,410,3008,039,8481,251,0131,472,08316,08815,0511,234,9251,457,0325,159,2876,567,7654,379,8695,927,01911
4.422.9514,026,94110,993,3045,416,7792,288,1725,416,7792,288,1728,610,1628,705,1328,437,7188,493,04612
0.720.802,279,6152,987,2541,327,5092,417,605182,520232,5951,144,9892,185,010952,106569,649335,659154,43413
2.972.229,430,9368,267,142009,430,9368,267,1429,156,5448,115,69314
1,009,889776,3563.002.979,512,51611,062,5992,290,5372,861,208334,966172,6571,955,5712,688,5517,221,9798,201,3916,154,4737,904,04715
1.952.006,176,9157,439,721401,5561,249,547401,5561,249,5475,775,3596,190,1745,754,9376,189,04916
2.172.116,887,0047,865,3666,801,9717,832,5715,035,1255,630,4951,766,8462,202,07685,03332,7950017
2.812.578,901,3309,578,9565,740,0657,091,927519,146518,2615,220,9196,573,6663,161,2652,487,0292,288,4111,566,33918
3.393.4010,744,89212,690,3583,328,7043,542,918803,114511,9032,525,5903,031,0157,416,1889,147,4406,215,5288,697,31319
3.833.5312,153,63313,171,4525,532,6125,488,4321,067,5781,435,7164,465,0344,052,7166,621,0217,683,0206,298,5797,102,71220
3.362.4510,637,1539,144,4642,062,6611,557,12617,9578,9912,044,7041,548,1358,574,4927,587,3387,569,8657,139,71121
2.562.318,123,5378,618,722863,7921,644,411232,398322,182631,3941,322,2297,259,7456,974,3117,078,5716,242,35722
19.4418.9661,633,01270,717,23645,771,36941,917,12945,771,36941,917,12915,861,64328,800,10713,732,76617,961,10823
3.703.8011,714,56914,160,8195,810,0695,920,7245,810,0695,920,7245,904,5008,240,0955,596,4947,502,99424
3.864.2612,246,17515,875,8343,284,0824,857,6423,284,0824,857,6428,962,09311,018,1926,174,5686,495,91525
4,460,3595,503,420100100317,028,992372,917,551134,848,100141,899,36624,507,37128,542,839110,340,729113,356,527182,180,892231,018,185160,388,032175,678,591
23
Life
Paid Claims for 25 Insurance CompaniesCompanies Share of All Classes 2014 (JD)
Table (13)
NO.
United Insurance
Middle East Insurance
National Insurance
Medical+LifeMedicalCompanies
Euro Arab Insurance Group
AL Manara Insurance
Arabia Insurance - Jordan
AL-Nisr Al-Arabi Insurance
Jerusalem Insurance
Marketُs Share %Gross Paid Claims Non Life Insurances
Total Motor
Compulsory (Third Party Liability
Ins.) & Comprehensive (Own
Damages)
Arab Union International Ins.
Jordan Emirates Insurance
Philadelphia Insurance
Jordan French Insurance
MetLife Alico*
Arab Life & Accidents Ins.
Holy Land Insurance
Al Yarmouk Insurance
Delta Insurance
Gross Paid Claims for
Branches Outside
Jordan
Islamic Insurance
Total
Arab Jordanian Ins. Group
Arab Orient Insurance
MEDGULF Insurance
First Insurance
Arab Assurers
Jordan International Ins.
Jordan Insurance
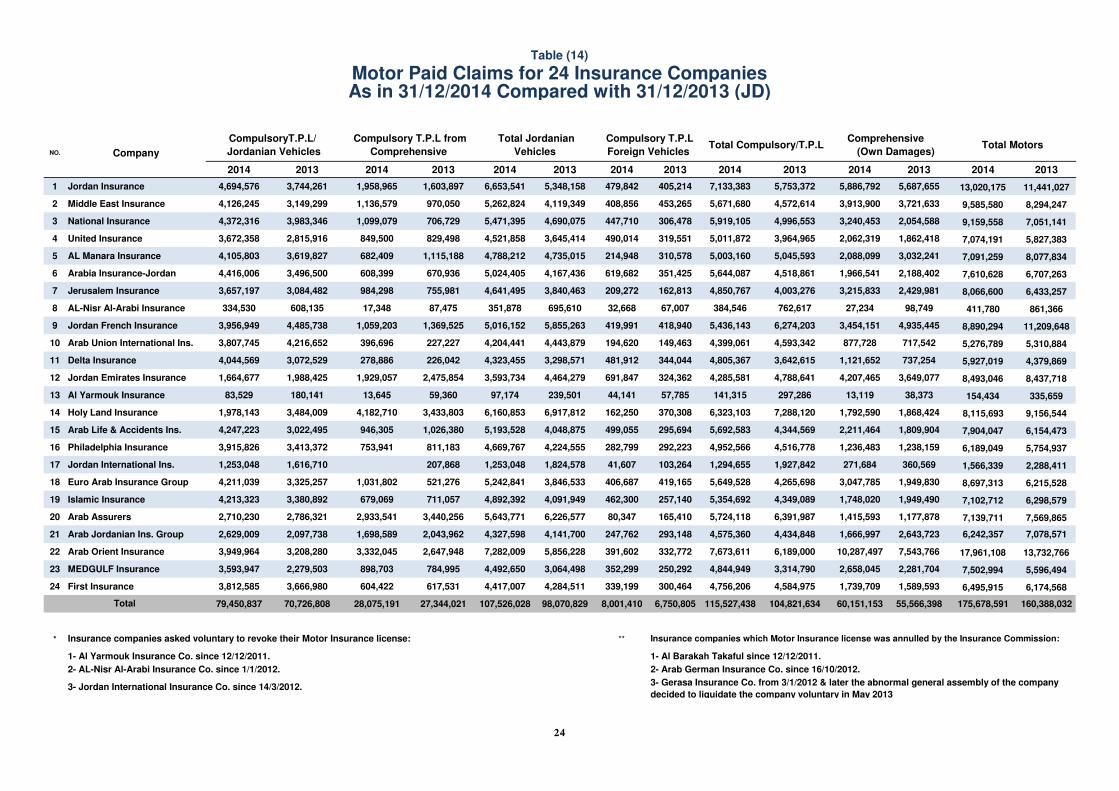
20132014201320142013201420132014201320142013201420132014
11,441,02713,020,1755,687,6555,886,7925,753,3727,133,383405,214479,8425,348,1586,653,5411,603,8971,958,9653,744,2614,694,576Jordan Insurance1
8,294,2479,585,5803,721,6333,913,9004,572,6145,671,680453,265408,8564,119,3495,262,824970,0501,136,5793,149,2994,126,245Middle East Insurance2
7,051,1419,159,5582,054,5883,240,4534,996,5535,919,105306,478447,7104,690,0755,471,395706,7291,099,0793,983,3464,372,316National Insurance3
5,827,3837,074,1911,862,4182,062,3193,964,9655,011,872319,551490,0143,645,4144,521,858829,498849,5002,815,9163,672,358United Insurance4
8,077,8347,091,2593,032,2412,088,0995,045,5935,003,160310,578214,9484,735,0154,788,2121,115,188682,4093,619,8274,105,803AL Manara Insurance5
6,707,2637,610,6282,188,4021,966,5414,518,8615,644,087351,425619,6824,167,4365,024,405670,936608,3993,496,5004,416,006Arabia Insurance-Jordan6
6,433,2578,066,6002,429,9813,215,8334,003,2764,850,767162,813209,2723,840,4634,641,495755,981984,2983,084,4823,657,197Jerusalem Insurance7
861,366411,78098,74927,234762,617384,54667,00732,668695,610351,87887,47517,348608,135334,530AL-Nisr Al-Arabi Insurance8
11,209,6488,890,2944,935,4453,454,1516,274,2035,436,143418,940419,9915,855,2635,016,1521,369,5251,059,2034,485,7383,956,949Jordan French Insurance9
5,310,8845,276,789717,542877,7284,593,3424,399,061149,463194,6204,443,8794,204,441227,227396,6964,216,6523,807,745Arab Union International Ins.10
4,379,8695,927,019737,2541,121,6523,642,6154,805,367344,044481,9123,298,5714,323,455226,042278,8863,072,5294,044,569Delta Insurance11
8,437,7188,493,0463,649,0774,207,4654,788,6414,285,581324,362691,8474,464,2793,593,7342,475,8541,929,0571,988,4251,664,677Jordan Emirates Insurance12
335,659154,43438,37313,119297,286141,31557,78544,141239,50197,17459,36013,645180,14183,529Al Yarmouk Insurance13
9,156,5448,115,6931,868,4241,792,5907,288,1206,323,103370,308162,2506,917,8126,160,8533,433,8034,182,7103,484,0091,978,143Holy Land Insurance14
6,154,4737,904,0471,809,9042,211,4644,344,5695,692,583295,694499,0554,048,8755,193,5281,026,380946,3053,022,4954,247,223Arab Life & Accidents Ins.15
5,754,9376,189,0491,238,1591,236,4834,516,7784,952,566292,223282,7994,224,5554,669,767811,183753,9413,413,3723,915,826Philadelphia Insurance16
2,288,4111,566,339360,569271,6841,927,8421,294,655103,26441,6071,824,5781,253,048207,8681,616,7101,253,048Jordan International Ins.17
6,215,5288,697,3131,949,8303,047,7854,265,6985,649,528419,165406,6873,846,5335,242,841521,2761,031,8023,325,2574,211,039Euro Arab Insurance Group18
6,298,5797,102,7121,949,4901,748,0204,349,0895,354,692257,140462,3004,091,9494,892,392711,057679,0693,380,8924,213,323Islamic Insurance19
7,569,8657,139,7111,177,8781,415,5936,391,9875,724,118165,41080,3476,226,5775,643,7713,440,2562,933,5412,786,3212,710,230Arab Assurers20
7,078,5716,242,3572,643,7231,666,9974,434,8484,575,360293,148247,7624,141,7004,327,5982,043,9621,698,5892,097,7382,629,009Arab Jordanian Ins. Group21
13,732,76617,961,1087,543,76610,287,4976,189,0007,673,611332,772391,6025,856,2287,282,0092,647,9483,332,0453,208,2803,949,964Arab Orient Insurance22
5,596,4947,502,9942,281,7042,658,0453,314,7904,844,949250,292352,2993,064,4984,492,650784,995898,7032,279,5033,593,947MEDGULF Insurance23
6,174,5686,495,9151,589,5931,739,7094,584,9754,756,206300,464339,1994,284,5114,417,007617,531604,4223,666,9803,812,585First Insurance 24
160,388,032175,678,59155,566,39860,151,153104,821,634115,527,4386,750,8058,001,41098,070,829107,526,02827,344,02128,075,19170,726,80879,450,837
***
Motor Paid Claims for 24 Insurance Companies
Total Compulsory/T.P.L Total Jordanian
Vehicles
Comprehensive
(Own Damages) CompanyTotal Motors
NO.
24
Total
Table (14)
1- Al Yarmouk Insurance Co. since 12/12/2011.
2- AL-Nisr Al-Arabi Insurance Co. since 1/1/2012.
3- Jordan International Insurance Co. since 14/3/2012.
1- Al Barakah Takaful since 12/12/2011.
As in 31/12/2014 Compared with 31/12/2013 (JD)
Insurance companies asked voluntary to revoke their Motor Insurance license: Insurance companies which Motor Insurance license was annulled by the Insurance Commission:
CompulsoryT.P.L/
Jordanian Vehicles
Compulsory T.P.L from
Comprehensive
Compulsory T.P.L
Foreign Vehicles
2- Arab German Insurance Co. since 16/10/2012.
3- Gerasa Insurance Co. from 3/1/2012 & later the abnormal general assembly of the company
decided to liquidate the company voluntary in May 2013
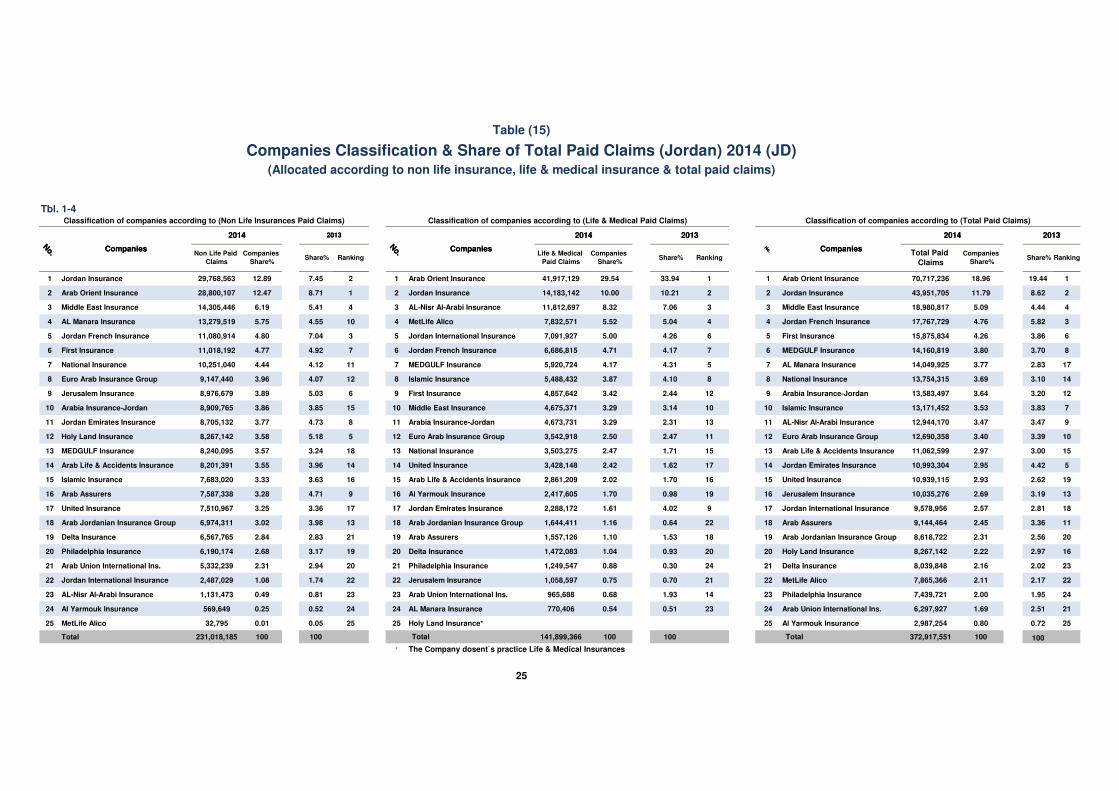
Table (15)
Companies Classification & Share of Total Paid Claims (Jordan) 2014 (JD)(Allocated according to non life insurance, life & medical insurance & total paid claims)
Classification of companies according to (Non Life Insurances Paid Claims) Classification of companies according to (Life & Medical Paid Claims) Classification of companies according to (Total Paid Claims)
Tbl. 1-4
20132014
Companies
No.
No.
2013 2014
Companies
2014
CompaniesNo.
2013
1 Jordan Insurance 29,768,563 12.89 7.45 2 1 Arab Orient Insurance 41,917,129 29.54 33.94 1 1 Arab Orient Insurance 70,717,236 18.96 19.44 1
2 Arab Orient Insurance 28,800,107 12.47 8.71 1 2 Jordan Insurance 14,183,142 10.00 10.21 2 2 Jordan Insurance 43,951,705 11.79 8.62 2
3 Middle East Insurance 14,305,446 6.19 5.41 4 3 AL-Nisr Al-Arabi Insurance 11,812,697 8.32 7.06 3 3 Middle East Insurance 18,980,817 5.09 4.44 4
4 AL Manara Insurance 13,279,519 5.75 4.55 10 4 MetLife Alico 7,832,571 5.52 5.04 4 4 Jordan French Insurance 17,767,729 4.76 5.82 3
5 Jordan French Insurance 11,080,914 4.80 7.04 3 5 Jordan International Insurance 7,091,927 5.00 4.26 6 5 First Insurance 15,875,834 4.26 3.86 6
6 First Insurance 11,018,192 4.77 4.92 7 6 Jordan French Insurance 6,686,815 4.71 4.17 7 6 MEDGULF Insurance 14,160,819 3.80 3.70 8
7 National Insurance 10,251,040 4.44 4.12 11 7 MEDGULF Insurance 5,920,724 4.17 4.31 5 7 AL Manara Insurance 14,049,925 3.77 2.83 17
8 Euro Arab Insurance Group 9,147,440 3.96 4.07 12 8 Islamic Insurance 5,488,432 3.87 4.10 8 8 National Insurance 13,754,315 3.69 3.10 14
9 Jerusalem Insurance 8,976,679 3.89 5.03 6 9 First Insurance 4,857,642 3.42 2.44 12 9 Arabia Insurance-Jordan 13,583,497 3.64 3.20 12
10 Arabia Insurance-Jordan 8,909,765 3.86 3.85 15 10 Middle East Insurance 4,675,371 3.29 3.14 10 10 Islamic Insurance 13,171,452 3.53 3.83 7
11 Jordan Emirates Insurance 8,705,132 3.77 4.73 8 11 Arabia Insurance-Jordan 4,673,731 3.29 2.31 13 11 AL-Nisr Al-Arabi Insurance 12,944,170 3.47 3.47 9
12 Holy Land Insurance 8,267,142 3.58 5.18 5 12 Euro Arab Insurance Group 3,542,918 2.50 2.47 11 12 Euro Arab Insurance Group 12,690,358 3.40 3.39 10
13 MEDGULF Insurance 8,240,095 3.57 3.24 18 13 National Insurance 3,503,275 2.47 1.71 15 13 Arab Life & Accidents Insurance 11,062,599 2.97 3.00 15
14 Arab Life & Accidents Insurance 8,201,391 3.55 3.96 14 14 United Insurance 3,428,148 2.42 1.62 17 14 Jordan Emirates Insurance 10,993,304 2.95 4.42 5
15 Islamic Insurance 7,683,020 3.33 3.63 16 15 Arab Life & Accidents Insurance 2,861,209 2.02 1.70 16 15 United Insurance 10,939,115 2.93 2.62 19
16 Arab Assurers 7,587,338 3.28 4.71 9 16 Al Yarmouk Insurance 2,417,605 1.70 0.98 19 16 Jerusalem Insurance 10,035,276 2.69 3.19 13
17 United Insurance 7,510,967 3.25 3.36 17 17 Jordan Emirates Insurance 2,288,172 1.61 4.02 9 17 Jordan International Insurance 9,578,956 2.57 2.81 18
18 Arab Jordanian Insurance Group 6,974,311 3.02 3.98 13 18 Arab Jordanian Insurance Group 1,644,411 1.16 0.64 22 18 Arab Assurers 9,144,464 2.45 3.36 11
19 Delta Insurance 6,567,765 2.84 2.83 21 19 Arab Assurers 1,557,126 1.10 1.53 18 19 Arab Jordanian Insurance Group 8,618,722 2.31 2.56 20
20 Philadelphia Insurance 6,190,174 2.68 3.17 19 20 Delta Insurance 1,472,083 1.04 0.93 20 20 Holy Land Insurance 8,267,142 2.22 2.97 16
21 Arab Union International Ins. 5,332,239 2.31 2.94 20 21 Philadelphia Insurance 1,249,547 0.88 0.30 24 21 Delta Insurance 8,039,848 2.16 2.02 23
22 Jordan International Insurance 2,487,029 1.08 1.74 22 22 Jerusalem Insurance 1,058,597 0.75 0.70 21 22 MetLife Alico 7,865,366 2.11 2.17 22
23 AL-Nisr Al-Arabi Insurance 1,131,473 0.49 0.81 23 23 Arab Union International Ins. 965,688 0.68 1.93 14 23 Philadelphia Insurance 7,439,721 2.00 1.95 24
24 Al Yarmouk Insurance 569,649 0.25 0.52 24 24 AL Manara Insurance 770,406 0.54 0.51 23 24 Arab Union International Ins. 6,297,927 1.69 2.51 21
25 MetLife Alico 32,795 0.01 0.05 25 25 Holy Land Insurance* 25 Al Yarmouk Insurance 2,987,254 0.80 0.72 25
Total 231,018,185 100 100 141,899,366 100 100 372,917,551 100 100
*
Total
20132014
Companies
No. Life & Medical
Paid Claims Share%
No.
Ranking
25
2013
Share% Ranking
2014
CompaniesTotal Paid
Claims
Companies
Share%
Companies
Share%
Non Life Paid
Claims
The Company dosent`s practice Life & Medical Insurances
Ranking
2014
CompaniesNo.
Total
Companies
Share%
2013
Share%

1 Middle East Insurance 2,271,809 32.10 3.70 10 1 Jordan Insurance 16,421,902 38.97 13.46 2
2 Jordan French Insurance 1,197,454 16.92 5.38 6 2 Arab Orient Insurance 6,445,275 15.29 10.55 3
3 Jerusalem Insurance 547,728 7.74 36.12 1 3 AL Manara Insurance 6,174,813 14.65 1.25 18
4 Jordan International Insurance 521,350 7.37 5.43 5 4 First Insurance 4,450,289 10.56 20.79 1
5 Arab Jordanian Insurance Group 515,843 7.29 0.98 16 5 Middle East Insurance 2,413,278 5.73 9.69 4
6 National Insurance 390,385 5.52 2.77 11 6 Arabia Insurance-Jordan 1,167,566 2.77 1.31 17
7 AL-Nisr Al-Arabi Insurance 331,649 4.69 4.08 8 7 National Insurance 672,994 1.60 2.22 11
8 Jordan Insurance 258,791 3.66 3.85 9 8 MEDGULF Insurance 615,145 1.46 1.36 16
9 Delta Insurance 192,605 2.72 8.78 2 9 Islamic Insurance 506,362 1.20 2.05 13
10 Arab Orient Insurance 151,201 2.14 4.11 7 10 Jordan International Insurance 391,569 0.93 3.69 7
11 United Insurance 135,046 1.91 0.64 18 11 AL-Nisr Al-Arabi Insurance 347,175 0.82 1.60 15
12 Arab Life & Accidents Insurance 126,283 1.78 8.26 4 12 Euro Arab Insurance Group 340,552 0.81 7.18 5
13 MEDGULF Insurance 116,772 1.65 1.98 12 13 Al Yarmouk Insurance 298,764 0.71 0.63 22
14 Euro Arab Insurance Group 66,738 0.94 1.40 13 14 United Insurance 296,317 0.70 2.01 14
15 First Insurance 55,525 0.78 1.40 14 15 Jerusalem Insurance 294,671 0.70 3.21 9
16 Arab Assurers 43,600 0.62 1.14 15 16 Delta Insurance 269,386 0.64 1.23 19
17 Islamic Insurance 35,422 0.50 0.58 19 17 Jordan French Insurance 220,664 0.52 6.96 6
18 Al Yarmouk Insuranceا 33,994 0.48 8.28 3 18 Arab Jordanian Insurance Group 214,416 0.51 0.84 21
19 Arab Union International Ins. 27,719 0.39 0.05 23 19 Jordan Emirates Insurance 177,540 0.42 1.08 20
20 Jordan Emirates Insurance 25,938 0.37 0.13 21 20 Arab Assurers 161,400 0.38 3.42 8
21 Arabia Insurance-Jordan 22,162 0.31 0.71 17 21 Holy Land Insurance 147,923 0.35 2.13 12
22 AL Manara Insurance 6,400 0.09 0.05 22 22 Arab Life & Accidents Insurance 85,982 0.20 3.01 10
23 Philadelphia Insurance* 0.17 20 23 Arab Union International Ins. 27,731 0.07 0.28 23
24 Holy Land Insurance** 24 Philadelphia Insurance 585 0.001 0.07 24
25 MetLife Alico*** 25 MetLife Alico***
7,076,428 100 100 42,142,299 100 100
*
*****
Tbl. 2-4
20142014
CompaniesNo.
The Company didn’t pay the marine insurance claims for 2014
The Company didn’t pay the marine insurance claims for 2013 & 2014
Total
Share%Paid Claims Share% Ranking
The company licensed only Medical, Life Assurance and Personal Accidents.
2013
Table (15)
Companies Classification & Share of Paid Claims Per Class As in 2014 (JD)
Marine & Transport & Aviation Fire & Other Property Damages
CompaniesNo.
2013
26
Total
Paid Claims Share% Share% Ranking
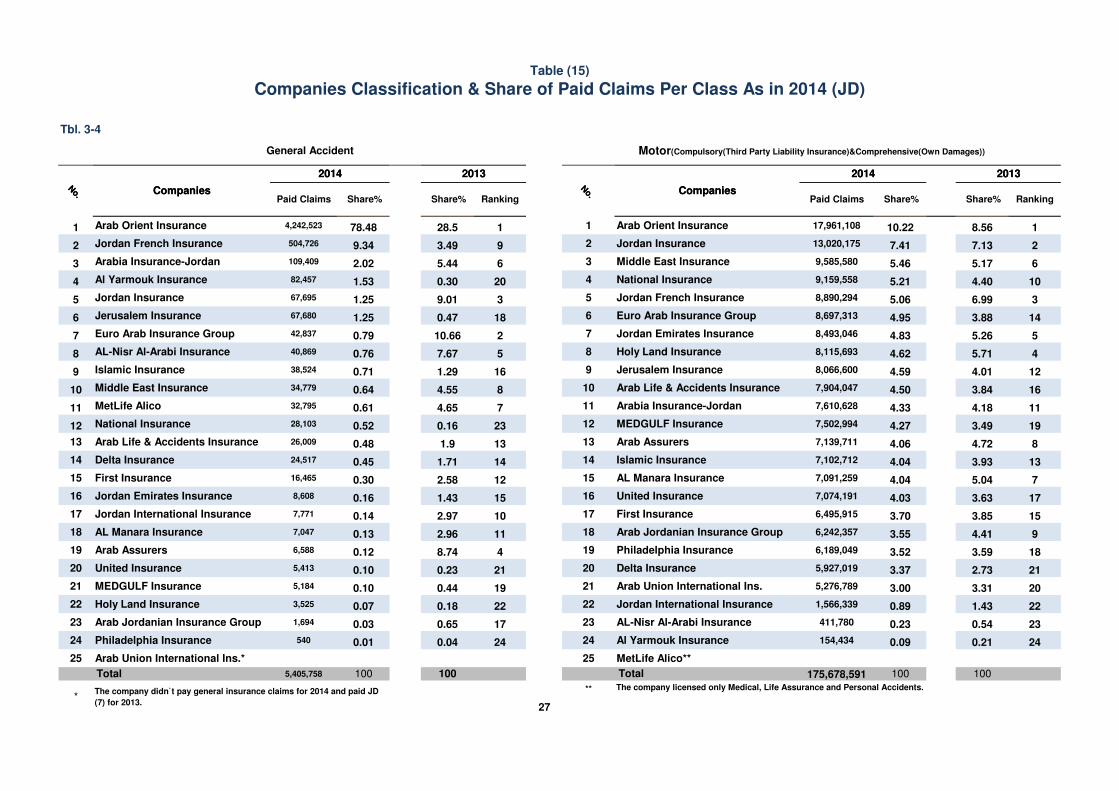
Tbl. 3-4
No.
Table (15)
Companies Classification & Share of Paid Claims Per Class As in 2014 (JD)
Motor(Compulsory(Third Party Liability Insurance)&Comprehensive(Own Damages))
20132014
General Accident
No. CompaniesCompanies
2014 2013
1 Arab Orient Insurance 4,242,523 78.48 28.5 1 1 Arab Orient Insurance 17,961,108 10.22 8.56 1
2 Jordan French Insurance 504,726 9.34 3.49 9 2 Jordan Insurance 13,020,175 7.41 7.13 2
3 Arabia Insurance-Jordan 109,409 2.02 5.44 6 3 Middle East Insurance 9,585,580 5.46 5.17 6
4 Al Yarmouk Insurance 82,457 1.53 0.30 20 4 National Insurance 9,159,558 5.21 4.40 10
5 Jordan Insurance 67,695 1.25 9.01 3 5 Jordan French Insurance 8,890,294 5.06 6.99 3
6 Jerusalem Insurance 67,680 1.25 0.47 18 6 Euro Arab Insurance Group 8,697,313 4.95 3.88 14
7 Euro Arab Insurance Group 42,837 0.79 10.66 2 7 Jordan Emirates Insurance 8,493,046 4.83 5.26 5
8 AL-Nisr Al-Arabi Insurance 40,869 0.76 7.67 5 8 Holy Land Insurance 8,115,693 4.62 5.71 4
9 Islamic Insurance 38,524 0.71 1.29 16 9 Jerusalem Insurance 8,066,600 4.59 4.01 12
10 Middle East Insurance 34,779 0.64 4.55 8 10 Arab Life & Accidents Insurance 7,904,047 4.50 3.84 16
11 MetLife Alico 32,795 0.61 4.65 7 11 Arabia Insurance-Jordan 7,610,628 4.33 4.18 11
12 National Insurance 28,103 0.52 0.16 23 12 MEDGULF Insurance 7,502,994 4.27 3.49 19
13 Arab Life & Accidents Insurance 26,009 0.48 1.9 13 13 Arab Assurers 7,139,711 4.06 4.72 8
14 Delta Insurance 24,517 0.45 1.71 14 14 Islamic Insurance 7,102,712 4.04 3.93 13
15 First Insurance 16,465 0.30 2.58 12 15 AL Manara Insurance 7,091,259 4.04 5.04 7
16 Jordan Emirates Insurance 8,608 0.16 1.43 15 16 United Insurance 7,074,191 4.03 3.63 17
17 Jordan International Insurance 7,771 0.14 2.97 10 17 First Insurance 6,495,915 3.70 3.85 15
18 AL Manara Insurance 7,047 0.13 2.96 11 18 Arab Jordanian Insurance Group 6,242,357 3.55 4.41 9
19 Arab Assurers 6,588 0.12 8.74 4 19 Philadelphia Insurance 6,189,049 3.52 3.59 18
20 United Insurance 5,413 0.10 0.23 21 20 Delta Insurance 5,927,019 3.37 2.73 21
21 MEDGULF Insurance 5,184 0.10 0.44 19 21 Arab Union International Ins. 5,276,789 3.00 3.31 20
22 Holy Land Insurance 3,525 0.07 0.18 22 22 Jordan International Insurance 1,566,339 0.89 1.43 22
23 Arab Jordanian Insurance Group 1,694 0.03 0.65 17 23 AL-Nisr Al-Arabi Insurance 411,780 0.23 0.54 23
24 Philadelphia Insurance 540 0.01 0.04 24 24 Al Yarmouk Insurance 154,434 0.09 0.21 24
25 Arab Union International Ins.* 25 MetLife Alico**
5,405,758 100 100 175,678,591 100 100
**
27*
The company didn`t pay general insurance claims for 2014 and paid JD
(7) for 2013.
Total Total
No.
Share% Share%
The company licensed only Medical, Life Assurance and Personal Accidents.
Paid Claims
2013
Share% Ranking
2014
No. Companies
RankingCompanies
Paid Claims
2014 2013
Share%

1 Jordan Insurance 9,756,999 34.18 37.84 1 1 Arab Orient Insurance 41,917,129 36.98 41.48 1
2 MetLife Alico 5,630,495 19.73 20.55 2 2 AL-Nisr Al-Arabi Insurance 7,114,628 6.28 5.48 2
3 AL-Nisr Al-Arabi Insurance 4,698,069 16.46 14.15 3 3 Jordan International Insurance 6,573,666 5.80 4.73 5
4 Arabia Insurance-Jordan 2,245,173 7.87 4.78 4 4 Jordan French Insurance 6,375,006 5.62 4.70 6
5 Middle East Insurance 1,674,864 5.87 4.73 5 5 MEDGULF Insurance 5,920,724 5.22 5.27 3
6 Islamic Insurance 1,435,716 5.03 4.36 6 6 First Insurance 4,857,642 4.29 2.98 9
7 United Insurance 571,755 2.00 2.14 8 7 Jordan Insurance 4,426,143 3.90 4.07 7
8 Jordan International Insurance 518,261 1.82 2.12 9 8 Islamic Insurance 4,052,716 3.58 4.05 8
9 Euro Arab Insurance Group 511,903 1.79 3.28 7 9 National Insurance 3,136,353 2.77 1.93 13
10 National Insurance 366,922 1.29 0.72 14 10 Euro Arab Insurance Group 3,031,015 2.67 2.29 12
11 Arab Jordanian Insurance Group 322,182 1.13 0.95 12 11 Middle East Insurance 3,000,507 2.65 2.78 10
12 Jordan French Insurance 311,809 1.09 1.79 10 12 United Insurance 2,856,393 2.52 1.50 18
13 Al Yarmouk Insurance 232,595 0.81 0.74 13 13 Arab Life & Accidents Insurance 2,688,551 2.37 1.77 15
14 Arab Life & Accidents Insurance 172,657 0.60 1.37 11 14 Arabia Insurance-Jordan 2,428,559 2.14 1.76 16
15 Jerusalem Insurance 69,397 0.24 0.35 15 15 Jordan Emirates Insurance 2,288,172 2.02 4.91 4
16 Delta Insurance 15,051 0.05 0.07 17 16 MetLife Alico 2,202,076 1.94 1.60 17
17 Arab Assurers 8,991 0.03 0.07 16 17 Al Yarmouk Insurance 2,185,010 1.93 1.04 20
18 AL Manara Insurance* 18 Arab Assurers 1,548,135 1.37 1.85 14
19 Arab Union International Ins.* 19 Delta Insurance 1,457,032 1.29 1.12 19
20 Jordan Emirates Insurance* 20 Arab Jordanian Insurance Group 1,322,229 1.17 0.57 23
21 Holy Land Insurance* 21 Philadelphia Insurance 1,249,547 1.10 0.36 24
22 Philadelphia Insurance* 22 Jerusalem Insurance 989,200 0.87 0.78 21
23 Arab Orient Insurance* 23 Arab Union International Ins. 965,688 0.85 2.36 11
24 MEDGULF Insurance* 24 AL Manara Insurance 770,406 0.68 0.62 22
25 First Insurance * 25 Holy Land Insurance*
28,542,839 100 100 113,356,527 100 100
* * The Company Under No. (25) dosen`t Practice Medical Insurance
Tbl. 4-4
28
Medical
2014
Share% Share% Ranking
2013
Share% RankingCompanies
Paid Claims
The Companies Under No. (18-25) don’t Practice Life Insurance
No. Companies No.
2013
Total Total
Paid Claims Share%
Life
2014
Companies Classification & Share of Paid Claims Per Class As in 2014 (JD)
Table (15)

Tbl. 1-2
2013201420132014201320142013201420132014201320142013201420132014
-1,283,025-881,90043,59842,29753,54028,991426,844575,899451,481597,672451,481597,672Jordan Insurance1
183,405-146,41490,852100,66673,88652,023781,561535,906980,150788,63319,18619,403960,964769,230Middle East Insurance2
-284,791304,24936,82017,325247,439347,331209,303466,444209,303466,444National Insurance3
-627,282-1,153,968-10,57658,28433,12865,716110,997195,71495,849196,852-3,03595,849199,887United Insurance4
-795,280-1,752,3842,9487,47518,26522,671146,994268,58847,75851,2952,3494,13445,40947,161AL Manara Insurance5
-510,301-578,6366805,09326,941121,175133,414198,632213,084249,437213,084249,437Arabia Insurance - Jordan6
-297,436-1,098,36618,66918,4811,250-11,56926,082130,475815,542828,825815,542828,825Jerusalem Insurance7
-147,543-172,802111,400120,31755,98046,532177,322155,41425,965158,46025,965158,460AL-Nisr Al-Arabi Insurance8
-2,361,745678,157263,491363,443386,640274,42325,44416,012165,026333,729-52,74710,617-48,47227,718-4,275-17,101Jordan French Insurance9
-496,850490,1607,24712,945-7,6247,546138,37593,111138,37593,111Arab Union International Ins.10
-338,772-140,521-3,919-9,28321,72823,97314,48051,481268,949274,471173,627228,206173,627228,206Delta Insurance11
214,99290,81945,51540,14535,79130,54269,84780,99569,84780,995Jordan Emirates Insurance12
54,22850,27325,83713,54222,3251,271228,83257,735219,930110,686219,930110,686Al Yarmouk Insurance13
-601,943210,31110,96331,086104,74160,6344,4284,6564,4284,656Holy Land Insurance14
-353,906145,150226,3105,46124,12320,05428,03343,1499,445-6,10287,064-21,57387,064-21,573Arab Life & Accidents Ins.15
-1,185,801443,7925,3237,5107,8212,32248,21035,93032,62723,00232,62723,002Philadelphia Insurance16
657,165414,48000MetLife Alico17
-1,786,771-118,947-127-2,418-8,44121,531155,1074,89197,52691,428-55,3782,477152,90488,951Jordan International Ins.18
-298,335-1,710,608116,059113,197-313,25087,974352,763316,757352,763316,757Islamic Insurance19
-527,327912,22566,96723,801103,26587,238-27,27072,77490,719126,494-14090,859126,494Euro Arab Insurance Group20
-37,532-1,097,76338,695-7,35827,7992,73230,25220,18616,38460,095215,765244,495215,765244,495Arab Assurers21
308,192-59,88532,53083,65597,86867,632103,41139,348103,41139,348Arab Jordanian Ins. Group22
-75,630360,299873,600330,814176,975125,320856,242-54,273679,053631,1951,039-4,830678,014636,025Arab Orient Insurance23
-2,209,221244,7025,71620,04644,40277,074292,704220,096113,429169,626113,429169,626MEDGULF Insurance24
-1,103,385-702,24454,480143,60445,25540,151-37,51737,58997,901126,5685,52721,23992,374105,329First Insurance 25
-14,562,059-5,684,301525,257357,3562,634,4341,991,198773,643738,5103,944,2913,699,2225,262,8505,613,229-75,88967,1065,338,7395,546,123
29
Total
Marine Aviation Credit Compulsory (Third Party Liability
Insurance)
Liability Fire& Other Property
DamagesOther Branches
Motor
(According to Insurance Branches)
Table (16)
Marine + Aviation
Net Profit (Loss) For 25 Insurance Companies as Per Class For The Year 2014 (JD)
NoNoNoNo. Companies

201320142013201420132014201320142013201420132014201320142013201420132014
270,4283,509,798418,729471,9312,585,8934,735,3611,168,6852,208,241527,3601,123,458641,3251,084,7831,417,2082,527,120441,7451,282,2611,724,7702,164,1611
2,632,4322,209,3972,668,8152,336,960321,668384,168250,490107,38471,178276,7842,347,1471,952,792420,698475,564237,293621,9782
467,8071,208,459360,0721,368,781-104,162-55,89638,76059,086-142,922-114,982464,2341,424,677-29,328593,577255,463289,3283
904,1651,386,974803,1791,154,920245,706352,763175,908196,40269,798156,361557,473802,157328,075285,591955,3571,439,5594
-314,553-511,80520,023-634,446-299,031-9,415-299,031-9,415319,054-625,031103,089-975,060898,369777,3245
460,830736,822408,208779,97866,86192,083116,32667,913-49,46524,170341,347687,895-32,772113,558477,529692,1946
1,329,8671,657,8171,014,9901,344,806202,896174,46529,19129,607173,705144,858812,0941,170,341-49,449204,129247,9871,302,4957
1,433,6991,978,9062,085,5832,343,4651,841,4661,966,198818,256820,4111,023,2101,145,787244,117377,267-126,550-103,45620,99369,3468
156,8771,128,762-249,3211,863,862332,003592,613216,375200,668115,628391,945-581,3241,271,249-1,369,178273,025992,567-405,1329
-1,435,306814,592-722,444628,673-423,417-60,481-423,417-60,481-299,027689,154-437,025575,55259,82585,39210
738,561935,822853,3321,148,030223,418260,32255,13662,129168,282198,193629,914887,708155,049318,860493,821459,38111
-285,796735,636242,7401,089,025-1,107,168-55,851-1,107,168-55,8511,349,9081,144,8761,198,755993,194983,763902,37512
632,333214,519601,863410,282-20,591128,286-26,75734,7046,16693,582622,454281,996125,53098,76271,30248,48913
569,445119,175-43,292427,84200-43,292427,842-163,424331,466438,519121,15514
-488,247846,547163,340286,713105,4931,215,475-125,632-49,88549,99959,191-175,631-109,076231,1251,265,360-143,8501,224,371210,0561,079,22115
-591,419811,264-771,166898,844114,106133,385114,106133,385-885,272765,459-979,253696,695206,549252,90316
4,709,3324,098,6773,180,0443,298,8342,522,8792,884,3542,070,3582,307,154452,521577,200657,165414,4800017
663,5511,203,579150,293148,367487,66396,603-71,939-32,527559,602129,130-337,37051,764-581,435-63,6681,205,33655,27918
1,564,6241,680,580624,329552,191514,099798,327895,6331,149,928-381,534-351,601110,230-246,136-45,342-764,064252,993946,54419
617,8421,634,949840,9441,371,586686,01741,383736,549-34,974-50,53276,357154,9271,330,203-78,7541,019,896448,573107,67120
-71,519-43,664306,000205,502-68,683103,62025,4196,942-94,10296,678374,683101,88245,788-218,26883,320879,49521
-336,716741,487580,9521,130,94488,133366,80450,531130,83037,602235,974492,819764,140259,010573,505-49,182633,39022
4,083,3995,027,3656,280,2757,268,4761,704,6463,508,3801,704,6463,508,3804,575,6293,760,0961,989,7592,727,0402,065,3892,366,74123
117,314-674,868169,592-654,486-510,992-95,193-510,992-95,193680,584-559,293224,333-1,046,1352,433,554-1,290,83724
617,5221,632,279-108,804469,093506,793497,415506,793497,415-615,597-28,322-775,716-376,234327,669326,01025
18,446,47233,083,069582,069758,64421,987,59334,902,3658,367,36314,262,6895,957,5956,288,3062,409,7687,974,38313,620,23020,639,676479,7558,240,16115,041,81513,924,462
30
Euro Arab Insurance Group
Arab Assurers
Arab Jordanian Ins. Group
Arab Orient Insurance
Islamic Insurance
Philadelphia Insurance
MetLife Alico
Total
MEDGULF Insurance
First Insurance
Jordan International Ins.
Arabia Insurance - Jordan
Middle East Insurance
National Insurance
United Insurance
AL Manara Insurance
Jordan Insurance
NO. Comprehensive
(Own Damages)
Motor
Companies
(According to Insurance Branches)
Table (16)
Net Profit (Loss) For 25 Insurance Companies as Per Class For The Year 2014 (JD) *
Tbl. 2-2
Net Profit(Loss)
Net Technical Profit
(Loss) for branches
Outside Jordan
Net Technical Profit
(Loss)Medical+LifeLifeCompulsory (Third Party Liability Ins.)
& Comprehensive (Own Damages)
Non Life Insurances Medical
Arab Life & Accidents Ins.
Jerusalem Insurance
Holy Land Insurance
AL-Nisr Al-Arabi Insurance
Jordan French Insurance
Arab Union International Ins.
Delta Insurance
Al Yarmouk Insurance
Jordan Emirates Insurance
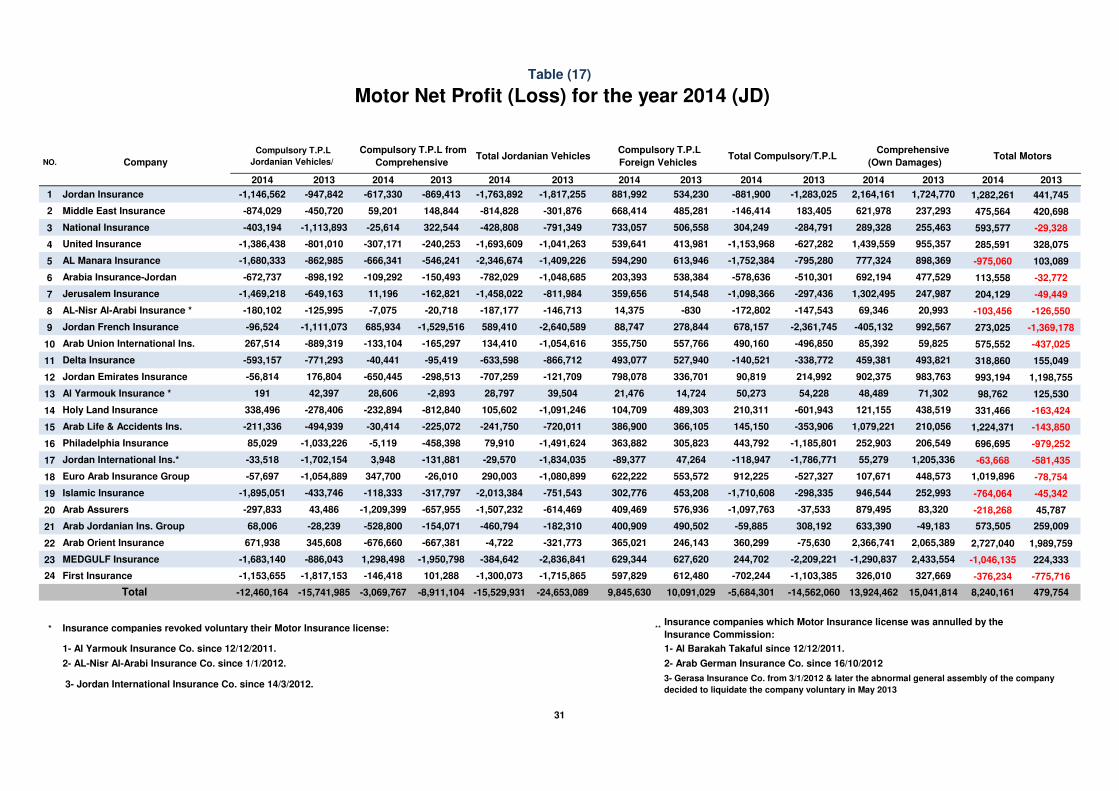
20132014201320142013201420132014201320142013201420132014
441,7451,282,2611,724,7702,164,161-1,283,025-881,900534,230881,992-1,817,255-1,763,892-869,413-617,330-947,842-1,146,562Jordan Insurance1
420,698475,564237,293621,978183,405-146,414485,281668,414-301,876-814,828148,84459,201-450,720-874,029Middle East Insurance2
-29,328593,577255,463289,328-284,791304,249506,558733,057-791,349-428,808322,544-25,614-1,113,893-403,194National Insurance3
328,075285,591955,3571,439,559-627,282-1,153,968413,981539,641-1,041,263-1,693,609-240,253-307,171-801,010-1,386,438United Insurance4
103,089-975,060898,369777,324-795,280-1,752,384613,946594,290-1,409,226-2,346,674-546,241-666,341-862,985-1,680,333AL Manara Insurance5
-32,772113,558477,529692,194-510,301-578,636538,384203,393-1,048,685-782,029-150,493-109,292-898,192-672,737Arabia Insurance-Jordan6
-49,449204,129247,9871,302,495-297,436-1,098,366514,548359,656-811,984-1,458,022-162,82111,196-649,163-1,469,218Jerusalem Insurance7
-126,550-103,45620,99369,346-147,543-172,802-83014,375-146,713-187,177-20,718-7,075-125,995-180,102AL-Nisr Al-Arabi Insurance *8
-1,369,178273,025992,567-405,132-2,361,745678,157278,84488,747-2,640,589589,410-1,529,516685,934-1,111,073-96,524Jordan French Insurance9
-437,025575,55259,82585,392-496,850490,160557,766355,750-1,054,616134,410-165,297-133,104-889,319267,514Arab Union International Ins.10
155,049318,860493,821459,381-338,772-140,521527,940493,077-866,712-633,598-95,419-40,441-771,293-593,157Delta Insurance11
1,198,755993,194983,763902,375214,99290,819336,701798,078-121,709-707,259-298,513-650,445176,804-56,814Jordan Emirates Insurance12
125,53098,76271,30248,48954,22850,27314,72421,47639,50428,797-2,89328,60642,397191Al Yarmouk Insurance *13
-163,424331,466438,519121,155-601,943210,311489,303104,709-1,091,246105,602-812,840-232,894-278,406338,496Holy Land Insurance14
-143,8501,224,371210,0561,079,221-353,906145,150366,105386,900-720,011-241,750-225,072-30,414-494,939-211,336Arab Life & Accidents Ins.15
-979,252696,695206,549252,903-1,185,801443,792305,823363,882-1,491,62479,910-458,398-5,119-1,033,22685,029Philadelphia Insurance16
-581,435-63,6681,205,33655,279-1,786,771-118,94747,264-89,377-1,834,035-29,570-131,8813,948-1,702,154-33,518Jordan International Ins.*17
-78,7541,019,896448,573107,671-527,327912,225553,572622,222-1,080,899290,003-26,010347,700-1,054,889-57,697Euro Arab Insurance Group18
-45,342-764,064252,993946,544-298,335-1,710,608453,208302,776-751,543-2,013,384-317,797-118,333-433,746-1,895,051Islamic Insurance19
45,787-218,26883,320879,495-37,533-1,097,763576,936409,469-614,469-1,507,232-657,955-1,209,39943,486-297,833Arab Assurers20
259,009573,505-49,183633,390308,192-59,885490,502400,909-182,310-460,794-154,071-528,800-28,23968,006Arab Jordanian Ins. Group21
1,989,7592,727,0402,065,3892,366,741-75,630360,299246,143365,021-321,773-4,722-667,381-676,660345,608671,938Arab Orient Insurance22
224,333-1,046,1352,433,554-1,290,837-2,209,221244,702627,620629,344-2,836,841-384,642-1,950,7981,298,498-886,043-1,683,140MEDGULF Insurance23
-775,716-376,234327,669326,010-1,103,385-702,244612,480597,829-1,715,865-1,300,073101,288-146,418-1,817,153-1,153,655First Insurance 24
479,7548,240,16115,041,81413,924,462-14,562,060-5,684,30110,091,0299,845,630-24,653,089-15,529,931-8,911,104-3,069,767-15,741,985-12,460,164
***
2- Arab German Insurance Co. since 16/10/20122- AL-Nisr Al-Arabi Insurance Co. since 1/1/2012.
Insurance companies which Motor Insurance license was annulled by the
Insurance Commission:
Compulsory T.P.L
Foreign Vehicles
31
NO.
Total
Company
Compulsory T.P.L from
Comprehensive
3- Gerasa Insurance Co. from 3/1/2012 & later the abnormal general assembly of the company
decided to liquidate the company voluntary in May 2013 3- Jordan International Insurance Co. since 14/3/2012.
1- Al Barakah Takaful since 12/12/2011.
Comprehensive
(Own Damages) Total Jordanian Vehicles Total Motors
1- Al Yarmouk Insurance Co. since 12/12/2011.
Insurance companies revoked voluntary their Motor Insurance license:
Compulsory T.P.L
Jordanian Vehicles/Total Compulsory/T.P.L
Table (17)
Motor Net Profit (Loss) for the year 2014 (JD)

Tbl. 1-4
NO
.
Profit (Loss) befor taxTotal Underwriting Profit (Loss)
2014
NO. Companies
2013 2014 2013
CompaniesNO. Companies
Table (18)
Insurance Companies According to Profit (Loss) Per Class as in 2014 (JD)
Net Profit (Loss)
2014 2013
Profit (Loss) Net Profit
befor tax (Loss)
1 Arab Orient Insurance 7,268,476 20.83 28.56 1 1 Arab Orient Insurance 6,369,301 15.50 21.10 2 1 Arab Orient Insurance 5,027,365 15.20 22.14 2
2 Jordan Insurance 4,735,361 13.57 11.76 4 2 MetLife Alico 5,747,828 13.99 24.80 1 2 MetLife Alico 4,098,677 12.39 25.53 1
3 MetLife Alico 3,298,834 9.45 14.46 2 3 Jordan Insurance 4,364,949 10.62 2.67 12 3 Jordan Insurance 3,509,798 10.61 1.47 16
4 AL-Nisr Al-Arabi Insurance 2,343,465 6.71 9.49 5 4 AL-Nisr Al-Arabi Insurance 2,678,539 6.52 7.53 5 4 Middle East Insurance 2,209,397 6.68 14.27 3
5 Middle East Insurance 2,336,960 6.70 12.14 3 5 Middle East Insurance 2,511,152 6.11 13.41 3 5 AL-Nisr Al-Arabi Insurance 1,978,906 5.98 7.77 5
6 Jordan French Insurance 1,863,862 5.34 -1.13 23 6 Islamic Insurance 2,367,395 5.76 8.11 4 6 Islamic Insurance 1,680,580 5.08 8.48 4
7 Euro Arab Insurance Group 1,371,586 3.93 3.82 8 7 Jerusalem Insurance 2,195,056 5.34 6.78 6 7 Jerusalem Insurance 1,657,817 5.01 7.21 6
8 National Insurance 1,368,781 3.92 1.64 14 8 Euro Arab Insurance Group 2,142,988 5.22 3.21 10 8 Euro Arab Insurance Group 1,634,949 4.94 3.35 11
9 Jerusalem Insurance 1,344,806 3.85 4.62 6 9 First Insurance 2,058,823 5.01 3.22 9 9 First Insurance 1,632,279 4.93 3.35 12
10 Arab Life & Accidents Insurance 1,215,475 3.48 0.48 19 10 United Insurance 1,804,578 4.39 5.17 7 10 United Insurance 1,386,974 4.19 4.90 7
11 United Insurance 1,154,920 3.31 3.65 9 11 National Insurance 1,568,190 3.82 1.93 16 11 National Insurance 1,208,459 3.65 2.54 14
12 Delta Insurance 1,148,030 3.29 3.88 7 12 Delta Insurance 1,286,770 3.13 4.13 8 12 Jordan International Insurance 1,203,579 3.64 3.60 9
13 Arab Jordanian Insurance Group 1,130,944 3.24 2.64 12 13 Jordan International Insurance 1,216,258 2.96 2.66 13 13 Jordan French Insurance 1,128,762 3.41 0.85 17
14 Jordan Emirates Insurance 1,089,025 3.12 1.10 16 14 Jordan French Insurance 1,156,932 2.82 -0.40 19 14 Delta Insurance 935,822 2.83 4.00 8
15 Philadelphia Insurance 898,844 2.58 -3.51 25 15 Arab Life & Accidents Insurance 962,576 2.34 -1.40 23 15 Arab Life & Accidents Insurance 846,547 2.56 -2.65 23
16 Arabia Insurance-Jordan 779,979 2.23 1.86 13 16 Arabia Insurance-Jordan 917,618 2.23 2.28 14 16 Arab Union International Ins. 814,592 2.46 -7.78 25
17 Arab Union International Ins. 628,673 1.80 -3.29 24 17 Philadelphia Insurance 911,707 2.22 -2.05 24 17 Philadelphia Insurance 811,264 2.45 -3.21 24
18 Islamic Insurance 552,191 1.58 2.84 10 18 Jordan Emirates Insurance 735,636 1.79 -1.12 21 18 Arab Jordanian Insurance Group 741,487 2.24 -1.83 22
19 First Insurance 469,093 1.34 -0.49 22 19 Arab Jordanian Insurance Group 608,086 1.48 -0.68 20 19 Arabia Insurance-Jordan 736,822 2.23 2.50 15
20 Holy Land Insurance 427,842 1.23 -0.20 21 20 Al Yarmouk Insurance 468,899 1.14 2.68 11 20 Jordan Emirates Insurance 735,636 2.22 -1.55 20
21 Al Yarmouk Insurance 410,282 1.18 2.74 11 21 Arab Union International Ins. 124,814 0.30 -5.64 25 21 Al Yarmouk Insurance 214,519 0.65 3.43 10
22 Arab Assurers 205,502 0.59 1.39 15 22 Holy Land Insurance 119,175 0.29 2.24 15 22 Holy Land Insurance 119,175 0.36 3.09 13
23 Jordan International Insurance 148,367 0.43 0.68 18 23 Arab Assurers -43,664 -0.11 -0.28 18 23 Arab Assurers -43,664 -0.13 -0.39 19
24 AL Manara Insurance -634,446 -1.82 0.09 20 24 AL Manara Insurance -508,939 -1.24 -1.18 22 24 AL Manara Insurance -511,805 -1.55 -1.71 21
25 MEDGULF Insurance -654,487 -1.88 0.77 17 25 MEDGULF Insurance -674,868 -1.64 0.83 17 25 MEDGULF Insurance -674,868 -2.04 0.64 18
34,902,365 100 100 41,089,799 100 100 33,083,069 100 100
32
Total Total Total
NO
.Total Underwriting
Profit (Loss)Share% Share%
2014
NO. Companies
2013 2014 2013
Share% RankingCompanies
Share% RankingNO. Companies
Share% Ranking
2014 2013
Share%

NO
. Companies
Table (18)
Insurance Companies According to Profit (Loss) Per Class as in 2014 (JD)
NO
. Companies2013
Tbl. 2-4
2014
Marine & Transport & Aviation
2014 2013
Fire & Other Property Damages
1 Jerusalem Insurance 828,825 14.77 15.50 2 1 Jordan Insurance 575,899 15.57 10.82 3
2 Middle East Insurance 788,633 14.05 18.62 1 2 Middle East Insurance 535,906 14.49 19.81 2
3 Arab Orient Insurance 631,195 11.24 12.90 3 3 National Insurance 347,331 9.39 6.27 6
4 Jordan Insurance 597,672 10.65 8.58 4 4 Jordan French Insurance 333,729 9.02 4.18 9
5 National Insurance 466,444 8.31 3.98 9 5 Delta Insurance 274,471 7.42 6.82 5
6 Islamic Insurance 316,757 5.64 6.70 5 6 AL Manara Insurance 268,588 7.26 3.73 11
7 Arabia Insurance-Jordan 249,437 4.44 4.05 8 7 MEDGULF Insurance 220,096 5.95 7.42 4
8 Arab Assurers 244,495 4.36 4.10 7 8 Arabia Insurance-Jordan 198,632 5.37 3.38 12
9 Delta Insurance 228,206 4.07 3.30 10 9 United Insurance 195,714 5.29 2.81 13
10 United Insurance 196,852 3.51 1.82 16 10 AL-Nisr Al-Arabi Insurance 155,414 4.20 4.50 8
11 MEDGULF Insurance 169,626 3.02 2.16 12 11 Jerusalem Insurance 130,475 3.53 0.66 18
12 AL-Nisr Al-Arabi Insurance 158,460 2.82 0.49 22 12 Islamic Insurance 87,974 2.38 -7.94 24
13 First Insurance 126,568 2.25 1.86 14 13 Euro Arab Insurance Group 72,774 1.97 -0.69 22
14 Euro Arab Insurance Group 126,494 2.25 1.72 17 14 Arab Jordanian Insurance Group 67,632 1.83 2.48 15
15 Al Yarmouk Insurance 110,686 1.97 4.18 6 15 Holy Land Insurance 60,634 1.64 2.66 14
16 Arab Union International Ins. 93,111 1.66 2.63 11 16 Arab Assurers 60,095 1.62 0.42 19
17 Jordan International Insurance 91,428 1.63 1.85 15 17 Al Yarmouk Insurance 57,735 1.56 5.80 7
18 Jordan Emirates Insurance 80,995 1.44 1.33 19 18 First Insurance 37,589 1.02 -0.95 23
19 AL Manara Insurance 51,295 0.91 0.91 20 19 Philadelphia Insurance 35,930 0.97 1.22 16
20 Arab Jordanian Insurance Group 39,348 0.70 1.96 13 20 Jordan Emirates Insurance 30,542 0.83 0.91 17
21 Philadelphia Insurance 23,002 0.41 0.62 21 21 Arab Union International Ins. 7,546 0.20 -0.19 21
22 Jordan French Insurance 10,617 0.19 -1.00 24 22 Jordan International Insurance 4,891 0.13 3.93 10
23 Holy Land Insurance 4,656 0.08 0.08 23 23 Arab Life & Accidents Insurance -6,102 -0.16 0.24 20
24 Arab Life & Accidents Insurance -21,573 -0.38 1.65 18 24 Arab Orient Insurance -54,273 -1.47 21.71 1
25 MetLife Alico* 25 MetLife Alico*
5,613,229 100 100 3,699,222 100 100
*
33
Share%
The company licensed only Medical, Life Assurance and Personal Accidents.
Total Total
NO
. CompaniesShare%Profit(Loss) Profit(Loss)
NO
. Companies2013
RankingRanking
2014
Share%
2014 2013
Share%
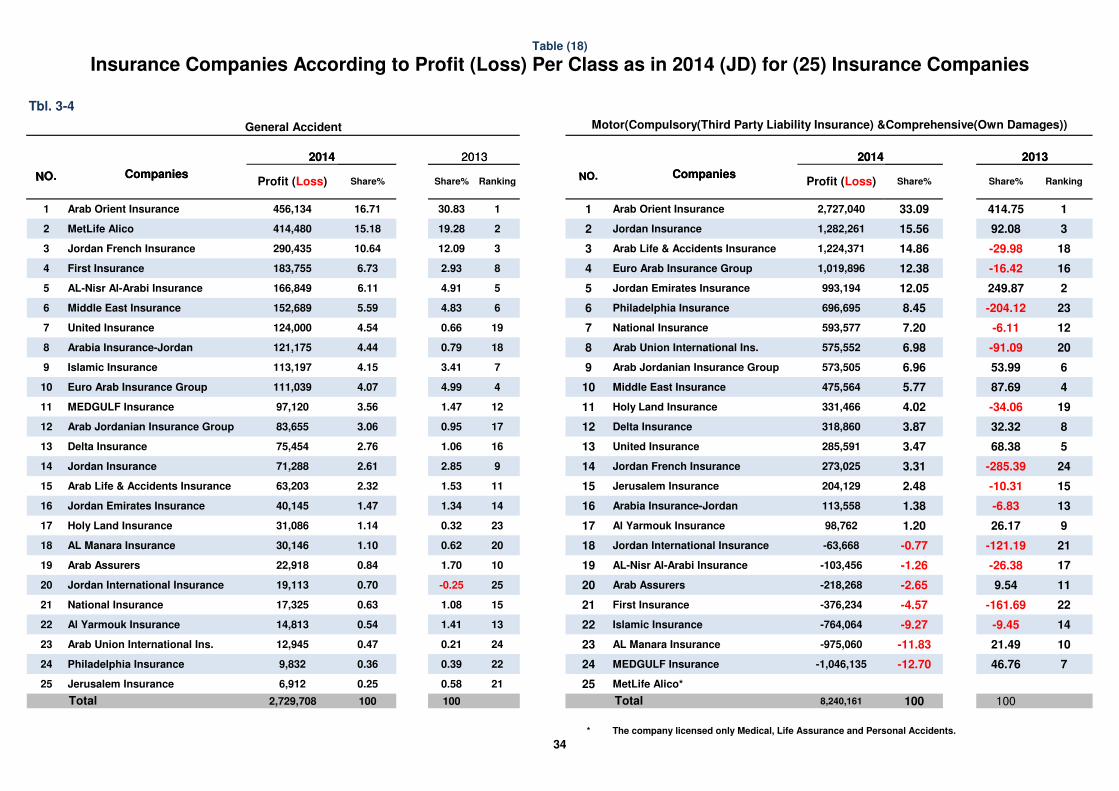
Tbl. 3-4
General Accident
2013
NO. Companies
2013
Motor(Compulsory(Third Party Liability Insurance) &Comprehensive(Own Damages))
2014
NO. Companies
Table (18)
Insurance Companies According to Profit (Loss) Per Class as in 2014 (JD) for (25) Insurance Companies
2014
1 Arab Orient Insurance 456,134 16.71 30.83 1 1 Arab Orient Insurance 2,727,040 33.09 414.75 1
2 MetLife Alico 414,480 15.18 19.28 2 2 Jordan Insurance 1,282,261 15.56 92.08 3
3 Jordan French Insurance 290,435 10.64 12.09 3 3 Arab Life & Accidents Insurance 1,224,371 14.86 -29.98 18
4 First Insurance 183,755 6.73 2.93 8 4 Euro Arab Insurance Group 1,019,896 12.38 -16.42 16
5 AL-Nisr Al-Arabi Insurance 166,849 6.11 4.91 5 5 Jordan Emirates Insurance 993,194 12.05 249.87 2
6 Middle East Insurance 152,689 5.59 4.83 6 6 Philadelphia Insurance 696,695 8.45 -204.12 23
7 United Insurance 124,000 4.54 0.66 19 7 National Insurance 593,577 7.20 -6.11 12
8 Arabia Insurance-Jordan 121,175 4.44 0.79 18 8 Arab Union International Ins. 575,552 6.98 -91.09 20
9 Islamic Insurance 113,197 4.15 3.41 7 9 Arab Jordanian Insurance Group 573,505 6.96 53.99 6
10 Euro Arab Insurance Group 111,039 4.07 4.99 4 10 Middle East Insurance 475,564 5.77 87.69 4
11 MEDGULF Insurance 97,120 3.56 1.47 12 11 Holy Land Insurance 331,466 4.02 -34.06 19
12 Arab Jordanian Insurance Group 83,655 3.06 0.95 17 12 Delta Insurance 318,860 3.87 32.32 8
13 Delta Insurance 75,454 2.76 1.06 16 13 United Insurance 285,591 3.47 68.38 5
14 Jordan Insurance 71,288 2.61 2.85 9 14 Jordan French Insurance 273,025 3.31 -285.39 24
15 Arab Life & Accidents Insurance 63,203 2.32 1.53 11 15 Jerusalem Insurance 204,129 2.48 -10.31 15
16 Jordan Emirates Insurance 40,145 1.47 1.34 14 16 Arabia Insurance-Jordan 113,558 1.38 -6.83 13
17 Holy Land Insurance 31,086 1.14 0.32 23 17 Al Yarmouk Insurance 98,762 1.20 26.17 9
18 AL Manara Insurance 30,146 1.10 0.62 20 18 Jordan International Insurance -63,668 -0.77 -121.19 21
19 Arab Assurers 22,918 0.84 1.70 10 19 AL-Nisr Al-Arabi Insurance -103,456 -1.26 -26.38 17
20 Jordan International Insurance 19,113 0.70 -0.25 25 20 Arab Assurers -218,268 -2.65 9.54 11
21 National Insurance 17,325 0.63 1.08 15 21 First Insurance -376,234 -4.57 -161.69 22
22 Al Yarmouk Insurance 14,813 0.54 1.41 13 22 Islamic Insurance -764,064 -9.27 -9.45 14
23 Arab Union International Ins. 12,945 0.47 0.21 24 23 AL Manara Insurance -975,060 -11.83 21.49 10
24 Philadelphia Insurance 9,832 0.36 0.39 22 24 MEDGULF Insurance -1,046,135 -12.70 46.76 7
25 Jerusalem Insurance 6,912 0.25 0.58 21 25 MetLife Alico*
2,729,708 100 100 8,240,161 100 100
* The company licensed only Medical, Life Assurance and Personal Accidents.
34
Ranking
2013
NO. Companies
2013
Share%
Total
Profit (Loss)
2014
Share%NO. Companies
Total
2014
Share% RankingShare%Profit (Loss)

Tbl. 4-4
Life
2014 2013
NO. Companies
Table (18)
Insurance Companies According to Profit (Loss) Per Class as in 2014 (JD)
2013
Medical
20142014 2013
NO. Companies
Share% RankingShare%Ranking Companies
NO.
20132014
Share% Share%Profit(Loss) Profit(Loss)
1 MetLife Alico 2,307,154 36.69 34.75 1 1 Arab Orient Insurance 3,508,380 44.00 70.74 1
2 Islamic Insurance 1,149,928 18.29 15.03 2 2 AL-Nisr Al-Arabi Insurance 1,145,787 14.37 42.46 2
3 Jordan Insurance 1,123,458 17.87 8.85 5 3 Jordan Insurance 1,084,783 13.60 26.61 3
4 AL-Nisr Al-Arabi Insurance 820,411 13.05 13.73 3 4 MetLife Alico 577,200 7.24 18.78 6
5 Jordan French Insurance 200,668 3.19 3.63 7 5 First Insurance 497,415 6.24 21.03 5
6 United Insurance 196,402 3.12 2.95 8 6 Jordan French Insurance 391,945 4.92 4.80 9
7 Arab Jordanian Insurance Group 130,830 2.08 0.85 11 7 Middle East Insurance 276,784 3.47 2.95 11
8 Middle East Insurance 107,384 1.71 4.20 6 8 Arab Jordanian Insurance Group 235,974 2.96 1.56 13
9 Arabia Insurance-Jordan 67,913 1.08 1.95 9 9 Delta Insurance 198,193 2.49 6.98 8
10 Delta Insurance 62,129 0.99 0.93 10 10 United Insurance 156,361 1.96 2.90 12
11 Arab Life & Accidents Insurance 59,191 0.94 0.84 12 11 Jerusalem Insurance 144,858 1.82 7.21 7
12 National Insurance 59,086 0.94 0.65 13 12 Philadelphia Insurance 133,385 1.67 4.74 10
13 Al Yarmouk Insurance 34,704 0.55 -0.45 16 13 Jordan International Insurance 129,129 1.62 23.22 4
14 Jerusalem Insurance 29,607 0.47 0.49 14 14 Arab Assurers 96,678 1.21 -3.91 17
15 Arab Assurers 6,942 0.11 0.43 15 15 Al Yarmouk Insurance 93,582 1.17 0.26 14
16 Jordan International Insurance -32,527 -0.52 -1.21 17 16 Euro Arab Insurance Group 76,357 0.96 -2.10 16
17 Euro Arab Insurance Group -34,974 -0.56 12.36 4 17 Arabia Insurance-Jordan 24,170 0.30 -2.05 15
18 AL Manara Insurance 18 AL Manara Insurance -9,415 -0.12 -12.41 20
19 Arab Union International Ins. 19 Jordan Emirates Insurance -55,851 -0.70 -45.95 24
20 Jordan Emirates Insurance 20 Arab Union International Ins. -60,481 -0.76 -17.57 22
21 Holy Land Insurance 21 MEDGULF Insurance -95,193 -1.19 -21.21 23
22 Philadelphia Insurance 22 Arab Life & Accidents Insurance -109,076 -1.37 -7.29 19
23 Arab Orient Insurance 23 National Insurance -114,982 -1.44 -5.93 18
24 MEDGULF Insurance 24 Islamic Insurance -351,600 -4.41 -15.83 21
25 First Insurance 25 Holy Land Insurance*
6,288,306 100 100 7,974,383 100 100
* *
Total
The companies classified from 18-25 don´t practice Life Insurance
Total
The company classified under No. 25 doesn’t practice Medical Insurance.
NO. Companies
Share% RankingShare%Ranking Companies
NO.
35
Share% Share%Profit(Loss) Profit(Loss)

2014/12/31 2013/12/31 2014/12/31 2013/12/31 2014/12/31 2013/12/31 2014/12/31 2013/12/31 2014/12/31 2013/12/31 2014/12/31 2013/12/31
1 Jordan Insurance 77,705,845 80,620,359 50,868,975 55,485,654 30,000,000 30,000,000 40,761,367 43,335,560 5,578,592 3,868,794 244% 240%
2 Metlife Alico 71,876,147 70,536,524 56,453,767 60,074,940 4,000,000 4,000,000 14,305,520 13,199,433 4,098,677 4,709,332 174% 170%
3 Middle East Insurance 81,379,033 84,132,562 65,089,076 68,146,731 21,000,000 21,000,000 34,811,998 35,403,386 6,276,787 6,423,505 314% 335%
4 National Insurance 24,567,218 20,284,580 14,104,871 11,499,521 8,000,000 8,000,000 8,378,024 7,053,653 -351,229 -1,402,869 186% 175%
5 United Insurance 34,673,680 29,531,086 15,464,764 13,713,314 8,000,000 8,000,000 12,153,274 11,467,118 1,602,990 1,200,258 174% 182%
6 AL Manara Insurance 20,115,135 18,109,566 12,744,114 11,104,797 7,000,000 21,000,000 5,260,697 5,672,855 -544,429 -14,142,846 106% 114%
7 Arabia Insurance-Jordan 25,637,132 24,099,771 14,374,744 13,638,277 8,000,000 8,000,000 10,766,484 10,381,657 1,425,889 1,101,446 187% 175%
8 Jerusalem Insurance 31,472,910 28,116,222 24,618,876 20,812,467 8,000,000 8,000,000 13,626,165 12,768,348 1,938,071 1,527,747 302% 342%
9 AL-Nisr Al-Arabi Insurance 58,006,902 51,442,475 43,481,732 38,018,078 10,000,000 10,000,000 21,017,715 20,600,543 2,724,733 2,095,299 314% 378%
10 Jordan French Insurance 23,748,081 20,860,597 6,518,904 5,011,537 9,100,000 9,100,000 5,794,791 4,811,292 -3,507,503 -4,520,572 121% 88%
11 Delta Insurance 23,216,375 20,777,706 15,528,821 13,173,552 8,000,000 8,000,000 10,512,480 10,366,024 1,128,639 1,161,832 303% 348%
12 Jordan Emirates Insurance 12,571,519 14,181,609 5,681,371 4,883,285 5,000,000 5,000,000 2,959,257 2,223,808 -2,080,815 -2,742,887 100% 47%
13 Al Yarmouk Insurance 16,166,684 16,893,952 9,211,089 11,007,784 8,000,000 8,000,000 9,886,258 10,271,739 602,151 1,009,084 507% 519%
14 Holy Land Insurance 7,944,644 8,333,164 3,015,937 5,042,026 4,564,156 4,000,000 106,623 -1,072,049 -5,792,124 -5,658,878 26.34% 28.20%
15 Philadelphia Insurance 11,555,015 12,089,107 8,771,460 9,389,967 4,000,000 4,000,000 3,809,842 3,046,143 -817,925 -1,538,016 204% 135%
16 Arab Life & Accidents Ins. 24,895,263 22,949,297 13,964,126 13,050,378 8,000,000 8,000,000 8,797,533 8,032,003 -203,850 -955,429 130.56% 127.47%
17 Arab Union International Ins. 16,123,919 17,164,457 9,395,009 10,083,338 8,000,000 8,000,000 4,638,617 3,823,175 -4,618,268 -5,412,543 117% 104%
18 Arab Assurers 12,823,985 13,653,511 5,857,938 6,288,358 8,000,000 8,000,000 3,094,283 3,033,208 -1,625,260 -1,581,596 86% 46%
19 Euro Arab Insurance Group 24,876,362 20,428,893 15,473,555 11,071,098 8,000,000 8,000,000 9,017,400 7,382,451 33,137 -1,384,413 190% 207%
20 Islamic Insurance 33,635,713 30,336,874 27,689,036 25,031,429 12,000,000 12,000,000 17,572,227 16,861,820 3,849,977 3,140,982 304% 280%
21 Jordan International Ins. 33,430,039 34,085,048 24,773,068 25,648,573 18,150,000 18,150,000 23,479,415 22,266,145 805,137 -267,869 380% 364%
22 Arab Jordanian Ins. Group 15,536,731 13,730,083 6,028,140 4,440,494 8,000,000 9,000,000 5,010,943 3,730,703 -1,475,913 -3,156,592 104% 71%
23 Arab Orient Insurance 94,036,218 83,614,187 38,824,191 31,947,518 21,438,252 20,035,750 31,981,959 28,357,096 6,572,360 4,990,429 168% 165%
24 MEDGULF Insurance 25,596,649 24,215,952 9,360,806 7,774,027 10,000,000 10,000,000 6,617,103 7,302,243 -3,039,852 -2,364,984 182% 152%
25 First Insurance 40,957,561 37,521,138 27,144,494 23,413,369 24,000,000 24,000,000 26,339,480 25,859,561 1,664,423 1,405,969 459% 567%
Total 842,548,760 797,708,720 524,438,864 499,750,512 268,252,408 281,285,750 330,699,455 316,177,915 14,244,395 -12,494,817
NO. CompaniesTotal Assets
36
Retained Earnings (Accumulated)
Profit & (Loss) Solvency Margin
Table (19)
Shareholders' Equity
Insurance Companies Total Assets / Investments / Paid-up Capital / Shareholder`s Equity / Reained Earnings
(Accumulated Profit & (Loss)) and Solvency Margin
Investments Paid Up Capital

Total Assets
CompaniesNO
. Companies
Total Assets , Investments, Paid Up Capital for the year 2014 (JD)
Table (20)
Classification of the Insurance Companies According to
NO
. CompaniesNO
.Investments
Investments Paid Up Capital for (25) companies
Total Paid Up
Assets Capital
1 Arab Orient Insurance 94,036,218 1 Middle East Insurance 65,089,076 1 Jordan Insurance 30,000,000
2 Middle East Insurance 81,379,033 2 Metlife Alico 56,453,767 2 First Insurance 24,000,000
3 Jordan Insurance 77,705,845 3 Jordan Insurance 50,868,975 3 Arab Orient Insurance 21,438,252
4 Metlife Alico 71,876,147 4 AL-Nisr Al-Arabi Insurance 43,481,732 4 Middle East Insurance 21,000,000
5 AL-Nisr Al-Arabi Insurance 58,006,902 5 Arab Orient Insurance 38,824,191 5 Jordan International Ins. 18,150,000
6 First Insurance 40,957,561 6 Islamic Insurance 27,689,036 6 Islamic Insurance 12,000,000
7 United Insurance 34,673,680 7 First Insurance 27,144,494 7 AL-Nisr Al-Arabi Insurance 10,000,000
8 Islamic Insurance 33,635,713 8 Jordan International Ins. 24,773,068 8 MEDGULF Insurance 10,000,000
9 Jordan International Ins. 33,430,039 9 Jerusalem Insurance 24,618,876 9 Jordan French Insurance 9,100,000
10 Jerusalem Insurance 31,472,910 10 Delta Insurance 15,528,821 10 Arab Life & Accidents Ins. 8,000,000
11 Arabia Insurance-Jordan 25,637,132 11 Euro Arab Insurance Group 15,473,555 11 Arab Jordanian Ins. Group 8,000,000
12 MEDGULF Insurance 25,596,649 12 United Insurance 15,464,764 12 Arab Assurers 8,000,000
13 Arab Life & Accidents Ins. 24,895,263 13 Arabia Insurance-Jordan 14,374,744 13 National Insurance 8,000,000
14 Euro Arab Insurance Group 24,876,362 14 National Insurance 14,104,871 14 United Insurance 8,000,000
15 National Insurance 24,567,218 15 Arab Life & Accidents Ins. 13,964,126 15 Jerusalem Insurance 8,000,000
16 Jordan French Insurance 23,748,081 16 AL Manara Insurance 12,744,114 16 Arabia Insurance-Jordan 8,000,000
17 Delta Insurance 23,216,375 17 Arab Union International Ins. 9,395,009 17 Delta Insurance 8,000,000
18 AL Manara Insurance 20,115,135 18 MEDGULF Insurance 9,360,806 18 Al Yarmouk Insurance 8,000,000
19 Al Yarmouk Insurance 16,166,684 19 Al Yarmouk Insurance 9,211,089 19 Arab Union International Ins. 8,000,000
20 Arab Union International Ins. 16,123,919 20 Philadelphia Insurance 8,771,460 20 Euro Arab Insurance Group 8,000,000
21 Arab Jordanian Ins. Group 15,536,731 21 Jordan French Insurance 6,518,904 21 AL Manara Insurance 7,000,000
22 Arab Assurers 12,823,985 22 Arab Jordanian Ins. Group 6,028,140 22 Jordan Emirates Insurance 5,000,000
23 Jordan Emirates Insurance 12,571,519 23 Arab Assurers 5,857,938 23 Holy Land Insurance 4,564,156
24 Philadelphia Insurance 11,555,015 24 Jordan Emirates Insurance 5,681,371 24 Metlife Alico 4,000,000
25 Holy Land Insurance 7,944,644 25 Holy Land Insurance 3,015,937 25 Philadelphia Insurance 4,000,000
842,548,760 524,438,864 268,252,408 Total
Companies
Total Total
NO
. Companies
37
NO
. CompaniesNO
.Investments

Classification of the Insurance Companies According to
Shareholders
EquityNO. Companies
Table (21)
Statutory
ReserveNO.
NO. Companies
NO. Companies
Retained Earnings
Accumulated Profit &
Loss
Shareholders Equity,Retained Earnings (Accumulated Profit & Loss),Statutory Reserve,Voluntary Reserve for the year 2014 (JD)
CompaniesVoluntary
Reserve
1 Jordan Insurance 40,761,367 1 Arab Orient Insurance 6,572,360 1 Jordan Insurance 7,500,000 1 Jerusalem Insurance 1,598,443
2 Middle East Insurance 34,811,998 2 Middle East Insurance 6,276,787 2 Middle East Insurance 4,431,624 2 AL-Nisr Al-Arabi Insurance 1,326,652
3 Arab Orient Insurance 31,981,959 3 Jordan Insurance 5,578,592 3 Arab Orient Insurance 3,971,347 3 Middle East Insurance 1,200,000
4 First Insurance 26,339,480 4 Metlife Alico 4,098,677 4 AL-Nisr Al-Arabi Insurance 2,511,180 4 Islamic Insurance 247,218
5 Jordan International Ins. 23,479,415 5 Islamic Insurance 3,849,977 5 Jordan International Ins. 2,419,770 5 Arab Assurers 194,619
6 AL-Nisr Al-Arabi Insurance 21,017,715 6 AL-Nisr Al-Arabi Insurance 2,724,733 6 Jerusalem Insurance 2,089,651 6 Arabia Insurance-Jordan 174,717
7 Islamic Insurance 17,572,227 7 Jerusalem Insurance 1,938,071 7 Islamic Insurance 1,871,852 7 United Insurance 164,472
8 Metlife Alico 14,305,520 8 First Insurance 1,664,423 8 United Insurance 1,802,739 8 Holy Land Insurance 22,561
9 Jerusalem Insurance 13,626,165 9 United Insurance 1,602,990 9 Arab Life & Accidents Ins. 1,609,070 9 Delta Insurance 15,948
10 United Insurance 12,153,274 10 Arabia Insurance-Jordan 1,425,889 10 Delta Insurance 1,399,929 10 Euro Arab Insurance Group 15,676
11 Arabia Insurance-Jordan 10,766,484 11 Delta Insurance 1,128,639 11 Al Yarmouk Insurance 1,284,107 11 Arab Jordanian Ins. Group 12,803
12 Delta Insurance 10,512,480 12 Jordan International Ins. 805,137 12 Arab Union International Ins. 1,263,605 12 National Insurance 11,000
13 Al Yarmouk Insurance 9,886,258 13 Al Yarmouk Insurance 602,151 13 Jordan French Insurance 1,179,249 13 Jordan French Insurance
14 Euro Arab Insurance Group 9,017,400 14 Euro Arab Insurance Group 33,137 14 Arabia Insurance-Jordan 1,071,249 14 Arab Union International Ins.
15 Arab Life & Accidents Ins. 8,797,533 15 Arab Life & Accidents Ins. -203,850 15 Euro Arab Insurance Group 968,587 15 Jordan Emirates Insurance
16 National Insurance 8,378,024 16 National Insurance -351,229 16 First Insurance 845,986 16 Al Yarmouk Insurance
17 MEDGULF Insurance 6,617,103 17 AL Manara Insurance -544,429 17 National Insurance 809,542 17 Jordan Insurance
18 Jordan French Insurance 5,794,791 18 Philadelphia Insurance -817,925 18 Arab Jordanian Ins. Group 796,065 18 Philadelphia Insurance
19 AL Manara Insurance 5,260,697 19 Arab Jordanian Ins. Group -1,475,913 19 Arab Assurers 697,225 19 AL Manara Insurance
20 Arab Jordanian Ins. Group 5,010,943 20 Arab Assurers -1,625,260 20 Philadelphia Insurance 692,231 20 Arab Orient Insurance
21 Arab Union International Ins. 4,638,617 21 Jordan Emirates Insurance -2,080,815 21 Holy Land Insurance 637,965 21 Arab Life & Accidents Ins.
22 Philadelphia Insurance 3,809,842 22 MEDGULF Insurance -3,039,852 22 AL Manara Insurance 508,534 22 Jordan International Ins.
23 Arab Assurers 3,094,283 23 Jordan French Insurance -3,507,503 23 Jordan Emirates Insurance 321,037 23 First Insurance
24 Jordan Emirates Insurance 2,959,257 24 Arab Union International Ins. -4,618,268 24 MEDGULF Insurance 80,307 24 MEDGULF Insurance
25 Holy Land Insurance 106,623 25 Holy Land Insurance -5,792,124 25 Metlife Alico 25 Metlife Alico
330,699,455 14,244,395 40,762,851 4,984,109
Shareholders
EquityNO. Companies
Statutory
ReserveNO.
NO. Companies
NO. Companies
Retained Earnings
Accumulated Profit &
Loss
38
Total
CompaniesVoluntary
Reserve
Total Total Total

31/12/2014 31/12/2013 31/12/2014 31/12/2013
1 Jordan Insurance 1,394,332 1,276,903 625,452 771,823
2 Metlife Alico 1,096,347 1,221,977 1,180,060 1,312,844
3 Middle East Insurance 6,242,243 7,318,595 390,991 541,505
4 National Insurance 726,376 790,570 923,407 860,461
5 United Insurance 265,144 253,016 495,214 371,222
6 AL Manara Insurance 2,120,664 2,204,952 544,850 460,963
7 Arabia Insurance-Jordan 2,907,795 3,007,881 529,682 518,481
8 Jerusalem Insurance 877,165 794,404 695,554 690,851
9 AL-Nisr Al-Arabi Insurance 3,966,077 3,789,072 1,006,846 1,010,472
10 Jordan French Insurance 1,697,800 1,691,998 678,755 749,936
11 Delta Insurance 3,199,625 3,214,955 456,392 198,703
12 Jordan Emirates Insurance 242,386 349,249 447,436 246,312
13 Al Yarmouk Insurance 540,559 544,446 107,210 119,944
14 Holy Land Insurance 431,913 335,931 150,382 180,185
15 Philadelphia Insurance 284,890 299,849 166,579 153,057
16 Arab Life & Accidents Ins. 1,149,309 1,014,583 698,258 534,691
17 Arab Union International Ins. 2,350,601 2,519,246 97,742 88,341
18 Arab Assurers 1,695,339 1,754,997 359,212 378,093
19 Islamic Insurance 748,936 790,331 332,193 352,645
20 Euro Arab Insurance Group 3,527,705 3,624,936 505,372 283,228
21 Jordan International Ins. 2,324,025 2,409,598 599,640 318,262
22 Arab Jordanian Ins. Group 4,850,083 5,153,436 367,724 425,724
23 Arab Orient Insurance 5,384,874 5,534,586 1,039,467 648,191
24 MEDGULF Insurance 7,690,293 7,628,246 248,077 231,460
25 First Insurance 2,039,410 2,089,516 412,504 315,928
57,753,891 59,613,273 13,058,999 11,763,322
Table (22)
39
Total
Fixed Assets
Fixed & Other Assets for Insurance Companies As in 31/12/2014 & 31/12/2013 (JD)
NO. CompaniesOther Assets
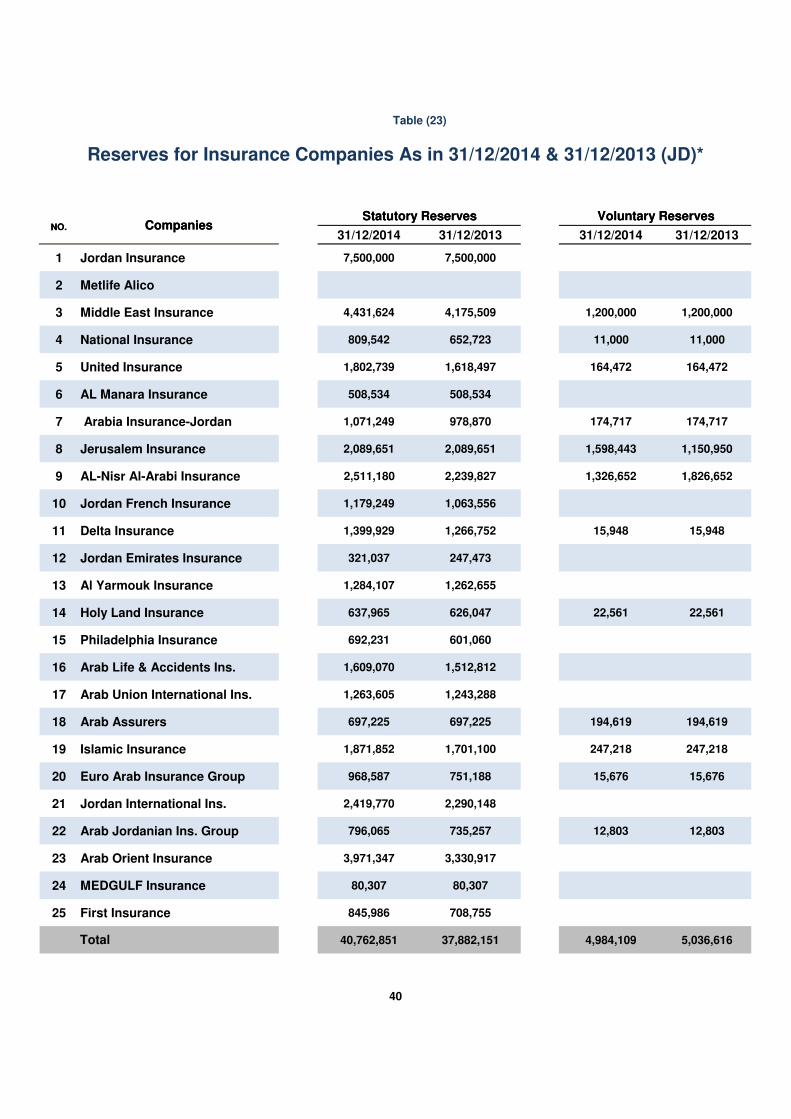
NO. Companies
Table (23)
Statutory Reserves Voluntary Reserves
Reserves for Insurance Companies As in 31/12/2014 & 31/12/2013 (JD)*
31/12/2014 31/12/2013 31/12/2014 31/12/2013
1 Jordan Insurance 7,500,000 7,500,000
2 Metlife Alico
3 Middle East Insurance 4,431,624 4,175,509 1,200,000 1,200,000
4 National Insurance 809,542 652,723 11,000 11,000
5 United Insurance 1,802,739 1,618,497 164,472 164,472
6 AL Manara Insurance 508,534 508,534
7 Arabia Insurance-Jordan 1,071,249 978,870 174,717 174,717
8 Jerusalem Insurance 2,089,651 2,089,651 1,598,443 1,150,950
9 AL-Nisr Al-Arabi Insurance 2,511,180 2,239,827 1,326,652 1,826,652
10 Jordan French Insurance 1,179,249 1,063,556
11 Delta Insurance 1,399,929 1,266,752 15,948 15,948
12 Jordan Emirates Insurance 321,037 247,473
13 Al Yarmouk Insurance 1,284,107 1,262,655
14 Holy Land Insurance 637,965 626,047 22,561 22,561
15 Philadelphia Insurance 692,231 601,060
16 Arab Life & Accidents Ins. 1,609,070 1,512,812
17 Arab Union International Ins. 1,263,605 1,243,288
18 Arab Assurers 697,225 697,225 194,619 194,619
19 Islamic Insurance 1,871,852 1,701,100 247,218 247,218
20 Euro Arab Insurance Group 968,587 751,188 15,676 15,676
21 Jordan International Ins. 2,419,770 2,290,148
22 Arab Jordanian Ins. Group 796,065 735,257 12,803 12,803
23 Arab Orient Insurance 3,971,347 3,330,917
24 MEDGULF Insurance 80,307 80,307
25 First Insurance 845,986 708,755
40,762,851 37,882,151 4,984,109 5,036,616
NO. Companies
40
Total
Statutory Reserves Voluntary Reserves

Total
ShareholdersTotal
EquityCapital Base
40,761,36740,761,367-2,317,2255,578,5927,500,00030,000,000Jordan Insurance1
34,811,99834,811,9981,903,5876,276,7871,200,0004,431,62421,000,000Middle East Insurance2
8,378,0248,378,024-91,289-351,22911,000809,5428,000,000National Insurance3
12,153,27412,153,274541,56641,5071,602,990164,4721,802,7398,000,000United Insurance4
5,260,6976,449,177-514,928-544,429508,5347,000,000AL Manara Insurance5
10,766,48410,766,48494,6291,425,889174,7171,071,2498,000,000Arabia Insurance - Jordan6
13,626,16513,626,1651,938,0711,598,4432,089,6518,000,000Jerusalem Insurance7
21,017,71521,017,715705,1503,750,0002,724,7331,326,6522,511,18010,000,000AL-Nisr Al-Arabi Insurance8
5,794,7915,794,791-976,955-3,507,5031,179,2499,100,000Jordan French Insurance9
4,638,6174,638,617-6,720-4,618,2681,263,6058,000,000Arab Union International Ins.10
10,512,48010,512,480-32,0361,128,63915,9481,399,9298,000,000Delta Insurance11
2,959,2572,959,257-280,965-2,080,815321,0375,000,000Jordan Emirates Insurance12
9,886,2589,886,258602,1511,284,1078,000,000Al Yarmouk Insurance13
106,623-826,676-100,000-159,234-5,792,12422,561637,9654,564,156Holy Land Insurance14
8,797,5338,797,533-607,687-203,8501,609,0708,000,000Arab Life & Accidents Ins.15
3,809,8423,809,842-64,464-817,925692,2314,000,000Philadelphia Insurance16
23,479,41523,159,0611,781,929805,1372,2252,419,77018,150,000Jordan International Ins.17
17,572,22717,572,227-396,8203,849,977247,2181,871,85212,000,000Islamic Insurance18
3,094,2833,094,283-1,667,301-2,505,000-1,625,260194,619697,2258,000,000Arab Assurers19
5,010,9434,472,190-2,860,765-1,475,91312,803796,0658,000,000Arab Jordanian Ins. Group20
31,981,95931,981,9596,572,3603,971,34721,438,252Arab Orient Insurance21
9,017,4009,017,40033,13715,676968,5878,000,000Euro Arab Insurance Group22
14,305,5209,570,9911,472,3144,098,6774,000,000MetLife Alico23
6,617,1036,617,103-423,352-3,039,85280,30710,000,000MEDGULF Insurance24
26,339,48026,339,480-170,9291,664,423845,98624,000,000First Insurance 25
330,699,455325,361,0000-1,151,496-1,733,49214,244,3952,2254,984,10940,762,851268,252,408
41
NO. Companies
Table (24)
Retained Earnings
Accumulated Profit
& Loss
Insurance Companies Balance Sheet Indicators For (25) Insurance Companies
as in 31/12/2014 (JD)
Paid Up Capital Statutory
Reserve
Voluntary
Reserve
Other Capital
Reserves
Total
Premiums
(Discount) on
Paid Up Capital
Change in Fair
Value for Property
Investments
Accumulated
Change in
Evaluating Financial
Assets Availabel for
Sale

Total
Shareholders Total
EquityCapital Base
43,335,56043,335,5601,966,7663,868,7947,500,00030,000,000Jordan Insurance1
35,403,38635,403,3862,604,3726,423,5051,200,0004,175,50921,000,000Middle East Insurance2
7,053,6537,053,653-207,201-1,402,86911,000652,7238,000,000National Insurance3
11,467,11811,467,118442,38441,5071,200,258164,4721,618,4978,000,000United Insurance4
5,672,8556,896,341-469,347-14,142,846508,53421,000,000AL Manara Insurance5
10,381,65710,381,657126,6241,101,446174,717978,8708,000,000Arabia Insurance - Jordan6
12,768,34812,768,3481,527,7471,150,9502,089,6518,000,000Jerusalem Insurance7
20,600,54320,600,543688,7653,750,0002,095,2991,826,6522,239,82710,000,000AL-Nisr Al-Arabi Insurance8
4,811,2924,811,292-831,692-4,520,5721,063,5569,100,000Jordan French Insurance9
3,823,1753,823,175-7,570-5,412,5431,243,2888,000,000Arab Union International Ins.10
10,366,02410,366,024-78,5081,161,83215,9481,266,7528,000,000Delta Insurance11
2,223,8082,223,808-280,778-2,742,887247,4735,000,000Jordan Emirates Insurance12
10,271,73910,271,7391,009,0841,262,6558,000,000Al Yarmouk Insurance13
-1,072,049-1,072,049-100,00038,221-5,658,87822,561626,0474,000,000Holy Land Insurance14
8,032,0038,032,003-525,380-955,4291,512,8128,000,000Arab Life & Accidents Ins.15
3,046,1433,046,143-16,901-1,538,016601,0604,000,000Philadelphia Insurance16
22,266,14521,956,4331,781,929-267,8692,2252,290,14818,150,000Jordan International Ins.17
16,861,82016,861,820-227,4803,140,982247,2181,701,10012,000,000Islamic Insurance18
3,033,2083,033,208-1,772,040-2,505,000-1,581,596194,619697,2258,000,000Arab Assurers19
3,730,7033,730,703-2,860,765-3,156,59212,803735,2579,000,000Arab Jordanian Ins. Group20
28,357,09628,357,0964,990,4293,330,91720,035,750Arab Orient Insurance21
7,382,4517,382,451-1,384,41315,676751,1888,000,000Euro Arab Insurance Group22
13,199,43310,101,5381,392,2064,709,3324,000,000MetLife Alico23
7,302,2437,302,243-413,080-2,364,98480,30710,000,000MEDGULF Insurance24
25,859,56125,859,561-255,1631,405,969708,75524,000,000First Insurance 25
316,177,915313,993,79403,817,906-1,536,037-12,494,8172,2255,036,61637,882,151281,285,750
42
Retained
Earnings
Accumulated
Profit &
Loss
Insurance Companies Balance Sheet Indicators For (25) Insurance Companies
as in 31/12/2013 (JD)
Paid Up
Capital
Statutory
Reserve
Voluntary
Reserve
Total
NO. Companies
Premiums
(Discount)
on Paid Up
Capital
Change in Fair
Value for
Property
Investments
Accumulated
Change in
Evaluating Financial
Assets Availabel for
Sale
Other
Capital
Reserves
Table (25)
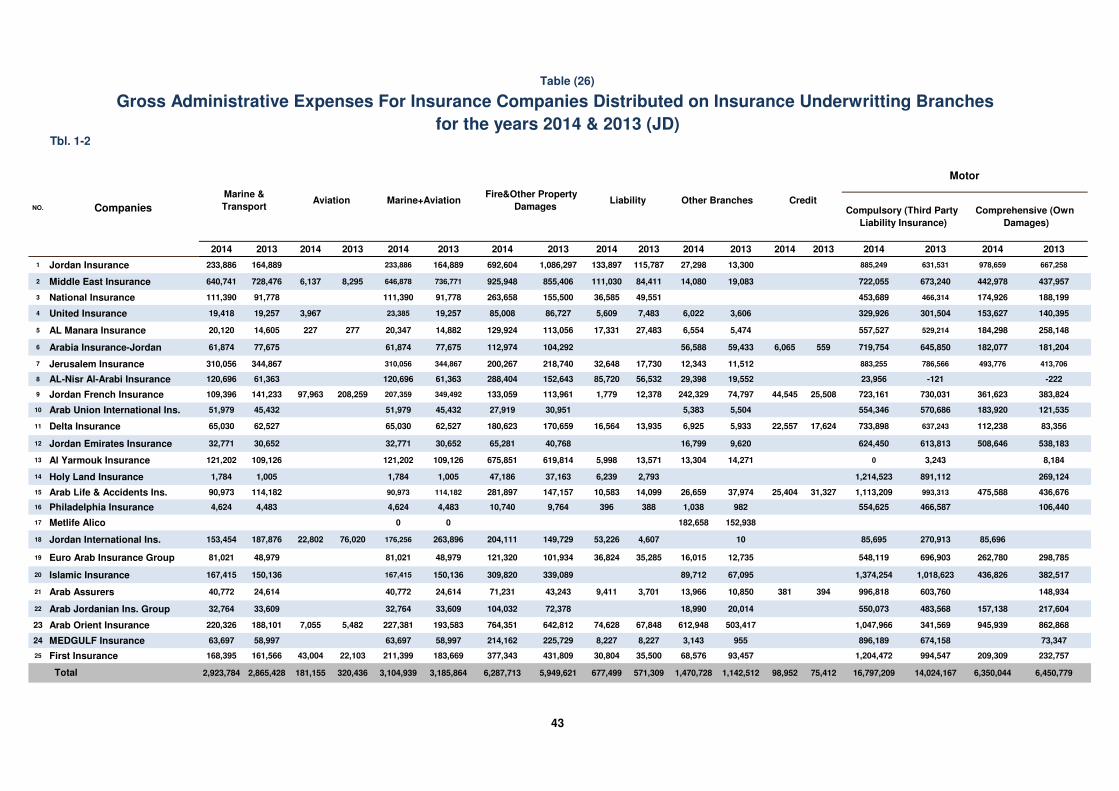
Tbl. 1-2
201320142013201420132014201320142013201420132014201320142013201420132014
667,258978,659631,531885,24913,30027,298115,787133,8971,086,297692,604164,889233,886164,889233,886Jordan Insurance1
437,957442,978673,240722,05519,08314,08084,411111,030855,406925,948736,771646,8788,2956,137728,476640,741Middle East Insurance2
188,199174,926466,314453,68949,55136,585155,500263,65891,778111,39091,778111,390National Insurance3
140,395153,627301,504329,9263,6066,0227,4835,60986,72785,00819,25723,3853,96719,25719,418United Insurance4
258,148184,298529,214557,5275,4746,55427,48317,331113,056129,92414,88220,34727722714,60520,120AL Manara Insurance 5
181,204182,077645,850719,7545596,06559,43356,588104,292112,97477,67561,87477,67561,874Arabia Insurance-Jordan6
413,706493,776786,566883,25511,51212,34317,73032,648218,740200,267344,867310,056344,867310,056Jerusalem Insurance7
-222-12123,95619,55229,39856,53285,720152,643288,40461,363120,69661,363120,696AL-Nisr Al-Arabi Insurance8
383,824361,623730,031723,16125,50844,54574,797242,32912,3781,779113,961133,059349,492207,359208,25997,963141,233109,396Jordan French Insurance9
121,535183,920570,686554,3465,5045,38330,95127,91945,43251,97945,43251,979Arab Union International Ins.10
83,356112,238637,243733,89817,62422,5575,9336,92513,93516,564170,659180,62362,52765,03062,52765,030Delta Insurance11
538,183508,646613,813624,4509,62016,79940,76865,28130,65232,77130,65232,771Jordan Emirates Insurance12
8,1843,243014,27113,30413,5715,998619,814675,851109,126121,202109,126121,202Al Yarmouk Insurance13
269,124891,1121,214,5232,7936,23937,16347,1861,0051,7841,0051,784Holy Land Insurance14
436,676475,588993,3131,113,20931,32725,40437,97426,65914,09910,583147,157281,897114,18290,973114,18290,973Arab Life & Accidents Ins.15
106,440466,587554,6259821,0383883969,76410,7404,4834,6244,4834,624Philadelphia Insurance16
152,938182,65800Metlife Alico17
85,696270,91385,695104,60753,226149,729204,111263,896176,25676,02022,802187,876153,454Jordan International Ins.18
298,785262,780696,903548,11912,73516,01535,28536,824101,934121,32048,97981,02148,97981,021Euro Arab Insurance Group19
382,517436,8261,018,6231,374,25467,09589,712339,089309,820150,136167,415150,136167,415Islamic Insurance20
148,934603,760996,81839438110,85013,9663,7019,41143,24371,23124,61440,77224,61440,772Arab Assurers21
217,604157,138483,568550,07320,01418,99072,378104,03233,60932,76433,60932,764Arab Jordanian Ins. Group22
862,868945,939341,5691,047,966503,417612,94867,84874,628642,812764,351193,583227,3815,4827,055188,101220,326Arab Orient Insurance23
73,347674,158896,1899553,1438,2278,227225,729214,16258,99763,69758,99763,697MEDGULF Insurance24
232,757209,309994,5471,204,47293,45768,57635,50030,804431,809377,343183,669211,39922,10343,004161,566168,395First Insurance25
6,450,7796,350,04414,024,16716,797,20975,41298,9521,142,5121,470,728571,309677,4995,949,6216,287,7133,185,8643,104,939320,436181,1552,865,4282,923,784 Total
Gross Administrative Expenses For Insurance Companies Distributed on Insurance Underwritting Branches
Comprehensive (Own
Damages)
Credit Fire&Other Property
Damages
Table (26)
Other BranchesNO.
AviationCompulsory (Third Party
Liability Insurance)
א�����������ط
Motor
Companies
for the years 2014 & 2013 (JD)
Liability Marine &
TransportMarine+Aviation
43

جدول رقم (2)
201320142013201420132014201320142013201420132014
4,113,3074,556,3481,434,2451,604,755837,0461,018,266597,199586,4892,679,0622,951,5931,298,7891,863,9081
3,276,2343,376,698469,366513,729259,322211,249210,044302,4802,806,8682,862,9691,111,1971,165,0332
1,217,2141,306,780265,872266,53248,32736,885217,545229,647951,3421,040,248654,513628,6153
740,872822,313181,900218,73653,99349,275127,907169,461558,972603,577441,899483,5534
1,039,216970,03190,95954,05090,95954,050948,257915,981787,362741,8255
1,480,2231,534,877411,210395,545175,878130,658235,332264,8871,069,0131,139,332827,054901,8316
2,080,0472,245,973286,926313,62835,11038,279251,816275,3491,793,1211,932,3451,200,2721,377,0317
3,421,4844,255,1503,131,7373,706,9762,248,9532,488,423882,7841,218,553289,747548,174-34323,9568
2,575,0852,881,375885,0941,167,520158,352160,180726,7421,007,3401,689,9911,713,8551,113,8551,084,7849
964,152937,710190,044114,163190,044114,163774,108823,547692,221738,26610
1,158,1011,317,881166,824180,04610,65214,680156,172165,366991,2771,137,835720,599846,13611
1,569,6961,418,859336,660170,912336,660170,9121,233,0361,247,9471,151,9961,133,09612
1,180,7971,266,935412,588450,58028,07454,909384,514395,671768,209816,35511,42713
1,201,1971,269,732001,201,1971,269,7321,160,2361,214,52314
2,390,9102,713,261616,182688,948158,250148,598457,932540,3501,774,7282,024,3131,429,9891,588,79715
677,287695,78088,643124,35788,643124,357588,644571,423573,027554,62516
1,744,3532,258,4641,591,4152,075,8061,243,0221,609,760348,393466,046152,938182,65817
1,345,7571,225,981656,602620,997169,020137,837487,582483,160689,155604,984270,913171,39118
1,572,4671,657,085377,846591,00664,49379,572313,353511,4341,194,6211,066,079995,688810,89919
3,260,3654,075,7971,302,9051,697,770537,901795,527765,004902,2431,957,4602,378,0271,401,1401,811,08020
1,114,0041,303,521278,508170,9421,566124276,942170,818835,4961,132,579752,694996,81821
1,043,8231,174,124216,650311,12731,87345,640184,777265,487827,173862,997701,172707,21122
7,156,0148,082,0614,008,9694,408,8484,008,9694,408,8483,147,0453,673,2131,739,3851,993,90523
1,527,8981,774,128486,485588,710486,485588,7101,041,4131,185,418747,505896,18924
2,688,2143,001,723716,475899,820716,475899,8201,971,7392,101,9031,227,3041,413,78125
50,538,71756,122,58718,604,10521,335,5036,061,8327,019,86212,542,27314,315,64131,934,61234,787,08421,009,89423,147,253
Table (26)
Arab Orient Insurance
Total
First Insurance
MEDGULF Insurance
National Insurance
Metlife Alico
NO.
Gross Administrative Expenses For Insurance Companies Distributed on Insurance Underwritting Branches
LifeNon Life Insurances
for the years 2014 & 2013 (JD)
Arab Assurers
Holy Land Insurance
Jordan International Ins.
Arab Life & Accidents Ins.
Islamic Insurance
Euro Arab Insurance Group
Philadelphia Insurance
Middle East Insurance
Medical Gross ExpensesMedical+Life
Motor
Motor (Compulsory (Third Party
Liability Ins.) & Comprehensive
(Own Damages))
Companies
Arab Jordanian Ins. Group
Tbl. 2-2
Arab Union International Ins.
Jordan Insurance
AL Manara Insurance
Al Yarmouk Insurance
United Insurance
44
Jordan Emirates Insurance
Jerusalem Insurance
Arabia Insurance-Jordan
Jordan French Insurance
Delta Insurance
AL-Nisr Al-Arabi Insurance

2014/12/31 2013/12/31 2014/12/31 2013/12/31 2014/12/31 2013/12/31 2014/12/31 2013/12/31
1- Jordan Insurance 4,556,348 4,113,307 3,923,802 3,641,777 213,066 213,066 7,294,387 6,678,546
2- Metlife Alico 2,258,464 1,744,353 1,303,120 1,224,224 96,810 96,810 2,824,545 2,180,442
3- Middle East Insurance 3,376,698 3,276,234 2,287,581 2,227,198 194,018 182,712 4,011,214 3,874,446
4- National Insurance 1,306,780 1,217,214 856,397 804,986 150,694 101,908 1,525,071 1,419,297
5- United Insurance 822,313 740,872 541,717 505,844 116,441 93,760 1,027,891 926,090
6- AL Manara Insurance 970,031 1,039,216 649,150 748,473 78,093 78,093 1,212,541 1,299,021
7- Arabia Insurance-Jordan 1,534,877 1,480,223 965,127 967,807 98,224 91,304 1,924,763 1,859,279
8- Jerusalem Insurance 2,245,973 2,080,047 1,447,356 1,321,726 179,940 174,314 2,524,881 2,330,920
9- AL-Nisr Al-Arabi Insurance 4,255,150 3,421,484 2,720,308 2,584,522 146,268 146,268 4,420,287 4,001,981
10- Jordan French Insurance 2,881,375 2,575,085 1,888,773 1,673,462 167,792 138,916 3,601,718 3,218,854
11- Delta Insurance 1,317,881 1,158,101 937,115 923,685 83,376 71,078 1,692,350 1,492,626
12- Jordan Emirates Insurance 1,418,859 1,569,696 948,049 1,049,530 93,408 161,267 1,773,574 1,962,119
13- Al Yarmouk Insurance 1,266,935 1,180,797 755,239 718,734 61,567 60,181 1,503,979 1,386,513
14- Holy Land Insurance 1,269,732 1,201,197 780,560 767,014 95,998 126,619 1,587,167 1,501,497
15- Philadelphia Insurance 695,780 677,287 477,227 486,544 32,484 32,484 869,723 846,608
16- Arab Life & Accidents Ins. 2,713,261 2,390,910 2,341,879 2,014,911 91,242 91,242 4,306,542 3,231,316
17- Arab Union International Ins. 937,710 964,152 532,459 599,303 78,871 97,018 1,070,046 1,093,485
18- Arab Assurers 1,303,521 1,114,004 806,193 766,856 1,623,111 1,431,280
19- Islamic Insurance 4,075,797 3,260,365 1,624,871 1,554,292 127,729 127,729 2,546,356 2,412,971
20- Euro Arab Insurance Group 1,657,085 1,572,467 1,143,124 1,047,828 88,318 88,318 1,933,915 1,965,583
21- Jordan International Ins. 1,225,981 1,345,757 998,820 1,127,781 86,926 86,926 2,082,383 2,197,010
22- Arab Jordanian Ins. Group 1,174,124 1,043,823 921,125 799,355 86,926 86,926 1,467,655 1,304,779
23- Arab Orient Insurance 8,082,061 7,156,014 5,077,540 4,615,385 721,390 645,374 10,102,575 8,945,017
24- MEDGULF Insurance 1,774,128 1,527,898 1,025,921 860,559 194,190 180,768 2,076,386 1,792,788
25- First Insurance 3,001,723 2,688,214 1,342,796 1,346,956 137,042 137,042 2,408,117 2,316,658
Total 56,122,587 50,538,717 36,296,249 34,378,752 3,420,813 3,310,123 67,411,177 61,669,126
Table (27)
Administrative Expenses Salaries, Wages
45
Insurance Commission's Gross Administrative
Gross Administrative & General Expenses For Jordan Insurance Companies
As in 31/12/2014 & 31/12/2013 (JD)
No. Companies Allocated on Underwriting Accounts Fees Expenses & Remunerations

2009 2010 2011 2012 2013 2014 2009 2010 2011 2012 2013 2014 2009 2010 2011 2012 2013 2014
24,945,796 24,613,910 30,738,029 30,150,137 28,086,631 28,658,379 23,695,360 23,015,463 28,713,571 27,649,083 26,065,181 26,107,102 1,250,436 1,598,447 2,024,458 2,501,054 2,021,450 2,551,277
53,490,355 56,342,885 57,369,057 60,651,004 68,339,553 69,119,571 48,264,252 50,102,385 50,592,542 53,224,955 60,466,913 62,763,203 5,226,103 6,240,500 6,776,515 7,426,049 7,872,640 6,356,368
150,027,925 176,714,739 184,688,009 193,332,018 201,672,152 212,529,078 135,463,227 160,206,678 172,027,155 177,282,887 184,710,549 193,003,573 14,564,698 16,508,061 12,660,854 16,049,131 16,961,603 19,525,505
94,006,060 121,905,641 127,943,934 134,236,208 136,353,271 145,626,143 83,282,939 109,180,067 118,197,518 121,880,030 10,723,121 12,725,574 9,746,416 12,356,178 13,028,776 15,560,521
56,021,865 54,809,098 56,744,075 59,095,810 65,318,881 66,902,935 52,180,288 51,026,611 53,829,637 55,402,857 61,386,054 62,937,951 3,841,577 3,782,487 2,914,438 3,692,953 3,932,827 3,964,984
607,708 464,035 455,009 307,160 397,979 699,052 607,708 464,035 455,009 307,160 397,979 699,052 0 0 0 0 0 0
19,080,124 18,414,831 17,432,140 15,953,296 17,648,639 19,935,818 18,444,630 17,770,984 16,828,158 14,943,659 16,361,977 18,278,445 635,494 643,847 603,982 1,009,637 1,286,662 1,657,373
248,151,908 276,550,400 290,682,244 300,393,615 316,144,954 330,941,898 226,475,177 251,559,545 268,616,435 273,407,744 288,002,599 300,851,375 21,676,731 24,990,855 22,065,809 26,985,871 28,142,355 30,090,523
34,877,796 38,038,112 40,800,332 43,766,880 47,437,142 53,096,513 33,239,656 36,056,531 38,611,210 40,970,078 44,177,132 48,909,527 1,638,140 1,981,581 2,189,122 2,796,802 3,260,010 4,186,986
82,123,550 94,026,914 105,948,171 117,506,160 127,349,809 141,669,761 76,991,419 88,473,426 100,009,417 107,484,653 116,595,072 128,628,618 5,132,131 5,553,488 5,938,754 10,021,507 10,754,737 13,041,143
117,001,346 132,065,026 146,748,503 161,273,040 174,786,951 194,766,274 110,231,075 124,529,957 138,620,627 148,454,731 160,772,204 177,538,145 6,770,271 7,535,069 8,127,876 12,818,309 14,014,747 17,228,129
365,153,254 408,615,426 437,430,747 461,666,655 490,931,905 525,708,172 336,706,252 376,089,502 407,237,062 421,862,475 448,774,803 478,389,520 28,447,002 32,525,924 30,193,685 39,804,180 42,157,102 47,318,652
2009 2010 2011 2012 2013 2014 2009 2010 2011 2012 2014 2014 2009 2010 2011 2012 2013 2014
24,945,796 24,613,910 30,738,029 30,150,137 28,086,631 28,658,379 95 94 93 92 93 91 5 6 7 8 7 9
53,490,355 56,342,885 57,369,057 60,651,004 68,339,553 69,119,571 90 89 88 88 88 91 10 11 12 12 12 9
150,027,925 176,714,739 184,688,009 193,332,018 201,672,152 212,529,078 90 91 93 92 92 91 10 9 7 8 8 9
94,006,060 121,905,641 127,943,934 134,236,208 136,353,271 145,626,143 89 90 92 91 0 0 11 10 8 9 10 11
56,021,865 54,809,098 56,744,075 59,095,810 65,318,881 66,902,935 93 93 95 94 94 94 7 7 5 6 6 6
607,708 464,035 455,009 307,160 397,979 699,052 100 100 100 100 100 100 0 0 0 0 0 0
19,080,124 18,414,831 17,432,140 15,953,296 17,648,639 19,935,818 97 97 97 94 93 92 3 3 3 6 7 8
248,151,908 276,550,400 290,682,244 300,393,615 316,144,954 330,941,898 91 91 92 91 91 91 9 9 8 9 9 9
34,877,796 38,038,112 40,800,332 43,766,880 47,437,142 53,096,513 95 95 95 94 93 92 5 5 5 6 7 8
82,123,550 94,026,914 105,948,171 117,506,160 127,349,809 141,669,761 94 94 94 91 92 91 6 6 6 9 8 9
117,001,346 132,065,026 146,748,503 161,273,040 174,786,951 194,766,274 94 94 94 92 92 91 6 6 6 8 8 9
365,153,254 408,615,426 437,430,747 461,666,655 490,931,905 525,708,172 92 92 93 91 91 91 8 8 7 9 9 9
*
**
Total General Insurances
Life Assurance
Takaful Insurance Share % from Gross Insurance Branch Premiums
46
Comprehensive (Own Damage)Ins.
Credit Insurance
Medical Insurance
Compulsory (Third Party Liability Ins.)
1- Islamic Insurance Company
Two insurance companies practice Takaful Insurance out of 25 insurace companies operating in Jordan after liquidate Al-Barakah Takaful :
Takaful Insurance Premiums Share % from Gross Jordanian Insurance Market Premiums (According to Branches)*
General Accident Insurance
Table (28)
Branch / Year
Gross Insurance Market Premiums Traditional Insurance Share % from Gross Insurance Branch Premiums
Marine Insurance
Fire Insurance
Motor Insurance
Marine Insurance
Takaful Insurance Premiums Share from Gross Jordanian Insurance Market Premiums *
Takaful Insurance Share % from Gross Insurance Market Premiums
For the years 2009-2014 (JD)
Traditional Insurance Share % from Gross Insurance Market PremiumsGross Insurance Market Premiums
Total
Comprehensive (Own Damage)Ins.
Credit Insurance
General Accident Insurance
Life Assurance
Total Life & Medical Insurances
Total Life & Medical Insurances
Total
Insurance Commission annuled Al-Barakah Takaful insurance company from 12/12/2011 & later decided to liquidate the company from 8/1/2014
Branch / Year
Medical Insurance
Compulsory (Third Party Liability Ins.)
Motor Insurance
Fire Insurance
Total General Insurances
2- First Insurance Company

2009 2010 2011 2012 2013 2014 2009 2010 2011 2012 2013 2014 2009 2010 2011 2012 2013 2014
6,532,261 4,684,069 5,003,089 11,809,620 6,411,414 7,074,414 6,233,615 4,455,768 4,928,207 11,732,262 6,284,133 6,983,467 298,646 228,301 74,882 77,358 127,281 90,947
18,501,336 11,234,683 25,569,297 12,534,898 12,750,863 42,142,299 16,295,986 10,024,099 24,433,204 12,219,944 9,838,908 37,185,648 2,205,350 1,210,584 1,136,093 314,954 2,911,955 4,956,651
146,951,062 160,331,459 190,783,410 171,699,125 160,388,032 175,678,591 133,856,720 144,048,805 180,061,588 159,277,328 147,914,885 162,079,964 13,094,342 16,282,654 10,721,822 12,421,797 12,473,147 13,598,627
89,887,715 103,611,554 124,930,590 108,829,217 104,821,634 115,527,438 80,973,386 91,845,039 117,472,249 100,330,885 95,887,570 105,416,540 8,914,329 11,766,515 7,458,341 8,498,332 8,934,064 10,110,898
57,063,347 56,719,905 65,852,820 62,869,908 55,566,398 60,151,153 52,883,334 52,203,766 62,589,339 58,946,443 52,027,315 56,663,424 4,180,013 4,516,139 3,263,481 3,923,465 3,539,083 3,487,729
926,168 2,093,502 911,112 838,458 803,072 717,123 926,168 2,093,502 911,112 838,458 803,072 717,123 0 0 0 0 0 0
3,652,529 2,658,052 2,938,564 2,165,157 1,827,511 5,405,758 3,578,302 2,529,200 2,776,873 2,066,584 1,756,780 5,350,771 74,227 128,852 161,691 98,573 70,731 54,987
176,563,356 181,001,765 225,205,472 199,047,258 182,180,892 231,018,185 160,890,791 163,151,374 213,110,984 186,134,576 166,597,778 212,316,973 15,672,565 17,850,391 12,094,488 12,912,682 15,583,114 18,701,212
19,465,005 20,371,170 21,368,204 24,264,674 24,507,371 28,542,839 19,008,660 19,750,013 20,584,151 23,400,504 23,439,793 27,107,123 456,345 621,157 784,053 864,170 1,067,578 1,435,716
67,268,027 80,731,097 98,361,038 99,730,269 110,340,729 113,356,527 63,015,999 75,559,901 93,685,537 93,376,917 102,591,613 104,446,169 4,252,028 5,171,197 4,675,501 6,353,352 7,749,116 8,910,358
86,733,032 101,102,267 119,729,242 123,994,943 134,848,100 141,899,366 82,024,659 95,309,914 114,269,688 116,777,421 126,031,406 131,553,292 4,708,373 5,792,354 5,459,554 7,217,522 8,816,694 10,346,074
263,296,388 282,104,032 344,934,714 323,042,201 317,028,992 372,917,551 242,915,450 258,461,288 327,380,672 302,911,997 292,629,184 343,870,265 20,380,938 23,642,745 17,554,042 20,130,204 24,399,808 29,047,286
2009 2010 2011 2012 2013 2014 2009 2010 2011 2012 2013 2014 2009 2010 2011 2012 2013 2014
6,532,261 4,684,069 5,003,089 11,809,620 6,411,414 7,074,414 95 95 99 99 98 99 5 5 1 1 2 1
18,501,336 11,234,683 25,569,297 12,534,898 12,750,863 42,142,299 88 89 96 97 77 88 12 11 4 3 23 12
146,951,062 160,331,459 190,783,410 171,699,125 160,388,032 175,678,591 91 90 94 93 92 92 9 10 6 7 8 8
89,887,715 103,611,554 124,930,590 108,829,217 104,821,634 115,527,438 90 89 94 92 91 91 10 11 6 8 9 9
57,063,347 56,719,905 65,852,820 62,869,908 55,566,398 60,151,153 93 92 95 94 94 94 7 8 5 6 6 6
926,168 2,093,502 911,112 838,458 803,072 717,123 100 100 100 100 100 100 0 0 0 0 0 0
3,652,529 2,658,052 2,938,564 2,165,157 1,827,511 5,405,758 98 95 94 95 96 99 2 5 6 5 4 1
176,563,356 181,001,765 225,205,472 199,047,258 182,180,892 231,018,185 91 90 95 94 91 92 9 10 5 6 9 8
19,465,005 20,371,170 21,368,204 24,264,674 24,507,371 28,542,839 98 97 96 96 96 95 2 3 4 4 4 5
67,268,027 80,731,097 98,361,038 99,730,269 110,340,729 113,356,527 94 94 95 94 93 92 6 6 5 6 7 8
86,733,032 101,102,267 119,729,242 123,994,943 134,848,100 141,899,366 95 94 95 94 93 93 5 6 5 6 7 7
263,296,388 282,104,032 344,934,714 323,042,201 317,028,992 372,917,551 92 92 95 94 92 92 8 8 5 6 8 8
*
**
47
Takaful Insurance Share % from Gross Insurance Market Paid Claims
Takaful Insurance Paid Claims Share % from Gross Jordanian Insurance Market Paid Claims (According to Branches)*
Takaful Insurance Share % from Gross Insurance Branch Paid Claims
Compulsory (Third Party Liability Ins.)
Marine Insurance
Total General Insurances
Gross Insurance Market Paid Claims according to the branch Traditional Insurance Share % from Gross Insurance Branch Paid Claims
2- First Insurance Company
Fire Insurance
Credit Insurance
Table (29)
Branch / Year
Takaful Insurance Paid Claims Share from Gross Jordanian Insurance Market Paid Claims *For the years 2009-2014 (JD)
Insurance Commission annuled Al-Barakah Takaful insurance company from 12/12/2011 & later decided to liquidate the company from 8/1/2014
Total
Total Life & Medical Insurances
Total
1- Islamic Insurance Company
Total General Insurances
Life Assurance
Branch / Year
Fire Insurance
Motor Insurance
Compulsory (Third Party Liability Ins.)
Two insurance companies practice Takaful Insurance out of 25 insurace companies operating in Jordan after liquidate Al-Barakah Takaful :
Comprehensive (Own Damage)Ins.
Credit Insurance
General Accident Insurance
Medical Insurance
General Accident Insurance
Comprehensive (Own Damage)Ins.
Marine Insurance
Traditional Insurance Share % from Gross Insurance Market Paid ClaimsGross Insurance Market Paid Claims
Total Life & Medical Insurances
Motor Insurance
Life Assurance
Medical Insurance

2013201420132014201320142013201420132014201320142013201420132014201320142013201420132014
46.8745.334.024.0819,759,78921,451,5663,260,0104,186,9864,636,3864,748,6498,491,7599,532,001406,635472,1682,055,0831,630,630909,916881,132Islamic Insurance1
53.1354.674.564.9222,397,31325,867,08606,118,3518,292,4948,469,8449,993,504654,958621,251225,069563,9545,817,5574,725,7381,111,5341,670,145First Insurance *2
100.00100.008.599.0042,157,10247,318,6523,260,0104,186,98610,754,73713,041,14316,961,60319,525,5051,061,5931,093,419225,069563,9547,872,6406,356,3682,021,4502,551,277
490,931,905525,708,17247,437,14253,096,513127,349,809141,669,761201,672,152212,529,078397,979699,05211,469,71213,268,1296,178,9276,667,68968,339,55369,119,57128,086,63128,658,379
2013201420132014201320142013201420132014201320142013201420132014201320142013201420132014
49.8145.343.833.5312,153,63313,171,4521,067,5781,435,7164,465,0344,052,7166,298,5797,102,71223,59838,524261,406506,36237,43835,422Islamic Insurance1
50.1954.663.864.2612,246,17515,875,8343,284,0824,857,6426,174,5686,495,91542,55416,0874,5793762,650,5494,450,28989,84355,525First Insurance *2
100.00100.007.707.7924,399,80829,047,2861,067,5781,435,7167,749,1168,910,35812,473,14713,598,62766,15254,6114,5793762,911,9554,956,651127,28190,947
317,028,992372,917,55124,507,37128,542,839110,340,729113,356,527160,388,032175,678,591803,072717,1231,187,4255,104,923640,086300,83512,750,86342,142,2996,411,4147,074,414
*
***
48
First Insurance Company practice non life insurances including Medical Insurance & doesn’t practice Life Assurance.
Insurance Commission annuled Al-Barakah Takaful insurance company From 12/12/2011 & later decided to liquidate the company from 8/1/2014
Liability Insurance
First Insurance Company was established in 2008.
Paid Claims / Insurance Branch
NO. Life AssuranceMotor InsuranceCredit Insurance
Takaful Insurance Business (Premiums, Paid Claims) Allocated to Insurance Branches
& Takaful Share of Total Business for the years 2014 & 2013 (JD)
Marine & Aviation
InsuranceFire Insurance Liability Insurance
Total Compan´y BusinessMedical InsuranceOther Branches
Premiums / Insurance Branch
Total Takaful Insurance
Life AssuranceMotor InsuranceCredit InsuranceCompany
Other Branches Medical Insurance
Total Compan´y Business
Table (30)
Underwritten Premiums
Paid Claims
NO.
% Companies
Market Share
% Companies
Takaful Share
Total Market Business/Branch
% Companies
Market Share
% Companies
Takaful Share
Total Takaful Paid Claims
Company
Total Market Paid Claims/Branch
Marine & Aviation
InsuranceFire Insurance

2013201420132014201320142013201420132014201320142013201420132014201320142013201420132014
121.1151.882.841.58624,329552,191895,6331,149,928-381,534-351,601-45,342-764,064116,059113,197-313,25087,974352,763316,757Islamic Insurance1
-21.1148.12-0.491.47-108,804512,141506,793497,415-775,716-376,23454,480143,60445,25540,151-37,51737,57997,901169,626First Insurance *2
100.00100.002.343.05515,5251,064,332895,6331,149,928125,259145,814-821,058-1,140,29800170,539256,80145,25540,151-350,767125,553450,664486,383
21,987,59334,902,3655,957,5956,288,3062,409,7687,974,383479,7558,240,161525,257357,3562,634,4341,991,198773,643738,5103,944,2913,699,2225,262,8505,613,229
*
*
**
First Insurance Company practice non life insurances including Medical Insurance & doesn’t practice Life Assurance.
49
CompanyNo.
Insurance Commission annuled Al-Barakah Takaful insurance company & later decided to liquidate the company from 8/1/2014
First Insurance Company was established in 2008.
Total Takaful Profit (Loss)
Total Market Profit
(Loss)/Branch***
%
Companies
Share of
Total
Takaful
Profit (Loss)
Table (31)
Takaful Insurance Business (Profit (Loss)) Allocated to Insurance Branches& Takaful Share of Total Business for the years 2014 & 2013 (JD)
Medical Insurance Liability
InsuranceFire Insurance
Marine & Aviation
Insurance
profit (Loss)
% Companies
Share of Total
Market Profit
(Loss)Motor InsuranceCredit InsuranceOther Branches
Company Profit
(Loss)
profit (Loss) / Insurance Branch
Life Insurance

No. Companies Paid Up Capital Jordanian Share % Arab Share % Foreign Share %
1 Jordan Insurance 30,000,000 82.74 6.05% 11.21%
2 Middle East Insurance 21,000,000 77.32% 1.14% 21.54%
3 National Insurance 8,000,000 99.71% 0.29%
4 United Insurance 8,000,000 89.41% 6.76% 3.83%
5 AL Manara Insurance 7,000,000 17% 81.88% 1.13%
6 Arabia Insurance-Jordan 8,000,000 46.80% 53.26% 0.04%
7 Jerusalem Insurance 8,000,000 99.43% 0.52% 0.05%
8 AL-Nisr Al-Arabi Insurance 10,000,000 81.77% 0.22% 18.02%
9 Jordan French Insurance 9,100,000 93.70% 5.99% 0.31%
10 Arab Union International Ins. 8,000,000 86.35% 12.73% 0.92%
11 Delta Insurance 8,000,000 62.66% 37.20% 0.14%
12 Jordan Emirates Insurance 5,000,000 6.83% 92.90% 0.27%
13 Al Yarmouk Insurance 8,000,000 99.89% 0.11%
14 Holy Land Insurance 4,564,156 95.66% 4.14% 0.20%
15 Arab Life & Accidents Insurance 8,000,000 29.78% 55.52% 14.70%
16 Philadelphia Insurance 4,000,000 99.73% 0.27%
17 Jordan International Insurance 18,150,000 92.37% 6.58% 1.05%
18 Islamic Insurance 12,000,000 78.09% 21.87% 0.04%
19 Arab Assurers 8,000,000 99.75% 0.25% 0.00%
20 Arab Jordanian Insurance Group 8,000,000 98.59% 1.06% 0.35%
21 Arab Orient Insurance 21,438,252 9.71% 90.29% 0.00%
22 Euro Arab Insurance Group 8,000,000 99.61% 0.14% 0.25%
23 MetLife Alico 4,000,000 100%
24 MEDGULF Insurance 10,000,000 39.86% 57.39% 2.75%
25 First Insurance 24,000,000 66.79% 33.21%
Total 268,252,408
%Jordanian, Arab and Foreign Shares in Insurance Companies Paid Up Capitals For the year 2014
50
Table (32)
