joint review mission - health...
TRANSCRIPT
Federal Democratic Republic of Ethiopia,
Ministry of Health
Joint Review Mission
Final Report
Asrade Abate (MD, MSc) Abraham Amanuel (BA,MPH)
October, 2014

Page | 2
Acknowledgement
We acknowledge the valuable assistance of all Regional Health Bureau, Zonal Health Department, Woreda Health Office, and Facility staffs and experts who helped in the
review process. Besides, the contribution of the FMOH’s partners was immense.
We are also grateful to health post staffs, HDAs and community members involved in the review and gave generously of their time in completing the survey questions.

Page | 3
T ab le of C on te n t s
EXECUTIVE SUMMARY 8 INTRODUCTION 17 OBJECTIVES 18 METHODOLOGY 18 1. IMPROVE ACCESS TO HEALTH SERVICES 21
1.1. Maternal And Newborn Health Services 21 1.1.1. Antenatal Care Services 1.1.2. Institutional Delivery Services 1.1.3. Clean And Safe Delivery Services 1.1.4. Emergency Obstetric Care 1.1.5. Postnatal Care Services 1.1.6. Maternal Death Audit 1.1.7. Family Planning Service 1.1.8. Contraceptive Acceptance Rate 1.1.9. Mother To Child Transmission Of HIV 1.1.10. Lessons Learned 1.1.11. Challenges 1.1.12. Recommendations 1.2. Neonatal and Child Health Services 36 1.2.1. Newborn Care 1.2.2. Neonatal Corner & Intensive Care Unit 1.2.3. Immunization 1.2.4. Integrated Management Of Neonatal & Childhood Illness 1.2.5. Lessons Learned 1.2.6. Challenges 1.2.7. Recommendations 1.3. National Nutrition Program 40 1.3.1. Community Management Of Acute Malnutrition 1.3.2. Lessons Learned 1.3.3. Challenges
2. COMMUNICABLE DISEASE CONTROL 43 2.1. Malaria Prevention & Control 2.2. Hiv/Aids Care & Treatment 2.3. Tuberculosis & Leprosy Prevention 2.4. Lessons Learned 2.5. Challenges
3. IMPROVED COMMUNITY OWNERSHIP 47 3.1. Health Extension Program 3.2. Health Development Army 3.3. Hygiene Environmental Health 3.4. Community-Led Total Sanitation 3.5. Lessons Learned 3.6. Challenges 3.7. Recommendations
4. RESOURCE MOBILIZATION & UTILIZATION 54 4.1. Exempted & Waiver Services 4.2. Retention & Utilization 4.3. Community-Based Health Insurance 4.4. Challenges
5. IMPROVED QUALITY OF HEALTH SERVICES 57 5.1. Referral System 5.2. National Blood Bank 5.3. Lessons Learned 5.4. Challenges 5.5.
Page | 4
6. IMPROVED PHARMACEUTICAL SERVICES 63 6.1. Supply Chain Cycle 6.2. Drug Therapeutic Committee 6.3. Lessons Learned 6.4. Challenges 6.5. Recommendations
7. IMPROVED REGULATORY SYSTEM 68 7.1. Inspection And Quality Assurance 7.2. Tobacco Control 7.3. Challenges
8. EVIDENCE BASED PLANNING & DECISION MAKING 71 8.1. Health Management Information System 8.2. Electronic Information Systems 8.3. Lessons Learned 8.4. Challenges
9. HUMAN CAPITAL AND LEADERSHIP 75 9.1. Pre-Service Training 9.1.1. Health Extension Workers 9.1.2. Emergency Ambulance Technician 9.1.3. Biomedical Technicians (Diploma) 9.1.4. Health Information Technicians 9.1.5. Midwifery 9.1.6. Intermediate Emergency Surgical Officer 9.1.7. New Medical Education 9.2. Lessons Learned 9.3. Challenges 9.4. Recommendations
10. Annexes 79 10.1. References

Page | 5

Page | 6
A c r o n y m s
AIDS Acquired Immunodeficiency Syndrome
ANC Antenatal Care
APR Annual Performance Report
ARM Annual Review Meeting
ART Antiretroviral Therapy
ARV Antiretroviral
BCC Behavioral Change Communication
BCG Bacillus Calmette-Guérin
BEmONC Basic Emergency Obstetric and Neonatal Care
BSC Balanced Score Card
CAR Contraceptive Acceptance Rate
CBHI Community Based Health Insurance
CBN Community Based Nutrition
CDC Centre for Disease Control
CDR Case Detection Rate
CEmONC Comprehensive Emergency Obstetric and Neonatal Care
CHD Community Health Day
CHIS Community-based Health Information System
CLTS Community Led Total Sanitation
CMAM Community-based Management of Acute Malnutrition
COC Certification of Competence
CPD Continuing Professional Development
CSA Central Statistical Agency
DFID Department for International Development
DP Development Partner
DPT Diphtheria-Pertussis-Tetanus
DTC Drug and Therapeutics Committee
EDHS Ethiopia Demographic and Health Survey
EFY Ethiopian Fiscal Year
EHAQ Ethiopian Hospitals Alliance for Quality
eHMIS Electronic Health Management Information System
EmONC Emergency Obstetric and Neonatal Care
EMR Electronic Medical Record
EPHI Ethiopian Public Health Institution
EPI Expanded Program on Immunization
ETB Ethiopian Birr
FMHACA Food, Medicine and Healthcare Administration and Control Authority
FMOH Federal Ministry of Health
FP Family Planning
GAVI Global Alliance for Vaccines and Immunization
GDP Gross Domestic Product
GTP Growth and Transformation Plan
HAPCO HIV/AIDS Prevention and Control Office
HC Health Center
HCF Health Care Financing
HCT HIV Counseling and Testing
HDA Health Development Army
HEP Health Extension Program
HEW Health Extension Worker
HF Health Facility
HIT Health Information Technician
HIV Human Immunodeficiency Virus
HMIS Health Management Information System
HP Health Post
HPN Health, Population and Nutrition
HR Human Resources
HRD Human Resources Development
HRIS Human Resources Information System
HSDP Health Sector Development Program
ICCM Integrated Community Case Management
Page | 7
IEC Information, Education, Communication
IESO Integrated Emergency Surgery Officer
IHP International Health Partnership
IMNCI Integrated Management of Neonatal and Childhood Illnesses
IMR Infant Mortality Rate
IP Implementing Partners
IRS Insecticide Residual Spraying
IT Information Technology
ITN Insecticide Treated Net
IUCD Intra-Uterine Contraceptive Device
JCCC Joint Core Coordinating Committee
JSC Joint Steering Committee
LF Lymphatic Filariasis
LLIN Long-Lasting Insecticide-treated Net
LQAS Lotus Quality Assurance System
M&E Monitoring and Evaluation
MCH Maternal and Child Health
MDG Millennium Development Goal
mDHS Mini Demographic and Health Survey
MDR-TB Multi-Drug Resistant TB
mHealth Mobile Health
MMR Maternal Mortality Ratio
MNCH Maternal, Newborn and Child Health
MTCT Maternal to Child Transmission
MTR Mid-term Review
NCD Non-Communicable Disease
NGO Non-Governmental Organization
NICU Neonatal Intensive Care Unit
NMEI New Medical Education Initiative
NMR Neonatal Mortality Rate
NNP National Nutrition Program
NTD Neglected Tropical Disease
OPD Outpatient Department
PCV Pneumococcal Conjugate Vaccine
PFSA Pharmaceutical Fund and Supply Agency
PHC Primary Health Care
PHCU Primary Health Care Unit
PHEM Public Health Emergency Management
PMTCT Prevention of Maternal to Child Transmission of HIV
PNC Postnatal Care
QA Quality Assurance
RDT Rapid Diagnostic Test
RH Reproductive Health
RHB Regional Health Bureau
SNNPR Southern Nations, Nationalities and Peoples Region
STI Sexually Transmitted Infection
TB Tuberculosis
TBA Traditional Birth Attendant
TOT Training of Trainers
TVET Technical and Vocational Education and Training
TWG Technical Working Group
U5MR Under-5 Mortality Rate
UN United Nations
UNFPA United Nations Population Fund
UNICEF United Nations Children’s Fund
WDG Women Development Group
WHO World Health Organization
WrHO Woreda Health Office

Page | 8
E x e c u t i v e S u m m a r y
The Joint Review Mission (JRM) is one of the performance review mechanism of the health sector program conducted every year jointly by
the government and partners. The purpose of this review is to assess overall progress made on the implementation of HDSP IV strategic objectives, identify health system bottlenecks, and explore best practices focusing on implementation of maternal and child health targets to inform decision making.
Case study design was employed an in-depth over breadth of the performance communicated through routine HMIS. Mixed method with quantitative finding complemented by qualitative information of selected cases. Expert interview, focus group discussion, document review, and field observations were utilized to collect data using guides and semi-structured questionnaire. The main findings during the review were the following.
ANC coverage, for one or more visits, attained its highest pick in 2006 reaching 98%. The coverage has been increasing by an annual average of 8.9%. In comparison to results observed in EFY 2002, baseline values of HSDP IV, the national coverage for ANC (at least one visit) and PNC has increased from 71.4% to 98% and 36.2% to 64% respectively. All regions achieve better results except Somali, Dire Dawa and Gambella where the
performance drops below results scored in the previous year.
The review revealed that several factors affected ANC visits, particularly in case of early start up and continuity visits. Regional variations were also prominent. Evidences also showed that level of education and place of residence were important factors. Urban women were more than twice as likely as rural women to receive ANC from a skilled provider since ANC provision were provided by HEWs in the rural areas.
In 2006 EFY, the review ascertained an increased institutional delivery in all visited health facilities compared to preceding year’s performance and contributing factors were mostly attributed to functional HDAs established in the community, availability of ambulance service, practicality of women friendly services and health workers’ commitment.
Since the start of the HSDP IV, the percentage of deliveries attended by skilled health personnel had been persistently increasing from as low as 16.8% (EFY 2002) to 41.0% (EFY 2006) with an annual average growth rate of 28.1. In 2006 (EFY), institutional delivery showed an increase by

Page | 9
compared to performance of the previous year; however, the target set for 2006 (60%) were not attained nationally.
Inadequacy of skilled midwives, loose referral system at health centres, inadequate availability of MNCH relevant equipment and under financing of the service were identified as major supply side constraints that hindered progress. On the demand side, cultural norms and societal emotional support bestowed to mothers, distance to functioning health facilities and financial barrier were found to be the major causes.
Irregularities to conduct maternal audit and adherence to the guideline
were the most important challenges encountered through the review. Identify communities and/or facilities with weak performance, spot challenged Woredas through information use and analyse HMIS data for evidence based decision to support particular Woredas/facilities was a commendable action in Tigray region. In this respect areas with high maternal as well as neonatal mortality were identified and actions were taken
Establishment of maternity waiting homes has been adopted by most facilities, only few sites visited are without maternity homes. Individual communities through HDAs in the respective catchments were in possession of all the activities including support for construction of and also taking care of the mothers. Each visited Woreda had one to two Ambulances. In a few sites visited youth were also organized to take labouring mothers to accessible sites for ambulance. Almost all visited Health Posts conducted pregnant women conference which is a good exercise to share with others.
Improvements were observed in maternal and child health indicators such as ANC Skilled delivery, PNC, PMTCT, measles vaccination and fully
immunized child. There are performance variations across regions. Pastoralist areas are performing low compared to others. Notably, Oromia performed well regarding skilled delivery. The reason for marked improvements were mainly due to community mobilization using health development network or strengthen the community based approach and improvement in system components such as human resource, pharmaceutical supply, financial management and evidence based decision making.
The overall performance with regard to CAR was found sluggish and disparity among regions was pronounced. In 2006, out of 17.6 million eligible females 10.95 million (62%) have received one or the other FP method showing a slight improvement compared to 60% in 2005. Almost all regions scored below their annual target.

Page | 10
Furthermore, Somali, Afar, Gambella, Addis Ababa and Dire Dawa have scored below the performance in 2005 (EFY). The accomplishments of emerging regions were relatively low and progress in the past few years has been phlegmatic.
Most visited facilities had all the appropriate methods/mixes available and were continuously accessible. Inadequacy was reported from Addis Ababa Health bureau that significantly hampered the services. Progress and expansion of Adolescent Friendly Reproductive Health Services (AYHR) was not that strong; as well YFHS service was given a little focus.
Furthermore, the number of health facilities providing PMTCT, BEmONC, CEmONC, YFHS, and IMNCI were increased. Yet, further expansion of facilities and/or services is anticipated for communities where the facility to population ratio was lower than the standard.
The PMTCT component showed progress persistently over the years, with an average increase of 10.5% per annum, reaching 64% in 2006. Yet, nearly half of those mothers (53%) were linked to ART service for treatment. Noteworthy, at this point, was the loose-fitting ART linkage with other services for referral.
In 2006 (EFY), most health facilities have already adopted the new Option B+ approach. Out of the 2792 health facilities targeted in the annual plan, 2542 public health facilities (91%) were able to switch to the new approach.
Nationally, a total of 30 hospitals were able to provide NICU services in 2006. Most Health Centers visited during the review were not able to provide complete Neonatal Corner service due to inadequacy of equipment.
Expansion of access for IMNCI has been widespread in 2006 and
expansion is better than the performance of the preceding year. During the review, it was noted that Under-five services were implemented acquainted with the IMNCI approach and most health facilities provision of IMNCI service was as per the guideline.
Immunization coverage has been increased in most regions visited. In most regions visited, there was no record of interruption of vaccine or stock out throughout the year in 2006. Most facilities were able to reduce the wastage rate for vaccines as well as dropout rate.
Expansion of Community-based management of acute malnutrition to Health Posts was effectively setup and was functional in most Health Posts visited. The screening and treatment of children affected by

Page | 11
malnutrition, Vitamin A deficiency, intestinal parasites is moving forward to a new integration level.
Significant progress has been made in malaria control in EFY 2006 and reduction in the number of epidemic affected villages. In most regions the trend of mortality and morbidity was declining and progress in the strategy towards eliminating malaria was noted. Capacity to diagnose cases was expanded to the level of household through RDTs supplied to Health Posts. Massive quantities of ITNs were distributed for replacement as well IRS spraying was carried has been carried out
throughout the country.
International partners on HIV/AIDS, including PEPFAR, disclosed their plan in the reduction of direct financial resource commitment. A transitioning plan was unveiled where the PEPFAR program will be transferred to countries of ownership. During the transition, management of programs and their functions as well as broader capacity building necessary for the transfer will be carried out. Investment case tool for 2016-2020 was also developed and submitted to Global Fund.
In most cases, HIV/AIDS mainstreaming was introduced and the HIV/AIDS program was integrated with services in terms of HR, HMIS, funding and management. Interruption of some HIV/AIDS care and treatment related services were also reported. Most facilities reported shortage of testing kits; interruption of DBS test kits and reagents; viral load reagent; and also CD4 investigation reagents.
In EFY 2006, Multi-Drug Resistant TB (MDR-TB) treatment centers were increased; TB diagnostic technology was improved using Genexpert tools; community TB prevention and control through HAD was expanded; and preparations were underway to conduct quality assurance through
EQA. Low performance in case detection rate was analysed and two important factors were identified: poor laboratory capacity as well as low quality of data due to poor data collection.
In all visited sites community and facility HDA are organized and functional. Some of HDA leaders who took training from HEWs can be considered as second generation HEWs. Community involvement, empowerment and ownership on health issues was increased. Absence of benefits after completing an upgrade; meagre incentive packages as in transfer or salary; and also inadequate in-service training were among the major complaints entertained by HEWs. Urban health extension workers were not strong. Most interviewed also expressed their scepticism about the ultimate goal of urban deployment of HEWs.

Page | 12
Consequently, there has been a tremendous progress on the formation HAD networks as well contributions in terms of community mobilization and providing support to the HEWs. Through the peculiar performance of HDAs, it was possible to establish Kebeles that were free of maternal home deliveries.
Acknowledgement of the HDA networks through various means such as mass media and performance based awarding were found to be important motivation schemes to encourage the networks. Unconstructive influence by male partners and unwillingness of male
partners during mobilization were found to be adversely influencing the initiative.
Number of households with latrine increased from 86% in 2005 to 92% in 2006. HEWs have also played a significant role in carrying out key activities through the Community Led Total Sanitation (CLTS) approach. HAD’s contribution towards ODF was also immense.
Open defecation rates were more than halved from 93% in 1990 to 45% on account of the scale-up of CLTS approach in all regions. Currently, more than 3,136 Kebeles have been certified as ODF communities in 2006 nationally; thus, ODF Kebeles were doubled from 10% in 2005, to 22.6% in 2006 EFY. Though performance was making progress, the pace has been slow which makes it unlikely along the lines of achieving 82% ODF communities by 2015.
The achievements in health service delivery were credited to efforts made to improve community participation and ownership through establishment of HDA, health worker’s commitment, improved planning process, resource mobilization and appropriate allocation.
Implementation of facility reforms; improved pharmaceutical supply; in-
service training and performance based recognition; deployment of BSC score card; 24/7 accessibility of facilities enriched by ambulance services and referral linkage; conducting continuous client satisfaction and service quality survey; practicality of health care financing /HCF/ and use of income for quality improvement; and effecting maternal death review were among the factors that played further roles in improving healthcare services.
In the facility reform process, new initiatives have also been instigated by the FMOH in 2006 EFY. Emergency referral scheme, auditable pharmaceutical transaction and services /ATPS/, and Hospital Alliance for Quality were among a few. In addition, capacity building for EPHI is underway so that EPHI will be enabled to provide services on selected and/or advanced laboratory investigations. In the reform process, one of the remarkable performance observed in 2006 EFY was implementation

Page | 13
of the emergency referral initiative which ascertained predetermined, predestined referrals for emergency situations backed by a directive that enforces practicality.
By the end of 2006 EFY, the National blood bank was able to collect 150,000 units of blood (90,000 and 60, 000 units of blood from Addis Ababa and the regions respectively). This was done with a view to provide blood without family replacement for the needy patients free of charge. Collection was achieved 100% from volunteers. Effective strategies to enhance volunteer blood donation were organization of
civil service networks, raising community awareness through mass-media, and use of Social media such as face book and twitter for powerful persuasive effect.
All visited Bureaus and health facilities had plans prepared for EFY 2006 as well as 2007.The planning process, in 2006, was relatively better in contextualizing and bottleneck analysis compared previous year. Woreda based plan has been participatory and cascaded at different level. A regular and pre-scheduled quarterly supportive supervision and review meeting at Woreda and Zonal level was conducted. Selected awards were also given which improved operations and contributed for better performance. Based on the identified gaps they also provide capacity building training and on-job recommendations.
Following recommendations of the Mid-Term Review of the HSDP IV, the HMIS was reviewed encompassing four technical areas: indicators, disease classification, recording and reporting procedures and also information use guidelines and display tools. The revision was a consultative process guided by national monitoring & Evaluation Framework, HSDP IV strategic objectives, new GTP initiative and also
international requirements for reporting. In HMIS v.2, the total number of indicators was increased to 118. Besides, modifications on frequency of data collection and reporting were made. Implementation of the revised HMIS was underway during the review period.
Training was provided to facilities based on the revised HMIS. Registers were distributed and used at facility level whereas reporting formats distribution was not started. Regions were providing support to facilities to facilitate the printing of tally sheets and other materials required and few facilities were trying to fill gaps from their HCF revenue. However, it was difficult to conclude it was fully owned because of shortage of budget. The community health information system /CHIS/ was implemented and updated performance data was posted in most visited health posts.
Information from the HMIS was used in planning and target setting process; forecasting health commodity requirements; budget allocation;

Page | 14
service quality improvement; and identification disease pattern for appropriate intervention. In addition it was also used as information to identify and motivate health care providers.
Some regions were undertaking preparations to implement a mobile health (mHealth) application for all Health Posts which will be used for reporting. Earlier version was eHMIS was used by almost all facilities visited and activities were underway to update to the revised eHMIS. SmartCare (Electronic medical recording) was implemented in some hospitals visited. FMOH was utilizing Score Card automation system to
measure performance, mainly through MNCH results, called MNCH score Card.
Almost all health facilities were undertaking various reform activities. The performance in health care financing was superb. Health care financing was implemented in almost all facilities and the revenue was used to improve services such as procurement of drugs, supplies and equipment, and renovation of the facility. Exemption and waiver policies were implemented based on guidelines in all facilities visited.
In general, the supply chain cycle has significantly improved, compared to previous years, accommodating the huge demands for health commodities. As a result, complaints from health facilities pertaining shortage of drugs was significantly reduced compared with previous years. Along the supply chain cycle, forecasting/ quantification were found to be the weakest links due to limited capacity of quantification and poor information system.
In 2006, PFSA ran 11 functional regional hubs and in order to avoid delays in the distribution and enhance the storage capacity, PFSA also constructed new warehouses in different regions of the country including
six additional hubs. The importance of preparations for emergency response was considered crucial and PFSA undertook the necessary preparations including allocating vehicles that will be stationed at branches and used for emergency distribution purpose.
In most facilities visited, improved availability of essential medicine was observed, estimated at about 80% in some facilities (availability at PFSA was 65%). In addition, renovation tasks and provision of free IMNCI and MNCH services were funded by via RDF.
Functional Drug and Therapeutics Committees /DTCs/ were found in most visited sites. Levels of performances of the DTCs were not consistent across facilities. Wide variations noticed across facilities.
Concurrently, in 2006, a total of 3, 850 Midwifes graduated from all three schemes: 1250 from upgrading scheme; 1,600 from accelerated;

Page | 15
and 1000 from generic Midwifery. The plan was to produce 4,600 graduates, whereas performance was 98%. Starting 2007, the number will increase up to 3000 per annum. For the same period, Midwife to Population ratio has improved from 1: 5000 compared to preceding year where the ratio was 1:10,000.
With regard to staffing of health facilities, remarkable improvement was noticed as a result of new deployments, enhancing competency of health workers through capacity building activities particularly in BemONC, CemONC, IMNCI and SAM trainings.
The strategy for neonatal care and intervention need to be aggressive and focused before end of HSDP IV. Ensure sustained availability key MNCH supplies particularly BEmONC and newborn supplies. Strengthening YFHS through school health; FP should be integrated to PNC.
Together with communities, explore feasible options for improving access to service or transportation especially where the topography presents particular challenges like Lasta Woreda in Amhara, and Dawuro in SNNP.
Focus should be given to pastoralist communities and appropriately selected approaches suitable to these communities should be reviewed and implemented. This finding was also flagged through the MTR 2013 review as recommendations.
Strengthen capacity of quantification process by involving regional and woredas administrations. Encourage domestic producers by offering advance payment through local development.
Inadequate competency of midlevel health professionals, mainly those from private teaching institutions need to be addressed. Consider
options for minimizing high staff turn-over particularly HEWs. Provide trainings for health development army and health extension workers particularly on communication skills.
The hygiene and sanitation situation in almost all facilities has been neglected for years; as a result it was considered one of the worst examples even within the public. Besides, barely any efforts were applied to improve the condition. Hence, the FMOH should take the lead to instigate underlying changes in hygiene and sanitation status of health facilities.

Page | 16

Page | 17
IN TR OD UC TI ON
The Ethiopian Health care delivery system is organized in three-tiers. The first level is a Woreda/District health system comprising a primary hospital (with population coverage of 60,000-100,000 people), health centers (25,000 population) and their satellite Health Posts (3,000-5,000 population) that are connected to each other by a referral system. The second level in the tier is a General Hospital with population coverage of 1-1.5 million people; and the third a Specialized Hospital that covers population of 3.5-5 million. The Ethiopian Health care System is augmented by the rapid expansion of the private for profit and NGOs sector playing significant role in boosting the health service coverage and utilization thus enhancing the public/private partnership in the delivery of health care services in the country.
The government developed a 20 year Health Sector Development Program (HSDP) in 1990 EFY, through which long-term goals developed for the health sector. There has been encouraging improvements in the coverage and utilization of the health services and improved access to and quality of rural primary health care over the periods of implementation of Health Sector Development Plan (HSDP). One of the success stories of implementation of the HSDP is improved access to and quality of rural primary healthcare through the Health Extension Programme (HEP).
HSDP aims to develop a health system, which provides comprehensive and integrated primary care services, mainly community level health facilities. To expedite the implementation of the HSDP, the government launched the HEP in 2003 to deliver a package of basic and essential healthcare, including HIV preventive services. To date, more than 38,000 health extension workers have been deployed. This innovative approach has registered encouraging results in addressing disparities in basic healthcare, including HIV prevention services.Improving the health status of the Ethiopian peoples and achieving the United Nations Millennium Development Goals (MDGs) is the ultimate goal of HSDP.Reaching the health MDGs implies a dramatic expansion of key services, and the implementation of mechanisms to increase demand for and use of those services, particularly the rural populations, the poor, and among them women and children.
Since 1990 EFY, three cycles of HSDPs were developed and implemented; and currently the country is implementing the fourth plan. In the course of these years, the program has been continually reviewed through joint exercises as Mid-Term Reviews (MTRs), Final Evaluations and Reviews Meetings.As such, the Joint Review Mission (JRM) is one of the performance review mechanism of the health sector program conducted every year jointly by the government and partners. To this end, the purpose of this review is to assess overall progress made on the implementation of HDSP strategic objectives, identify health system bottlenecks, and explore best practices focusing on implementation maternal and child health targets.

Page | 18
O B J E C T I V E S
In general, the purpose of this review was to assess the overall progress made on the implementation of selected priority strategic objectives, identify health system bottlenecks encountered, and explore best practices and lessons learned in the process of implementing strategic objectives of HSDP IV during the 2014 period.
Specific objectives
1) Review performance for various initiatives designed to achieve maternal and child health targets;
2) Assess targets by giving due attention on three HSDP IV strategic objectives: access, quality and community ownership;
3) Document progress and identify gaps in the implementation of MTR recommendations;
4) Assess progress of Health Management Information System (HMIS) and document best practices and challenges;
5) Assess the progress of current initiatives in Health Care Financing, challenges and best practices for scaling-up;
6) Provide recommendations for interventions that need attention;
M E T H O D O L O G Y
The assessment was carried out in all nine regions and the two city administrations through review of documents; semi structured interviews; and observation at all levels of the healthcare system (Federal, Regional, Zonal, Woreda, Facility and Community levels). The review examined the overall progress made across a range of activities implemented in the fourth year of HSDP IV including core strategic objectives,bottlenecks encountered, best practices and lessons learned for selected health facilities and administrative institutions.
Sampling
The main focus of this review was to understand the overall progress of various strategic initiatives and see what has been working/not working during the 4th year of the HSDP IV implementation. But, the review didn’t have adequate time to undertake a representative sampling of all Woredas; consequently, purposive sampling was preferred. Nevertheless, the JRM team was able to visit all regions and also considerable number of facilities and administrative bureaus within each region.

Page | 19
Figure 01: Objectives of the Joint Review Mission /JRM/, 2014
In general, the criteria of selection in the sampling process of Woredas/Zones/facilities were:
1) Woredas/Zones/Facility that were well performing and those that were
less performing according to the MCH Balanced Score Card; and
2) Woredas/Zones/Facility that were perceived to share some best practices in improving maternal and child health.
In the three bigger regions (Amhara, Oromia, SNNP) two zones (one well performing and another less well performing) were visited in the respective
RHBs. Again, within these zones, Woredas were visited. The team also visited facilities and communities within each Woreda. Similarly, in the remaining regions, the sampling frame was the same. But only two Woredas (one well performing and one less performing Woreda) were visited in each region. Overall, a total of more than 130 sites were visited and one or more key informants were interviewed. About 113 of them were RHBs, Zones, Woredas, Facilities, Health Posts, or Community members. In addition, about17 FMOH directorates, departments, Agencies or partners were visited.
The JRM team consisted of two consultants, members from FMOH, Development Partners, and Implementing Partners as well as from Regional Health Bureaus /RHBs/. The team undertook a one-day orientation to
HSDP Joint Review Mission (JRM)Objectives / Scope of Work, 2014 (EFY 2006)
Overall implementation status of the 4th year of
HSDP IV
•Overall implementation progress.
•Identify health system bottlenecks.
•Explore best practices & lessons learned.
Focused on maternal and child health targets
•Access (Coverage + Equity)
•Quality of Health Services
•Community Ownership
Important issues for due attention
•Progress in implementation of MTR
recommendations
•HMIS Progress and challenges
•HCF current initiatives, challenges, best practices
for scaling-up

Page | 20
familiarize with the JRM tools. The consultants, together with FMOH subordinate teams, coordinated the overall activity.
Data Collection
A document review was carried out embracing a collection of annual review documents, program reports and recommendations from previous reviews. The Mid-Term Review /MTR/ recommendations were also reviewed. The following table presents reviewed documents.
– A collection of JRM, APR and ARM reports – 2013 MTR report (Vol I and Vol II Regional Reports) – All HSDP series (HSDP I, II, III, IV) documents – Annual Plan and Report of FMOH for EFY 2006 – 2014 IHP+ review presentation – All DHS series (2000, 2005, 2011) documents, including mini DHS 2014 – JANS report – HMIS reform, review and other studies on HMIS – Health Care Financing /HCF/ related documents – Relevant policy documents and other sub-sector strategic papers
Semi-structured questionnaires and checklists were applied to collect information. Questionnaires and tools specific to each level of facility /institution were prepared which provided guidance for interviews with key-informants at each level of the health-tier system. Interviews were conducted with heads of bureaus at various levels and selected key-informants in each facility/institution from Federal to Community level within the sampling framework.
The assessment essentially focused on performances at each level which contributed to the realization of targets set in the HSDP IV especially, focused on programs in MNCH, HMIS and HCF. The questionnaires were designed in line with these objectives. Core components included in the questionnaires were institutional profile of facilities; performance of facilities/institutions; availability of equipment, supplies and other resources; and also guidance, trainings and supervision. The review identified major bottlenecks, capacity constraints and external factors that hampered achievements. As well, best practices were identified and attitude of individuals and community towards service delivery was reviewed. Facility setup, equipment and medical supplies were inspected and results documented using checklists. Moreover, the overall service delivery activity in each facility was assessed. Results were also compared with achievements against records of the MTR conducted in 2013.
HMIS Database Analysis
Data extracted from the HMIS database was utilized as a source of information to measure performance of regionsand also to verify findings from site visits. The Result Framework Indicators of HSDP IV, HMIS indicators, EDHS data, surveys and other additional references were applied to obtain quantitative basis for the review. Where possible the data was triangulated with the qualitative data with information collected through interviews.

Page | 21
1. I M P R O V E A C C E S S T O H E A L T H S E R V I C E S
1.1. MATERNAL AND NEWBORN HEALTH SERVICES
Ethiopia is one of the signatory countries that have committed to achieve the Millennium Development Goals (MDGs) by 2015. As such, Ministry of Health and stakeholders are striving to achieve the MDG targets through various innovative approaches.
The MDG 4 and 5 aim to reduce child mortality by two thirds and maternal mortality by three quarters between 1990 and 2015. MDG 5 is the target towards which the least progress has been made so far. To meet MDG 5 an annual average maternal mortality reduction rate of 5.5% is required. In sub-Saharan Africa, the annual average reduction was 0.1% between 1990 and 20051.
Ethiopia has one of the highest maternal mortality rates in the world, though below regional average. A report indicated MMR is 420 in 2012. The leading causes of maternal death are abortion, sepsis, haemorrhage, and obstructed labour. Besides, factors that contributed include high fertility rate, widespread poverty, low female literacy, low nutrition status, and poor access to health services. The majority of these deaths are preventable with affordable interventions.
Figure 02: Trends in Maternal Mortality Rate in Ethiopia
1Universal access to emergency obstetric and newborn care. WHO, 2010
871 871
673 676
420 Target267
0
200
400
600
800
1000
Maternal Mortality Linear (Maternal Mortality)

Page | 22
In recognition of these, the FMoH has made strong commitment to the reduction of maternal and child mortality through the implementation of the HSDP IV which aims to reduce Maternal Mortality (MMR) and Neonatal Mortality (NMR); and achieve universal access to reproductive health, including access to safe, affordable and effective methods of contraception. To address these challenges, the FMoH has been utilizing the Health Services Development Program (HSDP) strategies which were implemented in four consecutive cycles.
This initiative, which is based on the principles of equity for women, primary health care and maternal care, has four main pillars: Family Planning, Antenatal Care, Clean & Safe Delivery, and Essential Obstetrics Care. Sincethe beginning, there has been tremendous progress in all of these areas though variations of success were observed amongst regions. By the time HSDP I was concluded on June 2002 (EFY 1994), accomplishments were recorded which were by far better than performances of preceding years, particularly ANC coverage, PNC coverage and skilled delivery were increased. Furthermore, assessment of HSDP III shows remarkable achievements in the expansion and construction of health facilities, and improvement in the quality of health service provision.
Thus far, three consecutive cycles of HSDP have been effectively implemented and is in its fourth phase, HSDP IV. Currently, HSDP IV is in its fourth year of implementation which will be concluded by the end of 2007. Since HSDP IV is the final cycle of its kind, implementations were focused towards achieving identified targets within the MDG goals, particularly reduction of MMR and NMR through improving antenatal coverage, postnatal coverage, skilled birth attendants and contraceptive use.
MNCH has been a flagship program in 2007 as a result of which better achievements has been observed. Major steps taken in this regard include community sensitization and mobilization about maternity services through HDAs, improved access and quality of services; strengthened referral linkage; sizable expansion of ambulance services; extensive training on BEmONC/CEmONC; on time delivery of supplies, equipment and other materials; and financial support for training and sensitization.
List of Indicators Performance by year (percentage of coverage)
2000 2001 2002 2003 2004 2005 2006
Antenatal Care (at least 1 visit) 61.0 68.0 71.4 82.2 89.1 97.4 98.0
Postnatal Care 20.0 34.0 36.2 42.1 44.5 50.5 66.2
Skilled Delivery 25.0 18.0 16.8 16.6 20.4 23.1 41.0
Clean Delivery 17.0 14.7 13.2 11.6 8.6
Contraceptive Acceptance Rate
61.9 61.7 60.4 59.5 62.0
Table 01: Performance of important MNCH indicators during the implementation of HSDP IV Source: FMOH Annual Reports

Page | 23
1.1.1. ANTENATAL CARE SERVICES
The implementation of HSDP IV has applied a multi-pronged approach to reduce maternal and newborn morbidity and mortality by improving access and quality of service; and strengthening facility capacity to provide the necessary maternal and newborn services among which ANC is one of them.
Even though the percentage of facility births continues to be low compared to MDG targets, there is a noticeable increase regarding the performance of ANC and PNC as confirmed through several reviews and studies2. ANC coverage for one or more visits has attained its highest pick in 2006 reaching 98%. ANC coverage has increased uninterruptedly by an average of 8.9% for about ten years starting EFY1997.
In comparison to results observed in EFY 2002, baseline values of HSDP IV, the national coverage for ANC (at least one visit) and PNC has increased from 71.4% to 98% and 36.2% to 64% respectively.
Figure 03: Trends in antenatal care and postnatal care
A study revealed that the median duration of pregnancy at the time of the first antenatal visit is 5 months (mini DHS, 2014). In addition, the study revealed education and place of residence are important factors on top of regional variations. Urban women are more than twice as likely as rural women to receive ANC from a skilled provider since ANC provision is provided by HEWs in the rural areas. ANC coverage showed wide variation across regions. All regions achieve better results except Somali, Dire Dawa and Gambella where the performance drops below results scored in the previous year.
2Mini EDHS
0.0
20.0
40.0
60.0
80.0
100.0
120.0
Annual Performance (in percentage)
Antenatal Care (atleast 1 visit) Postnatal Care

Page | 24
1.1.2. INSTITUTIONAL DELIVERY SERVICES
An important component of efforts applied through the HSDP is to reduce health risks to mothers and children through deliveries in health facilities; thereby minimize the proportion of maternal and neonatal morbidity and mortality.
In 2006 (EFY), institutional delivery showed an increase compared to performance of the previous year; however, the target set for 2006 (60%) was not attained nationally. Since the start of the HSDP IV, the percentage of deliveries attended by skilled health personnel has persistently increased from as low as 16.8% (EFY 2002) to 41% (EFY 2006) with an average growth rate of 28.1% per year. In contrast, Clean and Safe Delivery has declined by an average of 15.4% per year for the same period.Overall, institutional delivery has been increasing by about 16% over the last decade; however, due to the diminution in clean and safe delivery, the sum of deliveries (institutional and clean delivery) showed only a 10.1% growth. Hence, the decrease in clean and safe delivery has been slowing down the overall result.
Except Addis Ababa and Somali, all regions observed a better performance compared the achievements in 2005. Three regions attained coverage above 50%namelyTigray, Dire Dawa and Harari among which Harari scored the highest (78%). Harari has scored above the target for the last 5 consecutive years denoting the possibility to achieve the intended goals set for HSDP IV.
Figure 04: Trends in maternal delivery: Skilled Delivery versus Clean & Safe Delivery
In 2006 EFY, the review ascertained an increased institutional delivery in all visited health facilities compared to previous year’s performance. Contributing factors were mostly attributed to functional HDAs established in the community, availability of ambulance service, practicality of women friendly services and health workers’ commitment. Furthermore, the number of health facilities providing PMTCT, BEmONC, CEmONC, YFHS, and IMNCI were
0.05.0
10.015.020.025.030.035.040.045.0
Skilled Delivery Clean Delivery

Page | 25
increased. Yet, more service expansion is anticipated for communities where the facility to population ratio is still lower than the standard.
However, variations in terms of degree of performance were pervasive among regions, even further down at Zonal, Woreda and Facility level. For instance, regarding achievement in skilled birth attendance, East Gojam performed 34%, whereas North Wollo achieved only 23%.
A recent DHS (mini DHS, 2014) pointed out factors that affected Institutional Delivery including place of residence, education, number of ANC visits attained, and also age and wealth thought to some extent. Urban births are six times more likely than rural births to be delivered in a health facility (63% versus 10%). Besides, variations are also remarkably wide among regions, low records of Institutional deliveries are predominantly in pastoralist areas. The percentage of births delivered in a health facility ranges from 6%in Afar to 87%Addis Ababa. Only 2% of births were delivered by caesarean section.
In most cases, there was an improved availability of MNCH supplies and drugs; delivery service was provided 24/7; and also guidelines, protocol and clinical standards for MNCH services were accessible. Besides, Partographwas applied to monitor delivery; and providers were standby for timely identification of danger signs, complications, and subsequent management with arrangements for referral. EachvisitedWoreda had one to two Ambulances; youth were also organized to take labouring mothers to accessible sites for ambulance.
Conspicuous challenges were flashed through statistical figures collected from most facilities and bureaus visited concerning the follow up of mothers who appeared for first antenatal care visit through delivery. A good instance in this context would be data received from SNNP region. Initially, there were 694,736 pregnant women who attended the first ANC visit; however, only 458,653 did arrive at the health facilities for the fourth ANC visit pointing toward 43% (236, 083) drop outs. Further analysis also showed there were208, 266(45.5%) mothers who delivered in health facilities compared to the 458,653 mother that showed up during the fourth ANC visit. This signifies the tendency of mothers preferring to give birth at home than at health institutions. Further investigations are advised.
Prominent challenges with reference to women who did not deliver at a health facility were that mothers: did not think it was necessary (45%), it was not customary (33%), stated health facility was either too far or that they did not have transportation (22%). Marked differences are observed among regional as well by place of residence (mDHS, 2014).
The strong positive correlation between higher numbers of antenatal visits and skilled birth attendance further corroborates the need to promote regular and more ANC visits as one of the strategies to increase institutional delivery.

Page | 26
1.1.3. CLEAN AND SAFE DELIVERY SERVICES
The HEP made health services more accessible than ever, it is yetto be exploited for improving rural women’s access to clean and safedelivery and postpartum care. Indeed, there are real opportunities toimprove the coverage of skilled birth attendance, institutional deliveryand postpartum care in the country. Strengthening HEWs’ capacityon birth preparedness, identification of danger signs, normal delivery,postpartum care, should constitute among the priority intervention asstipulated in the HSDP-IV.
There is sufficient evidence on the role of HDAs in linking households with HEWs. With a support from HDAs the HEWs identify pregnant women in the communities; providebasic information on birth preparedness and danger signs; notifyexpectant mothers; and provide basic postpartum services; arrange referral to the Health Centers. Evidence indicated that the lack of usage of delivery care in the country is related not only to accessibility but also acceptability of the services. In fact, the vast majority of women with home deliveries saw institutional delivery as “unnecessary” and a “non-customary practice”.
Clean and safe delivery coverage declined from 17.0% in EFY 2002 to 8.2% in EFY 2006.On average, clean and safe delivery showed a 15.4% decline since the start of HSDP IV.In contrast, available data showed that institutional delivery has been increasing.The five years data made available from HMIS was analysed and the correlation between these two indicators has been computed which revealed a statistically significant linear relationship. In addition, HEWs were interviewed during the review regarding the decrement in clean and safe delivery. Most agreed they have been encouraging mothers to attend delivery in a Health Center. Thus far, the declining trend in clean and safe delivery is very likely due to the counter effect of increased institutional delivery referred from Health Posts.
1.1.4. EMERGENCY OBSTETRIC CARE
Maternal mortality is one of the leading public health problems in developing countries, nearly half of these deaths occur in the African Region. The five major causes of maternal mortality related to pregnancy are haemorrhage, sepsis, unsafe abortion, hypertensive disorders and obstructed labour3. In order to reduce maternal mortality, universal access to emergency obstetric care should be established and all women and newborns with complications should have rapid access to well-functioning facilities. Emergency Obstetric Care is defined for two different levels of the health care system: Basic and Comprehensive. Basic services are provided at the Health Center level and Comprehensive services at the primary hospital level.
3Safe Motherhood: Improving Access to Emergency Obstetric Care. WHO, 2003

Page | 27
1.1.5. POSTNATAL CARE SERVICES
Owing to complications arising from delivery, particularly during the 48 hours of post-delivery, a large proportion of maternal and neonatal deaths occur; thus, monitoring is compulsory.
Postnatal coverage showed a spectacular increased from 7% in 1994 to 64% in 2006 at a rate of 6% per annum, yet variations among regions were wide.All regions didn't meet the annual target except Harari. Addis Ababa and Somali scored below 2005 performance which is similar to the performance in institutional delivery. The reasons behind poor performances should be investigated thoroughly.
1.1.6. MATERNAL DEATH AUDIT
In general, the major causes of maternal mortality were related to haemorrhage and infection as identified by virtually all facilities visited. This figure also matches with most studies which identify Ante partum Haemorrhage, Postpartum haemorrhage and Postpartum Sepsis as the main cause. Postpartum Haemorrhageis the leading cause. Key underlying causes include obstructed/prolonged labour (13%), ruptured uterus (12%), severe preeclampsia/ Eclampsia (11%) and about 6% attributable to complications from previous abortions.
Maternal death surveillance and response (MDSR) was introduced in most facilities since the beginning of 2006.Data analysis following the audit contributed to the progress in the reduction of MMR though reporting was send from small number of facilities. The audit investigated both demand and supply side factors that all together contributed to maternal death. Shortage of skilled midwives, weak referral system at health centre levels, lack of inadequate availability of BEmONC and CEmONC equipment, and under financing of the service were identified as major supply side constraints that hindered progress. On the demand side, cultural norms and societal emotional support bestowed to mothers, distance to functioning health facilities and financial barrier were found to be the major causes.To this end, realism of the maternal death audit system, irregularities to conduct the audit, and also adherence to the guideline were the most important challenges uncovered through the review.

Page | 28
1.1.7. FAMILY PLANNING SERVICE
Fertility declined in Ethiopia over the past decade. In 2006, studies revealed the total fertility rate (TFR)has tumbled to 4.1 children per woman in 2006 (EFY) nationally, but with substantial differences among regions. The variations stretch from 1.7 to 7.3 children per woman in Addis Ababa and Somali in that order. Fertility levels are higher than the national average in Somali, Afar, Benishangul-Gumuz, Gambella, Tigray and SNNP (mini DHS, 2014).
Equally impressive is that rural women have twice as many children as urban women. The study also showed that fertility and use of contraceptive are inversely proportional, as the trend for fertility increases, the trend for CAR decreases.
In order to measure the effect of contraceptive intake with respect to decreased fertility, the correlation between TFR and CAR was computed. Analysing data from 1990 to 2006 EFY yielded that Pearson's correlation coefficient was significant at the 0.01 level. These variables were negatively correlated. This suggests that utilization of contraceptives had an appreciable effect on fertility. In other words, fertility has been declining due to increased availability and utilization of contraceptives.
Figure 05: Trends in Total fertility Rate Vs Contraceptive Acceptance Rate (National)

Page | 29
1.1.8. CONTRACEPTIVE ACCEPTANCE RATE
Contraceptive use contributes also to improvements in maternal, newborn and infant health by preventing unintended or closely spaced pregnancies as well as pregnancies in very young women, which can be risky. It has been documented that contraceptive use can have an impact in reducing maternal mortality by averting more than one third of maternal deaths4.
The Contraceptive Acceptance Rate (CAR) was only 14%in 1994 (EFY) nationally. Since then the there was a progressive increment through the years reaching 61.9% in EFY 2002. But then, it was stable for a couple of years followed by a slight drop for another two years. Finally the coverage showed a slight increment and reached 62% in 2006.
The overall performance with regard to CAR was sluggish and gaps among regions are also pronounced. In 2006, out of 17.6 million eligible females 10.95 million (62%) have received one or the other FP method showing a slight improvement compared to 60% in 2005. Almost all regions scored below their annual target. Furthermore, Somali, Afar Gambella, Addis Ababa and Dire Dawa have scored below the performance in 2005 (EFY). The accomplishment of emerging regions is still low and the progress in the past few years has been phlegmatic.Knowledge of at least one method of contraception is nearly universal among currently married women and injectable, used by 31% women, is the most popular modern method followed by implants and pills.
4All Party Parliamentary Group for Population Development and Reproductive Health. Return of the
population growth factor: its impact upon the millennium development goals. 2007.
7.3
5.7
4.8 5.1 5.21.7
4.4 3.4 4 4 3.4
1
8.4
28.633.3 34.2 34.5
38.6 41.2 42.8 44.9
57.4
0
10
20
30
40
50
60
70
TFR Any modern method
Figure 06: Correlation between Fertility Rate and use of contraceptive (by region, in 2014)

Page | 30
Most visited facilities had all the appropriate methods/mixes available and were continuous accessible. The implementation of long acting method has been emphasized recently. In Tigray, for instances, 23% of family planning method was long acting. Implanon service was delivered, through a campaign by midwifes, in all Health Centers and their catchment Health Posts.
Progress and expansion of Adolescent Friendly Reproductive Health Services (AYHR) was not strong; as well YFHS service is given a little focus. Similarly, the focus was also low in 2006. Though it is reported that there is an increase in site expansion in most regions, only less than half of the health facilities were relatively strong and none of the hospitals were able to deliver YFHS service. Strengthening YFHS through school health; and integration family planning services to PNC was suggested.
1.1.9. PREVENTION OF MOTHER TO CHILD TRANSMISSION OF HIV
The strategy in preventing Mother to Child Transmission of HIV was shifted to new “Option B+” approach in 2005 (EFY). Through this approach, HIV-positive pregnant women start antiretroviral therapy (ART) regardless of their CD4 count and are maintained on treatment for life. Option B+ represents a cost-effective strategy not only for preventing new HIV infections among infants, but also for improving the survival of HIV-infected mothers and reducing orphan hood, with a vision of an HIV free new generation.
In 2006 (EFY), most health facilities have already adopted the new Option B+ approach. Of the 2542 health facilities targeted in the annual plan, 2792 public health facilities (91%) were able to implement switch to the new approach.
Injectables74%
Implants12%
Pill6%Traditional
3%IUD3%
Male condom1%
Other1%
Female sterilisation
0.5%
Figure 07: Use of modern contraceptive method among women (2014)

Page | 31
The PMTCT component showed progress persistently over the years, with an average increase of 10.5% per annum, reaching 64% in 2006. During the 2006 fiscal year, a total of 1,892,476 out of 2,958,930 pregnant mothers who attained ANC were tested and 34,526 tested positive for the virus. Yet, only half of those mothers (18,263, about 53%) were linked to ART service for treatment. Noteworthy, at this point, is the fact that a loose-fitting ART linkage and referral is noticed.
1.1.10. LESSONS LEARNED
In most visited sites, main measures undertaken in improving MNCH in 2006 were establishment of HDA, strong supportive supervision (ISS) conducted at all levels, extensive training on BEmONC/CEmONC and continuous supply of equipment, drug and materials.
Numbers of Health Centers with provision of BemONC, PMTCT, IMNCI and YFHS service have increased compared to the previous year in visited sites. Most primary hospitals are providing CemONC.
BemONC services are provided 84% (189/224) of Health Centers and Midwifes trained in Tigray region has reached 96% (696/726).Almost all visited health facilities in Amhara had BEmONC trained health workers.
Focus was given to strengthen and create awareness in the community through HEP/WDA and pregnant/lactating mother’s
0.0
10.0
20.0
30.0
40.0
50.0
60.0
70.0
EFY 2002 EFY 2003 EFY 2004 EFY 2005 EFY 2006
Annual Performance (in percentage)PMTCT Started on ART (Pregnant)
Figure 08: Annual performance in PMTCT and Women started on ART (pregnant)

Page | 32
conferences.Pregnant/lactating mothers’ conference appears to be a widespread practice among regions except a few.
In 2006, focus was given to strengthen and create awareness in the community through HEP/WDA. Heath facilities are constructing maternity waiting homes, community are contributing in cash/kind for labouring mothers.
Establishment of maternity waiting homes has been adopted by most facilities, only few sites visited lack the setup. Individual communities through HDAs in the respective catchments were in possession of all the activities including support for construction of and also taking care of the mothers.
In most facilities, health workers are committed and doing their best to make health facilities women friendly.
Identify communities and/or facilities with weak performance, spot challenged Woredas through information use and analyse HMIS data for evidence based decision to support particular Woredas/facilities was a commendable action in Tigray region. In this respect areas with high maternal as well as neonatal mortality were identified and actions were taken.
It was found half of maternal deaths in Tigray region concentrated in Wolkait Woreda. Further investigations showed that quality of PNC was low and PPH and infection were main causes of death.Findings were debated and massive awareness and sensitization campaignhas been conducted in the Woreda.
The performance of Harari,with regard to Institutional Delivery, is the highest with 78% coverage in 2006. Besides, the region exceeded its targets for the last 5 consecutive years denoting the possibility to achieve intended goals set for HSDP IV.
Each visitedWoreda had one to two ambulances, youth also organized to take labouring mothers to accessible sites for ambulance.
Health Posts with best practice in improved CAR include Atsbi HP providing long-acting FP methods; reported provision of long acting method was 52% in 2006.
In some regions Fistula elimination campaign was conducted. In Tigray region, 28 cases were treated and cured for the period of EFY 2006.

Page | 33
1.1.11. CHALLENGES
Core challenges identified during 2006 include low institutional delivery; bottlenecks on the decision made to deliver at HF; access to health facilities and quality of services; delayed and inconvenient referrals;less commitment by health professionals to address issues of maternal mortality; HDAs were not effective in some setups as they were established on voluntary bases who tend to prioritize individual matters; and also practicality of the maternal death audit system.
Despite commendable progresses in most maternal and neonatal health indicators, home delivery is still high evidenced by data from health facilities, zones and Woredas visited.
Costs associated with treatment of sick new-borns remain a barrier despite the introduction of fee exemptions for MNCH services. Some health facilities are also charging for sever acute malnutrition.
Inadequate labour room space and maternity waiting area, inadequate operating theatre constrained the services of hospitals. Moreover, shortage of anaesthesia supplies, frequent interruption of basic laboratory tests, shortfall in blood supply for transfusion and oxygen concentrator were among challenges in most hospitals.Frequent power interruption has also affected the services of hospital.
The distribution of basic MNCH equipment appears to be not uniform to Health Centers, particularly equipment for assisted delivery were lacking or deficient in most Health Centers visited. Equipment including Vacuum Extractor and Manual Vacuum Aspiration, Suction Machine, Radiant Heater and Concentrated Oxygen were among the most frequently mentioned inputs unavailable.
Lack of Guidelines for PMTCT and Abortion/Post Abortion Careservices were not available in some of health centresvisited.
Realism of the maternal death audit system, irregularities to conduct the audit, and also adherence to the guideline was the most important challenges uncovered through the review, particularly in health centers surveyed.
Inconsistent data recording and reporting system has also been reported from two regions as an important challenge: Addis Ababa and SNNP. Discrepancies were noticed for various indicators that were compared using various studies and reviews.
Absence of Maternity waiting homes is one of major problems in the health facilities. There is shortage of budget from the government side and absence of commitment from the community to construct these waiting areas for mothers with high risk pregnancies.

Page | 34
The overall performance with regard to CAR was sluggish and gaps among regions are also pronounced. Almost all regions scored below their annual target, particularly Somali, Afar Gambella, Addis Ababa and Dire Dawa have scored below previous performance. The accomplishment of emerging regions is still low and the progress in the past few years has been phlegmatic.
Progress and expansion of Adolescent Friendly Reproductive Health Services (AYHR) was not strong; as well YFHS service was given a little focus. Similarly, the focus was also low in 2006. Though it was reported that there was an increase in site expansion in most regions, only less than half of the health facilities were relatively strong and none of the hospitals were able to deliver YFHS service.
Lack of physical access to health facilities was implicated among the main reasons for not delivering in health institutions, especially in the emerging regions (Afara, Somali, Gambela and Benishangul Gumuz).
1.1.12. RECOMMENDATIONS
Enhance the performance of ANC service; thereby encourage pregnant women to attend at least four visits throughout their pregnancy. The strong positive correlation between higher numbers of antenatal visits and skilled birth attendance further corroborates the need to promote regular and more ANC visits as one of the strategies to increase institutional delivery.
Focus should be given to pastoralist communities and appropriately selected approaches suitable to these communities should be reviewed and implemented. This finding was also flagged through the MTR 2013 review as recommendations.
Performance of Clean Delivery has been declining for the last four years (during HSDP IV) may be due to the referrals made by HEWs. Though increment of Clean and Safe Delivery was set in those plans, achievements were quite the reverse. Hence, further investigations are recommended in this area.
Pertaining to the outstanding performances of Harari in the area of Institutional Delivery, a detailed review should be carried out to understand the details of approaches applied in achieving such a remarkable result in short period; thereby pick up and duplicated best practices in other regions, predominantly important for urban areas.
Strengthen current initiatives to make services women and client friendly, especially focused towards establishment of maternity waiting home.

Page | 35
Ensure sustained availability key MNCH supplies particularly BEmONC and newborn supplies.
Improve skills of Health workers on abortion and post abortion care and also continual availability of these services.
In reference to theperformance of Addis Ababa in 2006, statistical figures of HMIS were not congruent with findings captured from recent studies (as in mini DHS, 2014). Also data collected from few other sites visited showed similar discrepancy. These inconsistencies should be studied further.
The notion to distribute more ambulance to rural sites was creditable. Yet, in some hard to reach areas, access to ambulance service was a concern due to long distance and also infrastructure. Special review is needed to address individual issues raised from each region.
The strategy for neonatal care and intervention need to be aggressive and focused before end of HSDP IV.
It is understood that the MDA practice has an impact in the progress towards reduction of MMR. However, more facilities should be encouraged to take upon the activity and also send timely reports.
Adolescents are 42% of the population and AYFH service need to be given due emphasis. However, YFHS service was given a little focus in 2006.This finding was also flagged through the MTR 2013 review as recommendations.
Strengthening YFHS through school health and also integration to PNC is suggested.
Access to health facilities was implicated, especially in the emerging regions (Afar, Somali, Gambella and Benishangul Gumuz). Any effort to improve institutional delivery in these regions needs to focus on improving population access to health facilities.
Likewise, together with communities explore feasible options for improving access to service or transportation especially where the topography presents particular challenges like Lasta Woreda.

Page | 36
1.2. NEONATAL AND CHILD HEALTH SERVICES
Children under age 15 account for nearly half of the population in Ethiopia: 45.3% are under 15 years of age, where 13.6% are under 5 years of age. The population distribution, by age, was found to be similar since the beginning of
2000 (mini DHS, 2014). As such, implementation of HSDP IV envisaged to decrease under-five mortality rate from 204/1000 live births to 68/1000 and infant mortality rate from 77/1000 live births to 31/1000.
1.2.1. REDUCTION OF UNDER-5 MORTALITY
With the intention of fulfillingHSDP goals, several activities have been undertaken, i.e. strengthening immunization, expansion of Integrated Management of Neonatal and Childhood Illnesses (IMNCI), and neonatal care (establishing newborn corners and NICUs), capacity building on program management for child health services, strengthening HEP and implementing locally relevant and effective child health interventions in pastoralist areas.
As a result of these efforts, the under-five mortality rate has been reduced from 204/1000 live births in 1990 to 68/000 live births in 2012, decreasing mortality by two-third.A report asserted that Ethiopia became one of few
countries that fulfilled MDG goal by reducing child mortality5. To strengthen
the results obtained, additional efforts and child health strategies are in place and are complemented by interventions for maternal health, in particular, skilled care during pregnancy and childbirth. The performances charted under each activity during EFY 2006 are listed below.
5The UN Inter-agency Group for Child Mortality Estimation (IGME), Levels and Trends in Child
Mortality: Report 2012. UNICEF, New York, 2012.
204
166.2
123
8868 64
Achieved68
0
50
100
150
200
250
Under-5 Mortality Infant Mortality Neonatal Mortality
Figure 09: Trends in Under-5, Infant and Neonatal Mortality (National) Data Format: Years in Gregorian Calendar

Page | 37
1.2.2. NEWBORN CARE /NICU, NC/
Every year 3.7 million newborn babies die in the first four weeks of life. Many newborns fall sick in the first days of life due to complications of childbirth. Up to two-thirds of these deaths can be prevented if mothers and newborns receive effective interventions. It is therefore important to have skilled care at
birth so that any complications can be prevented or treated6. Likewise, the
national strategy, in Ethiopia, also promotes universal access to antenatal care, skilled birth attendance and early postnatal care to sustain the reduction in maternal and neonatal mortality.
Evidences have shown that home-based newborn care interventions can prevent 30–60% of newborn deaths in high mortality settings under controlled
conditions7.It is clear from this account that community health workers (HEWs)
can do a lot to improve newborn health and prevent newborn deaths. However, community health workers need appropriate training to perform their tasks. As such in 2006, the implementation of Community Based Neonatal care and newborn sepsis management by HEWs was launched. For this purpose, provision of relevant training has been started in some regions visited.
On the other hand, nationally, a total of 30 hospitals were able to provideNeonatal Intensive Care Unit /NICU/ services in 2006. In addition, some Health Centers visited during the review were well equipped and found operational providing Neonatal Corner service. Newborn care trainings werealso provided for midwives and protocols and guidelines were distributed.
1.2.3. IMMUNIZATION
The expanded program on immunization (EPI) is among the longstanding program that has continued to make a steady progress. In 2006 (EFY), expansion and optimization of access and utilization of immunization services was further strengthened. Introduction of Rota Virus vaccine; expansion of immunization through campaigns supplementing the routine immunization program; installation and maintenance of cold chain equipment; provision of training for providers; groundwork for emergency preparedness and control of outbreaks were among the key undertakings in 2006 (EFY).
In addition, a national review was conducted to identify gaps in cold chain equipment, replacement and spare parts; skilled human resource; and improved vaccine storage and handling. The plan to transfer the cold chain system to PFSA was being executed and arrangements have been finalized for smooth transition. A few complaints were raised on the advantages as well as progress made so far.
6Home visits for the newborn child: a strategy to improve survival, WHO/UNICEF WHO 2009. 7Bang AT et al. Effect of home-based neonatal care and management of sepsis. Lancet, 1999.

Page | 38
Most of the regions are working on quality storage and deliverance of vaccines; reduction of wastage; and also decrease number of dropouts. Tigray region reported wastage of less than 10% for polio vaccine and 31% for measles in 2006.Thedropout rate for Polio and Measles were less than 5% and9% respectively. Cold chain system is improving and no significant problem in transport, supply, maintenance of refrigerators and commitment of providers as well from HEWs was reported from the region.
In 2006 EFY, Measles and Polio outbreaks were reported in a few regions. Measles was reported from Wolayta, Hawassa, Gomo-Gofa and Polio cases were spotted in Somali region. Measles cases were also reported in Oromia and Tigray region. Index case, in the case of Tigray, was reportedly from a neighbouring region though not asserted by evidence.
1.2.4. INTEGRATED MANAGEMENT OF NEONATAL& CHILDHOOD ILLNESS
Studies showed that More than 70% of child deaths are due to the five diseases i.e. pneumonia, diarrhoea, malaria, measles and malnutrition, and often a
combination of these conditions8. These diseases are also the reasons for
seeking care for at least three out of four children who come to health facilities. The study further recommends through an integrated approach, by managing the child in a holistic manner, is an effective move towards reduction in childhood morbidity and mortality. This approach is also shared by HDSP which envisaged the IMNCI strategy likely to have the greatest impact. Ethiopia has been actively implementing IMNCI since 1996 (EFY) and the coverage IMNCIhas improved gradually and steadily in the country.
8The UN Inter-agency Group for Child Mortality Estimation (IGME), Levels and Trends in Child Mortality: Report 2012. UNICEF, New York, 2012.
67 6876 77 82 82 80
83 8277 7785 82
86 85 85 88 89
0 0 0 0 0 0
44
70
79
55 56
66 6672 75
7178
78
0
10
20
30
40
50
60
70
80
90
100
Measels Pentavalent PCV3 Fully
Figure 10: Trends in National Immunization Coverage (percent)

Page | 39
During the review, it was noted that under-five services were implemented acquainted with the IMNCI approach and provision of IMNCI service was as per the guideline in most health facilities. The main activities under IMNCI service were standardized case management of ARI, diarrhoea, infant feeding, nutrition and growth monitoring. The IMNCI service was found implemented both at the facility level as well as at the community level, referred as Integrated Child Case Management /ICCM/.The disease prevention activities under the ICCM strategy was implemented mostly based on static and outreach services.
1.2.5. LESSONS LEARNED
– In most regions visited, there was no record of interruption of vaccine or stock out throughout the year in 2006.
– Improvements were reported for Cold chain system as well efficiency and no significant problem was reported in supply, distribution, maintenance and commitment of providers.
– Coverage has been increased for most regions. Penta-3 coverage in 2006 was 93% slightly higher than the 88% achievement in 2005 in Tigray.
– Most facilities were able to reduce the wastage rate for vaccines as well drop outs of the service. Tigray region reported wastage of less than 10% for polio vaccine and 31% for measles in 2006.
– Expansion of access to IMNCI has been widespread in 2006 and was relatively better than the performance of preceding year. 220/224 Health Centers are providing IMNCI; Training provided to 548 (96% of plan) in Tigray.
1.2.6. CHALLENGES
– Low surveillance capacity of regions, delay in response, and poor cold chain were among gaps reported by regions that contributed to outbreaks.
– Low uptakefor under-2 month infants in ICCM; and also inadequate supply as well utilization of Zinc by Health Posts were some of the constraints hampering expansion of ICCM.
– Low awareness and confidence among health providers on neonatal care. Low IMNCI utilization in hospitals was noted mostly due to poor compliance by physicians.

Page | 40
– In rural community, under-five service was provided free of charge at Health Posts, but the service wasnot made available in the urban setup.
– Only one health care provider was trained in IMNCI per facility and which wasconsidered inadequate to deliver the service routinely and also gain results in clients’ satisfaction.
– The plan to transfer the cold chain system to PFSA was being executed and arrangements have been finalized for smooth transition. A few complaints were raised on the advantages as well as progress made so far.
– ICCM reports not collected through HMIS.
1.2.7. RECOMMENDATIONS
– Valuable results attained in the reduction of under-5 mortality should be consolidated and continuity of similar efforts should be asserted. These outcomes should be reinforced through innovative strategies and interventions.
– Household visitsby HEWs after birth was an essential strategy to deliver effective elements of care to newborns,thus increase newborn survival. This strategy has shown positive results by promoting early and exclusive BF; hygienic umbilical cord; timely vaccination; and also identifies danger signs and prompt care seeking by the family.
– HEWs should try to deliver services as close as possible to each home and the family. The ICCM services should be linked to PNC and the full continuum of care should be established.
– Next steps to improve IMNCI include strengthening ISS for quality improvement, focused training and discussion with physicians at hospital to utilize the IMNCI guideline.

Page | 41
1.3. NATIONAL NUTRITION PROGRAM
The FMOH, in collaboration with development partners, has applied considerable effort directed at reducing the magnitude of malnutrition and helped the country reach the Millennium Development Goal. Several policies and strategies have been implemented to create sustainable out-patient services at the community level to treat children with severe acute malnutrition. The Community-Based Nutrition interventions contributedto improved feeding practices of infants, children and mothers; and promoted production and use of locally-available complementary food.
As a result, significant progress is observed in addressing problems and the nutritional status of children showed a downward trend in the proportion of children stunted and underweight over the last fifteen years. Accordingly, the 2014 DHS revealed that the prevalence of stunting decreased by 31% (from 58% to 40%), signifying an improvement in chronic malnutrition over the years. The proportion of children underweight declined even more substantially by 39% over the same period. However, a significant number of under-five children are still underweight or stunted. A recent estimate revealed that nationally, 40% of under-five children are stunted, 25% are underweight, and 9% are wasted (miniDHS, 2014).
Figure XX: Trends in nutritional status of children under the age of 5 (mini DHS, 2014)

Page | 42
1.3.1. COMMUNITY MANAGEMENT OF ACUTE MALNUTRITION
Quarterly Child Health Days were undertaken for nutritional screening where malnourished children and pregnant and lactating women were identified and received food rations. For this, Health Extension Workers were trained on malnutrition screening and caregiver counselling techniques which are incorporated in to the Integrated Refresher Training package.
Severely malnourished children received effective treatment for SAM through Outpatient Therapeutic Feeding Programs. Expansion of Community-based management of acute malnutrition to Health Posts was effectively setup and was functional in most Health Posts visited. The screening and treatment of children affected by malnutrition, Vitamin A deficiency, intestinal parasites is moving forward to a new integration level. These initiatives used to be a campaign based but starting 2006; integration of these services was believed to be more effective and will be integrated to the routine system.
1.3.2. LESSONS LEARNED
Major achievements of CBN /CMAM in 2006 were increased EBF via promotion, demonstration of food diversification by WDA at community level and increased coverage of Vit A and de-worming.
A good practice was seen Tigray: since June 2006, CHD was integrated into monthly activity of the HEWs; nutrition supplements were locally produced in 15 Woredas.
Therapeutic feeding centerwas made available for uncomplicated cases in most visited sites.
Nutrition report was integrated in the revised HMIS;
1.3.3. CHALLENGES
Most regions were able to incorporate nutrition in 2006 plan, but strengthening the TFP with TFU in Health Centers/Hospitals, OTP at health post and multi-sector coordination at Woreda level was low in most cases compared to targets.
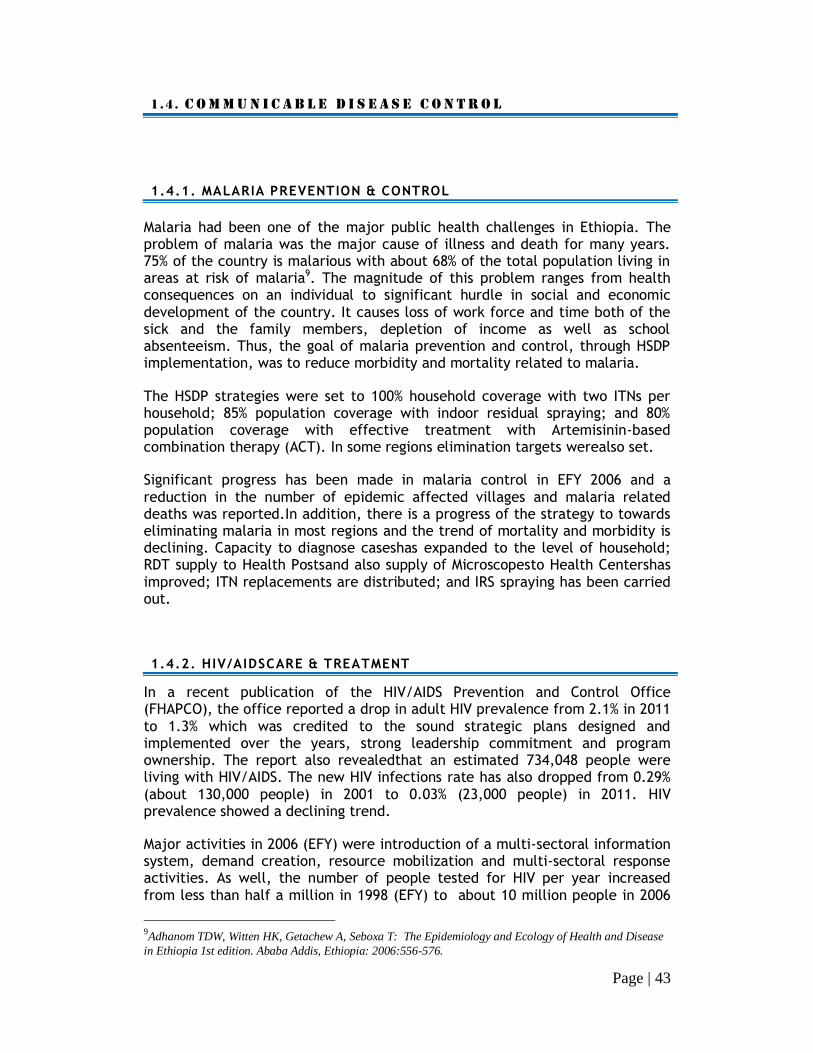
Page | 43
1.4. C O M M U N I C A B L E D I S E A S E C O N T R O L
1.4.1. MALARIA PREVENTION & CONTROL
Malaria had been one of the major public health challenges in Ethiopia. The problem of malaria was the major cause of illness and death for many years. 75% of the country is malarious with about 68% of the total population living in areas at risk of malaria9. The magnitude of this problem ranges from health consequences on an individual to significant hurdle in social and economic development of the country. It causes loss of work force and time both of the sick and the family members, depletion of income as well as school absenteeism. Thus, the goal of malaria prevention and control, through HSDP implementation, was to reduce morbidity and mortality related to malaria.
The HSDP strategies were set to 100% household coverage with two ITNs per household; 85% population coverage with indoor residual spraying; and 80% population coverage with effective treatment with Artemisinin-based combination therapy (ACT). In some regions elimination targets werealso set.
Significant progress has been made in malaria control in EFY 2006 and a reduction in the number of epidemic affected villages and malaria related deaths was reported.In addition, there is a progress of the strategy to towards eliminating malaria in most regions and the trend of mortality and morbidity is declining. Capacity to diagnose caseshas expanded to the level of household; RDT supply to Health Postsand also supply of Microscopesto Health Centershas improved; ITN replacements are distributed; and IRS spraying has been carried out.
1.4.2. HIV/AIDSCARE & TREATMENT
In a recent publication of the HIV/AIDS Prevention and Control Office (FHAPCO), the office reported a drop in adult HIV prevalence from 2.1% in 2011 to 1.3% which was credited to the sound strategic plans designed and implemented over the years, strong leadership commitment and program ownership. The report also revealedthat an estimated 734,048 people were living with HIV/AIDS. The new HIV infections rate has also dropped from 0.29% (about 130,000 people) in 2001 to 0.03% (23,000 people) in 2011. HIV prevalence showed a declining trend.
Major activities in 2006 (EFY) were introduction of a multi-sectoral information system, demand creation, resource mobilization and multi-sectoral response activities. As well, the number of people tested for HIV per year increased from less than half a million in 1998 (EFY) to about 10 million people in 2006
9Adhanom TDW, Witten HK, Getachew A, Seboxa T: The Epidemiology and Ecology of Health and Disease
in Ethiopia 1st edition. Ababa Addis, Ethiopia: 2006:556-576.

Page | 44
(EFY). The performance exceeds the target planned for 2006 (9.2 million) indicating a huge demand for testing.HAPCO- is currently preparing a guideline that clearly indicates who and when should a person be tested for HIV and stressed the need for targeted testing in order to avoid wastage of inputs. Regarding the introduction of the multi-sectoral information system, design and implementation training on MRIS was conducted and cascaded down to Woreda level.
In 2006, HIV/AIDS partners including PEPFAR and GF disclosed their plans in the reduction of a direct financial resource commitment. As such, a transitioning plan was unveiled where the PEPFAR program will be transferred to countries with ownership and management of programs and their functions, as well as broader capacity building necessary for the transfer.PEPFAR is expected to provide financial support for SNNPR and four emerging regions.Investment case tool and relevant concept note has been developed submitted to Global Fund for the year 2016-2020. Local resource mobilization was also started by making use of HDA platform for community mobilization and conversation.
1.4.3. TUBERCULOSIS & LEPROSY PREVENTION
This program works to improve, expand, and sustain services through comprehensive package of TB & Leprosy control interventions mainly expansion of DOTS (Directly Observed Treatment Short course); response to emergence of MDR-TB; TB/HIV care and treatment; and strengthening leprosy case detection and treatment.
In EFY 2006, the core activities wereincreased number of facilities that treat Multi-Drug Resistant TB (MDR-TB); implementation of community TB prevention and control through HDA; capacity building for strengthened TB referral; expansion of TB treatment for public Private Mix (PPM); soliciting facilities for implementation of AFB service; expansion of quality assurance through EQA; improving collection and transportation of sputum samples; expand Genxpert diagnostic technology; and build capacity of facilities to improve leprosy case detection and treatment. In addition, raising community awareness, social mobilization and also integration service with Health Extension Program were among additional activities.
1.4.4. LESSONS LEARNED
Practices in some regions were: increased access to early diagnosis and treatment with expansion of facilities; household level cases diagnosis; strengthening community participation and awareness through HDA.
Integration of MCP in to HMIS and the funding scheme is effected; Woreda, and facility were integrated to HEWs; Malaria reporting included as part of morbidity report of HMIS; PHEM disease report is sent weekly though with

Page | 45
setbacks; funding for MCP was availed from Global fund; all Health Centers with no microscope or lab technician and Health Posts are utilizing Rapid Test Kits; and severe cases were referred to hospitals.
Drug and diagnostic kits availability was assured throughout the year through PFSA; LLITN was distributed through HEWs in collaboration with Kebele/local leaders prioritizing HH with pregnant and under five children; The HEWs are ensuring the proper use of LLITN through their household level visits; no shortage of insecticide spray pumps. In a few regions, deficiency of spray pumps was reported.
The HIV/AIDS treatment guideline is revised as per the revised recommendations of WHO and materials are distributed to facilities.
Changes in the restructuring of HIV/AIDS were effected in most regions with the intention to harmonize leadership, budget and report. The reformed team structure was put under a new core process, the Multi-sectoral response for HIV/AIDS prevention and treatment.
By the end of 2006, overall there is relatively improved access to prevention, care and treatment to HIV/AIDS. The uptake of PLHIV access for care and treatment increased mainly due to Option B+ implementation
Transition plan has been a priority in most regions in 2006. There was a focused transition activity on clinical system mentorship, reporting and gap filling training from development partners. Local partnership was established with universities to provide an in-service training encompassing ART, STI, PIHCT, PMTCT, and TB/HIV.
In most cases, mainstreaming is introduced. The HIV/AIDS program is integrated with services in terms of HR, HMIS, funding and management at all levels from regional health office to HEWs/HAD.
Focus on high risk groups, large scale farming and industrial areas to promote HIV prevention, care and support services and linkage to treatment services. HCT was availed to most Health Centers and Hospitals though there is a frequent interruption of HIV test kits.
1.4.5. CHALLENGES
Challenges impeding elimination policy: IRS coverage is low (40% in Tigray); deficient ITTN and insecticide supply; inadequate capacity building and turnover of experienced staffs; no vector control reporting template; MCP is being run by one expert as focal person under the PHEM case team.
The strength of the reporting system was not adequately used for action because of there were setbacks in data quality since collection was through

Page | 46
telephone; electronic PHEM has been started but not functional; and interruption of network.
LLITN and insecticide supply is not adequate and timely based on the guideline; frequent shortage of spare parts.
In 2006, there was no new ART site scale up. Sheraro hospital just commenced to deliver service and was non-ART site as it is not well staffed as well equipped.
Interruption of some HIV/AIDS care and treatment related services were reported. Most reported mainly shortage of testing kits while other reported shortage and interruption of DBS test kits and reagents; viral load reagent; and also CD4 investigation reagents. Some also reported stock out of testing kits for pregnant mothers and TB patient.
Associated with the interruption of reagents and kits, challenges were confronted: numerous complaints from HIV/AIDS patients, declining of number of people tested for HIV compared to preceding year. Problems with shortage of supplies persisted in some regions and facilities for about a year.
In Tigray region, ART sites not scaled up adequately and the region is only 46% on the road map. No adequate TOT trainers’ pool. No adequately trained man power for maintenance for CD4 and Viral load machines and delayed response from EPHI was another issue reported.
The HIV/AIDS board and council at regional and Woreda level not functioning based on the responsibility and directions in the HIV/AIDS policy. Poor follow up from regional health bureau as well from FMOH. It is common to receive information from development partners than FMOH.
Low performance in case detection rate was analysed and two important factors were identified: poor laboratory capacity as well as low quality of data due to poor data collection.

Page | 47
2. I M P R O V E D C O M M U N I T Y O W N E R S H I P
Ethiopia launched the community-based disease prevention program, called Health Extension Programme (HEP), in 2003 with an objective to reach the poor and rural population and deliver preventive, basic curative and high-impact interventions. The introduction of HEP was a government-led community health service delivery programme.This strategy has also been customized to meet the needs, demands and expectations of the pastoralist, agrarian and urban population. It is considered as the most important institutional framework for achieving the Millennium Development Goals (MDGs).
2.1.1. HEALTH EXTENSION PROGRAM
The HEP basically consists of a health post which is operated by front-line community health personnel, called Health Extension Workers (HEW). The HEP focuses on four major areas of preventive healthcare and provides 16 different packages to reach rural community at large and address inequity. Currently, more than 38,000 HEWs are deployed.In general, the HEWs are expected to conduct household visits to deliver the different packages; perform home-based follow-up on pregnant women and referrals; identify cases and refer to health centres; manage the operation of health posts and submit regular reports to Woreda Health Offices.
In addition, HEWs are also expected to participate in the selection, formation, establishment, training and follow-up of HDAs. The health sector strategy has been tested and proved successful in reaching the poor and addressing preventable diseases through the HEP as well the use of networks of the HDAs.
In 2006, one of the major threats to HEP appeared to be attritionof HEWs which has been a concern in most regions.The attrition rate was estimated at 5-8% (no evidence) in Tigray region. The region has been enrolling more and more candidates to TVET colleges in order to compensate for those leaving the Health Posts for good. In 2006 alone, 305 new HEWs were deployed. In addition, the ever increasing number of tasks assigned to HEWs shows an impact on frequency of household visit and also quality of services. As such, the issue was debated and existing standards were revised. Taking in to consideration the number of HEWs placed per HP and also average number of households visited, the number of HEWs was increased from 2 to 3 throughout the region.
The national plan of an upgrading scheme for HEWs, some already have graduated, was a good incentive as noted bymost respondents. On the contrary; however, HEWs who upgraded to level-four presented complaints because it was only a certificate upgrade without any promotion in terms of salary or more.
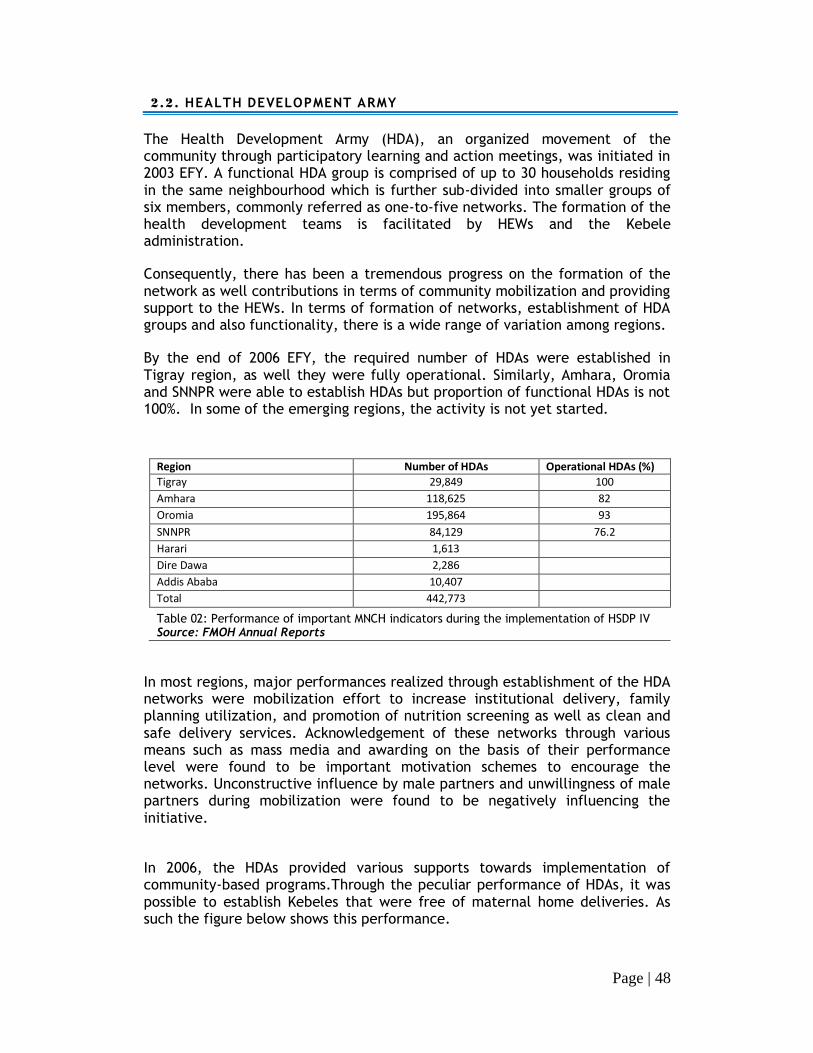
Page | 48
2.2. HEALTH DEVELOPMENT ARMY
The Health Development Army (HDA), an organized movement of the community through participatory learning and action meetings, was initiated in 2003 EFY. A functional HDA group is comprised of up to 30 households residing in the same neighbourhood which is further sub-divided into smaller groups of six members, commonly referred as one-to-five networks. The formation of the health development teams is facilitated by HEWs and the Kebele administration.
Consequently, there has been a tremendous progress on the formation of the network as well contributions in terms of community mobilization and providing support to the HEWs. In terms of formation of networks, establishment of HDA groups and also functionality, there is a wide range of variation among regions.
By the end of 2006 EFY, the required number of HDAs were established in Tigray region, as well they were fully operational. Similarly, Amhara, Oromia and SNNPR were able to establish HDAs but proportion of functional HDAs is not 100%. In some of the emerging regions, the activity is not yet started.
Region Number of HDAs Operational HDAs (%)
Tigray 29,849 100
Amhara 118,625 82
Oromia 195,864 93
SNNPR 84,129 76.2
Harari 1,613
Dire Dawa 2,286
Addis Ababa 10,407
Total 442,773
Table 02: Performance of important MNCH indicators during the implementation of HSDP IV Source: FMOH Annual Reports
In most regions, major performances realized through establishment of the HDA networks were mobilization effort to increase institutional delivery, family planning utilization, and promotion of nutrition screening as well as clean and safe delivery services. Acknowledgement of these networks through various means such as mass media and awarding on the basis of their performance level were found to be important motivation schemes to encourage the networks. Unconstructive influence by male partners and unwillingness of male partners during mobilization were found to be negatively influencing the initiative.
In 2006, the HDAs provided various supports towards implementation of community-based programs.Through the peculiar performance of HDAs, it was possible to establish Kebeles that were free of maternal home deliveries. As such the figure below shows this performance.

Page | 49
Figure 11:Kebeles free of home delivery through the participation of HDAs
2.3. HYGIENE ENVIRONMENTAL HEALTH
Communicable diseases attributable to poor sanitation, and which principally affect the underprivileged sections of the population, are still considered as
major health problems in Ethiopia10
. During the last few years, however, a multi-sectoral initiative has been launched to fulfilling Target 10 of the MDG 7: reducing by 50% the proportion of population without access to water and sanitation. Consequently, Ethiopia ratifiedthe “Universal Access Plan”, which seeks to reach 98.5% and 100% access to safe water and sanitation by 2015respectively.
Since 1990, improved sanitation coverage increased from 2% to 21% in 2011 and number of households with latrine increased from 86% in 2005 to 92% in 2006. Progress has been equitable across all regions though the population in the
poorest quintile benefitted least from improvements in sanitation11
. However, 24% of the population use facilities that do not yet meet basic hygiene standards.
Here, the contribution of Health Extension Workers (HEWs) was significant by promoting personal and environmental hygiene; increasing community awareness and involvement on safe water supply and prevention of water contamination; also promotingbehavioural change to improve food safety and control vector-born diseases. In addition, HEWs have also played a momentous role in carrying out key activities through the Community Led Total Sanitation (CLTS) approach.
10
Ahmed Ali. Hygiene And Environmental Health Services In Ethiopia. EJHD 11
Access to Sanitation in Ethiopia. UNICEF/WHO JMP 2013 Update
0
1000
2000
3000
4000
5000
6000
7000
Oromia Amhara Tigray SNNPR
6500
3437
714
220
387
233
Total Kebeles # of Free Kebeles

Page | 50
2.4. COMMUNITY-LED TOTAL SANITATION
The Community Led Total Sanitation (CLTS) program was rolled out through the formation of village and Kebele level CLTS task teams which were responsible to mobilize the communities towards open defecation free (ODF) community and monitor the process. The approach when implemented in the community has triggered the rural households to build and use latrines at household level and ban open defecation in their areas.
Open defecation rates were more than halved from 93% in 1990 to 45% in 2011on account of the scale-up of CLTS approach in all regions. Currently,more than 3,136 Kebeleshave been certified as ODF communities in 2006 nationally. Thus, compared to previous coverage, ODF Kebeles were doubled from 10% in 2005, to 22.6% in 2006 EFY.Though performance is making progress, the pace is slow which makes it unlikely along the lines of achieving 82% ODF communities by 2015.
Figure 12: Community-Led Total Sanitation (CLTS), 2006 EFY
0.0%
10.0%
20.0%
30.0%
40.0%
50.0%
60.0%
% o
f O
DF
Fre
e K
eb
eles
Region

Page | 51
2.5. LESSONS LEARNED
Almost all visited Health Posts conducted pregnant women conference which is a good exercise to share with those not currently applying the practice.
Community acceptance of the HEWs improved significantly. Community and HDA valued the contribution of the HEWs. In some areas, communities offered supported in the construction and/or renovation of health posts and participate by contributing various inputs whenever requested.
Achievement of targets has improved in all visited health posts compared with the preceding year except in clean and safe delivery.
CLTS has made use of the arrangement in the HEP as well networks of women development health army for success by translating the challenges into opportunities.
Advocacy and promotion were carried out through mass-media, and school-based clubs to encourage sanitation/environmental health clubs latrine construction and utilization and also CLTS training was provided to school teachers.
Health posts visited in Amhara have the list of pregnant women in the Kebele with expected date of delivery (EDD).
The IRT was appraised by most key-informants interviewed. Financially and technical support was provided from partners in translating training materials in to local language.
Experience sharing HEWs through visit and document exchange, among neighbouring Woredas and more, was found to be a good exercise in Tigray. At times, skill transfer was made for those HEWs which are new for the system as well for those not trained on specific topics.
The number of graduated households has increased through the teaching the complete package of HEP program and community members reflected benefit of sanitation packages
In some facilities visited, availability of water is a challenge. The worst were facilities even without access to ground water, thus using river water. In Tigray region, water tankers were distributed to 151 facilities by the end of 2006.
In all visited sites community and facility HDA are organized and mostly functional. Some of HDA leaders who took training from HEWs can be considered as second generation HEWs.
Acknowledgement of the HDA networks through various means such as mass media and awarding on the basis of their performance level were found to be useful practices.

Page | 52
2.6. CHALLENGES
All mandated serviceswere provided at health posts visited; however, clean and safe delivery was reduced drastically in some health post visited. The main reason for cutback of deliveriesat Health Posts was because HEWs were instructed to encourage mothers to deliver at health centre instead.
Availability medical supplies and commodities wereseldom interrupted. Paracetamol, Tetetracycline eye ointments were among those reported. Further investigations showed possible transport and supply chain issues. Worst, in line with this, was a few Health Posts visited reported shortage of iron, folic acid, PCV, Rota vaccine and injectables for more than a month. No further evidence acquired.
In 2006, one of the major threats to HEP appeared to be attrition of HEWs which has been a concern in most regions.
The ever increasing number of tasks assigned to HEWs shows an impact on frequency of household visits and also quality of services provided.
Most HEWs resentfully expressed their dissatisfaction as a rationale underpinning lack of motivation at work. Absence of benefits after completing an upgrade; scanty incentive packages as in transfer or salary; and also inadequate in-service training were among the major complaints entertained.
Urban health extension program was not robust compared to the rural setup. Most interviewed also expressed their scepticism about the ultimate goal of urban deployment of HEWs.
– Unconstructive influences to others as well unwillingness of male partners during mobilization were found to be negatively influencing the HAD initiative. Similarly, reluctanceby some residents to participate in community shared tasks; and significantly reduced time for personal businesses were among the challenges presented by HDA leaders. Though not frequent, computing priorities from kebele also avert the performance in some seasons.
– Some community members interviewed plead for availability of ambulance to transport women and newborns from the facility back home.

Page | 53
2.7. RECOMMENDATIONS
– Though the HEP has increased primary health service coverage, especially majority of the population living in rural areas and those dwelling far from Health Centers, significant efforts should be made to ensure not only coverage but also to address quality of services.
– The number of HEWs assignment to Kebeles should be based on the number of the population at Kebele instead of the current trend.
– The issue of increased work load on HEWs should be revised or the number of HEWs per Health Postneeds to be increased.
– An off-set mechanism to replace HEWs leaving their job permanently should be implemented sooner in all regions. A few regions were able to replace resigning HEWs by graduating more HEWs. The FMOH should put forward similar solution at the national level to mitigate this challenge.
– Intervention should take place to strengthening the skill of HEWs, particularly through the IRT training. The IRT was appraised by most key-informants interviewed though one weakness of IRT was reported to be use of out-dated data.

Page | 54
3. R E S O U R C E M O B I L I Z A T I O N & u t i l i z a t i o n
In Ethiopia, the total health expenditure has been increasing over the last decade and also the health sector's share from total government expenditure has also increased from 4% in 1990 EFY to 11.6% in 2006. As such the objective resource mobilization is to ensure availability of adequate financial resources for the implementation of health programs at various level of the health system.The increasing cost of health care and multiple competing priorities in resource poor countries makes financial resources insufficient to make substantial improvements in access and quality of health care. Hence, financial resource is a crucial input for provision of adequate and optimum quality health services. A notable accomplishment was also provision of free MNCH services across the Oromia region, particularly free caesarean section.
3.1.1. EXEMPTED & WA IVER SERVICES
Exemption and waiver polices were implemented based on the guideline in all facilities visited. Health facilities provided exempted services for family planning, ANC, delivery, EPI, TB treatment, HIV testing and treatment, and malnutrition for children under age five. An exception wasreported and Blood Film investigation for malaria was a paid service.
Most facilities implemented the waiver services. The review also showed that transfer of budget to Woredas was effected by most regions to subsidize the poor; however, timely reimbursement was not made by some Woreda administrations. As well, norimbursementwas made to most hospital or it was quite delayed. In case of unavailability of the drug or supply, those prescriptions bought out of the public facility were triggering some difficulty.
3.1.2. RETENTIO N & UT IL IZA TIO N
In 2006, almost all health facilities implemented reforms including health care financing. The results of HCF were superb by improving the service quality and public satisfaction.With regard to user fee retention, all visited health facilities collected more income than preceding year. Improved healthcare seeking behaviour, motivation and ownership of health care providers and quality of service were some of the factors for increased fees generated. The generated fee was mostly invested for procurement of equipment, drug and supplies, and renovation of facilities.

Page | 55
3.1.3. CO MMUNITY -BA SED HEA LTH I NSURA NCE
The Ethiopian Health Insurance Agency /EHIA/ was established in 2003. The agency was mandated to run two important projects: Community Based Health Insurance /CBHI/ and Social Health Insurance /SHI/. The agency carried out multiple activities which were basic to the foundation of the service. It is natural that such projects planned at a national level require an extended time period to be effected. As such, the agency was able to open 20 branches (of the 24 branches required nationally) and recruitment of staff was completed for most in 2006 EFY. No branches are yet opened in Afar, Gambella and Beninshangul Gumuz.
The CBHI has been piloted in four regions with 160 Woredas enrolled. Enrolment to the schemes is based on registration of members in a community which ranges from 40 % to 90% and is highly dependent on the Kebele leaders’ active involvement.The pilot phase has completed its third year of implementation. The CBHI had appreciable community acceptance as well evidences of satisfaction were observed among beneficiaries that could facilitate scaling up. Moreover, evaluations were carried out in collaboration with international experts but results not yet published.
In 2006, pilot Woredas were increased to 35 in Amhara region where the project was acclaimed to be effective and the enrolment reached of 52.5%. In Amhara region, the scheme has been supported by regional proclamation and directives.There were also a few more pilot Woredas in SNNP (8 Woredas) and Oromia but the activities were relatively low.This scheme was not fully implemented in some regions because members registered for the scheme were below 30%, the required minimum to commence the project in a Woreda.
Other prominent activities include promotion of the insurance schemes through community forums, panel discussions and mass media; and also provision of training at various levels of the health-tier system. The agency was working in collaboration with countries believed to have passed through similar scenario in achieving a reputable practice such as South Korea and Ghana.
3.1.4. SO CIA L HEA LTH INSURA NCE
A number of factors were involved that delayed the kick off for this project; particularly defining benefit packages for the scheme took the largest share. This scheme is basically intended for public facilities, but the benefit packages also arranged inclusions for transfers to private facilities.The SHI directive was approved through the parliament. Preparations of drug list and procedure listshowed a progress to about 52% and the preparation applied experiences from modern insurance schemes and also WHO standards.Operational, contractual manuals are almost completed. Identification of candidates, gathering information and profiles of employees, and recruitments of members in the government sector was on track in various regions.
Page | 56
3.1.5. CHA LLENGES
Delay in reimbursement was a universal issue mentioned in almost all facilities, but the challenge waselevated in the case of hospitals.
Poor functioning structure particularly at lower level and lack of ownership by the respected administrative bodies delayed the progress of CBHI.
The whole process in progress but it takes an ever slow process for results
to turn out. Convincing the community was one of the main challenges since it is unpredictable.

Page | 57
4. I m p r o v e d q u a l i t y o f h e a l t h s e r v i c e s
The overall quality of services in each facilities showed progress compared to the EFY 2005. However, there was a wide disparity among facilities and also among regions as measured by performance indicators included in the assessment tool. In most cases, health facilities achieved their targets and access and utilization of services were increased.The progress in key maternal, neonatal, child and health indicators was significant, yet progress remains slow for skilled delivery in most sites where the review was conducted. Regional as well as facility variations wereremarked throughout in terms of accomplishments.
In general, achievements in health service delivery were credited to efforts made to improve community participation and ownership through establishment of HDA, health worker’s commitment, improved planning process, resource mobilization and appropriate allocation. In addition, implementation of reforms; improved pharmaceutical supply;in-service training and performance based recognition; deployment of BSC score card;24/7 accessibility of facilities enriched by ambulance services and referral linkage;conducting continuous client satisfaction and service quality survey;practicality of health care financing /HCF/ and use of income for quality improvement;and effecting maternal death review were among the factors that played further roles.
In the facility reform process, new initiativeshave also been instigated by the FMOH in 2006 EFY. Emergency referral scheme, auditable pharmaceutical transaction and services /ATPS/, and Hospital Alliance for Quality were among a few. In addition, capacity building for EPHI is underway so that EPHI will be enabled to provide services on selected and/or advanced laboratory investigations. In the reform process, one of the remarkable performance observed in 2006 EFY was implementation of the emergency referral initiative which ascertained predetermined, predestined referrals for emergency situations backed by a directive that enforces practicality.
4.1. R E FE R R A L S YS T E M
In 2006, reforms within facilities have been progressing, the referral system being one of the focuses. Optimizing utilization of health care facilities; improving accessibility of care according to need; assurance to continuity and quality care; rationalizing costs; and bolstering communication among health facilities were among concepts incorporated in the reform strategy towards improving referrals.
The referral system, particularly in the case of emergency, lacked accountabilityand patients/relatives didn’t know their destiny when they leave the referring facility. As a result of which most suffered the consequences

Page | 58
while seeking care for treatment. In the worst scenario, life threatening and urgent situations cost the lives of many while looking for available beds in multiple hospitals. The core issue with this loose system was that patients were referred from one facility to the other with a small piece of paper stating “to any hospital”. In short, it was not predetermined.
Considering the magnitude of the problem, the FMOH instigated a new approach for emergency referral in 2006. This new initiative, as part of the hospital reform, has been implemented in public hospitals Addis Ababa. Through this scheme, all referral should be destined to a specific facility; assessment for availability of bed and specific services should be communicated prior to referrals; arrangements should be done with the receiving facility; and patients with life threatening conditions should be escorted by a team from the referring facility. Otherwise, all will be responsibility of the facility, the one with the patient at hand, to offer the services sought by the patient.
In line with this, all public facilities in Addis Ababa were mapped and health center–to-hospital as well as hospital-to-hospital referral network was established. Reportedly, the initiative was a success since no complaints, similar to situations of the conventional referral, were put forward by communities. Consistent with this was a directive released by FMHACA that makes these tasks compulsory in all facilities. The enforcement is also strengthened by monitoring, executed by a monitoring team that pay a quick visit to facilities using a predetermined schedule as well unannounced surprise visits.
Nationally, the most common reasons for referral in EFY 2006 were antenatal care and associated illnesses or danger signs, mother to child transmission of HIV, labour and delivery, illness including urinary tract infection, and case suspects for Tuberculosis.Abortion/Post abortion services and HIV treatment were not provided in few Health Centres while others offer the services; complaints were forwarded in some communities as wellopposing the referral.
4.2. N A TI O N A L B LO O D B A NK
The National blood bank aimed to provide blood without replacement for the needy patients free of charge. The initial plan was collection 150,000 units of blood exclusively from volunteers in Addis Ababa and the regions. By the end of 2006 EFY, 90,000 and 60, 000 units of blood were collected from Addis Ababa and the regions respectively. The main strategic measure taken to collect blood from volunteers was organization of civil service networks using case teams to raise community awareness for voluntary blood donation.
Various promotion activities were conducted through mass-media including television and private and public newspapers; as well as other printed materials including Leaflets and posters. The campaign also employed use of

Page | 59
social media such as face book and twitter also had powerful persuasive effect. In addition, pictures and video of locally renowned prominent personalities as well celebrities, while donating blood, were posted on these Social Medias. Political leaders and artists were part of the campaign and also committed to donate blood.
Workshop was organized for media staff entitled “The role of media in donating blood”. As such, The National Blood Bank created awareness and increased the number of volunteers in more than 300 institutions embracing schools, churches, Embassies, Mosque, NGOs. The principal logo applied stated, “No women should die due to lack of blood” which was considered sensitive by most youth and women in lifting up number of volunteers.
Upon screening, the following infections weremonitored: HIV, Hepatitis B, Hepatitis C and syphilis. After the screening process, safe and clean blood was distributed to facilities. Most facilities were equipped with mini blood banks for temporary storage which were refilled regularly or when they are run out of blood. In most instances, Black Lion Specialized Hospital was the major consumer, utilizing about 40% of the donated blood.
The national blood bank was working closely with public hospitals to iron out prominent issues and utilize available resources efficiently. Training was provided to professionals on blood transfusion service and relevant protocols. As such, the distribution of blood was based on agreements signed with facilities: each unit of blood should be delivered free of charge; an MoU should be signed withfacilities on the proper utilization of blood; asserting responsibility and accountability in using the donated blood; and close collaboration to fill gaps in assuring the availability of blood type “O”.
In 2006, the expansion of regional Blood Banks showed a notable progress to act in accordance with the national roadmap which was set to establish at least one blood bank within 150-200 km radius. The number of Blood Banks around the country has doubled in this fiscal year, i.e. a total of 24 functional Blood Banks became operational. In 2006 EFY alone 8 blood banks were launched.At a regional level, construction of additional blood banks was planned, 11 more expected.
The national Blood Bank envisioned to enhance services for the year ahead by introducing modern technologies, new approaches for collection and also equitable distribution mechanisms to reach out and address distance problems. In the future, focus will also be given to quality of services and preparations were underway for quality assertion via internal quality assurance. The ultimately aim is towards regional accreditation, particularly from African Society of Blood Transfusion.
Page | 60
4.3. L E S S O NS LE A R NE D
– The guidelines and standards of the hospital reform sets clear indicators and show how to measure it. This has simplified to understand the expectation from different level of service providers and move forward to action.
– Improved governance of health facilities contributed for improved service and quality of care. Besides, resource mobilization and working with partners enabled facilities to tap technical and financial support. Lalibela primary Hospital was a good example and was able to mobilized 240,000 ETB.
– In most facilities, available equipment were functional and equipment maintenance is available for hospitals through recently deployed biomedical technicians.
– Some Health centres were able to conduct periodic client satisfaction survey to improve services. A good practice to replicate in other facilities.
– Hospital clustering, through various forums, for experience sharing as well to provide support for health centers was a good exercise observed in the case of DebreMarkos and Lalibela hospitals.
– In 2005, 30% was received from volunteers whereas raised to 82% in 2006.88,000 (70%) unit of blood collected in 2006, all from volunteers. This was a good indicator that signifies and underwrites the prospect of collecting all the required blood from volunteers.Plan to collect 160,000 units of blood exclusively (100%) from volunteers.
– Blood collection increased compared to preceding year where 44,000 units collected at the national level but 32,000 units in 2005.Blood discard rate dropped from 16% (2005) to 9% (2006).HIV prevalence declined among blood donor population.
– In 2006, 6,979 units of blood was collected (75% from voluntary); 6,447 (>92%) units of safe blood was distributed; 33% was used for management of PPH in Tigray region.
– All blood banks serve 24/7 to distribute blood to hospitals. In the absence of blood banks they use temporary storages, mini Blood Banks, at hospitals.
– Both Static and outreach strategies are implemented to collect blood from voluntaries, ensuring full stock at blood bank and hospital levels. Woredas have also started to mobilize voluntaries in Tigray.
– Regional blood banks are automatically mapped to a network of facilities to serving a catchment area under their vicinity. For instance, additional blood bank was established in Axum which was mapped to hospitals in central, western, and north-western zones. The rest are mapped to Mekele blood bank.

Page | 61
– Quantification and forecasting of laboratory reagents and inputs are being practiced in most hospitals. Besides, capacity building for EPHI is underway to provide services on selected and advanced laboratory investigations for public facilities.
– As part of the implementation of auditable pharmaceutical transaction and services (APTS), an automation of APTS was implemented in one hospital where manual work was automated to electronic forms. This practice is expected to be replicated at national level.
– Chronic care management is effected through software automation, called SmartCare, installed in some hospitals in Amhara.
4.4. C H A L LE N GE S
– Challenges in health facilities include shortage of duty payment for staff; lack of critical supplies such as reagents; blood, access to safe water supply and power; shortage of basic equipment for BEMONC such as vacuum extractor, radiant heater, suction machine, MVA; and Interruption of FP supplies (injectable).
– Similarly, unavailability of services most notably PMTCT, Abortion/Post abortion care, and lack of training in the above mentioned services were also mentioned as a challenge in a few facilities.
– A few respondents (Woredas/zonal) objected the organizational structure and also infrastructure made available as inadequate to perform a contemporary health service. Key informants in the community also added the facility setup is not compatible with the services prompted to customers.
– Lack of safe water supply and electricity were problems in some facilities whereas interruption of electricity is a major issue in most facilities.
– Equipment maintenance is not easily accessible in case of machine failure for health centres.
– With regard to blood donation, low awareness of within community to volunteer for donation; scarcity of skilled man power on this field; interruption of supplies (test kits and consumables);and ambiguity of institutional structure, for national blood bank, put forward by civil service were mentioned as core challenges.
– In addition, meeting special needs as in Type A and O (Negative) blood;lacks of temporary storage at hospitals werealso among challenges.
– Some hospitals are located far from the Blood banks, in some cases greater than 400 Km, enduring low access to the service.
Page | 62
– Inadequacy of ambulance (related accessories with required inputs) corresponding to the current demand is a concern in some regions due to small budget.
– More than 70,000 ambulance transport services were provided in the region where 64% were related to maternal delivery.
4.5. R E C O M ME N DA TI O NS
– Align completion of health facilities construction with resumption of health services.
– Improving hygiene and sanitation status of health facilities.
– Issuance of ambulance management directives is crucial.

Page | 63
5. I M P R O V E D P H A R M A C E U T I C A L S E R V I C E S
In 2006 EFY, drugs and medical supplies worse ETB 11 billion were distributed to health facilities countrywide. About ETB 7 billion was disbursed for drugs and medical supplies which were procured through Pharmaceuticals Fund and Supply Agency /PFSA/, the remaining was acquired through donations. In the context of promoting local production of pharmaceuticals, PFSA procured from local manufacturers with package of incentives without compromising quality.
Thus far, PFSA was the main supplier of drugs and commodities to public health facilities in Ethiopia. In 2006, PFSA runs 11 functional regional hubs.In order to avoid delays in the distribution and enhance the storage capacity, PFSA also constructed new warehouses in different regions of the country including Shire, Asosa, Semera, Gambella, Arbaminch, Kebridahar.
PFSA had a plan to automate drug information system which enables the agency to control regional warehouses from Addis Ababa. As such, the agency has been attempting towards ensuring sustainable supply chain system by implementing Integrated Pharmaceuticals Logistics System (IPLS). In this respect, PFSA was implementing both electronic and paper-based Logistic Management Information Systems (LMIS) at different levels in a phased approach.
5.1. S U PP L Y C H AI N C YC L E
In 2006, the demand for procurement of health commodities was increased. Key factors involved were expansion of public health facilities in all areas; increased health seeking behaviour by community; improved budget availability due to income generating activities /HCF/. Health facilitiesboards allowed about 80% of the HCF fund acquired for such procurement.
In general, the supply chain cycle hadsignificantly improved, compared to previous years, accommodating the huge demands for health commodities. As well complaints from health facilities pertaining shortage of drugs was significantly reduced compared with previous years. Nevertheless, a few challenges still persisted among which interruption of supplies and narrow scope to accommodate needs were the most frequently mentioned critiques during the review.However, PFSA disregards complaints of facilities and underlined weakness RHBs which overlooked the process of quantification.
Along the supply chain cycle (forecasting, procurement, storage, distribution and use), forecasting/ quantification was found to be the weakest link due to limited capacity and poor information system.

Page | 64
5.2. D R U G T HE RA PE U TI C C O M MI TTE E
Routine quantification of program commodities was done centrally, as such PFSA and RHBs had no role. On the other hand, annual quantification and estimation of essential medicine were done by health facilities on consumption bases. Here, the responsibility of the Drug Therapeutic Committee /DTC/ wasto selectessential drug list depending on facility’s capacity, guide drug quantification and procurement process. Facilities that have a well functioning DTC were found to quantify their drug requirement as per the standard.It was indicated that there was a gap in consumption data generation in some facilities and DTC has the responsibility of resolving this problem.
In some facilities, stock out reports of HIV- Test kits and relevant drugswerenoted up on field observation. PFSA identified such type of drugs and injected additional budget from recurrent alongside the dedicated program budget. To avoid frequent shortage of drugs and ensure sustainable stock for future, PFSA has been working to develop a plan with different option targeted to the service delivery modality and utilization rate. Besides, PFSA planned to make a two year framework contract with domestic and international suppliers with good track record to avoid delays in equipment and medical supplies procurement.
In 2006, Revolving Drug Fund managed around ETB 2 billion and a promising practice was noted by utilizing the revolving fundfor procurement of essential drug which also makes it very predictable. Tigray, Amhara and Oromia were cited as good examples in RDF exercise. The OromiaRHB allocated ETB 180,000 each for 1,315 health institutions in the region from its recurrent budget to procure drugs and medical supplies in a demand pooled system. This method is cost effective and need to be replicated elsewhere in the country.
5.3. L E S S O NS LE A R NE D
– PFSA decided to review its organizational structure particularly to respond to the delay in auditing medico-legal issues and corruption. PFSA has commissioned the study of manpower structure to Ethiopian Management Institute.
– The collaboration between PFSA and RHB increased the efficiency of and timely distribution of supplies to health facilities, especially where there was transport problem.
– Supply management has improved and both paper-based (bin cards) and IPLS were applied in most health centers visited.
– In most cases, requirementswere forecasted using HMIS (patient flow and morbidity pattern).

Page | 65
– Similarly, drugs were categorized on the basis of VEN analysis in health centers and regular availability of tracer medicines was closely monitored. Training on IPLS was provided.
– Adequate equipment wereavailable for cold chain management and quality was ensured using refrigerator tags in visited health facilities in Amhara. A good practice to replicate across facilities.
– The storage hubs visited were functional, with appropriate equipment (shelves, loading and unloading facilities, forklifts), proper storage of supplies, and use of updated bin cards. Similarly, most facilities implemented appropriate storages for drugs and supplies.
– Appropriate inventory tools including bin cards, stock-cards, requisition and reporting form, receiving and issuing vouchers, dispensed medicine registration book were properly utilized in the health centers. Automation software was also used as inventory tool in some hospitals.
– Functional Drug and Therapeutics Committees were found in most visited sites. Levels of performances of the DTCs were not consistent across facilities. Wide variations noticed.
– The amount of Revolving Drug Fund of health centers and Hospitals had been increased. In Tigray, the amount increased to ETB 400 Million in 2006.
– In most facilities visited, improved availability of essential medicine was observed, estimated at about 80% in some facilities (availability at PFSA was 65%). In addition, renovation tasks and provision of free IMNCI and MNCH services were funded via RDF.
– Oromiya RHB reached a deal with PFSA to use a demand pooled approach to procure supplies for more than 1315 health facilities through preinstalled lump sum money. A cost effective approach to be replicated elsewhere in the country.
– The importance of preparations for emergency response was considered crucial and PFSA undertook the necessary preparations including allocation ofvehicles stationed at branches and used for emergency distribution purpose.
5.4. C H A L LE N GE S
– The interruption of supplies and narrow scope of PFSA to accommodate needs were among the challenges that persisted since a few years and also the most frequently mentioned critiques during the review.
– The quantification and forecasting exercise was conducted centrally without consulting RHBs. As a result of which a demand versus supply mismatch occurred, ultimately led to shortages in some facilities. The

Page | 66
significant shortage of family planning methods reported by Addis Ababa RHB was a good example.
– A few facilities also reported inconveniences in receiving supplies and commodities timely, especially laboratory reagents,equipment, Tetracycline eye ointment, iron with folic acid and magnesium sulphate. The review ascertained some facilities were not conducting tests due to lack of items required for RPR/VDRL screening for syphilis.
– At times, drugs and supplies with short shelf-life were distributed which played a significant role for unnecessary wastage of drugs.
– Under the normal circumstance, facilities are expected to send their requirements promptly; however, delays were noticed in some settings. For instance, delays were reported by PFSA for hospitals in Tigray region which did not submit their requirement timely.
– Forecasting/ quantification was found to be the weakest link in the SCC.Underlying factors being limited capacity of quantification on top of the poor information system.
– Patient education on rational use of medicine was given in most health facilities visited. In most facilities, standard protocol and treatment guidelines were either inadequate in quantity or totally absent.
– Topographic problem coupled with lack of infrastructure in some areas slowed the distribution process.
– Domestic shortage of required supplies and lengthy and time consuming procurement procedures were also reported by some facilities.
– Levels of performances of the DTCs were not consistent across facilities. Wide variations noticed.It was indicated that there was a gap in consumption data generation in some facilities and DTCs didn’t act timely to resolve theissue.
5.5. R E C O M ME N DA TI O NS
– RHBs and WoHOshould also be involved in the quantification process rather than the approval of submission to PFSA.
– With regard to refrigerators, availing in adequate number; improving maintenance capacity; provision of adequate training; and strict monitoring at all levels was suggested as a lasting solution.
– Encourage domestic producers by offering advance payment and facilitate remaining payout from local development banks guaranteed through the PFSA itself.
– Develop alternative plans to sustainably avail frequently out of stock drugs.
– Assess the establishment of Drug Therapeutic Committee, identify good practices and develop strategy for skill transfer.

Page | 67
– Strengthen capacity of quantification process and also the information system.
– Create mechanism for seamless integration between program with PFSA or logistic system.
– Implement a dashboard system which enables PFSA experts at the main hub to monitor stocks at health facilities in each region.
– Establish bonded warehouse where Ethiopian Airlines, PFSA and FMHACA would work together in harmony.
– The use of a demand pooled approach for procurement of commodities was commended as cost effective approach.
– The RHBs should be involved in the forecasting/quantification process.

Page | 68
6. I m p r o v e d r e g u l a t o r y s y s t e m
The Food, Medicine and Health Care Administration and Control Authority /FMHACA/, in recognition to the health sector reform in Ethiopia, was provided with a mandate to regulate Practice, Premises, Professionals and Products, also called the 4Ps. All these regulatory activities were decentralized and functional in all regions and Woredas around the country. The activities carried out include regulatory standards setting, inspection and licensing, product quality assessment registration, regulatory information delivery, and medico legal processes.
In EFY 2006, the following activities were carried out at federal and regional levels: new registrationwith provision oflicenses and renewalof existing licenses for health professionals; conduct inspection in health facilities and health related facilities; strengthen inspection of illegaltrade of food items and drugs; reinforce health and health related quality of service; strengthenquality control system;build-up technical capacity of local factories; carry outpre- and post-market assessment on fooditems and drugs; conduct supportive supervision to drug and food factories; and capacitate health facilities to improve quality of health service delivery.In addition, provision of the necessary vaccines for about 52, 000 international travellers were carried out.
An online version of the HRIS system was released through FMHACA website with the aim of ensuring professional and ethical competency of health professionals and also to make it easily available for the public use. AS such, users were capable of viewing the level of certification and legal status of individual health care providers. The data showed the level of competency, renewal, suspension, or revocation of individual health professionals in the country. Low performance was noted due to deficient data entry and subsequent update of the HRIS database by region/Woreda. Similarly, a database project is also plannedwhere the public can access licensed foods, drugs and other products registered. The project is on the pipeline at a cost of ETB 20 million.
6.1. I NS PE C TI O N A N D Q U A LI TY AS S U RA NC E
Food and drug industries were inspected including 12 pharmaceutical industries manufacturing various products locally. FMAHACA provided capacity building to boost their manufacturing capacity upholding quality of products. Gap assessment was conducted in health facilities and support was given to 25 hospitals. The support was also delivered to private facilities.This helps to build their capacity prior to inspection instead of the routine license revoking practice. In addition, evaluation of specialized hospitals was planned in 2006 EFY but was not completed.
With regard to imports, screening of products and quality control tests were conducted to ensure safety of items before entry. The request to import some products including food, drugcosmetics, and others wasdenied. In 2006 alone,

Page | 69
import of food and drug items, worse ETB 12 million, were denied entry and send back during a port clearance. Majority were drug items that do not fulfil standards and mostly smuggled illegally crossing the borders.The FMHACA laboratory was certified by ACLAS, an international certification given to quality inspection laboratories. About seven tests were accredited. This accreditation was maintained in 2006.
6.2. T O BAC C O C O N T RO L
In 2006, The Ethiopian government ratified WHO’s framework convention on tobacco control. The convention aims to protect the public from the devastating health, social, environmental and economic consequences of tobacco consumption and exposure to tobacco smoke. Theconvention was endorsed by The House of Peoples Representative of the FDRE. FMHACA was empowered to undertake all acts necessary for the implementation of the convention and rules that govern hazard demand and supply reduction of tobacco use.
6.3. C H A L LE N GE S
– The capacity in terms of skilled man power required was weak which makes it difficult to inspect and identify technology assisted counterfeit products. Regional level human resource was also minimal.
– The evaluation of specialized hospitals was planned in 2006 EFY but was not completed. FMHACA used standard tools of evaluation but the capacity of specified hospitals is much lower than the average. There are a few specialized hospitals around the country and the tools appear inappropriate compared to the capacity of these hospitals. Here, either tools should be customized or hospitals should be capacitated to fulfil requirements for appraisal.
– FMHACA worked in collaboration with the respective regional RHBs but do not have the mandate to act within the borders of the regional states in response to malpractices or in situations where problems are reported. Further, information is communicated by FMHACA to the regions but their response for an action is limited and lacks swiftness.
– The authority needs to have many SOPs in order to create a smooth work flow. However, the absence of SOPs has become a major challenge.
– Financial resources are allocated at adequate amount but there were hurdles that made it difficult for utilization. Lengthy bidding process was one issue mentioned.

Page | 70
– Collaboration with ERCA is set to work in harmony but not significant, particularly for inspection of items during the import process.
– Inspection of public facilities has been a problem.
– Low performance was noted in the level data entry and also subsequent update of the HRIS database by regional/Woreda.

Page | 71
7. E v i d e n c e b a s e d p l a n n i n g
All visited Bureaus and health facilities had plans prepared for EFY 2006 as well as 2007.The planning process, in 2006, was relatively better in contextualizing and bottleneck analysis compared previous year.The planning activity was accomplished through the annual WoredaBased Plan /WBP/ process with involvement of relevant stakeholders. Adequate training and support was provided before and during the planning process.
Woreda based plan has been participatory and cascaded at different level. At Zonal level Woreda health offices and partners were engaged and at the Woreda level staffs from health centers and health post were involved. At health center level the planning process also involves Health care providers, the HEW, the community representative and in few cases HDA representatives. Staffs were sensitized on the agreed plan and the Zonal plan and targets were further dissected to Woreda and facility level.
A regular and pre-scheduled quarterly supportive supervision and review meeting at Woreda and Zonal level was conducted. Written feedback of the supervision was also provided. Besides, a yearly review meeting and supportive supervision from the region was provided for some facilities.
The Woreda and Zonal offices provide supportive supervision and conduct periodic monitoring, evaluation. Selected awards were also given which improved operations and contributed for better performance. The management at Woreda, Zone and region level conducted periodic assessments and ISS. Based on the identified gaps they also provide capacity building training and on-job recommendations.
7.1. H E A L T H M A N A G E M E N T I N F O R M A T I O N S Y S T E M
The Health Management Information System /HMIS/ was one of the major initiatives implemented since EFY 2000 (but scaled up during the HSDP III) with the aim to ensure information availability for evidence-based health planning and decision making.
The HMIS, which draws its data from routine service and administrative records, provides an ideal source for indicators.Every effort was made during the initial development of indicators (HMIS v.1) to ensure relevance to most situations and illustrate a comprehensive view of the health sector. Since 2010, Ethiopian health system possessed 108 core indicators. These indicators were selected based on a review of country and program priorities and experiences in monitoring and evaluation.
The HMIS was fully scaled-up countrywide and the implementation of all those indicators was monitored for about 5 years. However, in 2005 a revision was found to be imperative following recommendations of the Mid-Term Review of

Page | 72
the HSDP IV. Underlying factors of the review were implementation of the strategic plan of HSDP IV,adjustments required in the reporting frequency, emergence of new initiatives and programs, focus on quality health services, and also to challenges and limitations in the use of HMIS.
The revision process encompassed four technical areas: indicators, disease classification, recording and reporting procedures and also information use guidelines and display tools. The revision was a consultative process through several discussions with managers and program officers at different levels.The selection of HMIS indicators was guided by national monitoring & Evaluation Framework, HSDPIV strategic objectives, the new GTP initiative and also international requirements for reporting (MDGs, UNGASS, WHO, Global Fund).
In HMIS v.2, the total number of indicators was increased to 118. Besides, modifications on frequency of data collection and reporting were made: monthly (68), quarterly (35), and annually (15).From the old list of HMIS indicators: about 46 indicators were eliminated; and 22 were modified or merged with other indicators; and 56new indicators were added. With regard to instruments, tools and materials: 23 registers and logbook (by type);14 tally sheets and corresponding guidelines, training and procedure manuals were printed and distributed to facilities.
Trainingwas provided to facilities based on the revised HMIS.ATOTwasprovided to HIT and HMIS officers from Woreda and facilities which was cascaded to staffs at the facility level.In addition, registers were distributed and used at facility level whereas reporting formats distribution was not started.As to the ownership, regions wereproviding support to facilities and facilitating the printing of tally sheets and other materials required. Some facilities were also using trying to fill gaps from their HCF revenue. However, it was difficult to say it was fully owned because of shortage of budget.The community health information system was implemented in visited health posts in Tigray. All visited health posts had the required data and information posted on the wall. The information was updated for EFY 2006.
7.2. E l e c t r o n i c I n f o r m a t i o n S y s t e m s
eHMIS have been implemented and helped much to improve the analysis, timeliness and quality of report. For instance in North Wollo, HMIS was utilized in 2 Hospitals, 34 Health centers, 12 Woredas and also atZonal office but it was not updated as per the revised version of HMIS.FMOH was also utilizing automation to measure performance through MNCH results, called MNCH score Card.

Page | 73
7.3. L E S S O N S L E A R N E D
– Respondent stated that the health sector planning was considered as model which can also be shared with other sectors as well. The planning process was also claimed to help Woreda staff for capacity building and alignment of plans.
– Vital registrations assessment was done by BOFED but result not disseminated yet. Implementation plan through the HEWs will be a difficult task as it will compromise the quality of service and also increase the workload.
– All interviewed Health care providers believed the revised HMIS encompassed relatively better features: decreased unnecessary and extra registers; reduced workload related to parallel reporting (for partners as well programs); and also addressed new and emerging public health issues like MDR TB.
– HMIS v.1 report completeness and timeliness was improved in 2006 EFY. At all visited facilities reporting was timely and complete. All visited facilities and offices reported 100% achievement for data quality indicators.
– LQAS was practiced at health center and hospital level. Findings were used to identify challenges and set action points to improve recording and reporting.
– The Zonal and Woreda administration also recognize excellent performing health care providers.
– Information from the HMIS was used in planning and target setting process; forecasting health commodity requirements; budget allocation; service quality improvement; and identification disease pattern for appropriate intervention. In addition it wasalso used as information to identify and motivate health care providers.
– Some regions were undertaking preparations to implement a mobile health (mHealth) application for all Health Posts. The mHealth application is a server based reporting system that uses touch-tone telephones for reporting.
– eHMIS was used by most sites visited; SmartCare (Electronic medical recording) was implemented in some hospitals visited in Amhara.
7.4. C H A L L E N G E S
– No legislative framework and national HIS strategy being implemented in
Tigray region.
– No reporting format was provided. In addition, some facilities reported that registers wereinadequatein quantity. Critical shortage of HMIS supplywas commented by most respondents.

Page | 74
– Talley sheets were not distributed (during the review) but the facilities were using soft copies and printing using available resources.Lack of budget for printing was a constraint.
– HRIS was integrated with the electronic HMIS system. However, no other automation systems in place.
– Lack of supply and/or interruption of power and telephone line accessibility have affected the use of electronic automations in most facilities.
– Pertaining to the performance of Addis Ababa, statistical figures of HMIS were not congruent with findings captured from recent studies. Also data collected from few other sites visited showed similar discrepancy. These inconsistencies should be studied further.

Page | 75
9. h u m a n c a p i t a l a n d l e a d e r s h i p
The focus in EFY 2006 was on:pre-service training, especially for those where critical shortage was noticed; increase uptake capability considering demand; increase quality of education and put emphasis onskill of graduates; improve quality through curriculum review, provision of equipment and books; and encouraging students to focus on practicum.The following were new initiatives as part of EFY 2006 activities: Diploma level (TVET level 3) HEWs and Emergency Ambulance Technician (EAT).HITs; Midwifes; and BSC level Anaesthesia experts and New Medical Education were continued from programme started in 2005.
9.1. P R E - S E R V I C E T R A I N I N G
H e a l t h E x t e n s i o n W o r k e r s
A roadmap is set by the FMOH to solve the Carrier issue raised by HEWs. Besides, a career upgrade scheme is established for HEWs which builds up in a step-by-step fashion. They can promote to a Community Nurse level; then to a Family Nurse and finally to a Family Physicianlevel.Upgrading to Community Nurse has been started in some places.Currently, the upgrading has scheme has produced a few graduates in Tigray region: the first batch graduated in Community Nurse.Tigray graduated Family Nurses upgraded from HEW for the first time
Uptake of HEWs has been increased as an off-set approach to tackle attrition which is around 5% (no evidence).The uptake increased from 2000 in 2005 to up to 5000 in 2006. Hence, replacement is in place. In fact, this is beyond replacement rather flooding.
E m e r g e n c y A m b u l a n c e T e c h n i c i a n
This a new initiative with an upgrade scheme from lower TVET level to level 3 with one year schooling. The numbers of colleges enrolling such candidates were increased from 3 to 7 in 2006.
B i o m e d i c a l T e c h n i c i a n s ( D i p l o m a )
This training was scheduled to be started in 2006. However, only recruitment of potential students has been accomplished in 2006 EFY. The students are expected to be enrolled in two colleges: Addis Ababa and DebreMarkos.

Page | 76
H e a l t h I n f o r m a t i o n T e c h n i c i a n s
This program was started three years ago. Now, many TVET colleges, in almost all regions except: Afar, BeninShangul Gumuz and Gambellawere able to accommodate students to teach and yield graduates in HIT course in a three year program.
M i d w i f e r y
The demand Midwifes is still high. Besides, the FMOH has endorsed the plan to appoint two Midwifes per Health Center.Three different programs were run to produce midwifes:Generic BSc (four year program); Upgrade (one year program from BSc Nursing); and the Accelerated Midwife program.
In particular, the upgrade scheme solved a lot more issues in parallel. Ethiopia’s Nurse: to population ratio surpassed the WHO standard and there has been an increased unemployment of Clinical Nurses because of saturation and low demand.Whereas, the upgrading scheme for Midwifery contributed by absorbing those Nurses and reducing the unemployment. Since Nurses were trained most during their three years study, the upgrade added a one year additional course in the promotion to a Midwife certification.47 colleges and universities run the midwife program.
Concurrently, in 2006, a total of 3, 850 Midwifes graduated from all three schemes: 1250 from upgrading scheme; 1,600 from accelerated; and 1000 from generic Midwifery. The plan was to produce 4,600 graduates, whereas performance was 98%. Starting 2007, the number will increase up to 3000 per annum. For the same period, Midwife to Population ratio has improved from 1: 5000 compared to preceding year where the ratio was 1:10,000.
I n t e r m e d i a t e E m e r g e n c y S u r g i c a l O f f i c e r
These experts are upgrading from HO/ BSc to MSc level in a three year program. Graduates are expected to perform all emergency operations in Gynaecology, Obstetrics and Surgery.
N e w M e d i c a l E d u c a t i o n
Program started in 13 Universities throughout the country. The number of graduates in the first batch were 1000; second batch 900; and third batch 490. Uptake has decreasedsince the launching of this initiative three years ago. Underlying factors were low capacity of universities to accommodate more numbers; and deficiency of books, skill labs and telemedicine/tele-education equipment. Proposed solutions include procurement of materials which are already ordered; but it delayed because it was executed through an international bidding process. The required infrastructure in the universities is expected to be completed through MOE. The human resource gap is currently

Page | 77
filled through expatriates, and volunteers. But this remedy is neither sufficient nor sustainable.
Quality is still a huge concern. Hence, expansion of public hospitals that providing practicum; improving capacity of universities to have their own hospitals;andhiring more staffs by increasing the number of specialists through expansion of residency programs were proposed solutions being executed.
9.2. L E S S O N S L E A R N E D
– It is believed about 70-75% of health professional requirement of the region was met. Above and beyond, there was also an effort to hire the remaining health professionals. Efforts were also made to employ midwives through the upgrade scheme.
– With regard to staffing of health facilities, remarkable improvement is noted as a result of new deployments, enhancing competency of health workers through capacity building activities particularly in BemONC, CemONC, IMNCI and SAM trainings.
– At the HP level, all HEWs agreed that the IRT training was very important to increase their knowledge and skills.
– In most facilities, the staffs are motivated with a great work spirit and also healthy competitions. Underlying factors for this were civil service reform, improved facility leadership and management; and stepped-up communication among staffs and also with management; and recognition and motivation of staffs for high performance.
– Regular evaluation of health profession on the basis of BSC plan and motivation plan to honour the staff on the basis of their performance was a good practice in some setups.
– In addition, arrangement of special motivations such as acknowledgement and scholarships grants for best performance; encouragement of female practitioners; and also transparency and accountability during recruitment and career were also mentioned as affirmative actions towards retention of staffs.
– All visited health facilities have key health workers including midwives and health officers.
9.3. C H A L L E N G E S
– Biomedical program is not yet started except recruiting candidates
– Procurement, importing and delivery of education materials for medical schools running the NME program is delayed.
– Twining between universities at national level has started. International twining is delayed.

Page | 78
– High attrition rate of health professionals including HEWs is affecting the quality of Health Services in some of the visited sites.
– Inadequate competency of midlevel health professionals, mainly those from private teaching institutions need to be addressed.
– However no staff trained on safe abortion and PMTCT. Among the health workforce shortage of laboratory, pharmacy and environmental health professionals has been reported across the visited sites.
– Lack of upgrading education to the next level particularly for diploma level health workers was also mentioned as restraints for motivation and improvement of service quality.
– With regard to human resource shortage of laboratory, pharmacy and environmental health professionals were mentioned as key constraint.
– Due to lack of motivation among HEWs high attrition is witnessed. For example, in last woreda only 32 HEWs are working while 52 is required. Thus according to woreda health office, only one HEW is working eight kebeles and one kebele is vacant. According to the zonal health department there is gap of 82 HEWs in the zone and about 12 kebeles are vacant. The community is demanding their service and claiming for assignment of HEWs in their respective areas.
– The FMOH implemented HRIS software, and recently released an online version of the HRIS system where users are capable of viewing the level of certification and legal status of individual health care providers. However, low performance was noted in regional/Woreda level data entry and also subsequent update of the HRIS database which was reportedly very low.
9.4. R E C O M M E N D A T I O N S
– Inadequate competency of midlevel health professionals, mainly those from private teaching institutions need to be addressed.
– Continue efforts to improve staff motivation, number and skill mix at all levels particularly laboratory, pharmacy and environmental health professionals.
– Consider options for minimising high staff turn-over particularly HEWs turnover.
– Provide trainings for health development army and health extension workers particularly on communication skill.

Page | 79
A n n e x e s
References
1. Universal access to emergency obstetric and newborn care. WHO, 2010
2. Mini Ethiopian Demographic Health Survey. Central Statistical Agency, 2014, Addis Ababa.
3. Safe Motherhood: Improving Access to Emergency Obstetric Care. WHO, 2003.
4. All Party Parliamentary Group for Population Development and Reproductive Health. Return of the population growth factor: its impact upon the millennium development goals. 2007.
5. The UN Inter-agency Group for Child Mortality Estimation (IGME), Levels and Trends in Child Mortality: Report 2012. UNICEF, New York, 2012.
6. Home visits for the newborn child: a strategy to improve survival, WHO/UNICEF WHO 2009.
7. Bang AT et al. Effect of home-based neonatal care and management of sepsis. Lancet, 1999.
8. Adhanom TDW, Witten HK, Getachew A, Seboxa T: The Epidemiology and Ecology of Health and Disease in Ethiopia 1st edition. Ababa Addis, Ethiopia: 2006:556-576.
9. Ahmed Ali. Hygiene And Environmental Health Services In Ethiopia. EJHD
10. Access to Sanitation in Ethiopia. UNICEF/WHO, JMP 2013 Update