job outlook 2012 survey - san jose state university research: job outlook 2012 national association...
TRANSCRIPT

National Association of Colleges and Employers 62 Highland Avenue • Bethlehem, PA 18017-9085 • 800/544-5272FAX: 610/868-0208 • www.naceweb.org
©Copyright November 2011 by the National Association of Colleges and Employers
NOVEMBER 2011
ReseaRch
Job Outlook 2012
Free to NACE members / $49.95 list price
NACE Research: Job Outlook 20122/National Association of Colleges and Employers
Job Outlook 2012ReseaRch
2003-04 Job Market: eMployer perspectives
Copyright 2011 by the National Association of Colleges and Employers (NACE). No part of this publication may be used, adapted, or reproduced in any manner whatsoever without the written permission of NACE. Electronic reproduction is prohibited. NACE college and employer members have the permission of NACE, copyright holder, to download and photocopy this report for internal purposes only. Photocopies must include this copyright notice.
TABlE OF CONTENTsAbOut the JOb OutlOOk 2012 Survey ................................................................4
emplOyerS prOceed With cAutiOn fOr the clASS Of 2012 ................................5 Figure 1: Job Outlook hiring projections, 2007-2012 Figure 2: Employers’ hiring expectations 2009-2012 Job Market Ratings Figure 3: Employers’ overall job market ratings Employers to Keep a Close Eye on Hiring Needs Figure 4: Employers’ plans to assess hiring needs Fall vs. spring Recruiting Figure 5: Percentage of college recruiting conducted in fall vs. spring, 2008-2012 Figure 6: On-campus recruiting plans, spring 2010 – spring 2012 Changes in Recruiting Figure 7: Changes in recruiting, 2010-2012, by percent of respondents Analysis by Industry Figure 8: Total change in hiring, by industry Figure 9: spring 2012 on-campus recruiting plans, by industry Figure 10: Job market ratings, by industry Analysis by Region Figure 11: Total change in hiring, by region Figure 12: Hiring expectations by region, by percent of respondents Figure 13: spring 2012 recruiting plans, by region
WhO’S in demAnd? ..........................................................................................14 Figure 14: Top degrees in demand, by degree level and broad category Figure 15: Top degrees in demand (bachelor’s degree level) Figure 16: Top business degrees in demand Figure 17: Top engineering degrees in demand Figure 18: Top science degrees in demand Figure 19: Top liberal arts degrees in demand Figure 20: Top communication degrees in demand Figure 21: Top degrees in demand (master’s degree level) Figure 22: Top degrees in demand (doctorate degree level) Figure 23: Top five undergraduate majors – Northeast Figure 24: Top five undergraduate majors – southeast Figure 25: Top five undergraduate majors – Midwest Figure 26: Top five undergraduate majors – West

NACE Research: Job Outlook 2012 National Association of Colleges and Employers/3
Job Outlook 2012 ReseaRch
Figure 27: Who’s hiring, by industry (bachelor’s degree level) Figure 28: Who’s hiring, by region (bachelor’s degree level) International and Associate Degree student Hiring Figure 29: International student hiring plans, 2006-2012 Figure 30: Associate degree student hiring, 2006-2012 Figure 31: International student hiring plans, by industry Figure 32: Associate degree student hiring plans, by industry Figure 33: International student hiring plans, by region Figure 34: Associate degree student hiring plans, by region
emplOyerS’ vieW Of cAndidAteS ......................................................................24 GPA screening Figure 35: screen candidates by GPA, by percent of respondents Figure 36: screen candidates by GPA, by industry Figure 37: Influence of attributes Figure 38: Employers’ hiring preferences relative to experience, by percent of respondents Figure 39: Employers’ preference for work experience, by percent of respondents Candidate skills and Qualities Figure 40: Attributes employees seek on a candidate’s resume Figure 41: Employers rate the importance of candidate skills/qualities cOmpenSAtiOn And benefitS ...........................................................................29 salary Plans Figure 42: Employers with plans to increase starting salaries to bachelor’s degree graduates Figure 43: Employers with plans to increase starting salaries, by industry Figure 44: Employers with plans to increase starting salaries, by region signing Bonuses Figure 45: Employers offering signing bonuses Figure 46: Percent of employers offering signing bonuses in 2011-12, by industry Figure 47: Percent of employers offering signing bonuses in 2011-12, by region Figure 48: Average signing bonus, by major (bachelor’s degree) Figure 49: Average signing bonus, by major (master’s degree) Benefits Figure 50: Benefits and policies, Class of 2012 vs. Classes of 2011 and 2010
Appendix ..........................................................................................................34 Respondents by Industry and size Figure 51: Respondents by industry Figure 52: Respondents by size of department/business unit Participating Organizations
NACE Research: Job Outlook 20124/National Association of Colleges and Employers
Job Outlook 2012ReseaRch
ABOUT THE JOB OUTLOOK 2012 sURVEY
The Job Outlook survey is a forecast of employers’ intentions to hire new college graduates. Each year, the National Association of Colleges and Employers (NACE) surveys its employer members about their hiring plans and other employment-related issues in order to project the job market for the current class of new college graduates and to assess a variety of conditions that may influence that market.
In prior years, NACE typically conducted a Job Outlook Fall Preview survey from late July through the end of August to gain an initial look at employers’ college hiring projections for the upcoming class. This year, however, the Job Outlook 2012 Fall Preview questionnaire was incorporated into the Job Outlook 2012 survey.
From August 3, 2011, through september 23, 2011, data was collected for the Job Outlook 2012 survey. A total of 244 surveys were returned—a 26.8 percent response rate.
Among the respondents, 13.1 percent were from the West, 23.4 percent were from the Northeast, 25 percent were from the Midwest, and 38.5 percent were from the southeast. For a list of respondents by industry and size, and a partial list of organizations that supplied data for this report, see page 34.
please note that totals throughout the report may not equal 100 percent due to rounding.
NACE expects to provide a formal update of job market information once more during the 2011-12 academic year: The Job Outlook 2012 spring Update survey (data collected in February-March) will give NACE members a final update on hiring for 2011-12 graduates. Results will be available in early April.
reSeArch:Director of strategic & Foundation Research: Edwin Koc Employment Information Manager: Andrea Koncz
NACE Research: Job Outlook 2012 National Association of Colleges and Employers/5
Job Outlook 2012 ReseaRch
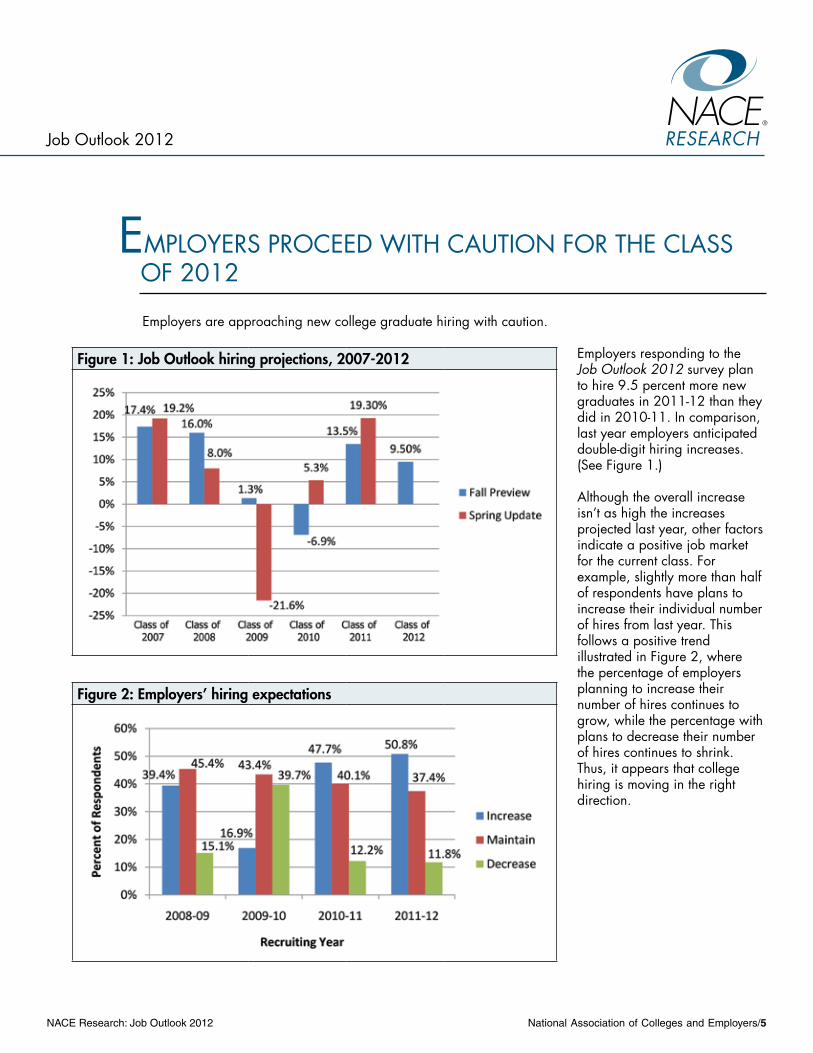
EMPlOYERs PROCEED WITH CAUTION FOR THE ClAss OF 2012
Employers are approaching new college graduate hiring with caution.
Employers responding to the Job Outlook 2012 survey plan to hire 9.5 percent more new graduates in 2011-12 than they did in 2010-11. In comparison, last year employers anticipated double-digit hiring increases. (see Figure 1.)
Although the overall increase isn’t as high the increases projected last year, other factors indicate a positive job market for the current class. For example, slightly more than half of respondents have plans to increase their individual number of hires from last year. This follows a positive trend illustrated in Figure 2, where the percentage of employers planning to increase their number of hires continues to grow, while the percentage with plans to decrease their number of hires continues to shrink. Thus, it appears that college hiring is moving in the right direction.
figure 1: Job Outlook hiring projections, 2007-2012
figure 2: employers’ hiring expectations

NACE Research: Job Outlook 20126/National Association of Colleges and Employers
Job Outlook 2012ReseaRch
Among employers with plans to increase hiring, more than half indicated that either their companies have more business or they are experiencing company growth. Another 20 percent cited the need to replace retiring workers, their aging work force, and increasing attrition rates. still others reported the need to build their pipeline of new college graduates, as some organizations explained that they are too “top heavy.”
Of employers with plans to maintain their individual hiring numbers, most cited similar business conditions and demand as last year. Others pointed to budget limits, low attrition rates, and high retention rates.
The nearly 12 percent of employers with plans to decrease their college hiring numbers indicated that they have budget concerns or no openings for new college graduates this year. When asked about the total number of positions that were available for 2010-11 graduates, 165 respondents reported a total of 24,356 positions, an average of 148 positions per organization. These same employers reported that 1,172 positions available to new college graduates went unfilled in 2010-11. This averages out to slightly more than seven unfilled positions per organization. Nearly two-thirds of respondents left no positions unfilled for 2010-11 graduates.
Job market ratingsOverall, employers rate the job market for Class of 2012 graduates as “good,” the same overall rating as last year. However, in the current survey, the categories of “excellent,” “very good,” and “good” have slightly larger groups of respondents than was the case a year ago, although the percentage choosing the worst rating—“poor”—also rose slightly. (see Figure 3.)
figure 3: employers’ overall job market ratings
NACE Research: Job Outlook 2012 National Association of Colleges and Employers/7
Job Outlook 2012 ReseaRch
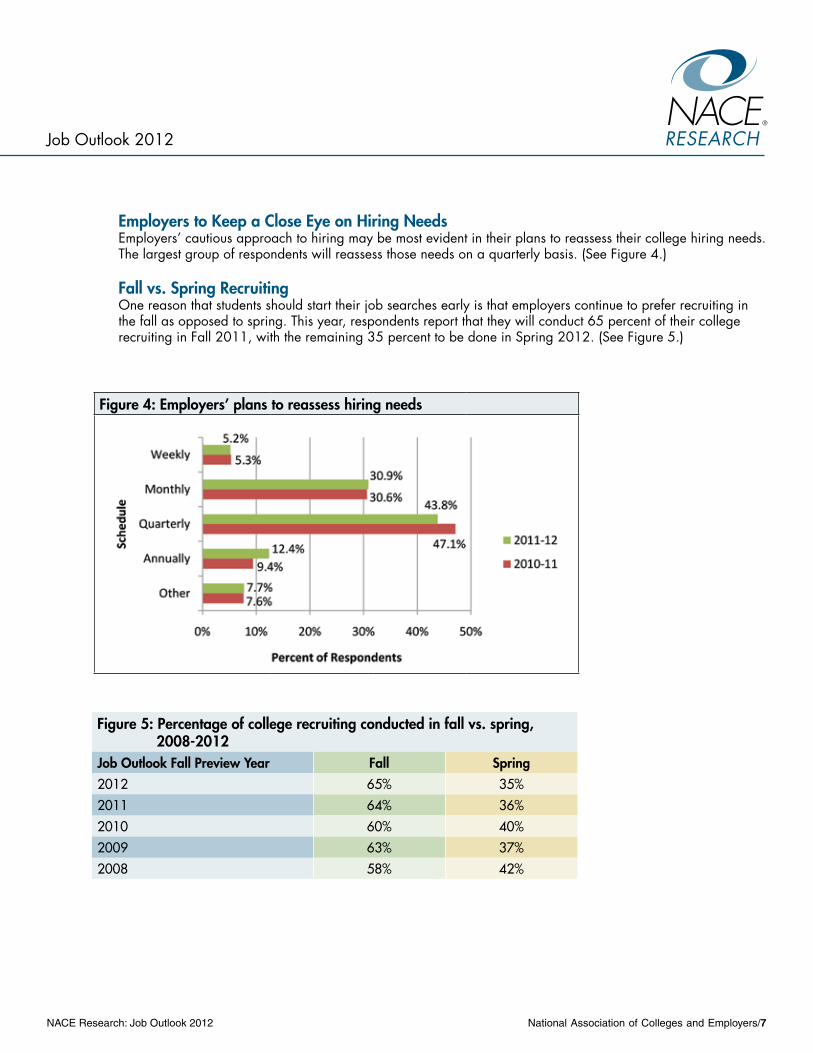
employers to keep a close eye on hiring needsEmployers’ cautious approach to hiring may be most evident in their plans to reassess their college hiring needs. The largest group of respondents will reassess those needs on a quarterly basis. (see Figure 4.)
fall vs. Spring recruitingOne reason that students should start their job searches early is that employers continue to prefer recruiting in the fall as opposed to spring. This year, respondents report that they will conduct 65 percent of their college recruiting in Fall 2011, with the remaining 35 percent to be done in spring 2012. (see Figure 5.)
figure 4: employers’ plans to reassess hiring needs
figure 5: percentage of college recruiting conducted in fall vs. spring, 2008-2012Job Outlook fall preview year fall Spring2012 65% 35%2011 64% 36%2010 60% 40%2009 63% 37%2008 58% 42%

NACE Research: Job Outlook 20128/National Association of Colleges and Employers
Job Outlook 2012ReseaRch
Just over one-third of the employers that plan to be on campus recruiting in spring 2012 have firm plans in place. (see Figure 6.) This is down from last year when 40 percent had firm plans to recruit on campus during spring 2011.
Further indication of employer caution can be seen when looking at employers that have tentative plans for or are unsure of their spring 2012 recruiting. last year, not quite one-third were tentative or unsure of their spring 2011 recruiting plans. This percentage is now approaching almost half of respondents (46.9 percent). The good news is that less than 1 percent of respondents are reporting that they won’t be on campus in spring 2012 because they are not hiring.
changes in recruitingWhen asked about the difference in recruiting methods used to hire Class of 2012 graduates as opposed to those from the Class of 2011, the majority of respondents cited the use of technology. More than half of respondents reported that they will use more technology in general and/or social networking than they have in the past. (see Figure 7.)
The change over last year is notable, but compared to results from Job Outlook 2010 reports, the difference illustrates how technology has truly become a larger influence on college recruiting than in the past.
The percentage of respondents who plan a change in branding may also be a by-product of increased technology use. Just 14.2 percent of respondents planned a change in branding in 2010; that number has swelled to 41.7 percent for 2012.
Another positive finding here is the percentage of respondents that plan to attend more career fairs and do more travel. In 2010, just 2.5 percent of respondents indicated that they would attend more career fairs. That number is up to more than 42 percent this year. Moreover, in 2010, no respondents planned more travel; this year, almost one-quarter have plans to do more traveling.
figure 6: On-campus recruiting plans, spring 2010 - spring 2012, by percent of respondentsrecruiting plans Spring 2012 Spring 2011 Spring 2010Firm plans in place 34.4% 40.0% 29.9%Tentative plans in place 31.8% 19.4% 28.4%All recruiting in Fall 18.2% 24.1% 19.4%Unsure 15.1% 12.9% 15.9%Not hiring 0.5% 3.5% 6.5%
NACE Research: Job Outlook 2012 National Association of Colleges and Employers/9
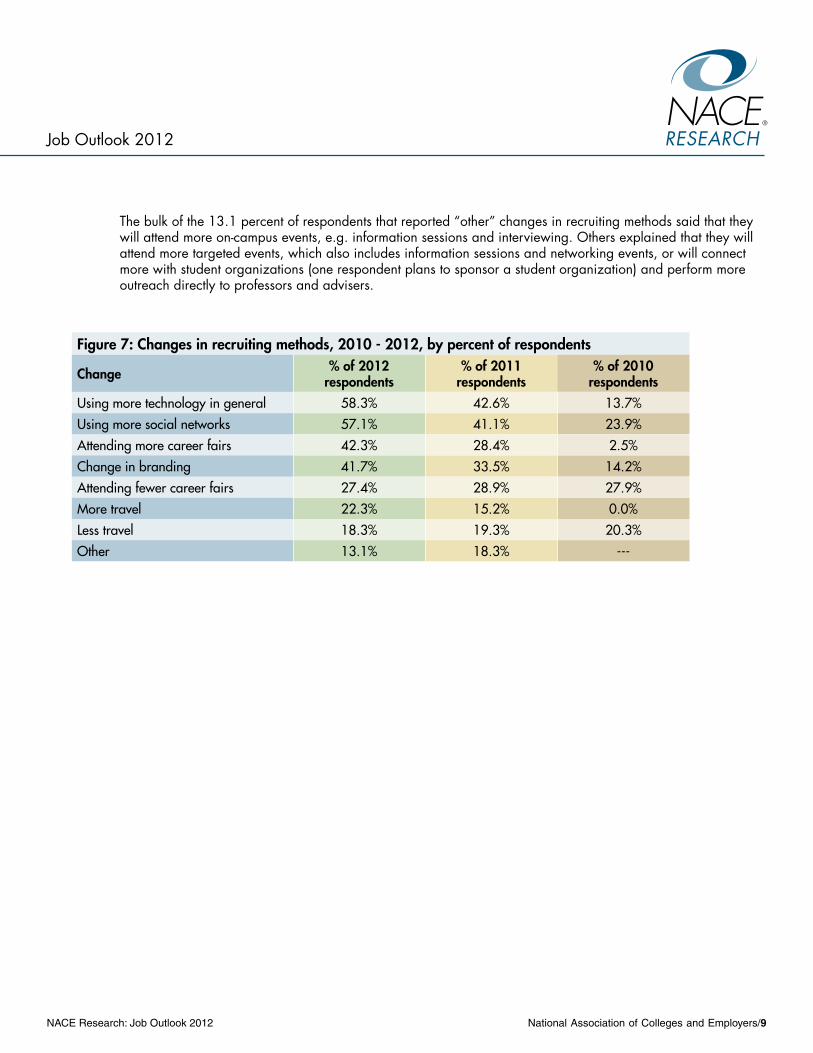
The bulk of the 13.1 percent of respondents that reported “other” changes in recruiting methods said that they will attend more on-campus events, e.g. information sessions and interviewing. Others explained that they will attend more targeted events, which also includes information sessions and networking events, or will connect more with student organizations (one respondent plans to sponsor a student organization) and perform more outreach directly to professors and advisers.
Job Outlook 2012 ReseaRch
figure 7: changes in recruiting methods, 2010 - 2012, by percent of respondents
change % of 2012 respondents
% of 2011 respondents
% of 2010 respondents
Using more technology in general 58.3% 42.6% 13.7%Using more social networks 57.1% 41.1% 23.9%Attending more career fairs 42.3% 28.4% 2.5%Change in branding 41.7% 33.5% 14.2%Attending fewer career fairs 27.4% 28.9% 27.9%More travel 22.3% 15.2% 0.0%Less travel 18.3% 19.3% 20.3%Other 13.1% 18.3% ---

NACE Research: Job Outlook 201210/National Association of Colleges and Employers
Job Outlook 2012ReseaRch
Analysis by industryWhen examining the hiring projections by industry in the Job Outlook 2012 report, it’s important to do so with a great deal of caution due to the fairly small number of respondents in each category.
With this in mind, the news at this early juncture is encouraging. Hiring projections by industry indicate positive movement nearly across the board. With the exception of just one industry, all of those with five or more respon-dents are reporting an overall increase in hiring, which continues a turnaround begun last year. (see Figure 8.)
In 2011, all but two industries (government and finance) reported overall increases in college hiring, a marked improvement from the 2010 report, when all but three industries had overall plans to decrease college hiring.
figure 8: total change in hiring, by industry
industry # of 2012 projected hires
# of 2011 actual hires % change # of respondents
Oil & Gas Extraction 1,585 1,327 19.4% n=10Utilities 301 299 0.7% n=9Construction 454 362 25.4% n=8Chemical (Pharmaceutical) Mfg. 1,395 1,664 -16.2% n=12Computer & Electronics Mfg. 1,833 1,632 12.4% n=20Misc. Mfg. 1,296 1,092 18.7% n=16Retail Trade 1,325 1,079 22.8% n=8Information 375 370 1.4% n=6Finance, Insurance & Real Estate 8,324 8,074 3.1% n=23Accounting Services 8,434 7,776 8.5% n=8Engineering Services 886 745 18.9% n=5Management Consulting 1,587 1,339 18.5% n=14Misc. Prof. Services 1,878 1,603 17.2% n=15Government 1,161 872 33.1% n=6(Only industries with 5 or more respondents are represented here.)
NACE Research: Job Outlook 2012 National Association of Colleges and Employers/11
Job Outlook 2012 ReseaRch
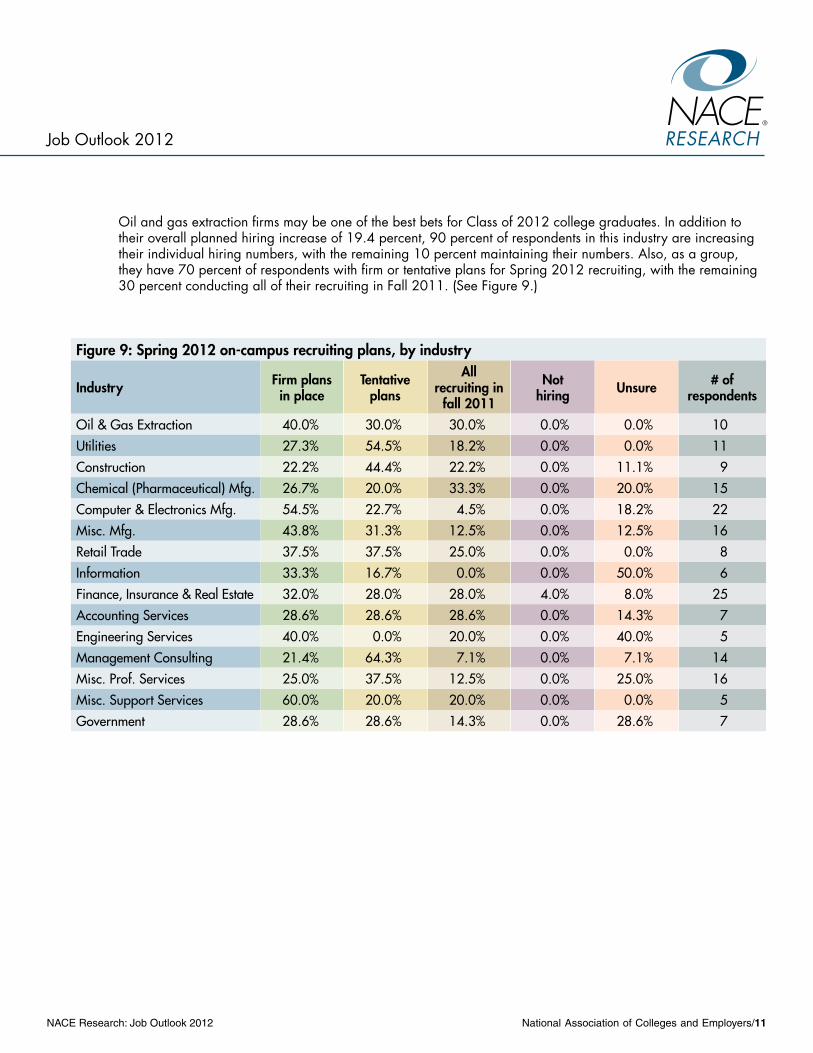
Oil and gas extraction firms may be one of the best bets for Class of 2012 college graduates. In addition to their overall planned hiring increase of 19.4 percent, 90 percent of respondents in this industry are increasing their individual hiring numbers, with the remaining 10 percent maintaining their numbers. Also, as a group, they have 70 percent of respondents with firm or tentative plans for spring 2012 recruiting, with the remaining 30 percent conducting all of their recruiting in Fall 2011. (see Figure 9.)
figure 9: Spring 2012 on-campus recruiting plans, by industry
industry firm plans in place
tentativeplans
All recruiting in
fall 2011
nothiring unsure # of
respondents
Oil & Gas Extraction 40.0% 30.0% 30.0% 0.0% 0.0% 10Utilities 27.3% 54.5% 18.2% 0.0% 0.0% 11Construction 22.2% 44.4% 22.2% 0.0% 11.1% 9Chemical (Pharmaceutical) Mfg. 26.7% 20.0% 33.3% 0.0% 20.0% 15Computer & Electronics Mfg. 54.5% 22.7% 4.5% 0.0% 18.2% 22Misc. Mfg. 43.8% 31.3% 12.5% 0.0% 12.5% 16Retail Trade 37.5% 37.5% 25.0% 0.0% 0.0% 8Information 33.3% 16.7% 0.0% 0.0% 50.0% 6Finance, Insurance & Real Estate 32.0% 28.0% 28.0% 4.0% 8.0% 25Accounting Services 28.6% 28.6% 28.6% 0.0% 14.3% 7Engineering Services 40.0% 0.0% 20.0% 0.0% 40.0% 5Management Consulting 21.4% 64.3% 7.1% 0.0% 7.1% 14Misc. Prof. Services 25.0% 37.5% 12.5% 0.0% 25.0% 16Misc. Support Services 60.0% 20.0% 20.0% 0.0% 0.0% 5Government 28.6% 28.6% 14.3% 0.0% 28.6% 7
NACE Research: Job Outlook 201212/National Association of Colleges and Employers
Job Outlook 2012ReseaRch
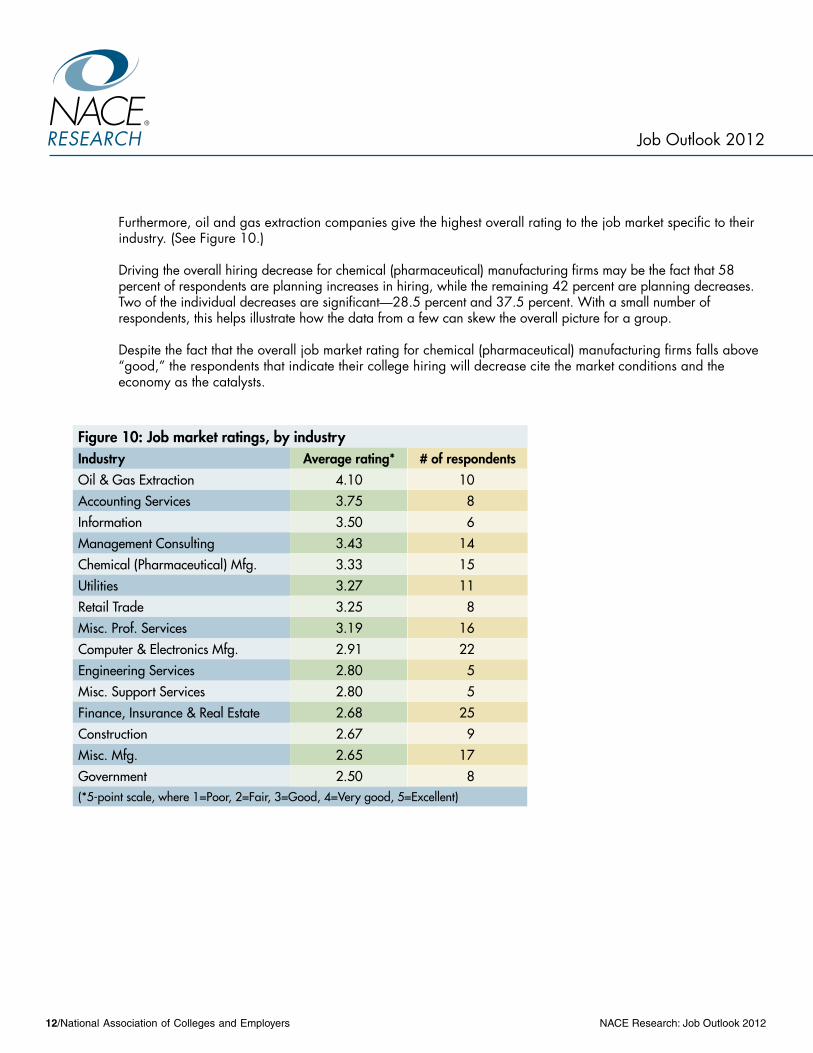
Furthermore, oil and gas extraction companies give the highest overall rating to the job market specific to their industry. (see Figure 10.)
Driving the overall hiring decrease for chemical (pharmaceutical) manufacturing firms may be the fact that 58 percent of respondents are planning increases in hiring, while the remaining 42 percent are planning decreases. Two of the individual decreases are significant—28.5 percent and 37.5 percent. With a small number of respondents, this helps illustrate how the data from a few can skew the overall picture for a group.
Despite the fact that the overall job market rating for chemical (pharmaceutical) manufacturing firms falls above “good,” the respondents that indicate their college hiring will decrease cite the market conditions and the economy as the catalysts.
figure 10: Job market ratings, by industryindustry Average rating* # of respondentsOil & Gas Extraction 4.10 10Accounting Services 3.75 8Information 3.50 6Management Consulting 3.43 14Chemical (Pharmaceutical) Mfg. 3.33 15Utilities 3.27 11Retail Trade 3.25 8Misc. Prof. Services 3.19 16Computer & Electronics Mfg. 2.91 22Engineering Services 2.80 5Misc. Support Services 2.80 5Finance, Insurance & Real Estate 2.68 25Construction 2.67 9Misc. Mfg. 2.65 17Government 2.50 8(*5-point scale, where 1=Poor, 2=Fair, 3=Good, 4=Very good, 5=Excellent)

NACE Research: Job Outlook 2012 National Association of Colleges and Employers/13
Job Outlook 2012 ReseaRch
Analysis by regionHiring projections by geographic region are also positive across the board, with Midwestern employers anticipating the largest increase for Class of 2012 graduates. (see Figure 11.) Employers in the Western region are also planning a double-digit increase, while southeastern and Northeastern employers have smaller increases planned.
The individual employer responses by region may explain why the overall hiring in the Northeast is the lowest of the regions. Figure 12 shows that Northeastern employers have the lowest percentage of respondents with plans to increase their hiring numbers and the largest percentage with plans to decrease their hiring numbers.
In addition, the Midwestern region contains almost half of the oil and gas extraction companies, which, as noted previously, have the brightest outlook of the job market for Class of 2012 graduates.
Midwestern employers also have the most active recruiting plans for spring 2012. Nearly one-quarter of them will do all their recruiting in Fall 2011, with 64 percent that have either firm or tentative plans for spring 2012 recruiting. Only 12 percent of Midwestern employers are unsure of their spring 2012 recruiting plans, and no respondents from this region indicated they will not be on campus in spring 2012 because they are not hiring. (see Figure 13.)
figure 11: total change in hiring, by region
region # of 2012 projected hires
# of 2011 actual hires % change # of respondents
Northeast 14,253 13,334 6.9% n=44Southeast 11,815 10,882 8.6% n=62Midwest 5,187 4,378 18.5% n=48West 2,301 2,063 11.5% n=25
figure 12: hiring expectations by region, by percent of respondentsregion increase maintain decreaseNortheast 46.9% 36.7% 16.3%Southeast 50.7% 40.8% 8.5%Midwest 50.0% 40.0% 10.0%West 60.0% 24.0% 16.0%
figure 13: Spring 2012 recruiting plans, by regionrecruiting plans northeast Southeast midwest WestFirm plans in place 28.9% 26.8% 34.0% 65.4%Tentative plans in place 24.4% 46.5% 30.0% 7.7%All recruiting in fall 20.0% 14.1% 24.0% 15.4%Unsure 26.7% 12.7% 12.0% 7.7%Not hiring 0.0% 0.0% 0.0% 3.8%
NACE Research: Job Outlook 201214/National Association of Colleges and Employers
Job Outlook 2012ReseaRch
WHO’s IN DEMAND?
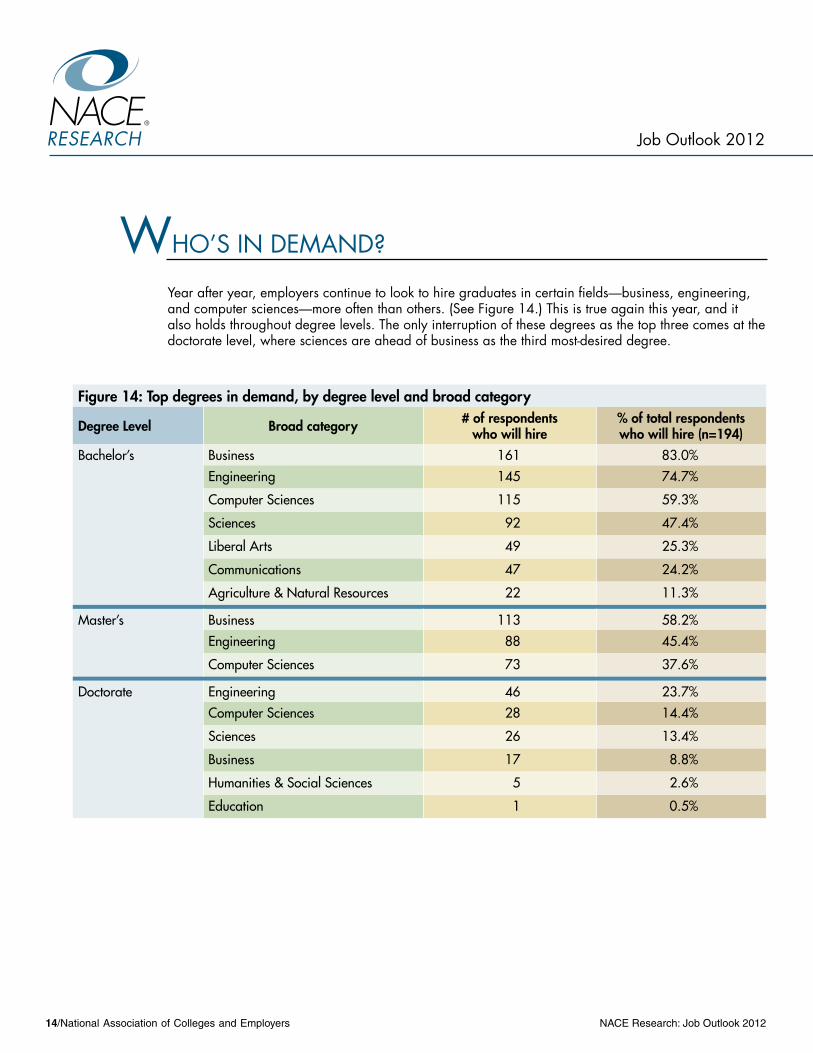
Year after year, employers continue to look to hire graduates in certain fields—business, engineering, and computer sciences—more often than others. (see Figure 14.) This is true again this year, and it also holds throughout degree levels. The only interruption of these degrees as the top three comes at the doctorate level, where sciences are ahead of business as the third most-desired degree.
figure 14: top degrees in demand, by degree level and broad category
degree level broad category # of respondents who will hire
% of total respondents who will hire (n=194)
Bachelor’s Business 161 83.0%Engineering 145 74.7%
Computer Sciences 115 59.3%
Sciences 92 47.4%
Liberal Arts 49 25.3%
Communications 47 24.2%
Agriculture & Natural Resources 22 11.3%
Master’s Business 113 58.2%Engineering 88 45.4%
Computer Sciences 73 37.6%
Doctorate Engineering 46 23.7%Computer Sciences 28 14.4%
Sciences 26 13.4%
Business 17 8.8%
Humanities & Social Sciences 5 2.6%
Education 1 0.5%

NACE Research: Job Outlook 2012 National Association of Colleges and Employers/15
Job Outlook 2012 ReseaRch
In terms of the most sought after majors at the bachelor’s degree level, finance graduates edge out all others this year to top the list, with accounting and computer and information sciences majors close behind. (see Figure 15.)
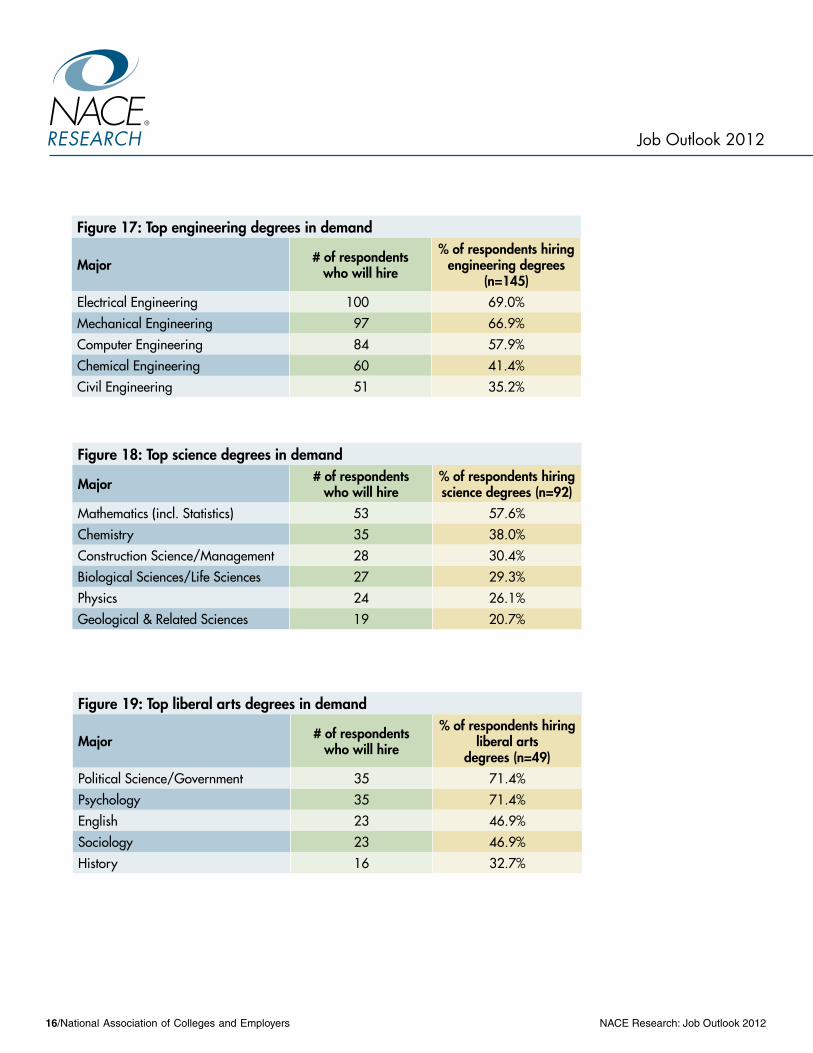
Figures 16 through 20 illustrate the demand for each major relative to the others in the same broad category. Of those employer respondents hiring any business degrees, nearly three- quarters will hire finance graduates, with accounting graduates right behind them (Figure 16). Within the engineering field, electrical engineering graduates top the list (Figure 17). Meanwhile, more than half of respondents that will hire science graduates will be
looking specifically for mathematics majors (Figure 18), and, of those with plans to hire liberal arts degrees, more than 70 percent will seek graduates in the political science/government and psychology fields (Figure 19).
figure 15: top degrees in demand (bachelor’s degree level)
major # of respondents who will hire
% of respondents who will hire
Finance 119 61.3%Accounting 115 59.3%Computer & Information Sciences 115 59.3%Electrical Engineering 100 51.5%Mechanical Engineering 97 50.0%Business Administration/Mgmt. 94 48.5%Management Information Systems 85 43.8%Computer Engineering 84 43.3%Economics 66 34.0%Logistics/Materials Management 66 34.0%
figure 16: top business degrees in demand
major # of respondents who will hire
% of respondents hiring business degrees
(n=161)Finance 119 73.9%Accounting 115 71.4%Business Administration/ Mgmt. 94 58.4%Management Info Systems 85 52.8%Economics 66 41.0%Logistics/Materials Management 66 41.0%Marketing 63 39.1%International Business 30 18.6%
NACE Research: Job Outlook 201216/National Association of Colleges and Employers
Job Outlook 2012ReseaRch
figure 17: top engineering degrees in demand
major # of respondents who will hire
% of respondents hiring engineering degrees
(n=145)Electrical Engineering 100 69.0%Mechanical Engineering 97 66.9%Computer Engineering 84 57.9%Chemical Engineering 60 41.4%Civil Engineering 51 35.2%
figure 18: top science degrees in demand
major # of respondents who will hire
% of respondents hiring science degrees (n=92)
Mathematics (incl. Statistics) 53 57.6%Chemistry 35 38.0%Construction Science/Management 28 30.4%Biological Sciences/Life Sciences 27 29.3%Physics 24 26.1%Geological & Related Sciences 19 20.7%
figure 19: top liberal arts degrees in demand
major # of respondents who will hire
% of respondents hiring liberal arts
degrees (n=49)Political Science/Government 35 71.4%Psychology 35 71.4%English 23 46.9%Sociology 23 46.9%History 16 32.7%
NACE Research: Job Outlook 2012 National Association of Colleges and Employers/17
Job Outlook 2012 ReseaRch
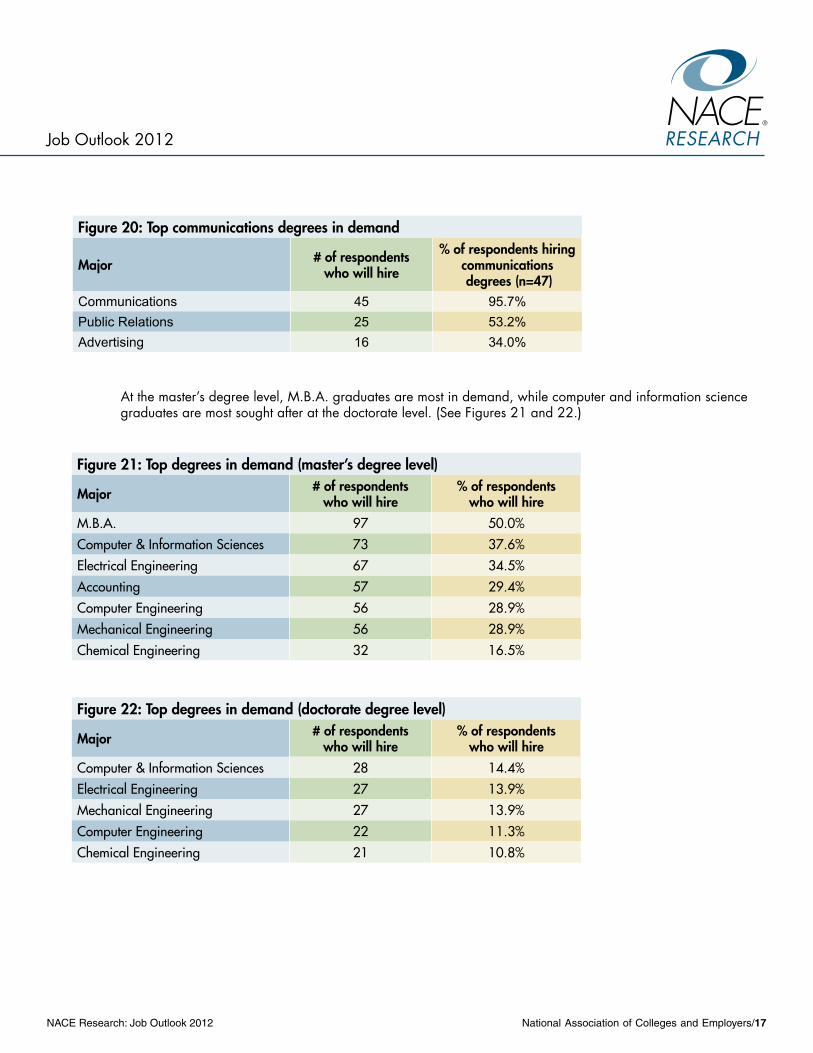
figure 20: top communications degrees in demand
major # of respondents who will hire
% of respondents hiring communications degrees (n=47)
Communications 45 95.7%Public Relations 25 53.2%Advertising 16 34.0%
At the master’s degree level, M.B.A. graduates are most in demand, while computer and information science graduates are most sought after at the doctorate level. (see Figures 21 and 22.)
figure 21: top degrees in demand (master’s degree level)
major # of respondents who will hire
% of respondents who will hire
M.B.A. 97 50.0%Computer & Information Sciences 73 37.6%Electrical Engineering 67 34.5%Accounting 57 29.4%Computer Engineering 56 28.9%Mechanical Engineering 56 28.9%Chemical Engineering 32 16.5%
figure 22: top degrees in demand (doctorate degree level)
major # of respondents who will hire
% of respondents who will hire
Computer & Information Sciences 28 14.4%Electrical Engineering 27 13.9%Mechanical Engineering 27 13.9%Computer Engineering 22 11.3%Chemical Engineering 21 10.8%
NACE Research: Job Outlook 201218/National Association of Colleges and Employers
Job Outlook 2012ReseaRch
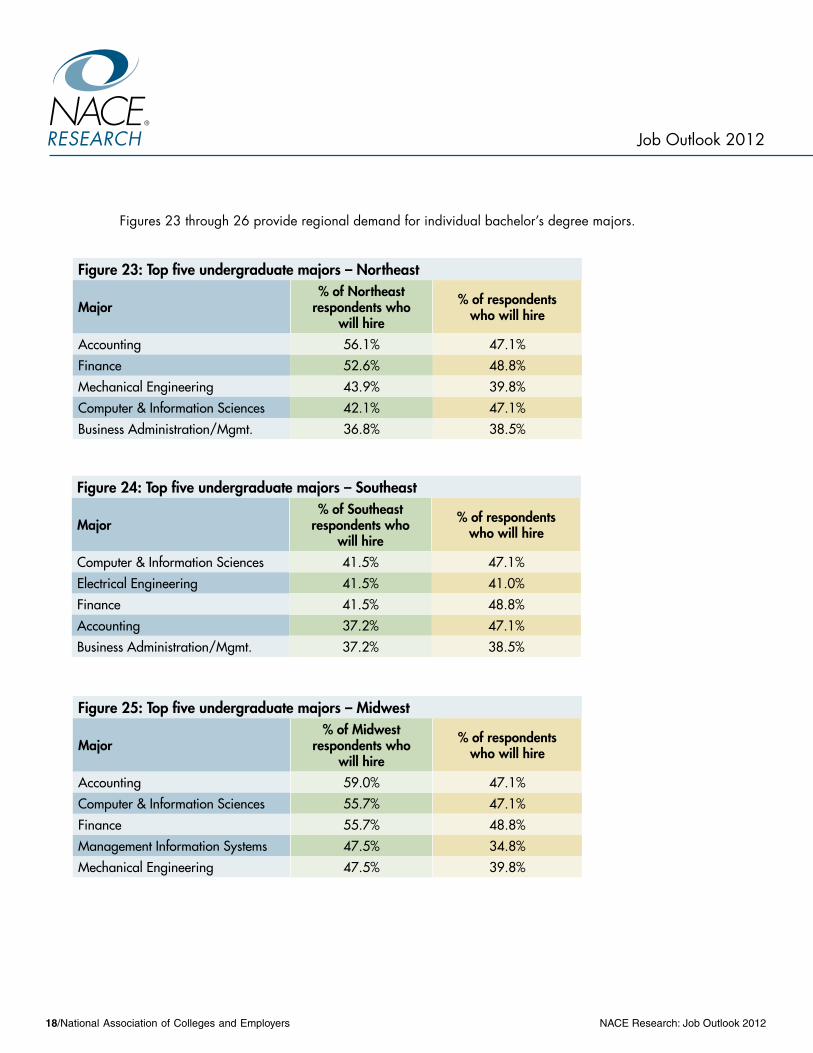
figure 23: top five undergraduate majors – northeast
major% of northeast
respondents who will hire
% of respondents who will hire
Accounting 56.1% 47.1%Finance 52.6% 48.8%Mechanical Engineering 43.9% 39.8%Computer & Information Sciences 42.1% 47.1%Business Administration/Mgmt. 36.8% 38.5%
Figures 23 through 26 provide regional demand for individual bachelor’s degree majors.
figure 24: top five undergraduate majors – Southeast
major% of Southeast
respondents who will hire
% of respondents who will hire
Computer & Information Sciences 41.5% 47.1%Electrical Engineering 41.5% 41.0%Finance 41.5% 48.8%Accounting 37.2% 47.1%Business Administration/Mgmt. 37.2% 38.5%
figure 25: top five undergraduate majors – midwest
major% of midwest
respondents who will hire
% of respondents who will hire
Accounting 59.0% 47.1%Computer & Information Sciences 55.7% 47.1%Finance 55.7% 48.8%Management Information Systems 47.5% 34.8%Mechanical Engineering 47.5% 39.8%

NACE Research: Job Outlook 2012 National Association of Colleges and Employers/19
Job Outlook 2012 ReseaRch
figure 26: top five undergraduate majors – West
major% of West
respondents who will hire
% of respondents who will hire
Computer & Information Sciences 56.3% 47.1%Finance 50.0% 48.8%Business Administration/Mgmt. 46.9% 38.5%Computer Engineering 43.8% 34.4%Electrical Engineering 43.8% 41.0%
Examining the demand for individual majors by industry shows that chemical (pharmaceutical) manufacturing firms and utilities companies have the most interest in the top five degrees in demand. (see Figure 27.) By region, Midwestern employers have the most interest in four of the top five specific majors in demand. (see Figure 28.)
figure 27: Who’s hiring, by industry (bachelor’s degree level)
major most interested industries % of industry respondents
Finance Finance, Insurance & Real Estate 89%Chemical (Pharmaceutical) Mfg. 73%
Retail Trade 70%
Accounting Accounting Services 89%Chemical (Pharmaceutical) Mfg. 80%
Finance, Insurance & Real Estate 71%
Computer & Information Sciences Chemical (Pharmaceutical) Mfg. 73%Utilities 73%
Computer & Electronics Mfg. 67%
Electrical Engineering Utilities 100%Computer & Electronics Mfg. 82%
Chemical (Pharmaceutical) Mfg. 80%
Mechanical Engineering Utilities 100%Chemical (Pharmaceutical) Mfg. 87%
Oil & Gas Extraction 64%

NACE Research: Job Outlook 201220/National Association of Colleges and Employers
Job Outlook 2012ReseaRch
figure 28: Who’s hiring, by region (bachelor’s degree level)
major most interested regions % respondents by region
Finance Midwest 56%Northeast 53%
West 50%
Southeast 41%
Accounting Midwest 59%Northeast 56%
West 38%
Southeast 37%
Computer & Information Sciences Midwest 56%West 56%
Northeast 42%
Southeast 41%
Electrical Engineering West 44%Midwest 43%
Southeast 41%
Northeast 37%
Mechanical Engineering Midwest 48%Northeast 44%
Southeast 34%
West 34%

NACE Research: Job Outlook 2012 National Association of Colleges and Employers/21
Job Outlook 2012 ReseaRch
figure 29: international student hiring plans, 2006-2012
international and Associate degree Student hiringThe demand for international and associate degree students appears to be rebounding slightly for the Class of 2012. Almost one-quarter of respondents have plans to hire international degree graduates from this year’s class and nearly as many have plans to hire graduates with associate degrees. These percentages are up from employer projections over the last two years. (see Figures 29 and 30.)
Employers who expressed demand in hiring international graduates will be looking mainly for those earning degrees in the various engineering fields and computer science/information technology.
For associate degree graduates, the demand also lies in the engineering and computer technology fields, with a handful of employers that will also seek graduates in the design/drafting areas.
figure 30: Associate degree student hiring, 2006-2012
NACE Research: Job Outlook 201222/National Association of Colleges and Employers
Job Outlook 2012ReseaRch
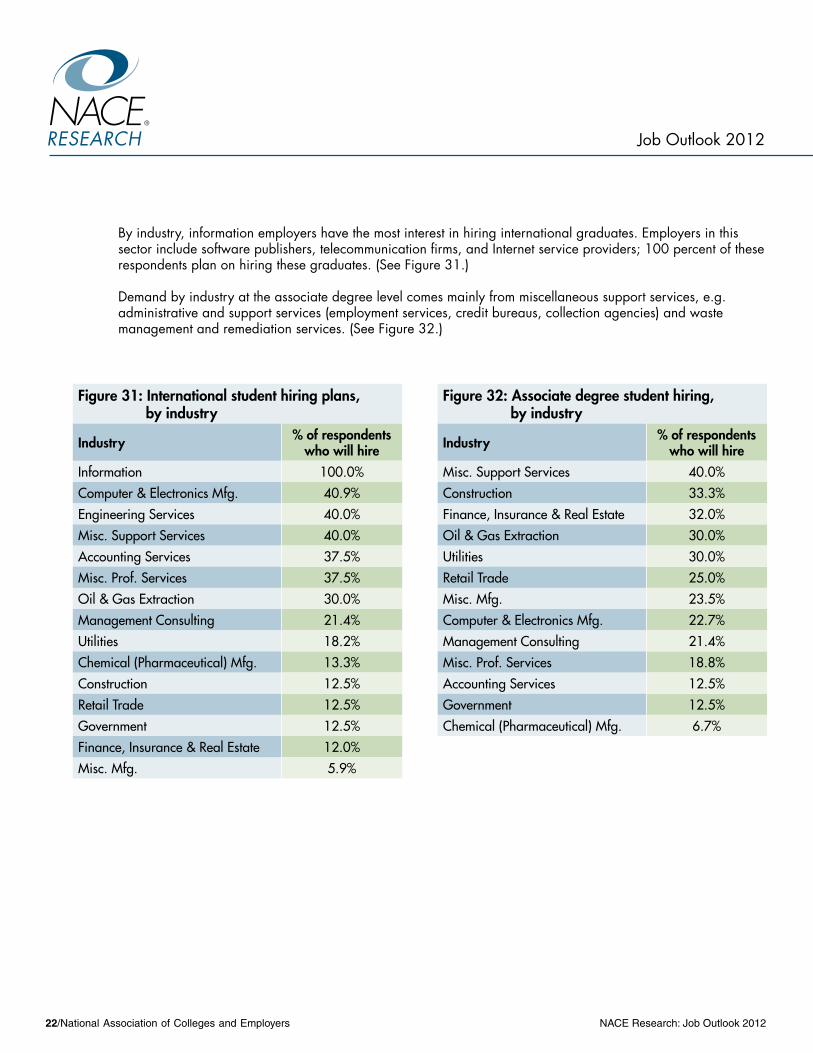
By industry, information employers have the most interest in hiring international graduates. Employers in this sector include software publishers, telecommunication firms, and Internet service providers; 100 percent of these respondents plan on hiring these graduates. (see Figure 31.)
Demand by industry at the associate degree level comes mainly from miscellaneous support services, e.g. administrative and support services (employment services, credit bureaus, collection agencies) and waste management and remediation services. (see Figure 32.)
figure 31: international student hiring plans, by industry
industry % of respondents who will hire
Information 100.0%Computer & Electronics Mfg. 40.9%Engineering Services 40.0%Misc. Support Services 40.0%Accounting Services 37.5%Misc. Prof. Services 37.5%Oil & Gas Extraction 30.0%Management Consulting 21.4%Utilities 18.2%Chemical (Pharmaceutical) Mfg. 13.3%Construction 12.5%Retail Trade 12.5%Government 12.5%Finance, Insurance & Real Estate 12.0%Misc. Mfg. 5.9%
figure 32: Associate degree student hiring, by industry
industry % of respondents who will hire
Misc. Support Services 40.0%Construction 33.3%Finance, Insurance & Real Estate 32.0%Oil & Gas Extraction 30.0%Utilities 30.0%Retail Trade 25.0%Misc. Mfg. 23.5%Computer & Electronics Mfg. 22.7%Management Consulting 21.4%Misc. Prof. Services 18.8%Accounting Services 12.5%Government 12.5%Chemical (Pharmaceutical) Mfg. 6.7%

NACE Research: Job Outlook 2012 National Association of Colleges and Employers/23
Job Outlook 2012 ReseaRch
figure 33: international student hiring plans, by region
By geographic region, the demand for international graduates has been maintained or increased in all regions, except the Midwest. (see Figure 33.)
Compared to last year’s demand for associate de-gree hires, interest has only waned among Western employers, with the other three regions holding the same or more interest in these particular graduates. (see Figure 34.)
In both cases, employers in the southeastern region are significantly increasing their projections: a jump of 10 percent over last year for international graduates and of 12 percent over last year for associate degree graduates.
figure 34: Associate degree student hiring, by region

NACE Research: Job Outlook 201224/National Association of Colleges and Employers
Job Outlook 2012ReseaRch
EMPlOYERs’ VIEW OF CANDIDATEs
Regardless of the state of the economy, employers seem to follow certain criteria in their hiring process for new college graduates.
GpA ScreeningThe group of respondents that reported plans to screen candidates by GPA hit an all-time high at 76.9 percent last year in the Job Outlook 2011 survey; that number has receded slightly to 73.4 percent in this year’s survey. (see Figure 35.)
figure 35: Screen candidates by GpA, by percent of respondents
NACE Research: Job Outlook 2012 National Association of Colleges and Employers/25
Job Outlook 2012 ReseaRch
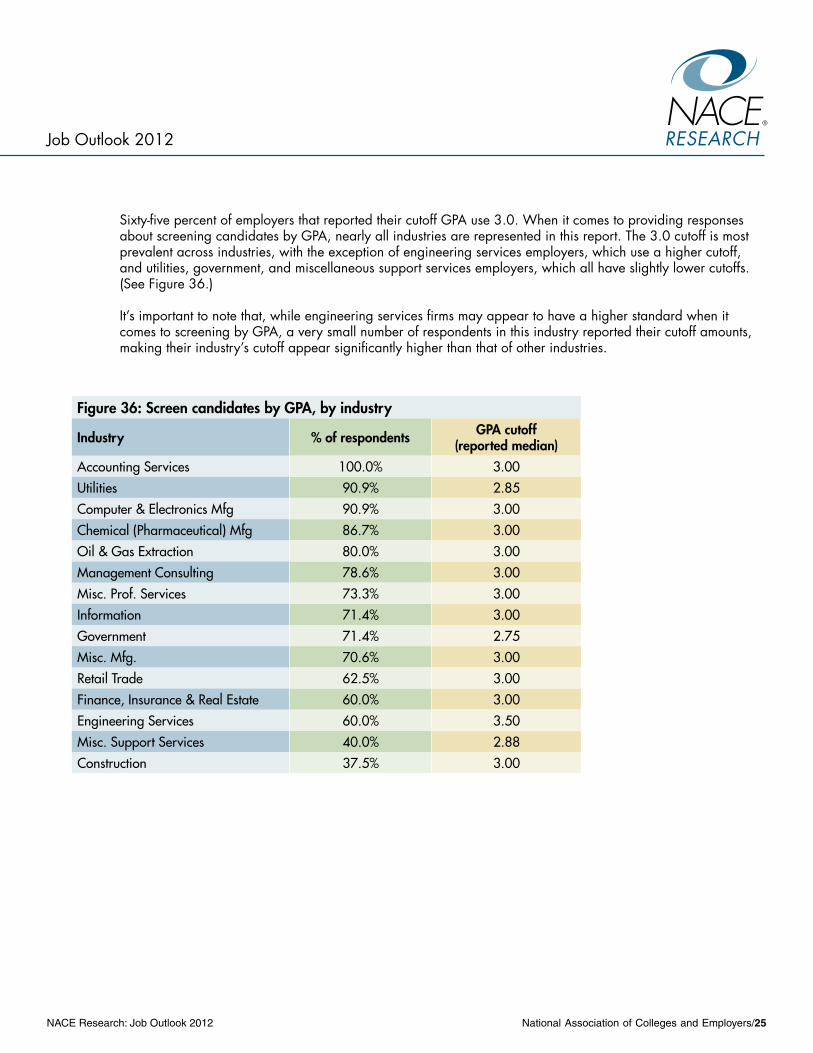
sixty-five percent of employers that reported their cutoff GPA use 3.0. When it comes to providing responses about screening candidates by GPA, nearly all industries are represented in this report. The 3.0 cutoff is most prevalent across industries, with the exception of engineering services employers, which use a higher cutoff, and utilities, government, and miscellaneous support services employers, which all have slightly lower cutoffs. (see Figure 36.)
It’s important to note that, while engineering services firms may appear to have a higher standard when it comes to screening by GPA, a very small number of respondents in this industry reported their cutoff amounts, making their industry’s cutoff appear significantly higher than that of other industries.
figure 36: Screen candidates by GpA, by industry
industry % of respondents GpA cutoff(reported median)
Accounting Services 100.0% 3.00Utilities 90.9% 2.85Computer & Electronics Mfg 90.9% 3.00Chemical (Pharmaceutical) Mfg 86.7% 3.00Oil & Gas Extraction 80.0% 3.00Management Consulting 78.6% 3.00Misc. Prof. Services 73.3% 3.00Information 71.4% 3.00Government 71.4% 2.75Misc. Mfg. 70.6% 3.00Retail Trade 62.5% 3.00Finance, Insurance & Real Estate 60.0% 3.00Engineering Services 60.0% 3.50Misc. Support Services 40.0% 2.88Construction 37.5% 3.00
NACE Research: Job Outlook 201226/National Association of Colleges and Employers
Job Outlook 2012ReseaRch
figure 37: influence of attributes
Attribute 2012 average influence rating*
2011 average influence rating*
Major 3.9 4.1Has held leadership position 3.9 4.1Has been involved in extracurricular activities (clubs, sports, student government, etc.)
3.7 3.8
High GPA (3.0 or above) 3.6 3.8Has done volunteer work 3.1 3.2School attended 3.0 3.2*5-point scale, where 1=No influence at all, 2=Not much influence, 3=Somewhat of an influence, 4=Very much influence, and 5=Extreme influence
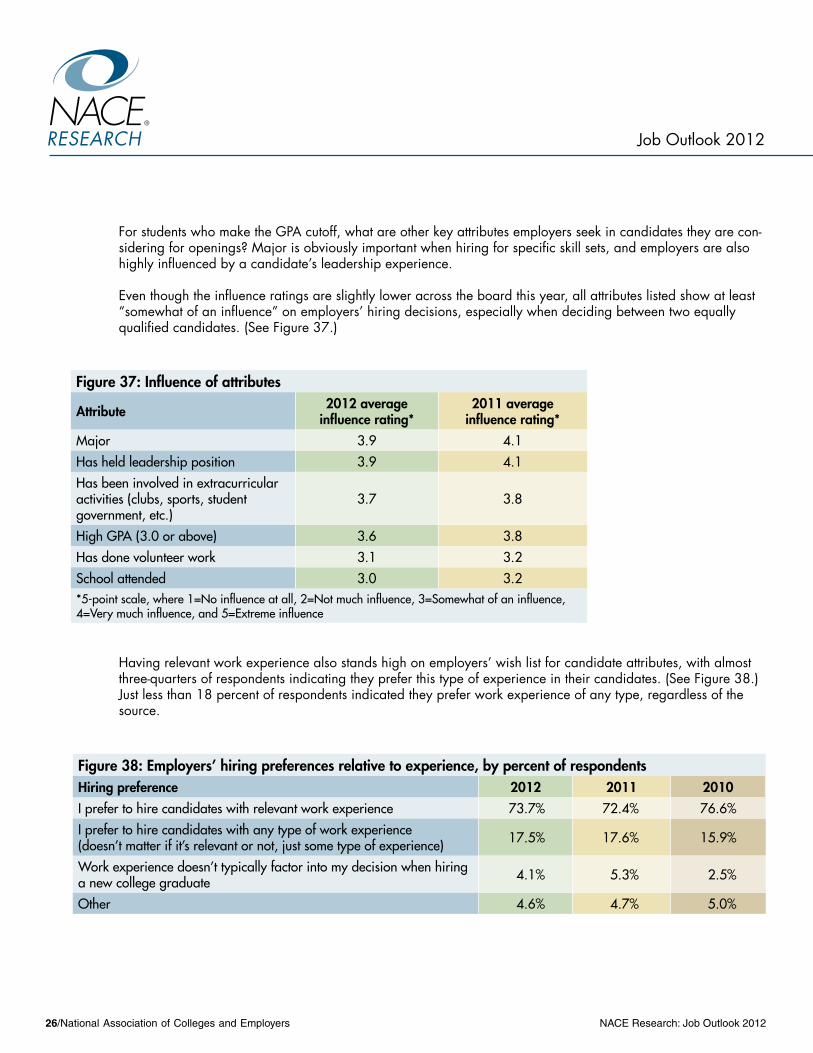
For students who make the GPA cutoff, what are other key attributes employers seek in candidates they are con-sidering for openings? Major is obviously important when hiring for specific skill sets, and employers are also highly influenced by a candidate’s leadership experience.
Even though the influence ratings are slightly lower across the board this year, all attributes listed show at least “somewhat of an influence” on employers’ hiring decisions, especially when deciding between two equally qualified candidates. (see Figure 37.)
Having relevant work experience also stands high on employers’ wish list for candidate attributes, with almost three-quarters of respondents indicating they prefer this type of experience in their candidates. (see Figure 38.) Just less than 18 percent of respondents indicated they prefer work experience of any type, regardless of the source.
figure 38: employers’ hiring preferences relative to experience, by percent of respondentshiring preference 2012 2011 2010I prefer to hire candidates with relevant work experience 73.7% 72.4% 76.6%I prefer to hire candidates with any type of work experience(doesn’t matter if it’s relevant or not, just some type of experience) 17.5% 17.6% 15.9%
Work experience doesn’t typically factor into my decision when hiring a new college graduate 4.1% 5.3% 2.5%
Other 4.6% 4.7% 5.0%
NACE Research: Job Outlook 2012 National Association of Colleges and Employers/27
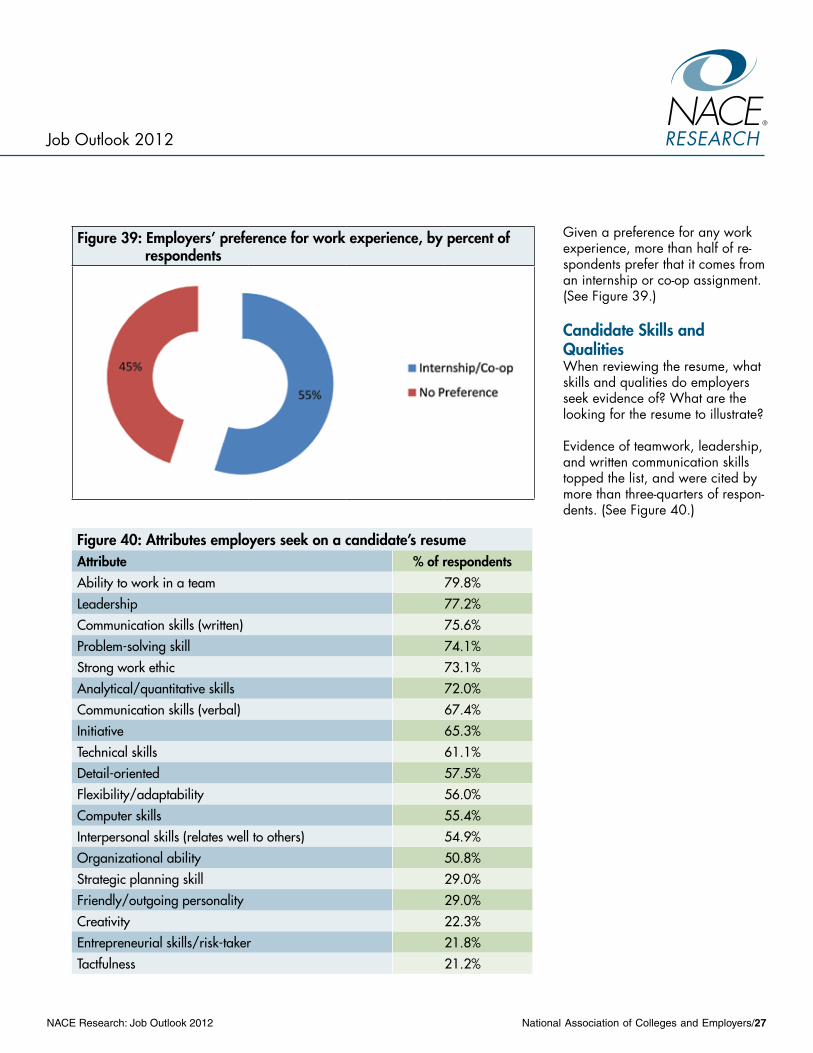
Given a preference for any work experience, more than half of re-spondents prefer that it comes from an internship or co-op assignment. (see Figure 39.)
candidate Skills and QualitiesWhen reviewing the resume, what skills and qualities do employers seek evidence of? What are the looking for the resume to illustrate?
Evidence of teamwork, leadership, and written communication skills topped the list, and were cited by more than three-quarters of respon-dents. (see Figure 40.)
Job Outlook 2012 ReseaRch
figure 39: employers’ preference for work experience, by percent of respondents
figure 40: Attributes employers seek on a candidate’s resumeAttribute % of respondentsAbility to work in a team 79.8%Leadership 77.2%Communication skills (written) 75.6%Problem-solving skill 74.1%Strong work ethic 73.1%Analytical/quantitative skills 72.0%Communication skills (verbal) 67.4%Initiative 65.3%Technical skills 61.1%Detail-oriented 57.5%Flexibility/adaptability 56.0%Computer skills 55.4%Interpersonal skills (relates well to others) 54.9%Organizational ability 50.8%Strategic planning skill 29.0%Friendly/outgoing personality 29.0%Creativity 22.3%Entrepreneurial skills/risk-taker 21.8%Tactfulness 21.2%
NACE Research: Job Outlook 201228/National Association of Colleges and Employers
Job Outlook 2012ReseaRch
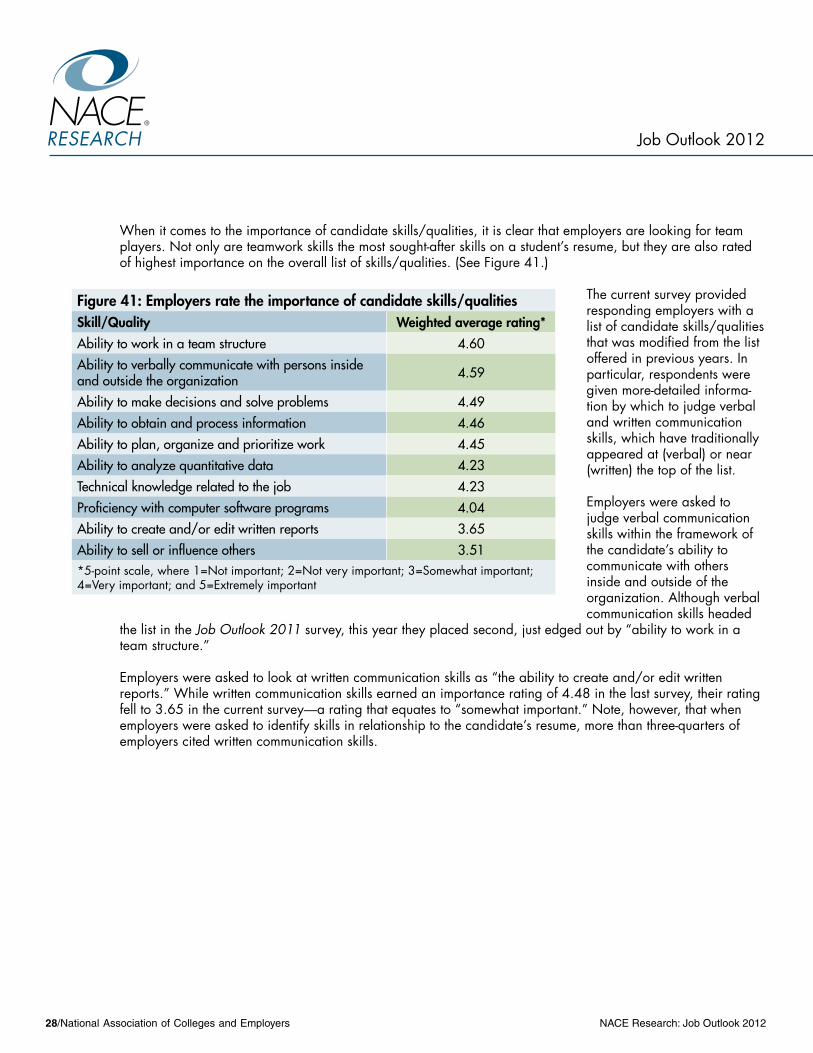
When it comes to the importance of candidate skills/qualities, it is clear that employers are looking for team players. Not only are teamwork skills the most sought-after skills on a student’s resume, but they are also rated of highest importance on the overall list of skills/qualities. (see Figure 41.)
The current survey provided responding employers with a list of candidate skills/qualities that was modified from the list offered in previous years. In particular, respondents were given more-detailed informa-tion by which to judge verbal and written communication skills, which have traditionally appeared at (verbal) or near (written) the top of the list.
Employers were asked to judge verbal communication skills within the framework of the candidate’s ability to communicate with others inside and outside of the organization. Although verbal communication skills headed
the list in the Job Outlook 2011 survey, this year they placed second, just edged out by “ability to work in a team structure.”
Employers were asked to look at written communication skills as “the ability to create and/or edit written reports.” While written communication skills earned an importance rating of 4.48 in the last survey, their rating fell to 3.65 in the current survey—a rating that equates to “somewhat important.” Note, however, that when employers were asked to identify skills in relationship to the candidate’s resume, more than three-quarters of employers cited written communication skills.
figure 41: employers rate the importance of candidate skills/qualitiesSkill/Quality Weighted average rating*Ability to work in a team structure 4.60Ability to verbally communicate with persons inside and outside the organization 4.59
Ability to make decisions and solve problems 4.49Ability to obtain and process information 4.46Ability to plan, organize and prioritize work 4.45Ability to analyze quantitative data 4.23Technical knowledge related to the job 4.23Proficiency with computer software programs 4.04Ability to create and/or edit written reports 3.65Ability to sell or influence others 3.51*5-point scale, where 1=Not important; 2=Not very important; 3=somewhat important; 4=Very important; and 5=Extremely important

NACE Research: Job Outlook 2012 National Association of Colleges and Employers/29
Job Outlook 2012 ReseaRch
figure 42: employers with plans to increase starting salaries to bachelor’s degree graduates
figure 43: employers with plans to increase starting salaries, by industry
industry# of respondents
w/plans to increase bachelor’s salaries
# of respondents by industry
% of respondentsby industry
Utilities 4 5 80.0%Computer & Electronics Mfg. 12 16 75.0%Oil & Gas Extraction 6 8 75.0%Retail Trade 3 4 75.0%Accounting Services 6 8 75.0%Misc. Professional Services 5 9 55.6%Chemical (Pharmaceutical) Mfg. 6 11 54.5%Construction 3 6 50.0%Misc. Mfg. 6 12 50.0%Management Consulting 6 12 50.0%Finance, Insurance & Real Estate 7 17 41.2%Government 0 5 0.0%
COMPENsATION AND BENEFITs
Salary plansMore than half of responding employers have plans to increase starting salaries to Class of 2012 graduates, up from less than half of respondents last year. (see Figure 42.)
Of those with plans to increase bachelor’s degree salaries, the projected average increase is 3.3 percent, exactly what em-ployers projected last year. The median projected increase falls at 3 percent, with 28 percent increasing salaries by 3 percent and almost one-quarter projecting a 2 percent bump.
Nearly half of respondents plan to increase salaries for students earning master’s degrees. The average planned increase this year is 3.7 percent, up slightly from 3.4 percent last year. The median increase projected for master’s degree graduates is 3 percent, but more than 27 percent of respondents are planning an increase of 5 percent.
Of the industries with five or more respondents, only government employers have no respondents with plans to increase starting salaries to bachelor’s degree graduates. (see Figure 43.) With the exception of employers in the finance, insurance, and real estate sector, all remaining industries have at least half of their respondents planning increases in salaries to bachelor’s degree graduates.

NACE Research: Job Outlook 201230/National Association of Colleges and Employers
Job Outlook 2012ReseaRch
By region, Midwestern employers are the group with the largest percentage of respondents planning to increase salaries to bachelor’s degree graduates. However, their average projected increase is 2.9 percent, the lowest of all regional projections. (see Figure 44.)
Signing bonusesAnother indication of the cautious approach employers are taking: the lack of growth in the percentage of re-spondents that plan to offer signing bonuses to Class of 2012 graduates. last year, 45.8 percent of employers had plans to offer them to 2011 graduates—nearly identical to the percentage that actually ended up doing so. (see Figure 45.) This year, 45 percent have plans to offer them to Class of 2012 graduates.
figure 45: employers offering signing bonuses
figure 44: employers with plans to increase starting salaries, by region
region# of respondents
w/plans to increase bachelor’s salaries
# of respondentsby region
% of respondentsby region
Average projected increase
Northeast 15 32 46.9% 3.4%Southeast 22 50 44.0% 3.7%Midwest 26 37 70.3% 2.9%West 11 17 64.7% 3.3%
NACE Research: Job Outlook 2012 National Association of Colleges and Employers/31
Job Outlook 2012 ReseaRch
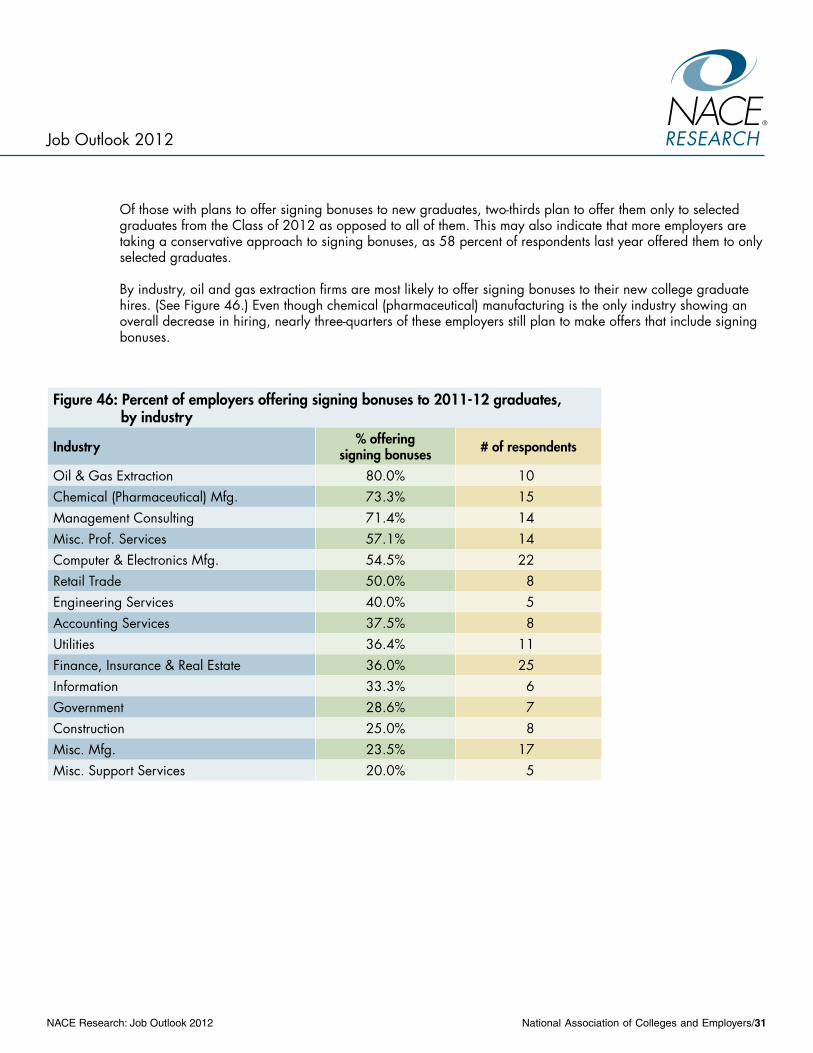
Of those with plans to offer signing bonuses to new graduates, two-thirds plan to offer them only to selected graduates from the Class of 2012 as opposed to all of them. This may also indicate that more employers are taking a conservative approach to signing bonuses, as 58 percent of respondents last year offered them to only selected graduates.
By industry, oil and gas extraction firms are most likely to offer signing bonuses to their new college graduate hires. (see Figure 46.) Even though chemical (pharmaceutical) manufacturing is the only industry showing an overall decrease in hiring, nearly three-quarters of these employers still plan to make offers that include signing bonuses.
figure 46: percent of employers offering signing bonuses to 2011-12 graduates, by industry
industry % offering signing bonuses # of respondents
Oil & Gas Extraction 80.0% 10Chemical (Pharmaceutical) Mfg. 73.3% 15Management Consulting 71.4% 14Misc. Prof. services 57.1% 14Computer & Electronics Mfg. 54.5% 22Retail Trade 50.0% 8Engineering services 40.0% 5Accounting services 37.5% 8Utilities 36.4% 11Finance, Insurance & Real Estate 36.0% 25Information 33.3% 6Government 28.6% 7Construction 25.0% 8Misc. Mfg. 23.5% 17Misc. support services 20.0% 5

NACE Research: Job Outlook 201232/National Association of Colleges and Employers
Job Outlook 2012ReseaRch
Not only are Midwestern employers most likely to offer bachelor’s degree graduates a salary increase, they are most likely to offer a signing bonus. (see Figure 47.)
Among respondents that plan to offer signing bonuses to all graduates, the average bonus amount is $4,373, slightly higher than last year’s average projected bonus amount of $4,347. Nearly one-quarter of this year’s respondents have plans to offer $5,000 signing bonuses to Class of 2012 graduates.
A small number of respondents provided signing bonus data by major at the bachelor’s degree level; the results are outlined in Figure 48.
At the master’s level, just a handful of respondents reported signing bonus data for M.B.A. graduates. The average bonus is shown in Figure 49, however the range was quite extensive, starting at $1,500 and going as high as $25,000, with no data points the same.
figure 47: percent of employers offering signing bonuses in 2011-12, by region
region% who plan to offer signing bonuses in
2011-12
% who planned to offer signing
bonuses in 2010-11Northeast 44% 29%Southeast 46% 26%Midwest 50% 32%West 35% 13%
figure 48: Average signing bonus, by major (bachelor’s degrees)*
major 2011-12 average bonus (projected)
# of respondents2011-12
2010-11 averagebonus (projected)
# of respondents 2010-11
Finance $3,900 5 $3,250 8Engineering – not specified $3,833 9 $3,278 9Accounting $3,286 7 $2,775 10Computer Science $2,083 6 $4,000 5*where 5 or more data points were provided.
figure 49: Average signing bonus, by major (master’s degrees)*
major 2011-12 average bonus (projected)
# of respondents2011-12
2010-11 averagebonus (projected)
# of respondents 2010-11
M.B.A. $15,143 7 $12,857 14*where 5 or more data points were provided.
NACE Research: Job Outlook 2012 National Association of Colleges and Employers/33
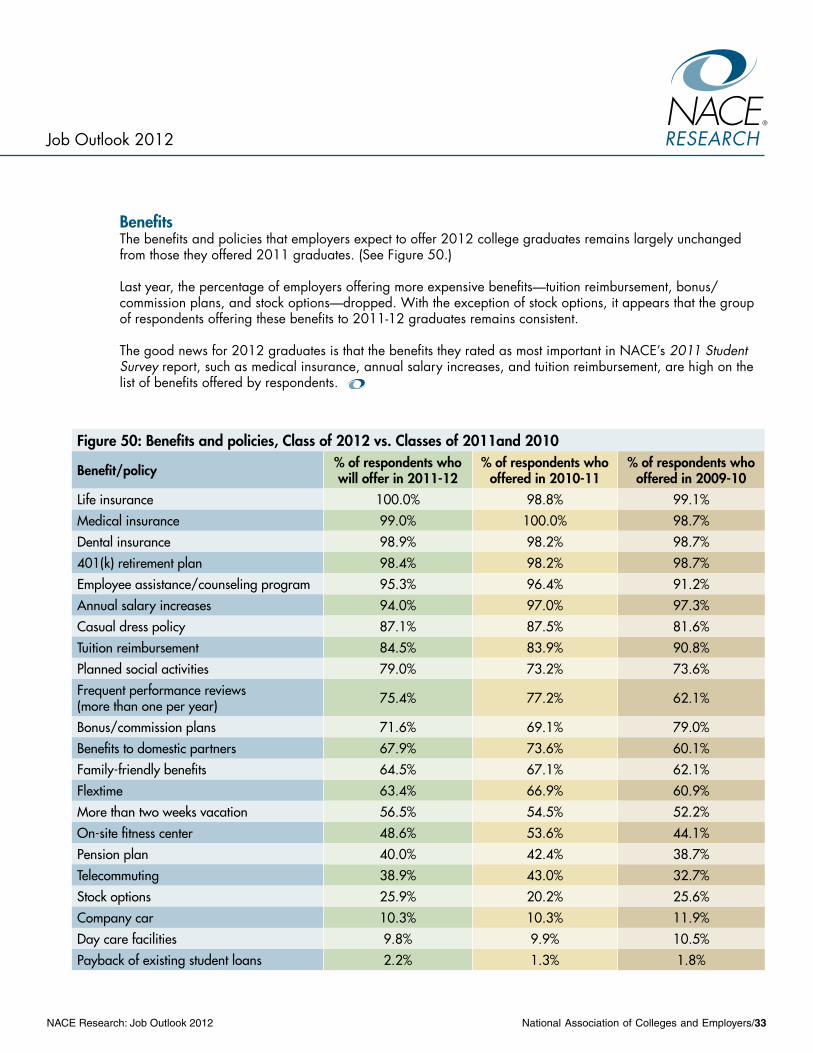
benefitsThe benefits and policies that employers expect to offer 2012 college graduates remains largely unchanged from those they offered 2011 graduates. (see Figure 50.)
last year, the percentage of employers offering more expensive benefits—tuition reimbursement, bonus/ commission plans, and stock options—dropped. With the exception of stock options, it appears that the group of respondents offering these benefits to 2011-12 graduates remains consistent.
The good news for 2012 graduates is that the benefits they rated as most important in NACE’s 2011 student survey report, such as medical insurance, annual salary increases, and tuition reimbursement, are high on the list of benefits offered by respondents.
Job Outlook 2012 ReseaRch
figure 50: benefits and policies, class of 2012 vs. classes of 2011and 2010
benefit/policy % of respondents who will offer in 2011-12
% of respondents who offered in 2010-11
% of respondents who offered in 2009-10
Life insurance 100.0% 98.8% 99.1%Medical insurance 99.0% 100.0% 98.7%Dental insurance 98.9% 98.2% 98.7%401(k) retirement plan 98.4% 98.2% 98.7%Employee assistance/counseling program 95.3% 96.4% 91.2%Annual salary increases 94.0% 97.0% 97.3%Casual dress policy 87.1% 87.5% 81.6%Tuition reimbursement 84.5% 83.9% 90.8%Planned social activities 79.0% 73.2% 73.6%Frequent performance reviews (more than one per year) 75.4% 77.2% 62.1%
Bonus/commission plans 71.6% 69.1% 79.0%Benefits to domestic partners 67.9% 73.6% 60.1%Family-friendly benefits 64.5% 67.1% 62.1%Flextime 63.4% 66.9% 60.9%More than two weeks vacation 56.5% 54.5% 52.2%On-site fitness center 48.6% 53.6% 44.1%Pension plan 40.0% 42.4% 38.7%Telecommuting 38.9% 43.0% 32.7%Stock options 25.9% 20.2% 25.6%Company car 10.3% 10.3% 11.9%Day care facilities 9.8% 9.9% 10.5%Payback of existing student loans 2.2% 1.3% 1.8%
NACE Research: Job Outlook 201234/National Association of Colleges and Employers
Job Outlook 2012ReseaRch
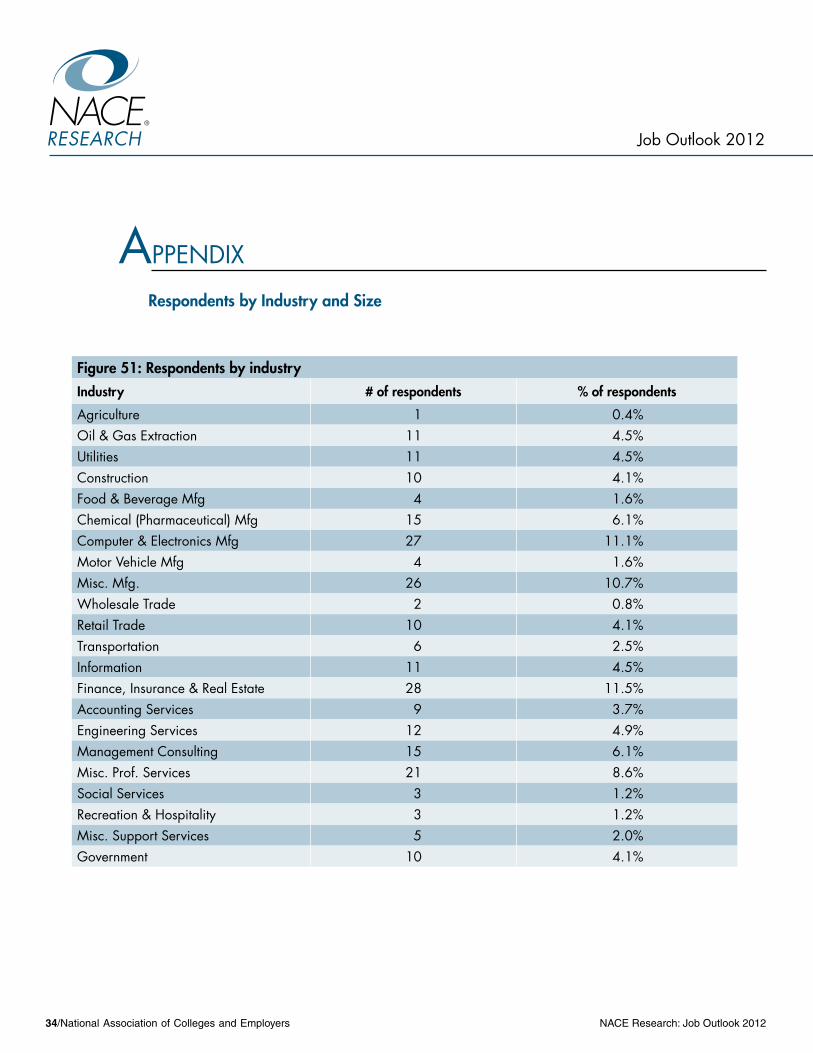
figure 51: respondents by industryindustry # of respondents % of respondents
Agriculture 1 0.4%Oil & Gas Extraction 11 4.5%Utilities 11 4.5%Construction 10 4.1%Food & Beverage Mfg 4 1.6%Chemical (Pharmaceutical) Mfg 15 6.1%Computer & Electronics Mfg 27 11.1%Motor Vehicle Mfg 4 1.6%Misc. Mfg. 26 10.7%Wholesale Trade 2 0.8%Retail Trade 10 4.1%Transportation 6 2.5%Information 11 4.5%Finance, Insurance & Real Estate 28 11.5%Accounting services 9 3.7%Engineering services 12 4.9%Management Consulting 15 6.1%Misc. Prof. services 21 8.6%social services 3 1.2%Recreation & Hospitality 3 1.2%Misc. support services 5 2.0%Government 10 4.1%
APPENDIx
respondents by industry and Size

NACE Research: Job Outlook 2012 National Association of Colleges and Employers/35
Adtran, Inc.Advanced Micro Devices, Inc.Agilent Technologies, Inc.Akamai TechnologiesAlbemarle CorporationAlcatel-lucentAllscriptsAmerican Airlines Inc.American Electric PowerAmerican Income life Insurance
CompanyAmerican Institute of Certified Public
AccountantsAmica Mutual Insurance CompanyAmway CorporationARAMARKARCADIs Us Inc.ArcelorMittal UsAArup & PartnersAthenahealth, Inc.Avanade Holdings llCBBVA Compass BankBechtel CorporationBell Helicopter Textron Inc.BP AmericaBrady Corp.Broadcom CorporationBurns & McDonnell Engineering
Co. Inc.CB Richard EllisCGI FederalChesapeake Energy CorporationChevron Phillips Chemical
Company lPCitrix systems, Inc.Cliffs Natural ResourcesCompass Group North Americacomscore, Inc.Con-way FreightConAgra Foods, Inc.ConocoPhillipsConsolidated GraphicsCree, Inc.Crestron ElectronicsCrossmarkCrowe Horwath llPCsT of AmericaDeere & CompanyDick’s sporting GoodsDiscover Financial servicesDominion Resources services, Inc.Dow Corning CorporationDuPontEaton CorporationEchostarEcolab Inc.
Edward JonesEmerson Climate TechnologiesEmerson Process Management - Fisher
Controls DivisionEntergy services, Inc.Enterprise Products, Inc.Ernst & Young llPFarm Credit Bank of TexasFDM Group Inc.Federal Energy Regulatory
CommissionFederal Reserve Bank of New YorkFifth Third BankFoster Wheeler AGFreddie MacGAP Inc.Gaylord EntertainmentGeneral Electric CompanyGlobal Tax Management, Inc.Goodman NetworksGoodrich CorporationGreat lakes Dredge & Dock CompanyHajoca CorporationHarris CorporationHCl TechnologiesHDR Inc.Heico Construction Group llCHitachi Consulting
Job Outlook 2012 ReseaRch
figure 52: respondents by size of department/business unitnumber of employees % of respondentsFewer than 500 17.6%500 - 1,000 7.0%1,001 - 2,500 15.6%2,501 - 5,000 12.3%5,001 - 10,000 15.6%More than 10,000 32.0%
participating OrganizationsBelow is a list of the organizations that responded to the Job Outlook 2012 survey. (Please note: Although 244 organizations responded, the list below includes 176, as 68 organizations preferred not to be listed.)
NACE Research: Job Outlook 201236/National Association of Colleges and Employers
Informatica CorporationIntegrys Energy Group, Inc.Jacobs Technology Inc.JCPenney Company, Inc.Johnson Controls, Inc.Kearney & CompanyKennedy & Coe llCKPMG llPl-3 Communications Integrated
systemslafarge North Americalennox International Inc.levi strauss & Co.liberty Mutual Insurance Companylink-Belt Construction Equipment Co.lowe’s Companies, Inc.lutron Electronics Co. Inc.Macy’s, Inc.Mars Chocolate UsMaxim Healthcare services, Inc.McKesson CorporationMeadWestvaco CorporationMeijer, Inc.MercerMerck & Co., Inc.Messer Construction Co.Met-Pro CorporationMichelin North AmericaMilliken & CompanyModern Woodmen of AmericaMoss Adams llPNAsA - John C. stennis space CenterNational InstrumentsNaval Acquisition Career Center
Naval Air systems Command (NAVAIR) - NAVAIR - Patuxent River
NetAppNewfield Exploration CompanyNewmont Mining CorporationNorthrop Grumman - Newport NewsNorthrop Grumman CorporationOregon Department of TransportationOwens CorningOwens-Illinois Inc.Pacific Gas and Electric CompanyParenteBeardPariveda solutions Inc.ParsonsPennsylvania Transformer
Technology, Inc.Philips North AmericaPhillips Plastics CorporationPPG Industries, Inc.Primesource Building Products, Inc.Procter & Gamble Co.Progress Energy service Co.Progressive InsurancePsEGQuestar CorporationRalcorp Holdings, Inc.Raytheon CompanyRobert Bosch llCRogers CorporationROHM semiconductor UsA, llCRosettasabre Holdingssapient Corporationsavannah River Nuclear solutions
schlumberger Oilfield servicessears Holdings Corporationselden Fox lTDsensata Technologiessiemens Corporationsoutheastern Cooperative Educational
Programs (sECEP)state street Corporationsuffolk Construction Company, Inc.sWIFTTE ConnectivityTennessee Valley AuthorityTeradata CorporationThe Dow Chemical CompanyThe Hertz CorporationThe Northern Trust CompanyThe Timken CompanyThermo Fisher scientific Inc.Tindall CorporationTokyo Electron U.s. Holdings, Inc.Total Quality logistics, Inc.Towers WatsonTriage Consulting GroupTriTek solutions, Inc.TTx CompanyTurner Broadcasting system, Inc.Turner Construction CompanyU.s. Coast GuardU.s. Comptroller of the CurrencyUnion BankW.W. Grainger, Inc.Watson Pharmaceuticals, Inc.Westat Inc.Wipro Technologies
National Association of Colleges and Employers 62 Highland Avenue • Bethlehem, PA 18017-9085 • 800.544.5272FAX: 610.868.0208 • www.naceweb.org
Job Outlook 2012ReseaRch