job outlook 2015 11 | 2014 · 4 | job outlook 2015 | national association of colleges and employers...
TRANSCRIPT

National Association of Colleges and Employers62 Highland Avenue • Bethlehem, PA 18017-9085 • 610.868.1421FAX: 610.868.0208 • www.naceweb.org
©Copyright November 2014 by the National Association of Colleges and Employers
Job Outlook 2015
Free to NACE members / $49.95 list price
11 |
201
4

2 | Job Outlook 2015 | National Association of Colleges and Employers
ABOUT THE JOB OUTLOOK 2015 SURVEY ...................................................................................................... 4
U.S. COLLEGE HIRING TO INCREASE 8.3 PERCENT ........................................................................................... 5Figure 1: Job Outlook hiring projections, 2009 – 2015Figure 2: Employers’ hiring expectationsJob Market RatingsFigure 3: Employers rate the job market for 2014-15 graduatesFigure 4: Available vs. unfilled positions for 2013-14, 2012-13, 2011-12, and 2010-11 graduatesReassessing Hiring PlansFigure 5: Employers’ plans to reassess hiring needsSpring Recruiting Plans Figure 6: Percentage of college recruiting conducted in fall vs. spring, 2011-2015Figure 7: Spring 2015 recruiting plansRecruiting MethodsFigure 8: Change in recruiting methods, 2011-2015, by percent of respondentsHiring by IndustryFigure 9: Total change in hiring, by industry Figure 10: Spring 2015 on-campus recruiting plans, by industryFigure 11: Job market ratings, by industryHiring by RegionFigure 12: Total change in hiring, by regionFigure 13: Hiring expectations by region, by percent of respondentsFigure 14: Spring 2015 recruiting plans, by region
WHO’S IN DEMAND? ................................................................................................................................ 15Figure 15: Hiring expectations, by degree levelFigure 16: Top degrees in demand, by broad categoryFigure 17: Top degrees in demand, by degree level and broad categoryFigure 18: Top degrees in demand (bachelor’s degree level)Figure 19: Top business degrees in demandFigure 20: Top engineering degrees in demandFigure 21: Top computer and information science degrees in demandFigure 22: Top math and science degrees in demandFigure 23: Top communications degrees in demandFigure 24: Top social sciences degrees in demandFigure 25: Top humanities degrees in demandFigure 26: Top degrees in demand (master’s degree level)Figure 27: Top degrees in demand (doctorate degree level)
TABLE OF CONTENTS

National Association of Colleges and Employers | Job Outlook 2015 | 3
2003-04 JOB MARKET: EMPLOYER PERSPECTIVES
Copyright 2014 by the National Association of Colleges and Employers (NACE). No part of this publication may be used, adapted, or reproduced in any manner whatsoever without the written permission of NACE. Electronic reproduction is prohibited. NACE college and employer members have the permission of NACE, copyright holder, to download and photocopy this report for internal purposes only. Photocopies must include this copyright notice.
Figure 28: Top five undergraduate majors—NortheastFigure 29: Top five undergraduate majors—SoutheastFigure 30: Top five undergraduate majors—MidwestFigure 31: Top five undergraduate majors—WestFigure 32: Who’s hiring, by industry (bachelor’s degree level)Figure 33: Who’s hiring, by region (bachelor’s degree level)International Student Hiring PlansFigure 34: International student hiring plans, 2010 – 2015Figure 35: International student hiring plans, by industryFigure 36: International student hiring plans, by region
HOW EMPLOYERS VIEW CANDIDATES ......................................................................................................... 30Figure 37: Screen candidates by GPA, by percent of respondentsFigure 38: Screen candidates by GPA, by industryFigure 39: Attributes employers seek on a candidate’s resumeFigure 40: Influence of attributesFigure 41: Employers rate the importance of candidate skills/qualitiesFigure 42: Employers’ hiring preferences relative to experience, by percent of respondentsFigure 43: Employers’ preference as to how work experience was gained, by percent of respondents Employers Grade Candidate Attributes Figure 44: Employers grade their average new graduate recruits on skills/attributes
COMPENSATION AND SIGNING BONUSES .................................................................................................. 37Starting SalariesFigure 45: Employers with plans to increase starting salaries to bachelor’s degree graduatesFigure 46: Employers with plans to increase starting salaries, by industryFigure 47: Employers with plans to increase starting salaries, by regionSigning BonusesFigure 48: Employers offering signing bonusesFigure 49: Percent of employers offering signing bonuses to 2014-15 graduates, by industryFigure 50: Percent of employers offering signing bonuses to 2014-15 graduates, by regionFigure 51: Average signing bonus, by major (bachelor’s degrees)Figure 52: Average signing bonus, by major (master’s degrees)
APPENDIX ................................................................................................................................................ 42 Figure 53: Respondents by size of department/business unit Figure 54: Respondents by industry Participating Organizations
4 | Job Outlook 2015 | National Association of Colleges and Employers
ABOUT THE JOB OUTLOOK 2015 SURVEY
The Job Outlook survey is a forecast of hiring intentions of employers as they relate to new college graduates. Each year, the National Association of Colleges and Employers (NACE) surveys its employer members about their hiring plans and other employment-related issues in order to project the market for new college graduates for the current class and to assess a variety of conditions that may influence that market.
Data were collected for the Job Outlook 2015 survey from August 11, 2014, through October 7, 2014. A total of 260 surveys were returned—a 25 percent response rate.
Of those responding, 18.1 percent of respondents were from the West, 24.2 percent were from the Northeast, 26.5 percent were from the Southeast, and 31.2 percent were from the Midwest. For a list of respondents by industry and size, and a partial list of organizations that supplied data for this report, see pages 42 - 44.
Totals throughout the report may not equal 100 percent due to rounding.
NACE expects to provide a formal update of job market information once more in the 2014-15 academic year: The Job Outlook 2015 Spring Update survey (data collected in February – March 2015) will give NACE members a final update on hiring for 2014-15 graduates. Results will be available in early April 2015.
RESEARCH:Director of Research, Public Policy, and Legislative Affairs: Edwin W. KocResearch Manager: Andrea J. KonczResearch Associate: Kenneth C. TsangResearch Assistant: Anna Longenberger

Class of 2015
7.8% 8.6%
2.1%
Class of 2009 Class of 2010
1.3%
-21.6%
Class of 2011-6.9%
5.3%
Class of 2012
13.5%
19.3%
Class of 2013
9.5% 10.2%
Class of 2014
13.0% Fall Preview
Spring Update
8.3%
2.1%
National Association of Colleges and Employers | Job Outlook 2015 | 5
U.S. COLLEGE HIRING TOINCREASE 8.3 PERCENT
Last spring, employers indicated that their final plans for Class of 2014 graduates would be to increase hiring by 8.6 percent. For Class of 2015 graduates, the initial projection is very similar, as employers plan to hire 8.3 percent more new college graduates for their U.S. operations than they did from the Class of 2014. (See Figure 1.)
In addition to the U.S. positions, more than one-quarter of employers report that they recruit college graduates for positions outside of the United States. The hiring projection for international positions is expected to increase for Class of 2015 graduates also, but by just 3.2 percent. The overall hiring projection for U.S. and international graduates for both U.S. and international positions will increase by 7.5 percent for the Class of 2015.
Figure 1: Job Outlook hiring projections, 2009-2015*
*Years 2014 and 2015 are the hiring projection for U.S. locations only. Prior years’ projections are shown for informational purposes only, and should not be compared to the 2014 and 2015 projection.
6 | Job Outlook 2015 | National Association of Colleges and Employers
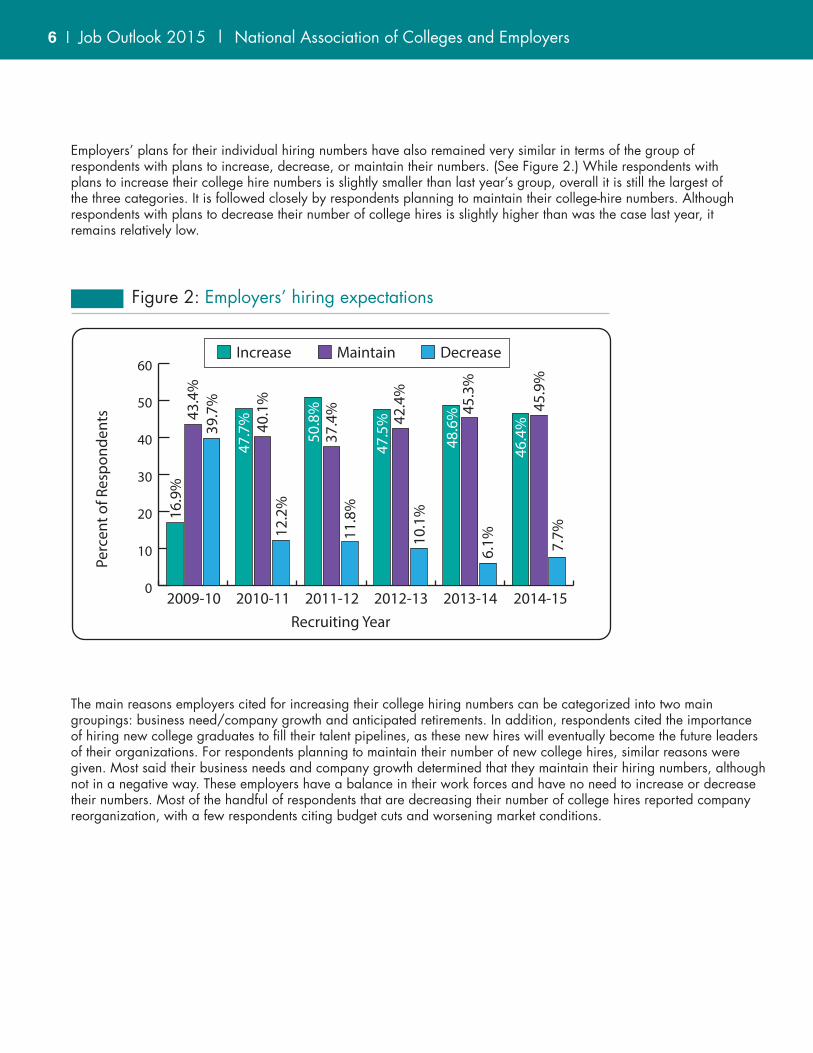
Figure 2: Employers’ hiring expectations
Recruiting Year
Perc
ent o
f Res
pond
ents
0
10
20
30
40
50
60
2009-10 2010-11 2011-12 2012-13 2013-14 2014-15
Increase Maintain Decrease
45.9
%46
.4%
7.7%
43.4
%39
.7%
16.9
%
47.7
% 40.1
%12
.2%
50.8
%37
.4%
11.8
%
47.5
% 42.4
%10
.1%
48.6
% 45.3
%6.
1%
The main reasons employers cited for increasing their college hiring numbers can be categorized into two main groupings: business need/company growth and anticipated retirements. In addition, respondents cited the importance of hiring new college graduates to fill their talent pipelines, as these new hires will eventually become the future leaders of their organizations. For respondents planning to maintain their number of new college hires, similar reasons were given. Most said their business needs and company growth determined that they maintain their hiring numbers, although not in a negative way. These employers have a balance in their work forces and have no need to increase or decrease their numbers. Most of the handful of respondents that are decreasing their number of college hires reported company reorganization, with a few respondents citing budget cuts and worsening market conditions.
Employers’ plans for their individual hiring numbers have also remained very similar in terms of the group of respondents with plans to increase, decrease, or maintain their numbers. (See Figure 2.) While respondents with plans to increase their college hire numbers is slightly smaller than last year’s group, overall it is still the largest of the three categories. It is followed closely by respondents planning to maintain their college-hire numbers. Although respondents with plans to decrease their number of college hires is slightly higher than was the case last year, it remains relatively low.

National Association of Colleges and Employers | Job Outlook 2015 | 7
Job Market Rating
Perc
ent o
f Res
pond
ents
0
10
20
30
40
50
60
70
80
Excellent Very Good Good Fair Poor
2014-15 2013-14 2012-13
3.6%
1.1% 2.1%
16.5
%14
.9%
33.2
%
51.6
%60
.4%
48.5
%
11.2
% 20.9
% 33.5
%
0.4%
1.1%
1.0%
Figure 3: Employers rate the job market for 2014-15 graduates
Job Market RatingsMost employers continue to rate the overall job market as “good.” (See Figure 3.) And, while the “excellent” and “poor” ratings remain nearly level, the group of respondents providing a “very good” rating has jumped to almost one-third of respondents. Slightly more than 11 percent of employers rated the market as “fair.”
Available vs. Unfilled Positions for College GraduatesEmployers taking part in the current survey were asked to comment on their recruiting success over the past few years. How many openings did they have? How many went unfilled?
As Figure 4 indicates, the average number of openings and the average number of unfilled positions rose sharply with the Class of 2014. Employers had an average number of 251 positions available (up from up from 171 for the Class of 2013), and left an average of 14 seats empty—-nearly double the number of unfilled spots among Class of 2013 grads.
Recruiting YearTotal Number of Available
Positions
Average Number of Available
Positions
Total Number of Unfilled Positions
Average Number of Unfilled Positions
Percent of Unfilled to Available Positions
2013-14 46,609 251 2,591 14 5.6%
2012-13 24,834 171 1,126 8 4.5%
2011-12 24,854 152 855 5 3.4%
2010-11 24,356 148 1,172 7 4.8%
Figure 4: Available vs. unfilled positions for 2013-2014, 2012-13, 2011-2012, and 2010-11 graduates
Job Outlook Survey Year Fall Spring
2015 66% 34%
2014 62% 38%
2013 68% 32%
2012 65% 35%
2011 64% 36%
Figure 6: Percentage of college recruiting conducted in fall vs. spring, 2011-2015
8 | Job Outlook 2015 | National Association of Colleges and Employers
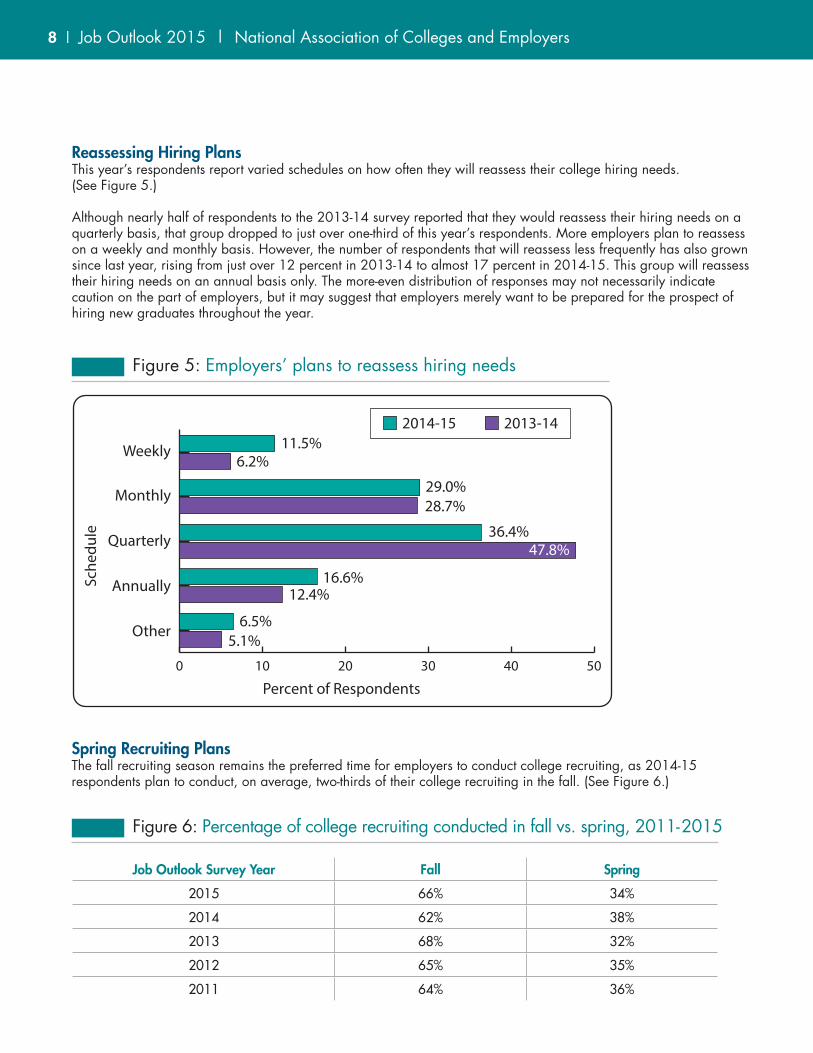
Reassessing Hiring Plans This year’s respondents report varied schedules on how often they will reassess their college hiring needs. (See Figure 5.)
Although nearly half of respondents to the 2013-14 survey reported that they would reassess their hiring needs on a quarterly basis, that group dropped to just over one-third of this year’s respondents. More employers plan to reassess on a weekly and monthly basis. However, the number of respondents that will reassess less frequently has also grown since last year, rising from just over 12 percent in 2013-14 to almost 17 percent in 2014-15. This group will reassess their hiring needs on an annual basis only. The more-even distribution of responses may not necessarily indicate caution on the part of employers, but it may suggest that employers merely want to be prepared for the prospect of hiring new graduates throughout the year.
Percent of Respondents
Sche
dule
0 10 20 30 40 50
Weekly
Monthly
Quarterly
Annually
Other
2014-15 2013-1411.5%
6.2%
6.5%5.1%
16.6%12.4%
29.0%28.7%
36.4%47.8%
Figure 5: Employers’ plans to reassess hiring needs
Spring Recruiting Plans The fall recruiting season remains the preferred time for employers to conduct college recruiting, as 2014-15 respondents plan to conduct, on average, two-thirds of their college recruiting in the fall. (See Figure 6.)
Change % of 2015 Respondents
% of 2014 Respondents
% of 2013 Respondents
% of 2012 Respondents
% of 2011 Respondents
Using more social networks 64.7% 50.9% 57.3% 57.1% 41.1%
Using more technology in general 60.9% 48.5% 59.6% 58.3% 42.6%
Change in branding 42.4% 38.2% 34.8% 41.7% 33.5%
Attending more career fairs 32.1% 33.3% 39.3% 42.3% 28.4%
Attending fewer career fairs 23.9% 23.6% 24.7% 27.4% 28.9%
Less travel 20.1% 21.8% 21.3% 18.3% 19.3%
More travel 19.6% 18.2% 21.9% 22.3% 15.2%
Other 13.0% 14.5% 18.5% 13.1% 18.3%
Figure 8: Change in recruiting methods, 2011-2015, by percent of respondents
Although most recruiting is planned for the fall, spring 2015 recruiting plans look promising, with almost half of respondents saying they have firm plans in place. (See Figure 7.) The best news is that fewer than 1 percent of respondents report that they are not hiring at all during the spring 2015 recruiting season.
Recruiting Plans Spring 2015 Spring 2014
Firm recruiting plans 47.0% 42.9%
Tentative plans in place 23.7% 30.3%
All recruiting in Fall 19.2% 13.7%
Unsure 9.1% 10.3%
Not hiring 0.9% 2.9%
Figure 7: Spring 2015 recruiting plans
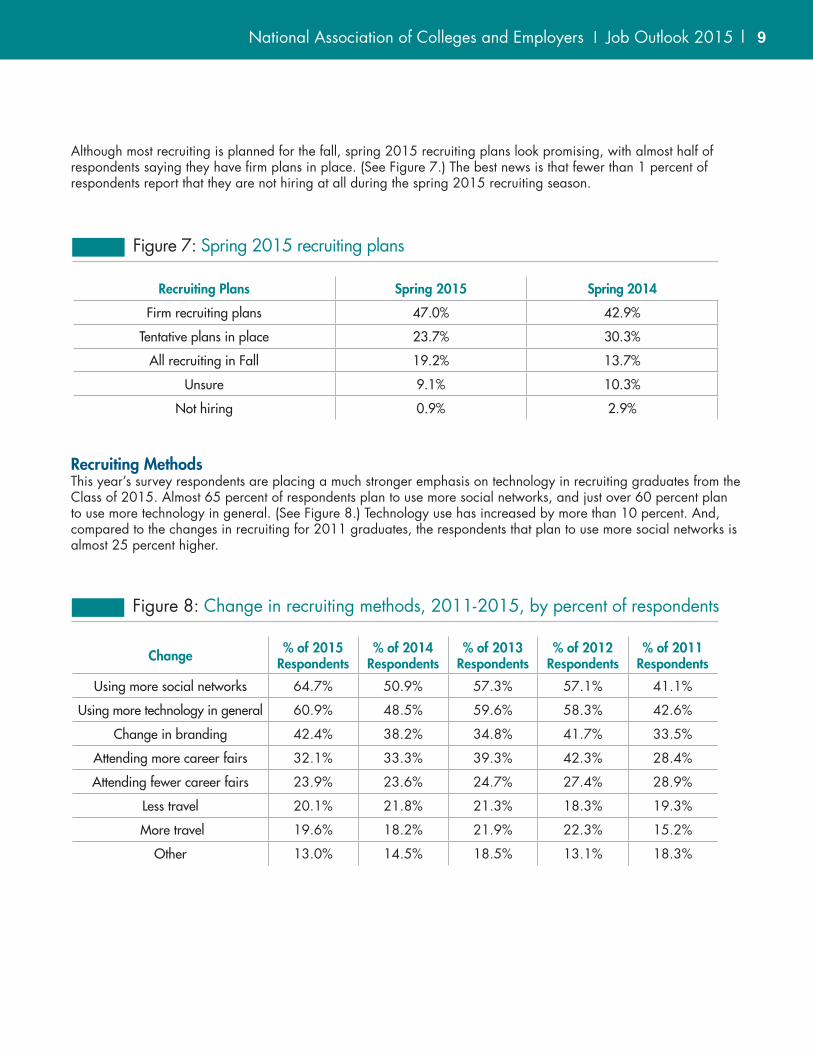
Recruiting MethodsThis year’s survey respondents are placing a much stronger emphasis on technology in recruiting graduates from the Class of 2015. Almost 65 percent of respondents plan to use more social networks, and just over 60 percent plan to use more technology in general. (See Figure 8.) Technology use has increased by more than 10 percent. And, compared to the changes in recruiting for 2011 graduates, the respondents that plan to use more social networks is almost 25 percent higher.
National Association of Colleges and Employers | Job Outlook 2015 | 9

Industry # of 2015 Projected Hires
# of 2014 Actual Hires % Change # of
Respondents
Oil & Gas Extraction 1,232 1,008 22.2% 6
Utilities 370 272 36.0% 6
Construction 1,809 1,762 2.7% 14
Food & Beverage Mfg. 750 651 15.2% 7
Chemical (Pharmaceutical) Mfg. 2,213 2,260 -2.1% 21
Computer & Electronics Mfg. 3,737 3,433 8.9% 10
Misc. Mfg. 880 717 22.7% 18
Wholesale Trade 179 107 66.8% 5
Retail Trade 1,355 937 44.6% 7
Information 1,014 1,562 -35.1% 11
Finance, Insurance, & Real Estate 3,298 3,585 -8.0% 16
Accounting Services 8,055 6,646 21.2% 5
Engineering Services 1,162 1,223 -5.0% 13
Management Consulting 1,473 1,301 13.2% 12
Misc. Prof. Services 709 637 11.3% 17
Misc. Support Services 227 233 -2.6% 5
Government 771 688 12.1% 7
*Hiring projections are for U.S. locations only. (Only industries with 5 or more respondents are represented here.)
Figure 9: Total change in hiring, by industry*
10 | Job Outlook 2015 | National Association of Colleges and Employers
Hiring by IndustryNearly three-quarters of the industries shown in Figure 9 report increases in hiring for Class of 2015 graduates for their U.S. positions. In the five industries where decreases are reported, the individual responses provide a clear picture of the reasons behind the decreases.
While it appears that employers in the information sector are reducing their hiring the most, of the 11 information respondents, just four are cutting back on their college hires. Two of those planning decreases say decreases will be in excess of 35 percent. The remaining seven respondents are all increasing their hiring, with none in this sector maintaining their number of new college hires.
In the case of finance, insurance, and real estate employers, a similar finding is true. Of the 16 total respondents, only four are decreasing hires, with two of those respondents cutting their numbers by 80 percent or more. Of the nine respondents in the finance, insurance, and real estate sector that are increasing their hiring, one respondent is planning to more than double its college hire numbers, but this large increase isn’t enough to offset the two large decreases of the sector.
(Please note: Industry projections for the Class of 2015 graduates should be examined with caution as some sectors contain a small number of respondents. Only industries with five or more respondents are listed. Additionally, due to the small number of respondents in some industries, overall percentages may be easily skewed by one or two respondents.)

National Association of Colleges and Employers | Job Outlook 2015 | 11
Industry Firm Plans in Place
Tentative Plans
All Recruiting
in Fall 2014
Not Hiring Unsure # of Respondents
Oil & Gas Extraction 28.6% 14.3% 57.1% 0.0% 0.0% 7
Utilities 83.3% 16.7% 0.0% 0.0% 0.0% 6
Construction 60.0% 6.7% 26.7% 0.0% 6.7% 15
Food & Beverage Mfg. 42.9% 28.6% 14.3% 0.0% 14.3% 7
Chemical (Pharmaceutical) Mfg. 17.4% 21.7% 39.1% 0.0% 21.7% 23
Computer & Electronics Mfg. 61.5% 23.1% 7.7% 0.0% 7.7% 13
Motor Vehicle Mfg. 66.7% 0.0% 0.0% 0.0% 33.3% 6
Misc. Mfg. 61.9% 28.6% 4.8% 0.0% 4.8% 21
Wholesale Trade 40.0% 20.0% 0.0% 0.0% 40.0% 5
Retail Trade 44.4% 22.2% 22.2% 0.0% 11.1% 9
Information 50.0% 42.9% 7.1% 0.0% 0.0% 14
Finance, Insurance, & Real Estate 31.6% 26.3% 31.6% 0.0% 10.5% 19
Accounting Services 33.3% 33.3% 16.7% 0.0% 16.7% 6
Engineering Services 57.1% 28.6% 14.3% 0.0% 0.0% 14
Management Consulting 23.1% 23.1% 46.2% 0.0% 7.7% 13
Misc. Prof. Services 47.1% 23.5% 11.8% 5.9% 11.8% 17
Misc. Support Services 80.0% 20.0% 0.0% 0.0% 0.0% 5
Government 57.1% 14.3% 28.6% 0.0% 0.0% 7
Figure 10: Spring 2015 on-campus recruiting plans, by industry
Figures 10 and 11 also show other important components of the analysis by industry in spring 2015 recruiting plans and job market ratings. While information employers show the largest planned decrease in hiring in Figure 9, they rate the job market specific to their industry higher than any of the other employer types (Figure 11). In addition, almost 93 percent of information respondents have firm or tentative plans in place for spring 2015 on-campus recruiting (Figure 10), with the remaining 7 percent completing all of their recruiting this fall. There are no information respondents that are unsure of their spring 2015 recruiting plans or that won’t be on campus because they are not hiring.
On the other hand, utilities companies rate the job market for their industry as “good,” and they are planning an overall increase in hiring of 36 percent. All of their respondents have firm or tentative plans for spring 2015 on-campus recruiting.

12 | Job Outlook 2015 | National Association of Colleges and Employers
Industry Average Rating # of Respondents
Information 4.21 14
Accounting Services 4.00 6
Construction 3.87 15
Management Consulting 3.85 13
Wholesale Trade 3.80 5
Transportation 3.80 5
Engineering Services 3.71 14
Computer & Electronics Mfg. 3.62 13
Misc. Support Services 3.60 5
Finance, Insurance, & Real Estate 3.58 19
Government 3.57 7
Misc. Prof. Services 3.53 17
Oil & Gas Extraction 3.43 7
Food & Beverage Mfg. 3.43 7
Misc. Mfg. 3.32 22
Chemical (Pharmaceutical) Mfg. 3.26 23
Retail Trade 3.20 10
Utilities 3.14 7
Motor Vehicle Mfg. 2.83 6
(*5-point scale, where 1=Poor, 2=Fair, 3=Good, 4=Very good, 5=Excellent)
Figure 11: Job market ratings, by industry

National Association of Colleges and Employers | Job Outlook 2015 | 13
Region # of 2015 Projected Hires
# of 2014 Actual Hires % Change # of
Respondents
Northeast 15,562 13,178 18.1% 43
Southeast 7,202 7,375 -2.3% 59
Midwest 6,652 5,967 11.5% 58
West 4,573 4,856 -5.8% 33
Figure 12: Total change in hiring, by region
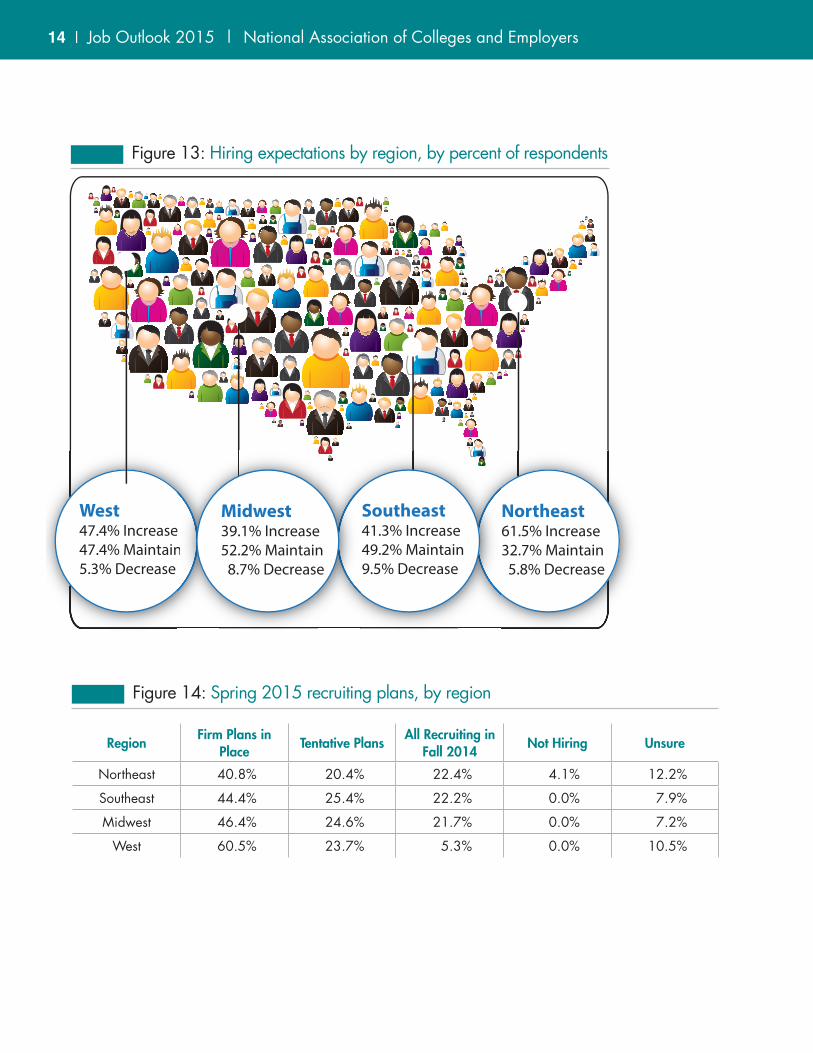
Hiring by RegionAs Figure 12 indicates, hiring projections by region are split: Two regions project increases, while two project decreases.
Employers in the Northeast are most optimistic; interestingly, however, this region is home to the largest group of employers that are either not hiring in the spring or are unsure of their spring recruiting plans. (See Figure 14.)
The Western region posted the largest decrease, but much of the drop reflects the poor outlook of the information industry. Of the 33 responding employers in the West, eight represent information organizations, pulling down the hiring expectations for the region.
The Southeast also posted a decrease in hiring plans. Almost one-tenth of respondents in the Southeast report plans to cut back on hiring; these responses are dragging down overall hiring projections.
14 | Job Outlook 2015 | National Association of Colleges and Employers
Region Firm Plans in Place Tentative Plans All Recruiting in
Fall 2014 Not Hiring Unsure
Northeast 40.8% 20.4% 22.4% 4.1% 12.2%
Southeast 44.4% 25.4% 22.2% 0.0% 7.9%
Midwest 46.4% 24.6% 21.7% 0.0% 7.2%
West 60.5% 23.7% 5.3% 0.0% 10.5%
Figure 14: Spring 2015 recruiting plans, by region
Figure 13: Hiring expectations by region, by percent of respondents
West47.4% Increase47.4% Maintain5.3% Decrease
Northeast61.5% Increase32.7% Maintain 5.8% Decrease
Southeast41.3% Increase49.2% Maintain9.5% Decrease
en
Midwest39.1% Increase52.2% Maintain 8.7% Decrease
National Association of Colleges and Employers | Job Outlook 2015 | 15
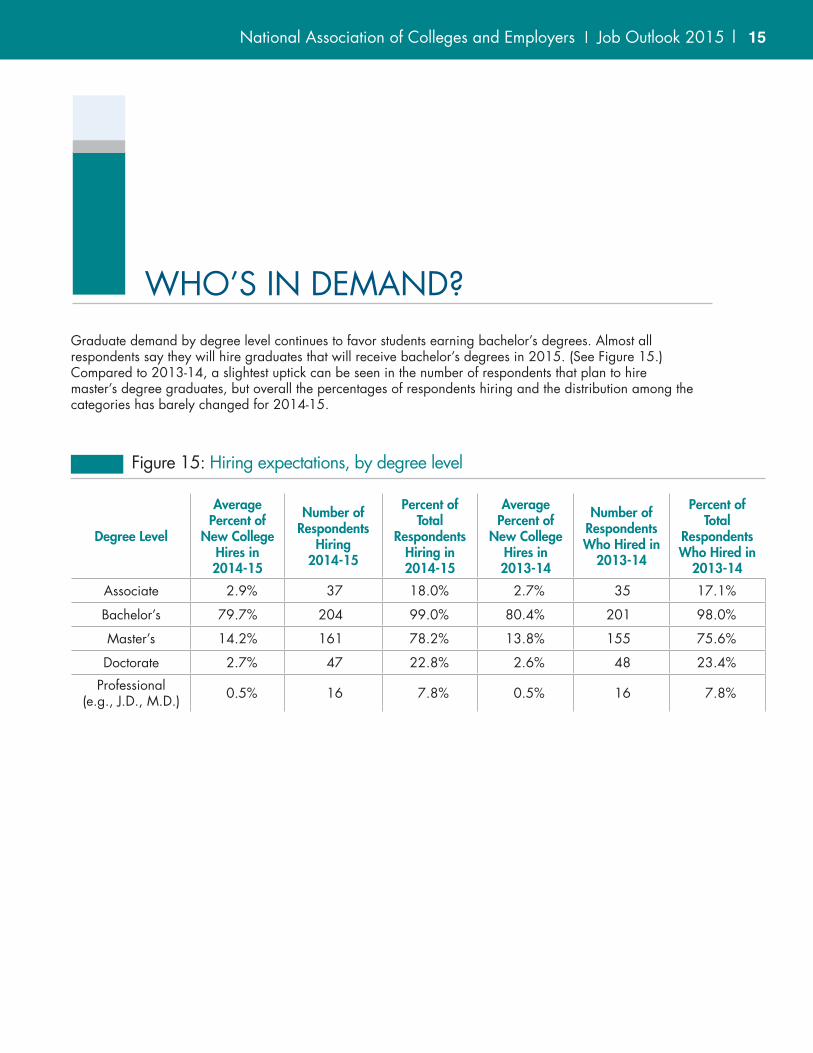
Degree Level
Average Percent of
New College Hires in 2014-15
Number ofRespondents
Hiring 2014-15
Percent of Total
Respondents Hiring in 2014-15
Average Percent of
New College Hires in 2013-14
Number ofRespondents Who Hired in
2013-14
Percent of Total
Respondents Who Hired in
2013-14
Associate 2.9% 37 18.0% 2.7% 35 17.1%
Bachelor’s 79.7% 204 99.0% 80.4% 201 98.0%
Master’s 14.2% 161 78.2% 13.8% 155 75.6%
Doctorate 2.7% 47 22.8% 2.6% 48 23.4%
Professional (e.g., J.D., M.D.) 0.5% 16 7.8% 0.5% 16 7.8%
Figure 15: Hiring expectations, by degree level
WHO’S IN DEMAND?Graduate demand by degree level continues to favor students earning bachelor’s degrees. Almost all respondents say they will hire graduates that will receive bachelor’s degrees in 2015. (See Figure 15.) Compared to 2013-14, a slightest uptick can be seen in the number of respondents that plan to hire master’s degree graduates, but overall the percentages of respondents hiring and the distribution among the categories has barely changed for 2014-15.

16 | Job Outlook 2015 | National Association of Colleges and Employers
Broad Category # of Respondents That Will Hire % of Total Respondents (n=223)
Business 180 80.7%
Engineering 166 74.4%
Computer & Information Sciences 128 57.4%
Math & Sciences 86 38.6%
Communications 60 26.9%
Social Sciences 50 22.4%
Humanities 30 13.5%
Agriculture & Natural Resources 20 9.0%
Healthcare 16 7.2%
Education 6 2.7%
Figure 16: Top degrees in demand, by broad category
In the current survey, employers were asked to report on their hiring intentions for all broad categories of majors, individual majors, and degree levels.
By overall broad category, regardless of degree level, graduates of the business, engineering, and computer and information sciences disciplines are most in demand. (See Figure 16.)
At the associate, bachelor’s, and master’s degree level, math and sciences graduates follow closely behind. (See Figure 17.)
At the doctorate degree level, engineering graduates prevail, with math and sciences and computer and information sciences rounding out the top three fields in demand.

National Association of Colleges and Employers | Job Outlook 2015 | 17
Associate Broad Category # of Respondents That Will Hire % of Total Respondents (n=223)
Business 7 3.1%
Engineering 6 2.7%
Computer & Information Sciences 3 1.3%
Math & Sciences 2 0.9%
Communications 2 0.9%
Social Sciences 1 0.4%
Humanities 1 0.4%
Healthcare 1 0.4%
Education 1 0.4%
Agriculture & Natural Resources 0 0.0%
Bachelor’s Broad Category # of Respondents That Will Hire % of Total Respondents (n=223)
Business 166 74.4%
Engineering 158 70.9%
Computer & Information Sciences 126 56.5%
Math & Sciences 79 35.4%
Communications 57 25.6%
Social Sciences 49 22.0%
Humanities 24 10.8%
Agriculture & Natural Resources 17 7.6%
Healthcare 15 6.7%
Education 3 1.3%
continued
Figure 17: Top degrees in demand, by degree level and broad category

18 | Job Outlook 2015 | National Association of Colleges and Employers
Master’s Broad Category # of Respondents That Will Hire % of Total Respondents (n=223)
Business 91 40.8%
Engineering 74 33.2%
Computer & Information Sciences 55 24.7%
Math & Sciences 36 16.1%
Social Sciences 10 4.5%
Communications 9 4.0%
Healthcare 6 2.7%
Agriculture & Natural Resources 5 2.2%
Humanities 5 2.2%
Education 2 0.9%
Doctorate Broad Category # of Respondents That Will Hire % of Total Respondents (n=223)
Engineering 30 13.5%
Math & Sciences 23 10.3%
Computer & Information Sciences 11 4.9%
Business 6 2.7%
Agriculture & Natural Resources 2 0.9%
Education 1 0.4%
Humanities 1 0.4%
Social Sciences 1 0.4%
Communications 0 0.0%
Healthcare 0 0.0%
Figure 17 continued: Top degrees in demand, by degree level and broad category

National Association of Colleges and Employers | Job Outlook 2015 | 19
Major # of Respondents That Will Hire % of Total Respondents That Will Hire
Finance 128 57.4%
Accounting 125 56.1%
Computer Science 120 53.8%
Mechanical Engineering 116 52.0%
Business Administration/Mgmt. 106 47.5%
Electrical Engineering 104 46.6%
Information Sciences & Systems 101 45.3%
Marketing 93 41.7%
Logistics/Supply Chain 91 40.8%
Management Information Systems 87 39.0%
Figure 18: Top degrees in demand (bachelor’s degree level)
Individual majors most in demand at the bachelor’s degree level include finance, accounting, and computer science. (See Figure 18.) These same three majors have topped the list since 2012.
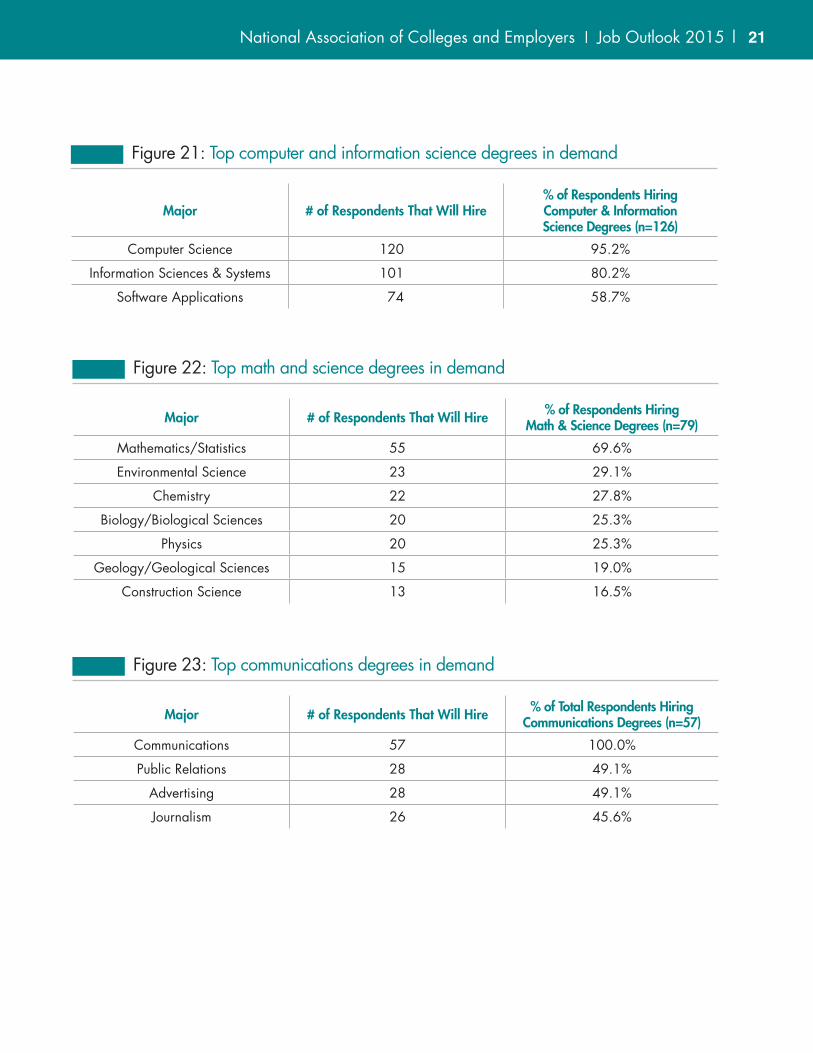
Figures 19 through 25 show the demand by major within the top seven broad categories in demand at the bachelor’s degree level.
Highlights include:
• Of employers that will hire new grads with business degrees, more than three-quarters will hire finance and accounting majors. (See Figure 19.)
• Students earning mechanical engineering or electrical engineering degrees will be targeted by more than half of the respondents that will hire engineering degrees. (See Figure 20.)
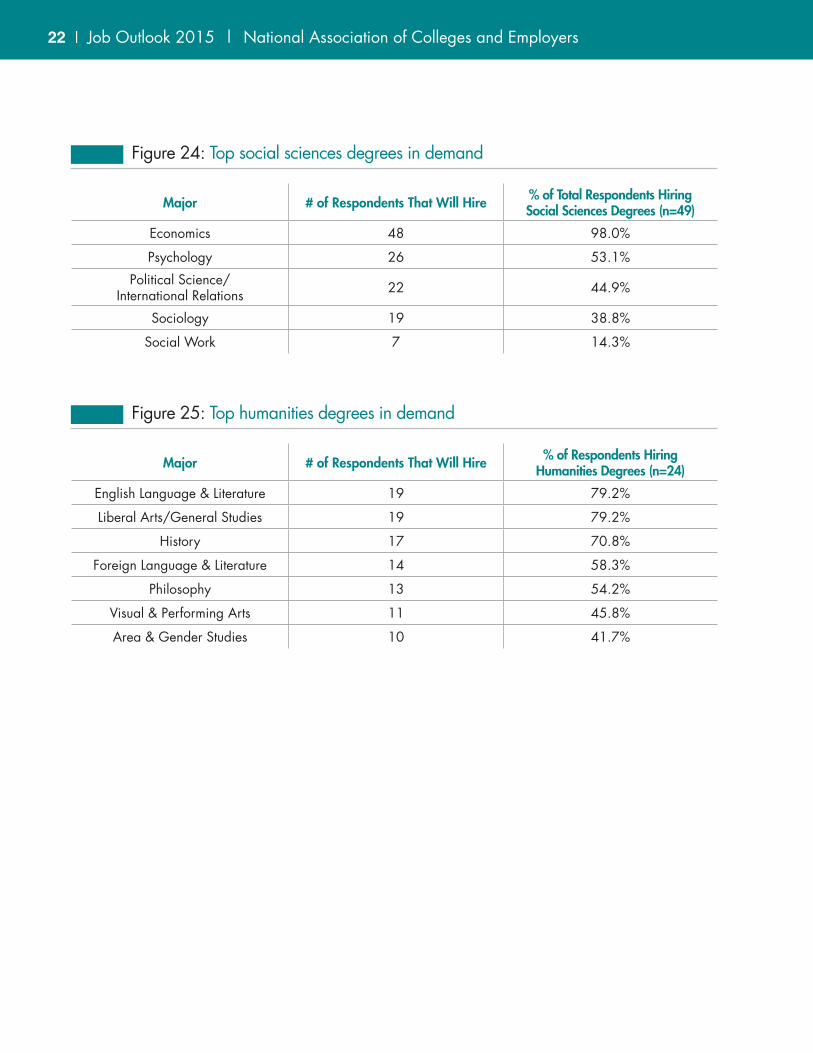
• Within the humanities disciplines, English and liberal arts/general studies majors are most in demand. (See Figure 25.)

20 | Job Outlook 2015 | National Association of Colleges and Employers
Major # of Respondents That Will Hire % of Respondents Hiring Engineering Degrees (n=158)
Mechanical Engineering 116 73.4%
Electrical Engineering 104 65.8%
Computer Engineering 73 46.2%
Chemical Engineering 70 44.3%
Industrial/Manufacturing Engineering 65 41.1%
Civil Engineering 64 40.5%
Engineering Technology 48 30.4%
Systems Engineering 43 27.2%
Environmental Engineering 38 24.1%
Materials Engineering/Science 36 22.8%
Aerospace/Aeronautical Engineering 22 13.9%
Biomedical Engineering 21 13.3%
Petroleum Engineering 15 9.5%
Nuclear Engineering 13 8.2%
Figure 20: Top engineering degrees in demand
Major # of Respondents That Will Hire % of Respondents Hiring Business Degrees (n=166)
Finance 128 77.1%
Accounting 125 75.3%
Business Administration/Mgmt. 106 63.9%
Marketing 93 56.0%
Logistics/Supply Chain 91 54.8%
Management Information Systems 87 52.4%
Human Resources 71 42.8%
Sales 69 41.6%
International Business 38 22.9%
Actuary 19 114%
Hospitality Management 14 8.4%
Figure 19: Top business degrees in demand
National Association of Colleges and Employers | Job Outlook 2015 | 21
Major # of Respondents That Will Hire % of Total Respondents Hiring Communications Degrees (n=57)
Communications 57 100.0%
Public Relations 28 49.1%
Advertising 28 49.1%
Journalism 26 45.6%
Major # of Respondents That Will Hire % of Respondents Hiring Math & Science Degrees (n=79)
Mathematics/Statistics 55 69.6%
Environmental Science 23 29.1%
Chemistry 22 27.8%
Biology/Biological Sciences 20 25.3%
Physics 20 25.3%
Geology/Geological Sciences 15 19.0%
Construction Science 13 16.5%
Figure 23: Top communications degrees in demand
Figure 22: Top math and science degrees in demand
Major # of Respondents That Will Hire% of Respondents Hiring Computer & Information Science Degrees (n=126)
Computer Science 120 95.2%
Information Sciences & Systems 101 80.2%
Software Applications 74 58.7%
Figure 21: Top computer and information science degrees in demand
22 | Job Outlook 2015 | National Association of Colleges and Employers
Major # of Respondents That Will Hire % of Respondents Hiring Humanities Degrees (n=24)
English Language & Literature 19 79.2%
Liberal Arts/General Studies 19 79.2%
History 17 70.8%
Foreign Language & Literature 14 58.3%
Philosophy 13 54.2%
Visual & Performing Arts 11 45.8%
Area & Gender Studies 10 41.7%
Figure 25: Top humanities degrees in demand
Major # of Respondents That Will Hire % of Total Respondents Hiring Social Sciences Degrees (n=49)
Economics 48 98.0%
Psychology 26 53.1%
Political Science/ International Relations 22 44.9%
Sociology 19 38.8%
Social Work 7 14.3%
Figure 24: Top social sciences degrees in demand
National Association of Colleges and Employers | Job Outlook 2015 | 23
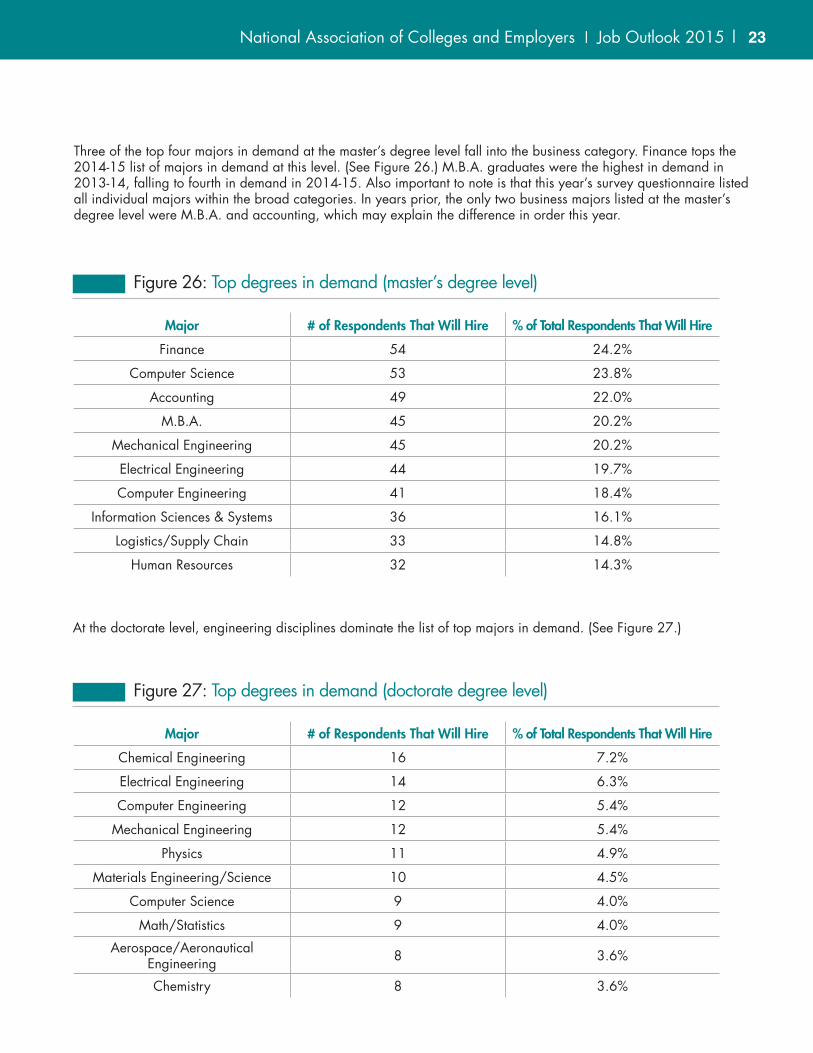
Three of the top four majors in demand at the master’s degree level fall into the business category. Finance tops the 2014-15 list of majors in demand at this level. (See Figure 26.) M.B.A. graduates were the highest in demand in 2013-14, falling to fourth in demand in 2014-15. Also important to note is that this year’s survey questionnaire listed all individual majors within the broad categories. In years prior, the only two business majors listed at the master’s degree level were M.B.A. and accounting, which may explain the difference in order this year.
Major # of Respondents That Will Hire % of Total Respondents That Will Hire
Finance 54 24.2%
Computer Science 53 23.8%
Accounting 49 22.0%
M.B.A. 45 20.2%
Mechanical Engineering 45 20.2%
Electrical Engineering 44 19.7%
Computer Engineering 41 18.4%
Information Sciences & Systems 36 16.1%
Logistics/Supply Chain 33 14.8%
Human Resources 32 14.3%
Figure 26: Top degrees in demand (master’s degree level)
At the doctorate level, engineering disciplines dominate the list of top majors in demand. (See Figure 27.)
Major # of Respondents That Will Hire % of Total Respondents That Will Hire
Chemical Engineering 16 7.2%
Electrical Engineering 14 6.3%
Computer Engineering 12 5.4%
Mechanical Engineering 12 5.4%
Physics 11 4.9%
Materials Engineering/Science 10 4.5%
Computer Science 9 4.0%
Math/Statistics 9 4.0%
Aerospace/Aeronautical Engineering 8 3.6%
Chemistry 8 3.6%
Figure 27: Top degrees in demand (doctorate degree level)

24 | Job Outlook 2015 | National Association of Colleges and Employers
Major# of Midwest
Respondents That Will Hire
% of Midwest Respondents That
Will Hire
% of Total Respondents That Will Hire
Accounting 43 61.4% 56.1%
Finance 41 58.6% 57.4%
Mechanical Engineering 41 58.6% 52.0%
Computer Science 39 55.7% 53.8%
Electrical Engineering 36 51.4% 46.6%
Figure 30: Top five undergraduate majors—Midwest
Major# of Northeast
Respondents Thar Will Hire
% of Northeast Respondents That
Will Hire
% of Total Respondents Who Will Hire
Finance 31 58.5% 57.4%
Business Administration/Mgmt. 30 58.5% 47.5%
Information Sciences & Systems 28 52.8% 45.3%
Accounting 27 50.9% 56.1%
Computer Science 27 50.9% 53.8%
Major# of Southeast
Respondents That Will Hire
% of Southeast Respondents That
Will Hire
% of Total Respondents That Will Hire
Mechanical Engineering 35 55.6% 52.0%
Accounting 32 50.8% 56.1%
Electrical Engineering 31 49.2% 46.6%
Finance 31 49.2% 57.4%
Computer Science 29 46.0% 53.8%
Figure 28: Top five undergraduate majors—Northeast
Figure 29: Top five undergraduate majors—Southeast
Figures 28 through 31 provide the top bachelor’s degrees in demand by geographic region.
National Association of Colleges and Employers | Job Outlook 2015 | 25
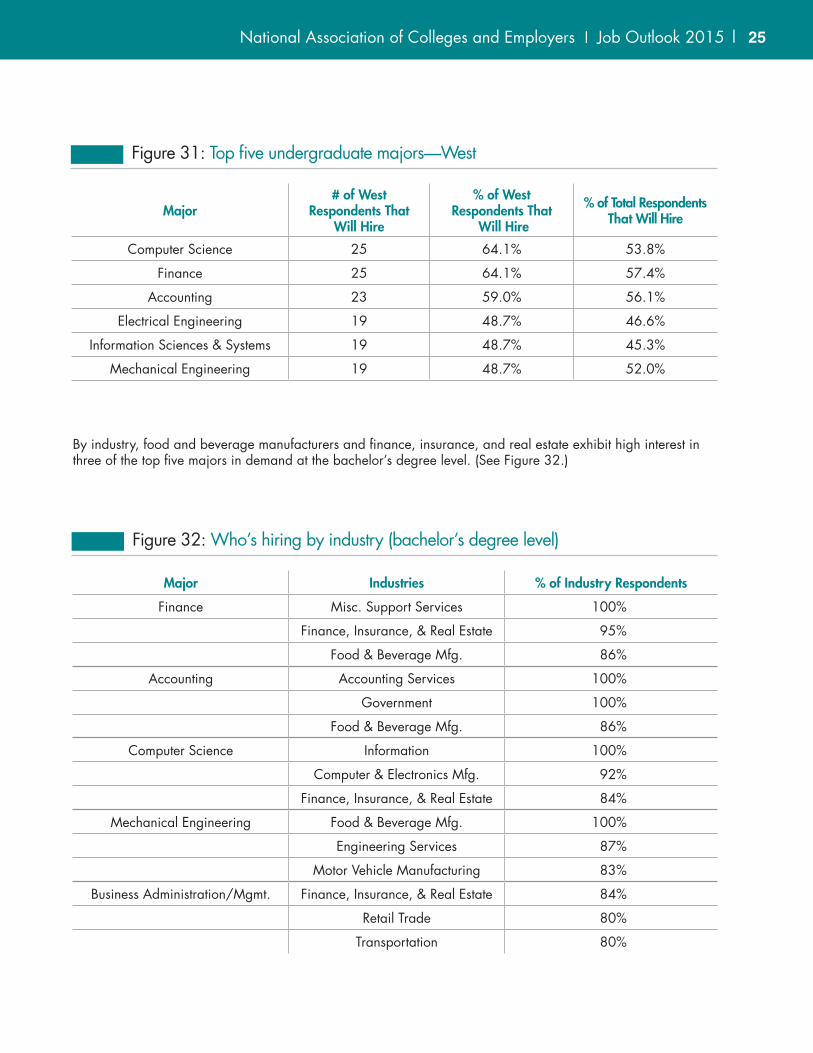
Major# of West
Respondents That Will Hire
% of West Respondents That
Will Hire
% of Total Respondents That Will Hire
Computer Science 25 64.1% 53.8%
Finance 25 64.1% 57.4%
Accounting 23 59.0% 56.1%
Electrical Engineering 19 48.7% 46.6%
Information Sciences & Systems 19 48.7% 45.3%
Mechanical Engineering 19 48.7% 52.0%
Figure 31: Top five undergraduate majors—West
Major Industries % of Industry Respondents
Finance Misc. Support Services 100%
Finance, Insurance, & Real Estate 95%
Food & Beverage Mfg. 86%
Accounting Accounting Services 100%
Government 100%
Food & Beverage Mfg. 86%
Computer Science Information 100%
Computer & Electronics Mfg. 92%
Finance, Insurance, & Real Estate 84%
Mechanical Engineering Food & Beverage Mfg. 100%
Engineering Services 87%
Motor Vehicle Manufacturing 83%
Business Administration/Mgmt. Finance, Insurance, & Real Estate 84%
Retail Trade 80%
Transportation 80%
Figure 32: Who’s hiring by industry (bachelor’s degree level)
By industry, food and beverage manufacturers and finance, insurance, and real estate exhibit high interest in three of the top five majors in demand at the bachelor’s degree level. (See Figure 32.)

26 | Job Outlook 2015 | National Association of Colleges and Employers
Major Region % of Respondents by Region
Finance West 64%
Midwest 59%
Northeast 58%
Southeast 49%
Accounting Midwest 61%
West 59%
Northeast 51%
Southeast 51%
Computer Science West 64%
Midwest 56%
Northeast 51%
Southeast 46%
Mechanical Engineering Midwest 59%
Southeast 56%
West 49%
Northeast 40%
Business Administration/Mgmt. Northeast 57%
Midwest 49%
Southeast 44%
West 36%
Figure 33: Who’s hiring by region (bachelor’s degree level)
Of the four regions, employers in the Midwestern and Western regions show the most interest in four of the top five bachelor’s majors in demand. (See Figure 33.)

National Association of Colleges and Employers | Job Outlook 2015 | 27
International Student Hiring PlansThe number of respondents with plans to hire international students continues to grow, with more than one-third of current respondents reporting plans to hire these particular graduates. (See Figure 34.)
Recruiting Year
Percent of Respondents
2010 2011 2012 2013 2014 2015
18.8% 21.6% 24.2% 28.1% 33.8% 34.2%
Figure 34: International student hiring plans, 2010 - 2015

28 | Job Outlook 2015 | National Association of Colleges and Employers
Engineering Services
47.1%
Transportation Oil & Gas Extraction
37.5%
Wholesale Trade
62.5%
Utilities
28.6%Misc. Prof. Services
35.0%
Information
52.9%Computer &
Electronics Mfg.
68.8%
Accounting Services
50.0%Finance, Insurance,
& Real Estate
47.8%
Chemical (Pharmaceutical) Mfg.
36.4%
Misc. Mfg.
26.9%Management Consulting
21.4%Construction
20.0%
Food & Beverage Mfg.
33.3%
40.0%
Retail Trade
7.7%Motor Vehicle Mfg.
16.7%
Figure 35: International student hiring plans, by industry
Several industries report interest in hiring international graduates from the Class of 2015. Computer and electronics manufacturers show the most interest, with nearly 70 percent of respondents reporting plans to hire them. (See Figure 35.)

National Association of Colleges and Employers | Job Outlook 2015 | 29
Two of the four geographic regions exhibit increased demand for international students compared to 2013-14. (See Figure 36.) The large increase in the West may be due to the fact that eight of the total respondents in the Western region fall into the computer and electronics manufacturing sector, which shows the most aggressive plans for hiring international students.
Perc
ent o
f Res
pond
ents
Region
0
10
20
30
40
50 2015 2014 2013 2012
49%
41%
41%
23%
28%
33%
26%
14%
29%
28%
33%
30%
37%
39%
20%
28%
West Midwest Southeast Northeast
Figure 36: International student hiring plans, by region

30 | Job Outlook 2015 | National Association of Colleges and Employers
Percent of Respondents
Recr
uitin
g Ye
ar
0 10 20 30 40 50 60 70 80
2009
2010
2011
2012
2013
2014
2015
69.2%
74.0%
76.9%
78.3%
68.1%
73.4%
67.1%
Figure 37: Screen candidates by GPA, by percent of respondents
HOW EMPLOYERS VIEW CANDIDATES
Slightly more than 68 percent of respondents plan to screen Class of 2015 candidates by GPA. Just over two-thirds of employers screened graduates from the Class of 2014, which was an all-time low since 2009. (See Figure 37.)
National Association of Colleges and Employers | Job Outlook 2015 | 31
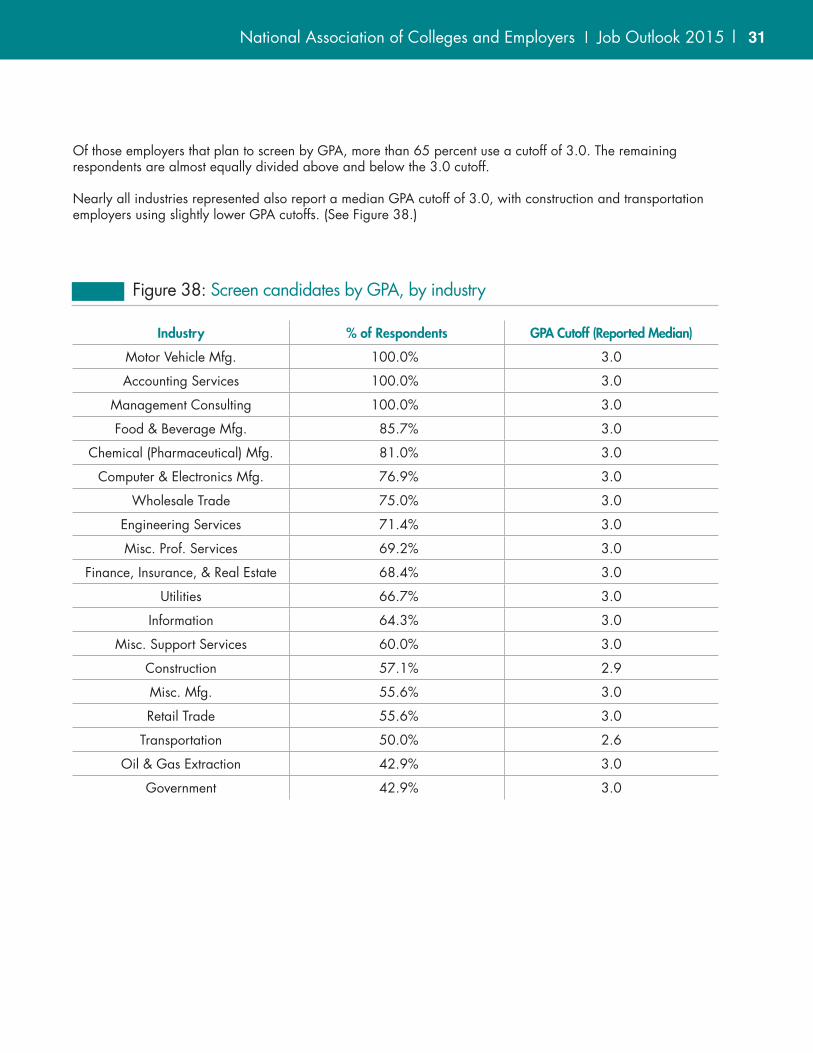
Industry % of Respondents GPA Cutoff (Reported Median)
Motor Vehicle Mfg. 100.0% 3.0
Accounting Services 100.0% 3.0
Management Consulting 100.0% 3.0
Food & Beverage Mfg. 85.7% 3.0
Chemical (Pharmaceutical) Mfg. 81.0% 3.0
Computer & Electronics Mfg. 76.9% 3.0
Wholesale Trade 75.0% 3.0
Engineering Services 71.4% 3.0
Misc. Prof. Services 69.2% 3.0
Finance, Insurance, & Real Estate 68.4% 3.0
Utilities 66.7% 3.0
Information 64.3% 3.0
Misc. Support Services 60.0% 3.0
Construction 57.1% 2.9
Misc. Mfg. 55.6% 3.0
Retail Trade 55.6% 3.0
Transportation 50.0% 2.6
Oil & Gas Extraction 42.9% 3.0
Government 42.9% 3.0
Figure 38: Screen candidates by GPA, by industry
Of those employers that plan to screen by GPA, more than 65 percent use a cutoff of 3.0. The remaining respondents are almost equally divided above and below the 3.0 cutoff.
Nearly all industries represented also report a median GPA cutoff of 3.0, with construction and transportation employers using slightly lower GPA cutoffs. (See Figure 38.)

32 | Job Outlook 2015 | National Association of Colleges and Employers
Leadership
77.8% 77.8%
Communication skills (written)
73.4% 70.9%
23.2%
CreativityTactfulness
18.2%
Analytical/quantitative skillsStrong work ethic
70.4% 68.0%
Communication skills (verbal)
67.5% 67.0%
Computer skills
Technical skills
62.6% 62.1%
Flexibility/adaptability
60.6%
Interpersonal skills (relates well to others)
Organizational ability
42.4% 35.0%
Friendly/outgoing personalityStrategic planning skills
29.1%
Problem-solving skillsAbility to work in a team
Initiative
66.5%
25.1%
Entrepreneurial skills/risk-taker
Detail-oriented
57.6%
Figure 39: Attributes employers seek on a candidate’s resume
In addition to looking at a student’s GPA, employers look at resumes for leadership skills and some evidence of teamwork as the most-important attributes. (See Figure 39.) The ability to work as part of a team jumped as a desired attribute among this year’s respondents. Just over 71 percent of respondents in 2013-14 favored the ability to work in a team. Now, almost 78 percent of respondents seek evidence of it. Written communication skills, the third most desired skill, dropped 4 percent points from 2013-14.

National Association of Colleges and Employers | Job Outlook 2015 | 33
Attribute 2015 Average Influence Rating* 2014 Average Influence Rating*
Has held leadership position 3.9 3.9
Major 3.9 3.9
High GPA (3.0 or above) 3.6 3.7
Has been involved in extracurricular activities (clubs, sports, student
government, etc.)3.6 3.5
School attended 2.8 2.9
Has done volunteer work 2.8 2.8
Is fluent in a foreign language 2.4 2.4
Has studied abroad 2.1 2.2
*5-point scale, where 1=No influence at all, 2=Not much influence, 3=Somewhat of an influence, 4=Very much influence, and 5=Extreme influence.
Figure 40: Influence of attributes
Further evidence that having leadership skills can make or break a hiring decision: When employers are forced to choose between two equally qualified candidates, they will choose the candidate with leadership skills. (See Figure 40.) The student’s academic major is also a large determining factor. Participation in extracurricular activities continues to have a lot of influence. The last four attributes—school attended, volunteer work, fluency in a foreign language, and study abroad continue to fall low on the influence scale.

34 | Job Outlook 2015 | National Association of Colleges and Employers
Skill/Quality Weighted Average Rating*
Ability to work in a team structure 4.61
Ability to make decisions and solve problems 4.61
Ability to verbally communicate with persons inside and outside the organization 4.60
Ability to plan, organize, and prioritize work 4.59
Ability to obtain and process information 4.57
Ability to analyze quantitative data 4.32
Technical knowledge related to the job 4.19
Proficiency with computer software programs 4.03
Ability to create and/or edit written reports 3.75
Ability to sell or influence others 3.56
*5-point scale, where 1=Not at all important; 2=Not very important; 3=Somewhat important; 4=Very important; and 5=Extremely important
Figure 41: Employers rate the importance of candidate skills/qualities
It comes as no surprise that when given the list of candidate skills and qualities in Figure 41, employers once again rate teamwork as most important. Tied with teamwork is the ability to make decisions and solve problems, followed by verbal communication skills. The order of importance for the skills and qualities has not changed much compared to 2013-14, except that verbal communication skills has crept above planning, organizing, and prioritizing work.
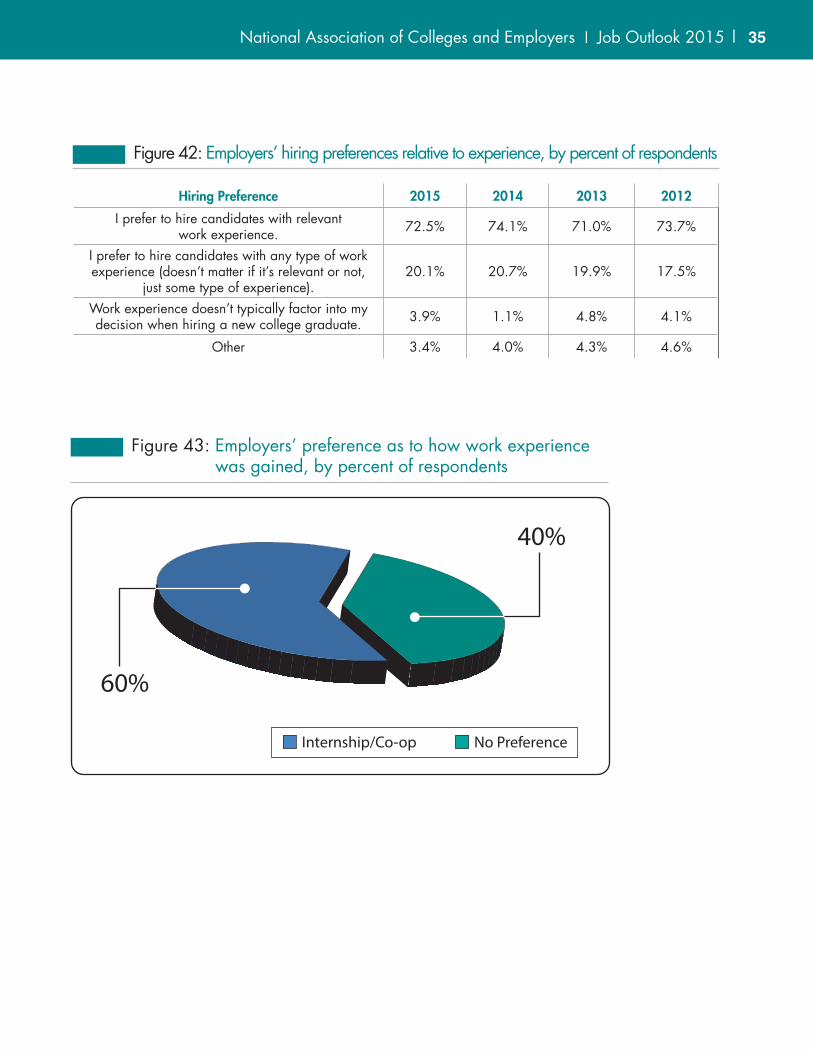
Work experience is another important element for new college graduates to display. Relevant work experience, in particular, is preferred by almost three-quarters of 2014-15 respondents, and has been preferred by more than seven in 10 respondents over the last several years. (See Figure 42.) Fewer than 5 percent of respondents report that work experience doesn’t typically factor into a hiring decision, and just over 20 percent of respondents indicate that they prefer any type of work experience, whether it’s relevant or not.
When asked specifically about work experience preferences, six in 10 respondents indicated that they prefer work experience gained through an internship or co-op experience. (See Figure 43.) The remaining 40 percent of respondents have no preference as to how work experience is gained.
National Association of Colleges and Employers | Job Outlook 2015 | 35
Internship/Co-op No Preference
60%
40%
Figure 43: Employers’ preference as to how work experience was gained, by percent of respondents
Hiring Preference 2015 2014 2013 2012
I prefer to hire candidates with relevant work experience. 72.5% 74.1% 71.0% 73.7%
I prefer to hire candidates with any type of work experience (doesn’t matter if it’s relevant or not,
just some type of experience).20.1% 20.7% 19.9% 17.5%
Work experience doesn’t typically factor into my decision when hiring a new college graduate. 3.9% 1.1% 4.8% 4.1%
Other 3.4% 4.0% 4.3% 4.6%
Figure 42: Employers’ hiring preferences relative to experience, by percent of respondents

36 | Job Outlook 2015 | National Association of Colleges and Employers
Ability to work in a team
74.2%
Abilit t k i t
74.2%%
Ability to work in a team
74.2%
Abilit t k i t
74.2%%
A-
Avg. 10.60
B+
Avg. 9.96
B B -
Avg. 9.21
B+
Avg. 10.05
A-
Avg. 10.53
B
Avg. 9.38 Avg. 8.01
B+
Avg. 10.47
Avg. = Average
Problem-solving
abilityAnalytic/
quantitative
skills
Verbal
communication
skills
Written
communication
skills
Initiative
LeadershipWork Ethic
Teamwork
Figure 44: Employers grade their average new graduate recruits on skills/attributes
Employers Grade Candidate AttributesEmployers graded average new graduate recruits on skills and attributes and found them lacking.
Employers indicated that new grads have lost ground in leadership and teamwork skills. The grade for leader-ship was graded at B+, showing that new grads still have room for improvement in that skill. Teamwork, the second key attribute, dropped from an A- among 2013-14 respondents to a B this year, making it the second-lowest graded attribute. Written communication skills, the third key skill employers look for, received a B-.

National Association of Colleges and Employers | Job Outlook 2015 | 37
Starting SalariesTwo-thirds of respondents—a new all-time high—plan to increase starting salaries for Class of 2015 grads holding bachelor’s degrees. Among those employers that expect to raise starting salaries, the average increase is 3.6 percent. About 57 percent of recruiters indicated that their increases would fall between 2 to 3 percent.
Graduating Class
Perc
ent o
f Res
pond
ents
0
10
20
30
40
50
60
70
80
2010 2011 2012 2013 2014 2015
29.2%
48.3%54.4% 51.9%
59.1%65.5%
Figure 45: Employers with plans to increase starting salaries to bachelor’s degree graduates
COMPENSATION AND SIGNING BONUSES

38 | Job Outlook 2015 | National Association of Colleges and Employers
Industry# of Respondents w/
Plans to Increase Bachelor’s Salaries
# of Respondents by Industry
% of Respondents by Industry
Engineering Services 7 7 100.0%
Food & Beverage Mfg. 6 7 85.7%
Computer & Electronics Mfg. 6 8 75.0%
Chemical (Pharmaceutical) Mfg. 10 14 71.4%
Construction 6 9 66.7%
Misc. Prof. Services 5 8 62.5%
Retail Trade 3 5 60.0%
Management Consulting 5 9 55.6%
Finance, Insurance, & Real Estate 5 11 45.5%
Misc. Mfg. 4 9 44.4%
Figure 46: Employers with plans to increase starting salaries, by industry
Region# of Respondents
w/Plans to Increase Bachelor’s Salaries
# of Respondents by Region
% of Respondents by Region
Average projected increase*
Northeast 17 29 58.6% 2.7%
Southeast 20 32 62.5% 4.1%
Midwest 22 30 73.3% 3.8%
West 13 19 68.4% 4.0%
*Average calculation based only on respondents with plans to increase salaries.
Figure 47: Employers with plans to increase starting salaries, by region
By industry, engineering services firms are the most likely to increase bachelor’s degree salaries with 100 percent of respondents indicating that they will do so. (See Figure 46.)
Salary increases for bachelor’s degree candidates are also planned in all four geographic regions, with respondents in the Midwest being the most likely to provide them. (See Figure 47.) Almost three-quarters of Midwestern respondents are planning increases to starting salaries, and their average planned increase is almost 4 percent.
More than half of respondents plan salary increases for new hires with a master’s degree, an overall average increase of 3.3 percent.

National Association of Colleges and Employers | Job Outlook 2015 | 39
Recruiting Year
Perc
ent o
f Res
pond
ents
0
10
20
30
40
50
60
2009-10 2010-11 2011-12 2012-13 2013-14 2014-15
Planned Actual
50.0
%
45.8
%
46.1
%
45.0
% 52.7
%
40.8
% 48.4
%
48.0
%
47.1
%
48.8
%
51.0
%
Figure 48: Employers offering signing bonuses
Signing BonusesMore employers have plans to offer signing bonuses to Class of 2015 graduates than any of the graduating classes over the past five years. (See Figure 48.) Over half of this year’s respondents report that they will offer signing bonuses to Class of 2015 graduates. For the classes of 2010 and 2012, at least half of respondents reported that they actually did offer signing bonuses, but this is the first year that plans have topped 50 percent.
Among the employers with plans to offer signing bonuses, almost two-thirds plan to offer them only to selected candidates. And, the selected majors that are most likely to receive signing bonuses are also the same as those in most demand—business, engineering, or computer sciences fields.

40 | Job Outlook 2015 | National Association of Colleges and Employers
Industry % Offering Signing Bonuses # of Respondents
Food & Beverage Mfg. 85.7% 7
Management Consulting 76.9% 13
Utilities 66.7% 6
Chemical (Pharmaceutical) Mfg. 66.7% 21
Accounting Services 66.7% 6
Finance, Insurance, & Real Estate 63.2% 19
Computer & Electronics Mfg. 61.5% 13
Engineering Services 53.3% 15
Construction 50.0% 14
Misc. Prof. Services 50.0% 14
Misc. Mfg. 44.4% 18
Retail Trade 44.4% 9
Oil & Gas Extraction 42.9% 7
Information 28.6% 14
Misc. Support Services 20.0% 5
Government 14.3% 7
Figure 49: Percent of employers offering signing bonuses to 2014-15 graduates, by industry
Region % That Plan to Offer Signing Bonuses in 2014-15
% That Planned to Offer Signing Bonuses in 2013-14
Northeast 51.1% 44.7%
Southeast 54.2% 52.5%
Midwest 54.7% 53.8%
West 39.5% 39.5%
Figure 50: Percent of employers offering signing bonuses to 2014-15 graduates, by region
By industry, food and beverage manufacturers are most inclined to offer signing bonuses to the Class of 2015 graduates. (See Figure 49.) And, employers in the Midwest continue to be the most likely of the four geographic regions to offer signing bonuses. (See Figure 50.)

National Association of Colleges and Employers | Job Outlook 2015 | 41
Major 2014-15 Average Bonus (Projected)
# of Respondents 2014-15
2013-14 Average Bonus (Projected)
# of Respondents 2013-14
Accounting $3,682 11 $4,000 6
Business $3,958 6 Not reported Not reported
Chemical Engineering $5,250 6 Not reported Not reported
Computer Science $4,364 11 $5,000 6
Engineering – not specified $5,107 14 $4,658 19
Finance $2,938 8 $3,500 6
Mechanical Engineering $2,600 5 Not reported Not reported
*where 5 or more data points were provided
Figure 51: Average signing bonus, by major (bachelor’s degrees)*
Major 2014-15 Average Bonus (Projected)
# of Respondents 2014-15
2013-14 Average Bonus (Projected)
# of Respondents 2013-14
M.B.A. $20,250 8 $9,550 10
Computer Science $5,125 8 Not reported Not reported
Engineering – not specified $7,500 5 Not reported Not reported
*where 5 or more data points were provided
Figure 52: Average signing bonus, by major (master’s degrees)*
This year’s respondents provided more detailed data on their signing bonus amounts by major. Figures 51 and 52 detail the average projected bonus amounts at both the bachelor’s and master’s level.
UPDATES FOR THE CLASS OF 2015
The Job Outlook 2015 Spring Update survey (data collected in February – March) will give NACE members a final update on hiring for 2014-15 graduates. Results will be available in early April.
The first report of starting salaries for the Class of 2015 will be published in the January 2015 Salary Survey.

42 | Job Outlook 2015 | National Association of Colleges and Employers
APPENDIX
20.1%
12.7%
13.1%16.6%
10.8%
26.6%
2,501 - 5,000
500 - 1,000
1,000 - 2,500
Less than 500
More than 10,000
5,001 - 10,000
Figure 53: Respondents by size of department/business unit
National Association of Colleges and Employers | Job Outlook 2015 | 43
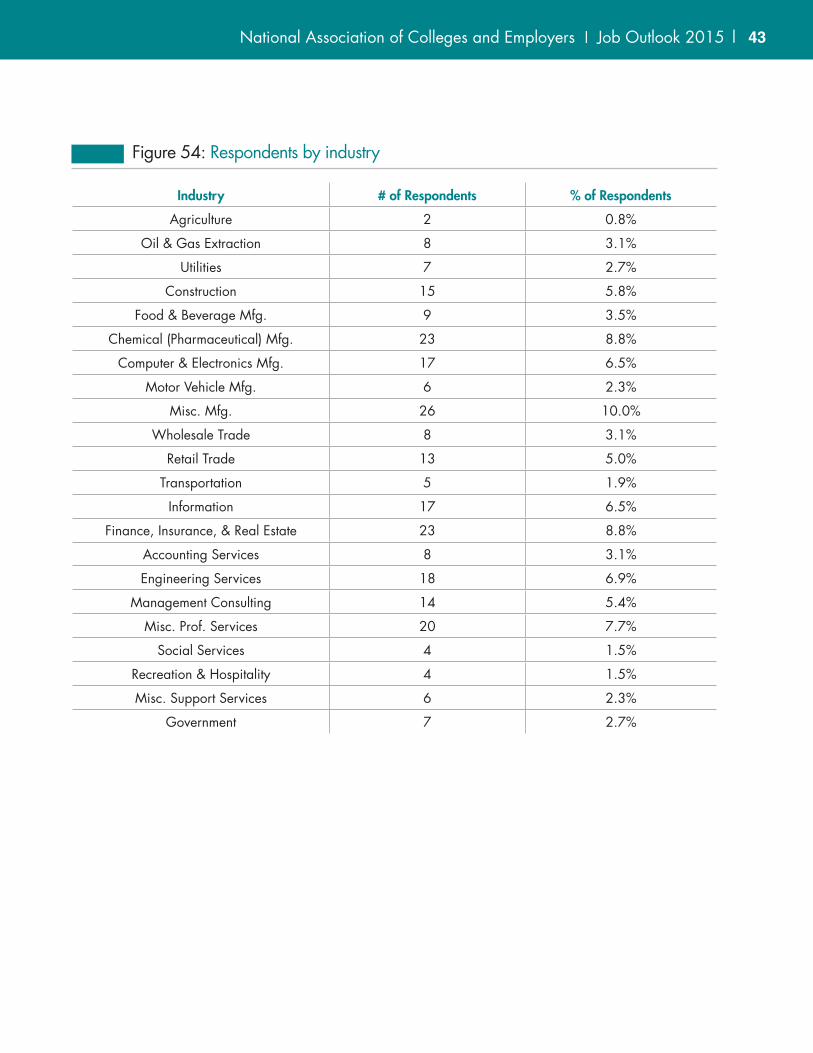
Industry # of Respondents % of Respondents
Agriculture 2 0.8%
Oil & Gas Extraction 8 3.1%
Utilities 7 2.7%
Construction 15 5.8%
Food & Beverage Mfg. 9 3.5%
Chemical (Pharmaceutical) Mfg. 23 8.8%
Computer & Electronics Mfg. 17 6.5%
Motor Vehicle Mfg. 6 2.3%
Misc. Mfg. 26 10.0%
Wholesale Trade 8 3.1%
Retail Trade 13 5.0%
Transportation 5 1.9%
Information 17 6.5%
Finance, Insurance, & Real Estate 23 8.8%
Accounting Services 8 3.1%
Engineering Services 18 6.9%
Management Consulting 14 5.4%
Misc. Prof. Services 20 7.7%
Social Services 4 1.5%
Recreation & Hospitality 4 1.5%
Misc. Support Services 6 2.3%
Government 7 2.7%
Figure 54: Respondents by industry
44 | Job Outlook 2015 | National Association of Colleges and Employers
Participating OrganizationsBelow is a list of the organizations that responded to the Job Outlook 2015 survey. (Please note: Although 260 organizations responded, the list below includes the names of 186 organizations, as 74 organizations preferred not to be listed.)
ACCO Brands CorporationAcushnet CompanyADPAdvanced Micro Devices, Inc.AIGAlcatel-LucentALCOA Inc.American Axle & Manufacturing
Holdings, Inc.American Family InsuranceAmeriHealth Mercy Family of
Companies
Angie’s List
Anheuser-Busch Companies, Inc.
ARCADIS US Inc.
ArcelorMittal USA
Archer Daniels Midland Company
Arete Associates
Ascend Performance Materials
Aspen Technology Inc.
Asurion Corporation
Audubon EngineeringAutomobile Club of Southern
CaliforniaBarilla America Inc.Battelle Memorial InstituteBechtel CorporationBlack & Veatch CorporationBlackbaud, Inc.BlackRock, Inc.Bluegreen VacationsBOK Financial CorporationBreitBurn EnergyBuhlerPrince Inc.
Burgess & Niple, Inc.Burns & McDonnell Engineering
Co. Inc.C&S Wholesale Grocers, Inc.California State AuditorCampbell Soup CompanyCargill, Inc.CatamaranCDM SmithCelanese InternationalCharles River AnalyticsChevron CorporationCisco Systems, Inc.City Year, Inc.ConAgra Foods, Inc.ConocoPhillips CompanyContinental AGCOUNTRY FinancialCUNA Mutual GroupDallas Central Appraisal DistrictDepository Trust & Clearing
CorporationDesert Research InstituteDewberryDick’s Sporting Goods
DIRECTV
Draper Laboratory
Dresser-Rand Company
Duane Reade
Duff & Phelps LLC
Duke Energy Corporation
dunnhumbyUSA
DuPontEcolab Inc.
Edward JonesEllison Surface TechnologiesENERCON Services, Inc.Entergy Services, Inc.EpsilonEquinixESRIExel Supply ChainExpress Scripts, Inc.EYFederal Energy Regulatory
CommissionFirstEnergy CorporationFluor Corporation - Global RecruitingFormosa Plastics Corp. USAFujitsu America Inc.GAF CorporationGAP Inc.General Electric CompanyGeorgia Tech Research InstituteGoodman NetworksHazen and Sawyer P.C.Henkels & McCoy, Inc.Herbert, Rowland & Grubic, Inc.HNTB CompaniesHonda R&D Americas, Inc.Hormel Foods CorporationHuhtamaki, Inc.Huron Consulting GroupIBM CorporationINC ResearchInternational Paper CompanyIntuitive SurgicalJ.B. Hunt Transport Inc.

National Association of Colleges and Employers | Job Outlook 2015 | 45
kCuraKearney & CompanyKiewit Energy GroupKimberly-Clark CorporationKing County Department of Natural
Resources and ParksKPMG LLPL-3 Communications Integrated
SystemsLake Shore Cryotronics, Inc.Lam Research CorporationLiberty Mutual Insurance CompanyLord CorporationMacy’s, Inc.Mattress FirmMaxim Integrated ProductsMeadWestvaco CorporationMedline Industries, Inc.Merck & Co., Inc.
Messer Construction Co.Mondeléz InternationalNetAppNiSourceNRG Energy Inc.Olin Chlor Alkali ProductsOlsson AssociatesOrora North AmericaOshkosh CorporationOSIsoft, LLCPacific Gas and Electric CompanyPanduit Corp.Pariveda Solutions Inc.
Parsons BrinckerhoffParsons Corporation
Perficient
Phillips-Medisize Corporation
PlastiComp, Inc.
PrimeSource Building Products, Inc.
ProBuild
Procter & Gamble Co.
Progressive Insurance
Protiviti Inc.
Prudential
Questar Corporation
Rockwell Collins
Rogers Corporation
Rosetta
Ross Stores Inc.
Roux Associates, Inc.
Saks Fifth Avenue
Savannah River Nuclear Solutions
Schlumberger Oilfield Services
Scitor Corp.
Seagate Technology
Selden Fox LTD
Shawmut Design and Construction
Simpson Gumpertz & Heger Inc.
Snap-on Incorporated
Southern California EdisonSouthwest Airlines Co.Sundt Construction Inc.Swagelok CompaniesSWIFT
Synergy Associates LLCTenaris USATeradata CorporationThe Bank of New York Mellon
CorporationThe Children’s Museum of
IndianapolisThe Nielsen CompanyThe Rehmann GroupThe Walsh GroupThe Williams CompaniesThurgood Marshall College FundTimkenSteel CorporationTindall CorporationTowers WatsonToys R Us, Inc.Trinity Consultants Inc.Turner Construction CompanyTyco International Inc.U.S. Comptroller of the CurrencyU.S. General Services AdministrationUnion BankUnion Pacific Railroad CompanyUnited Launch AllianceUniversity of Massachusetts Medical
SchoolUSS-POSCO IndustriesVerso Paper Corp.VertaforeVistaprintWood Group
Zachry Holdings, Inc.

National Association of Colleges and Employers 62 Highland Avenue • Bethlehem, PA 18017-9085 • 610.868.1421
www.naceweb.org