jo-ann stores, inc. - iis windows...
TRANSCRIPT

UNITED STATES SECURITIES AND EXCHANGE COMMISSIONWashington, D.C. 20549
Form 10-KANNUAL REPORT PURSUANT TO SECTION 13 OR 15(d) OF THE
SECURITIES EXCHANGE ACT OF 1934For the fiscal year-ended February 2, 2008
Commission File No. 1-6695
JO-ANN STORES, INC.(Exact name of Registrant as specified in its charter)
Ohio(State or other jurisdiction ofincorporation or organization)
34-0720629(I.R.S. Employer Identification No.)
5555 Darrow Road, Hudson, Ohio(Address of principal executive offices)
44236(Zip Code)
Registrant’s telephone number, including area code:(330) 656-2600
Securities registered pursuant to Section 12(b) of the Act:Title of Each Class Name of Each Exchange on Which Registered
Common Shares, Without Par ValueCommon Share Purchase Rights
New York Stock ExchangeNew York Stock Exchange
Indicate by check mark if the registrant is a well-known seasoned issuer, as defined in Rule 405 of the SecuritiesAct. Yes n No ¥
Indicate by check mark if the registrant is not required to file reports pursuant to Section 13 or Section 15(d) of theAct. Yes n No ¥
Indicate by check mark whether the registrant (1) has filed all reports required to be filed by Section 13 or 15(d) of theSecurities Exchange Act of 1934 during the preceding 12 months (or for such shorter period that the registrant was required to filesuch reports), and (2) has been subject to such filing requirements for the past 90 days. Yes ¥ No n
Indicate by check mark if disclosure of delinquent filers pursuant to Item 405 of Regulation S-K is not contained herein, andwill not be contained, to the best of registrant’s knowledge, in definitive proxy or information statements incorporated by referencein Part III of this Form 10-K or any amendment to this Form 10-K. ¥
Indicate by check mark whether the registrant is a large accelerated filer, an accelerated filer, a non-accelerated filer, or asmaller reporting company. See the definitions of “large accelerated filer,” “accelerated filer” and “smaller reporting company” inRule 12b-2 of the Exchange Act. (Check one):
Large accelerated filer n Accelerated filer ¥ Non-accelerated filer n Smaller reporting company n
(Do not check if a smaller reporting company)
Indicate by check mark whether the registrant is a shell company (as defined in Rule 12b-2 of the ExchangeAct.): Yes n No ¥
The aggregate market value of the common stock of the registrant held by non-affiliates of the registrant as of August 4, 2007was $547.1 million, based upon the closing sales price of the registrant’s common stock on that date as reported on the New YorkStock Exchange. All executive officers and directors of the registrant have been deemed, solely for the purpose of the foregoingcalculation, to be “affiliates” of the registrant.
The number of the registrant’s Common Shares outstanding, as of April 4, 2008, was 25,276,325.
Documents incorporated by reference: Portions of the following documents are incorporated by reference:
Proxy Statement for 2008 Annual Meeting of Shareholders — Items 10, 11, 12, 13 and 14 of Part III.

PART I
Except as otherwise stated, the information contained in this report is given as of February 2, 2008, theend of our latest fiscal year. The words “Jo-Ann Stores, Inc.,” “Jo-Ann Stores,” “Jo-Ann Fabrics and Crafts,”“Jo-Ann Fabric and Craft Stores,” “Joann.com,” “Registrant,” “Company,” “we,” “our” and “us” refer to Jo-AnnStores, Inc. and, unless the context requires otherwise, to our subsidiaries. Jo-Ann Stores, Inc. is an Ohiocorporation, founded in 1943. Our fiscal year ends on the Saturday closest to January 31 and refers to the yearin which the period ends (e.g., fiscal 2008 refers to the period ended February 2, 2008). Fiscal years consist of52 weeks, unless noted otherwise.
Item 1. Business
We are the nation’s largest specialty retailer of fabrics and one of the largest specialty retailers of crafts,serving customers in their pursuit of apparel and craft sewing, crafting, home decorating and other creativeendeavors. Our retail stores (operating as Jo-Ann Fabric and Craft stores and Jo-Ann stores) and website(www.Joann.com) feature a variety of competitively priced merchandise used in sewing, crafting and homedecorating projects, including fabrics, notions, crafts, frames, paper crafting material, artificial floral, homeaccents, finished seasonal and home décor merchandise.
During the second quarter of fiscal 2008, we made a change in the way we reference our store formats.We now classify our stores as large-format and small-format, as opposed to the previous classification ofsuperstore and traditional stores. As we continue to remodel our stores, the distinction between superstoresand traditional stores would become less clear. The dividing line between the large-format and small-formatclassification is approximately 24,000 to 25,000 square feet of retail space. The most important distinction iswhether or not stores in that range have been recently built or remodeled and contain a broad assortment ofcraft categories.
As of February 2, 2008, we operated 774 stores in 47 states (578 small-format stores and 196 large-formatstores). Our small-format stores offer a complete selection of fabric and a convenience assortment of crafts,artificial floral, finished seasonal and home décor merchandise. They average approximately 14,700 square feetand generated net sales per store of approximately $1.5 million in fiscal 2008. We did not open anysmall-format stores in fiscal 2008. Our large-format stores offer an expanded and more comprehensive productassortment than our small-format stores. Our large-format stores also offer custom framing and educationalprograms that our small-format stores do not. They average approximately 38,000 square feet and generatednet sales per store of approximately $4.9 million in fiscal 2008. We opened six large-format stores in fiscal2008.
We provide a one-stop shopping experience for craft and sewing projects under one roof, with employeeswho are encouraged to assist customers in creating and completing creative projects. Many of our store levelemployees are sewing and/or crafting enthusiasts, which we believe enables them to provide exceptionalcustomer service. We believe our focus on service contributes to a high proportion of repeat business from ourcustomers. A significant portion of our advertising budget is allocated to our direct mail and weekly newspaperinsert advertising programs.
We believe that our large-format stores are uniquely designed to offer a destination location for ourcustomers. We offer approximately 79,000 stock-keeping units (“SKUs”) across two broad product categories:sewing and non-sewing components. We manage our vast product selection with SAP Retail. Through the coreSAP application and integration with peripheral processing systems, we continue to drive operational andexecution improvements, through enhanced forecasting and replenishment capabilities, and streamlinedoperations.
We believe stability in our sales and our industry is partially a function of recession-resistant characteristics.For example, according to a 2007 research study conducted by the Craft & Hobby Association, approximately57 percent of all U.S. households participated in crafts and hobbies. While expenditures for such projects aregenerally discretionary in nature, our average sales ticket during fiscal 2008 was $23 in our large-format storesand $18 in our small-format stores. Industry sales, according to the Craft & Hobby Association’s 2007 research
1

study, were approximately $32 billion. Our market is highly fragmented and is served by multi-store fabricretailers, arts and crafts retailers, mass merchandisers, small local specialty retailers, mail order and Internetvendors and a variety of other retailers.
Recent Developments and Business Update
Fiscal 2008 was a year of transition as we began the implementation of our long-term strategic growthplan to position ourselves for profitable and sustainable growth over the long term. The long-term strategicgrowth plan addresses three major objectives:
• Improve the customer shopping experience;
• Enhance our marketing and merchandising offers; and
• Refine our new store and remodel programs.
The above objectives were supported by dozens of initiatives and were enabled by the development of ourpeople, enhancement of our information systems, enhanced efficiencies in our supply chain, and improvedcontrols over inventory and selling, general and administrative expenses (“SG&A”).
By executing this strategy, we delivered solid results for fiscal year 2008 and positioned ourselves todeliver balanced and consistent financial improvements over the long term.
During fiscal year 2008:
• We achieved same-store sales growth of 3.5 percent versus a same-store sales decrease of 5.9 percentlast year;
• We gained expense leverage in SG&A, as the percentage of net sales decreased 150 basis points fromlast year; and
• Earnings per share for the year improved to $0.62 per diluted share, compared with a loss of $0.08 perdiluted share in the prior year.
In addition to implementing our new strategic growth plan, during the fourth quarter of fiscal 2008, wecompleted the acquisition of the 62 percent of IdeaForest.com, Inc. (“IdeaForest”) that we previously did notown. IdeaForest was the operator of the Joann.com website.
During fiscal 2009 we plan to continue to execute our strategic plan and take advantage of competitivewithdrawals from the fabric industry. The current economic environment has added a degree of uncertainty, butwe expect to be insulated from a downturn to a certain extent due to the strong demographics of our shoppersand the steady performance of the sewing and craft industry in previous recessions.
As we continue to improve overall business results and achieve more consistent performance from newstores, we plan to accelerate new store openings and store remodels in future years.
Some key priorities we will pursue in fiscal year 2009 include:
• The rollout of our new point of sale and store system package;
• The rollout of our new human resource and workforce management applications;
• Continued integration of our newly acquired Joann.com Internet business, to achieve better synergywith our retail stores; and
• Continued efforts to update stores by remerchandising dozens of our small-format stores, over andabove those we have scheduled for remodel.
2

Product Selection
The following table shows our net sales by principal product line as a percentage of total net sales:
February 2,2008
February 3,2007
January 28,2006
Fiscal Year-Ended
Principal product lines:Sewing . . . . . . . . . . . . . . . . . . . . . . . . . . . . . . . . . . . . . 50% 50% 56%Non-sewing . . . . . . . . . . . . . . . . . . . . . . . . . . . . . . . . . . 50% 50% 44%
Total . . . . . . . . . . . . . . . . . . . . . . . . . . . . . . . . . . . . . 100% 100% 100%
Sewing
We offer a broad and comprehensive assortment of fabrics and sewing accessories in both our small-formatand large-format stores. These fabrics are merchandised by end use and are sourced from throughout the worldto offer our customers a combination of unique design, fashion forward trends, and value. Our stores areorganized in the following categories for the convenience of the sewer:
• fashion and sportswear fabrics, used primarily in the construction of garments for the customer seekinga unique, fashion forward look;
• special occasion fabrics used to construct evening wear, bridal and special occasion outfits;
• craft fabrics used primarily in the construction of quilts, craft and seasonal projects for the home;
• juvenile designs for the construction of garments as well as blankets and décor accessories;
• fleece fabrics in both prints and solids used for the construction of sportswear, blankets and craftprojects for the home;
• home decorating fabrics and accessories used in home related projects such as window treatments,furniture and bed coverings (in addition to the in-store assortment, we offer a special order capabilityfor additional designs);
• a wide array of notions, which represent items incidental to sewing-related projects — including cuttingimplements, threads, zippers, trims, tapes, pins, elastics, buttons and ribbons, as well as the patternsnecessary for most sewing projects; and
• sewing-related accessories including lighting, organizers and sewing machines. Our high volume storesoffer a wider selection of sewing machines through leased departments with third parties from whomwe receive sublease income.
Non-sewing
We offer a broad assortment of non-sewing merchandise for the creative enthusiast. Our large-formatstores offer the complete array of categories while our small-format stores, due to their smaller size, carryedited down versions of the best items. We offer the following non-sewing selections in our large-formatstores:
• yarn and accessories, as well as needlecraft kits and supplies;
• paper crafting components, such as albums, papers, stickers, stamps and books used in the popularhome based activities of scrapbooking and card making;
• craft materials, including items used for stenciling, jewelry making, decorative painting, wall décor, andkids crafting;
• fine art materials, including items such as pastels, water colors, oil paints, acrylics, easels, brushes,paper and canvas;
3

• a comprehensive assortment of books and magazines to provide inspiration for our customer;
• framed art, photo albums and ready-made frames and, full service in-store custom framing departments;
• floral products, including artificial flowers, dried flowers and artificial plants, sold separately or inready-made floral arrangements and a broad selection of accessories essential for floral arranging andwreath making; and
• home décor accessories including baskets, candles and accent collections designed to complement ourhome décor fashions.
In addition to the basic categories described above, our stores regularly feature seasonal products, whichfit with our core merchandising strategy. Our seasonal offerings span all product lines and include finisheddecorations, gifts and accessories that focus on holidays including Easter, Halloween and Christmas, as well asseasonal categories such as patio/garden. Seasonal product is brought in under the “Holiday Inspirations”private label.
During the Christmas selling season, a significant portion of floor and shelf space is devoted to seasonalcrafts, decorating and gift-making merchandise. Due to the project-oriented nature of these items, our peakselling season starts earlier than that of other retailers and generally runs from September through December.In fiscal 2008, approximately 57 percent of our net sales occurred in the third and fourth quarters, andapproximately 31 percent occurred in the fourth quarter alone.
During fiscal 2008, non-sewing and sewing net sales represented 60 percent and 40 percent of total netsales for our large-format stores, respectively. Non-sewing and sewing net sales represented 40 percent and60 percent of total net sales for our small-format stores for the same period, respectively.
Marketing
Our marketing efforts are key to the ongoing success and growth of our stores. Our primary focus is onacquiring and retaining customers through an integrated direct and mass marketing program.
We use our proprietary customer database to provide ongoing communication to our best customersthrough a robust direct mail and email program. This allows us to efficiently and effectively reach our targetmarket on a regular basis throughout the year. To drive customer acquisition, we supplement our direct mailadvertising with weekly newspaper insert advertising, primarily in large-format store markets. Our direct mailand newspaper inserts showcase our sales events, feature numerous products offered at competitive prices, andshowcase people interacting with product providing inspiration.
As we market the Jo-Ann Stores concept, we also focus on developing long-term relationships with ourcustomers. These efforts include providing knowledge and inspiration through in-store classes, demonstrationsand project sheets.
Our grand opening program plays an integral role in the successful opening of each new store. We utilizeour existing customer base to build awareness and excitement in each market around the opening of each newstore. This is paired with newspaper inserts, in-store promotions and public relations efforts during the grandopening weekend to drive customer traffic. We continue to drive customer awareness and traffic after the grandopening through ongoing advertising efforts in the market.
We also reach our customers through our Joann.com Internet business. During the fourth quarter of fiscal2008 we completed the purchase of the 62 percent of IdeaForest.com, Inc. that we previously did not own for$23.6 million, including a note payable of approximately $9 million. In conjunction with the acquisition, welaunched a site redesign of Joann.com. The improved website is more visually compelling, easier to navigate,includes features such as a community area to share ideas, as well as a place to review and rate products. Thistransaction provides us with the opportunity to integrate the online shopping experience with our storesultimately improving the overall customer experience.
4

Purchasing
We have numerous domestic and international sources of supply available for each category of productthat we sell. During fiscal 2008, approximately two-thirds of our purchases were sourced domestically andone-third was sourced internationally. Our domestic suppliers source internationally some of the products theysell to us. Although we have very few long-term purchase commitments with any of our suppliers, we strive tomaintain continuity with them. All purchases are centralized through our store support center, allowing storeteam leaders and store team members to focus on customer sales and service and enabling us to negotiatevolume discounts, control product mix and ensure quality. Currently, our top supplier represents approximatelythree percent of our annual purchase volume and the top ten suppliers represent approximately 23 percent ofour total annual purchase volume. We currently utilize approximately 575 merchandise suppliers, with the top128 representing more than 80 percent of our purchasing volume.
Logistics
We operate three distribution centers in Hudson, Ohio, Visalia, California and Opelika, Alabama, all ofwhich ship merchandise to our stores on a weekly basis. Based on purchase dollars, approximately 81 percentof the products in our stores are shipped through our distribution center network, with the remaining19 percent of our purchases shipped directly from our suppliers to our stores. Approximately 50 percent of ourstore base is supplied from the Hudson distribution center, 30 percent from our Visalia distribution center and20 percent from our Opelika distribution center.
We transport product from our distribution centers to our stores utilizing contract carriers. Merchandise isshipped directly from our distribution centers to our stores using dedicated core carriers for approximately95 percent of our store base. For the remainder of our chain, we transport product to the stores using lessthan truckload carriers or through three regional “hubs” where product is cross-docked for local delivery. We donot own either the regional hubs or the local delivery vehicles.
Store Operations
Site Selection. We believe that our store locations are integral to our success. New sites are selectedthrough a coordinated effort of our real estate, finance and operations management teams. In evaluating thedesirability of a potential store site, we consider both market demographics and site-specific criteria. Marketcriteria that we consider important include, but are not limited to, our existing store sales performance in thatimmediate market, distance to other Jo-Ann store locations, as well as total population, number of households,median household income, percentage of home ownership versus rental and historical and projected populationgrowth over a ten-year period. Site-specific criteria that we consider important include, but are not limited to,rental terms, the store location, position and visibility within the shopping center, size of the shopping center,co-tenants, proximity to highway access, traffic patterns, availability of convenient parking and ease of entryfrom the major roadways framing the location.
Costs of Opening Stores. Standard operating procedures are employed to efficiently open new stores andintegrate them into our information management and distribution systems. We have developed a standardizedfloor plan, inventory layout and marketing program for each store that we open. We typically open storesduring the period from February through October to maximize sales and to minimize disruption to storeoperations during our fourth-quarter peak selling season.
Store Management. Small-format stores generally have five full-time team members and 10 to 12 part-timeteam members, while large-format stores typically have approximately nine full-time team members and 35 to45 part-time team members. Store team leaders are compensated with a base salary plus a bonus, which is tiedto quarterly store sales and annual store controllable profit.
Small-format store team leaders are typically promoted from a group of top performing assistant managers,some of whom started as our customers. This continuity serves to solidify long-standing relationships betweenour stores and our customers. When a small-format store is closed due to the opening of a large-format store,we generally retain its team members to staff the new large-format store. Large-format store team leader
5

positions primarily have been staffed with individuals from outside the Company who have previous experiencein managing “big-box” retail concepts. We have a training program that is designed to develop and preparemore large-format store managers from within our organization. Each store is under the supervision of a districtteam leader who reports to a regional vice president.
The following table shows our stores by type and state on February 2, 2008:Small-format
Large-format Total
Small-format
Large-format Total
Alabama . . . . . . . . . . . . . . 1 — 1 Nebraska . . . . . . . . . . . . . 4 — 4Alaska . . . . . . . . . . . . . . . 4 2 6 Nevada. . . . . . . . . . . . . . . 3 2 5Arizona . . . . . . . . . . . . . . 6 10 16 New Hampshire . . . . . . . . . 8 — 8Arkansas. . . . . . . . . . . . . . 1 — 1 New Jersey . . . . . . . . . . . . 12 1 13California . . . . . . . . . . . . . 67 20 87 New Mexico . . . . . . . . . . . 6 — 6Colorado. . . . . . . . . . . . . . 9 5 14 New York . . . . . . . . . . . . . 30 9 39Connecticut . . . . . . . . . . . 6 4 10 North Carolina . . . . . . . . . . 5 1 6Delaware . . . . . . . . . . . . . 2 1 3 North Dakota . . . . . . . . . . 4 — 4Florida . . . . . . . . . . . . . . . 32 18 50 Ohio . . . . . . . . . . . . . . . . 38 18 56Georgia . . . . . . . . . . . . . . 6 5 11 Oklahoma . . . . . . . . . . . . . 4 — 4Idaho. . . . . . . . . . . . . . . . 9 — 9 Oregon . . . . . . . . . . . . . . . 20 4 24Illinois . . . . . . . . . . . . . . . 24 11 35 Pennsylvania . . . . . . . . . . . 34 9 43Indiana . . . . . . . . . . . . . . 20 6 26 Rhode Island. . . . . . . . . . . — 1 1Iowa . . . . . . . . . . . . . . . . 10 — 10 South Carolina . . . . . . . . . 2 — 2Kansas . . . . . . . . . . . . . . . 6 2 8 South Dakota . . . . . . . . . . 1 — 1Kentucky . . . . . . . . . . . . . 3 — 3 Tennessee . . . . . . . . . . . . . — 4 4Louisiana . . . . . . . . . . . . . 4 — 4 Texas . . . . . . . . . . . . . . . . 28 10 38Maine . . . . . . . . . . . . . . . 4 1 5 Utah . . . . . . . . . . . . . . . . 6 4 10Maryland . . . . . . . . . . . . . 14 4 18 Vermont . . . . . . . . . . . . . . 4 — 4Massachusetts . . . . . . . . . . 22 1 23 Virginia . . . . . . . . . . . . . . 21 — 21Michigan . . . . . . . . . . . . . 27 21 48 Washington . . . . . . . . . . . 21 10 31Minnesota . . . . . . . . . . . . 14 6 20 West Virginia . . . . . . . . . . 5 — 5Missouri . . . . . . . . . . . . . . 10 2 12 Wisconsin . . . . . . . . . . . . . 14 4 18
Montana. . . . . . . . . . . . . . 7 — 7 Total 578 196 774
The following table reflects the number of stores opened, expanded or relocated and closed during each ofthe past five fiscal years (square footage in thousands):
Total Stores
Fiscal Year Opened ClosedIn Operation at
Year-EndExpanded
or Relocated
TotalSquare Footage
at Year-End
2004 . . . . . . . . . . . . . . . . . . . . . . 19 (46) 892 — 15,3772005 . . . . . . . . . . . . . . . . . . . . . . 31 (72) 851 2 15,4532006 . . . . . . . . . . . . . . . . . . . . . . 44 (57) 838 2 16,1982007 . . . . . . . . . . . . . . . . . . . . . . 26 (63) 801 1 16,2152008 . . . . . . . . . . . . . . . . . . . . . . 6 (33) 774 1 15,932
Our new store opening costs depend on the building type, store size and general cost levels in thegeographical area. During fiscal 2008, we opened six large-format stores with an average size of approximately33,000 square feet. Our average net investment in a large-format store is approximately $1.5 million, which
6

includes leasehold improvements, furniture, fixtures and equipment, inventory (net of payable support) andpre-opening expenses. No small-format stores were opened in fiscal 2008.
During fiscal 2009, we expect to open approximately 13 to 15 new stores and close approximately 25stores. We also plan to remodel approximately 25 to 30 stores.
Information Technology
Our point-of-sale register transactions are polled nightly and our point-of-sale system interfaces with bothour financial and merchandising systems. We utilize point-of-sale registers and scanning devices to record thesale of product at a SKU level at our stores. We also utilize handheld radio frequency devices for a variety ofstore tasks including price look-up, perpetual inventory exception counting, merchandise receiving, vendorreturns and fabric sales processing. We have broadband communication and store controllers in our stores,resulting in an enhanced customer checkout experience and a better platform to further automate internalstore communications. We believe this will enable us to provide higher levels of customer and associatesatisfaction, while providing a platform that we can build on and leverage over the coming years.
Information obtained from item-level scanning through our point-of-sale system enables us to identifyimportant trends, increase in-stock levels of more popular SKUs, eliminate less profitable SKUs, analyze productmargins and generate data for the purpose of evaluating our advertising and promotions. We also believe thatour point-of-sale system allows us to provide better customer service by increasing the speed and accuracy ofregister checkout, enabling us to more rapidly restock merchandise and efficiently reprice sale items.
We operate on SAP Retail. SAP Retail includes all of our core financial, merchandise and retail systemsand links business processes on a single software platform. During fiscal 2008, we completed an upgrade tothe current version of SAP Retail software. The software for the upgrades was purchased in the fourth quarterof fiscal 2007. The cost of the upgrade is included in property equipment and leasehold improvements on ourconsolidated balance sheets. In addition to the upgrades to our existing SAP Retail systems, we purchasedadditional SAP modules in the fourth quarter of fiscal 2007, which will be implemented over the next 6 to9 months of fiscal 2009. The cost of the modules is included in construction in progress on our consolidatedbalance sheets.
Status of Product or Line of Business
During fiscal 2008, there was no public announcement nor is there a public announcement anticipatedabout either a new product line or line of business involving the investment of a material portion of ourassets.
Trademarks
We do business under trademarks for “Jo-Ann»,” “Joann.comTM,” “Jo-Ann ETC»,” “Jo-Ann Fabrics»,”“Jo-Ann Fabric and Craft Stores»,” “Jo-Ann Fabrics & Crafts»,” “Jo-Ann Fabrics and Crafts»” and we also ownnumerous trademarks relating to our private label products. We believe that our trademarks provide significantvalue to our business.
Seasonal Business
Our business exhibits seasonality that is typical for most retail companies, with much stronger sales inthe second half of the year than in the first half of the year. Net earnings are highest during the months ofSeptember through December when sales volumes provide significant operating leverage. In fiscal 2008,approximately 57 percent of our net sales occurred in the third and fourth quarters, and approximately31 percent occurred in the fourth quarter alone.
7

Customer Base
We are engaged in the retail sale of merchandise to the general public and, accordingly, no part of ourbusiness is dependent upon a single customer or a few customers. During fiscal 2008, no single storeaccounted for more than one percent of total net sales.
Backlog of Orders
We sell merchandise to the general public on a cash and carry basis and, accordingly, we have nosignificant backlog of orders.
Competitive Conditions
We are the nation’s largest specialty retailer of fabrics and one of the largest specialty retailers of crafts,serving customers in their pursuit of apparel and craft sewing, crafting, home decorating and other creativeendeavors. Our stores compete with other specialty fabric and craft retailers and selected mass merchants,including Wal-Mart, that dedicate a portion of their selling space to a limited selection of fabrics and craftsupply items. In addition, alternative methods of selling fabrics and crafts, such as over the Internet, couldresult in additional competitors in the future and increased price competition since our customers could morereadily comparison shop. We compete on the basis of product assortment, price, convenience and customerservice. We believe that the combination of our product assortment under one roof, quality sales events andknowledgeable and customer focused team members provides us with a competitive advantage.
There are three companies that we primarily compete with nationally in the fabric and craft specialtyretail industry, one in the fabric segment (Hancock Fabrics, Inc.) one in the craft segment (Michaels Stores,Inc.) and one in the craft segment that also carries fabrics (Hobby Lobby). There is also a regional operator,A.C. Moore Arts & Crafts, Inc., which competes in the craft segment. The balance of our competition iscomprised of smaller regional and local operators. We believe that we have several advantages over most of oursmaller competitors, including:
• purchasing power;
• brand recognition as the number one resource for fabric related categories;
• ability to support efficient nationwide distribution; and
• the financial resources to execute our strategy going forward.
Research and Development
During the three fiscal years ended February 2, 2008, we have not incurred any material expense forresearch activities relating to the development of new products or services or the improvement of existingproducts or services.
Environmental Disclosure
We are not engaged in manufacturing. Accordingly, we do not believe that compliance with federal, stateand local provisions regulating the discharge of material into the environment or otherwise relating to theprotection of the environment will have a material adverse effect upon our capital expenditures, income orcompetitive position.
Employees
As of February 2, 2008, we had approximately 21,707 full and part-time employees, of whom 20,125worked in our stores, 433 were employed in our Hudson distribution center, 228 were employed in our Visaliadistribution center, 188 were employed in our Opelika distribution center and 733 were employed at our storesupport center in Hudson. The number of part-time employees is substantially higher during our peak sellingseason. We believe our employee turnover is below average for retailers, primarily because our stores often are
8

staffed with sewing and crafting enthusiasts. In addition, we provide an attractive work environment,employee discounts, flexible hours and competitive compensation packages within the local labor markets. Ourability to offer flexible scheduling is important in attracting and retaining these employees, since approxi-mately 75 percent of our employees work part-time.
The United Steelworkers of America, Upholstery and Allied Industries Division currently representsemployees who work in our Hudson, Ohio distribution center. Our current contract expires on May 5, 2011. Webelieve that our relationship with our employees and the union are good.
Foreign Operations and Export Sales
In fiscal 2008, we purchased approximately one-third of our products directly from manufacturers locatedin foreign countries. These foreign suppliers are located primarily in China and other Asian countries. Inaddition, many of our domestic suppliers purchase a portion of their products from foreign suppliers. Because alarge percentage of our products are manufactured or sourced abroad, we are required to order these productsfurther in advance than would be the case if the products were manufactured domestically. We do not havematerial long-term contracts with any manufacturers.
Other Available Information
We make available, free of charge, on our website at www.Joann.com, our annual reports on Form 10-K,quarterly reports on Form 10-Q, current reports on Form 8-K and amendments to reports filed or furnishedpursuant to Section 13(a) or 15(d) of the Securities Exchange Act of 1934 as soon as we file such materialwith, or furnish it to, the Securities and Exchange Commission (“SEC”). We have posted on our website thecharters of our Audit, Compensation and Corporate Governance Committees; our Corporate GovernanceGuidelines, Code of Business Conduct and Ethics (which also serves as the Code of Ethics for the ChiefExecutive Officer and Financial Officers), and any amendments or waivers thereto. These documents are alsoavailable in print, free of charge, to any person requesting a copy from our Investor Relations department atour principal executive offices.
As required by Section 303A.12 of the Listed Company Manual of the New York Stock Exchange (the“NYSE”), our chief executive officer submitted to the NYSE his annual certification on July 6, 2007 stating thathe was not aware of any violation by our Company of the corporate governance listing standards of the NYSE.In addition, we have filed, as exhibits to this annual report on Form 10-K for the year-ended February 2, 2008,the certifications of our principal executive officer and principal financial officer required under Sections 302and 906 of the Sarbanes-Oxley Act of 2002.
Item 1A. Risk Factors
Our business and financial performance is subject to various risks and uncertainties. There are manyfactors that affect our business and financial performance, some of which are beyond our control. In additionto the factors discussed elsewhere in this Report, the following risks and uncertainties could materiallyadversely affect our business, prospects, financial condition, and results of operations. Other factors notpresently known to us, or that we presently believe are not material, could also affect our business andfinancial performance.
Economic Risks
Changes in economic conditions could have a material adverse effect on our business, revenue andprofitability
In general, our sales represent discretionary spending by our customers. Discretionary spending is affectedby many factors, including, among other things, general business conditions, interest rates, the availability ofconsumer credit, taxation, weather and consumer confidence in future economic conditions. Our customers’purchases of discretionary items, including our products, could decline during periods when disposable incomeis lower (for example, as a result of higher energy prices) or during periods of actual or perceived unfavorable
9

economic conditions. If this occurs, our revenues and profitability will decline. In addition, our sales could beadversely affected by a downturn in the economic conditions in the markets in which we operate. A prolongedeconomic downturn could have a material adverse effect on our business, financial condition and results ofoperations.
If customer interest in fabric and craft products declines, our revenues may decline
The success of our business depends on our customers purchasing our fabric and craft products. Ourproducts are not necessities and compete with numerous other leisure activities and other forms of entertain-ment. If our customers’ interest in fabric and craft products declines, that decline would result in the reductionof our revenues and have a negative impact on our business and prospects. Our inability or the inability of ourvendors to develop and introduce new products that interest our customers also could adversely affect ouroperating results. In addition, changes in demographic and societal trends could have a material adverse effecton our business and prospects.
Changes in interest rates could adversely impact profitability
We are subject to market risk from exposure to changes in interest rates, which affect our financing,investing and cash management activities. Changes in interest rates could have a negative impact on ourprofitability.
External Business Risks
Competition could negatively impact our operations
Competition is intense in the retail fabric and craft industry. We must remain competitive in the areas ofquality, price, selection, customer service and convenience. The location and atmosphere of retail stores areadditional competitive factors in the retail business.
Our primary competition is comprised of specialty fabric retailers and specialty craft retailers such asMichaels Stores, Inc., a national chain that operates craft and framing stores, Hobby Lobby, a regional chainthat operates craft stores, Hancock Fabrics, Inc., a national chain that operates fabric stores, and A.C. MooreArts & Crafts, Inc., a regional chain that operates craft stores in the eastern United States. We also competewith mass merchants, including Wal-Mart, that dedicate a portion of their selling space to a limited selectionof fabrics, craft supplies and seasonal and holiday merchandise. Some of our competitors have storesnationwide, several operate regional chains and numerous others are local merchants. Some of our competitors,particularly the mass merchants, are larger and have greater financial resources than we do. Our sales are alsoimpacted by store liquidations of our competitors. In addition, alternative methods of selling fabrics andcrafts, such as over the Internet, could result in additional competitors in the future and increased pricecompetition since our customers could more readily comparison shop. Moreover, we ultimately compete againstalternative sources of entertainment and leisure activities of our customers that are unrelated to the fabric andcrafts industry. This competition could result in the reduction of our prices and a loss of market share.
Our suppliers may encounter business issues and not meet our needs
Many of our suppliers are small companies that produce a limited number of items. Given their limitedresources and lack of financial flexibility, many of these firms are susceptible to cash flow issues, productiondifficulties, quality control issues and problems in delivering agreed-upon quantities on schedule. We cannotassure that we would be able, if necessary, to return products to these suppliers and obtain refunds of ourpurchase price or obtain reimbursement or indemnification from them if their products prove defective. Inaddition, many of these suppliers require extensive advance notice of our requirements in order to supplyproducts in the quantities we desire. This long lead time requires us to place orders far in advance of the timewhen certain products will be offered for sale, exposing us to shifts in demand. Our suppliers may be unable towithstand a downturn in economic conditions. In addition, based on public information, Wal-Mart plans toeliminate fabric sales in its new and remodeled stores and Hancock Fabrics is currently in a Chapter 11bankruptcy proceeding, both of which could negatively affect our fabric suppliers. Significant failures on thepart of our key suppliers could have a material adverse effect on our operating results.
10

Our dependence on foreign suppliers subjects us to possible delays in receipt of merchandise and tothe risks involved in foreign operations
In fiscal 2008, we purchased approximately one-third of our products directly from manufacturers locatedin foreign countries. A majority of our foreign suppliers are located in China and other Asian countries. Inaddition, many of our domestic suppliers purchase a portion of their products from foreign suppliers. Because alarge percentage of our products are manufactured or sourced abroad, we are required to order these productsfurther in advance than would be the case if products were manufactured domestically.
Foreign manufacturing is also subject to a number of other risks, including work stoppages; transportationdelays and interruptions; product quality issues; employee rights issues; other social concerns; epidemics;political instability; economic disruptions; the imposition of tariffs, duties, quotas, import and export controlsand other trade restrictions; changes in governmental policies; and other events. If any of these events occur,it could result in a material adverse effect on our business, financial condition, results of operations andprospects. In addition, reductions in the value of the U.S. dollar or revaluation of the Chinese currency, orother foreign currencies, could ultimately increase the prices that we pay for our products. All of our productsmanufactured overseas and imported into the United States are subject to duties collected by the UnitedStates Customs Service. We may be subjected to additional duties, significant monetary penalties, the seizureand forfeiture of the products we are attempting to import or the loss of import privileges if we or oursuppliers are found to be in violation of U.S. laws and regulations applicable to the importation of ourproducts. We also are required to issue letters of credit to finance certain imports. Our inability to obtainletters of credit could have a material adverse effect on our business.
Our business depends on shopping center traffic and our ability to identify suitable store locations
Our stores generally are located in strip shopping centers and “big box” shopping centers. Our sales aredependent in part on a high volume of shopping center traffic. Shopping center traffic may be adverselyaffected by, among other things, economic downturns, rising fuel costs, the closing of anchor stores, newshopping centers and other retail developments, or changes in customer shopping preferences. To takeadvantage of customer traffic and the shopping preferences of our customers, we need to maintain or acquirestores in desirable locations. Competition for suitable store locations is intense and therefore we cannot assurethat desirable store locations will continue to be available. A decline in the popularity of shopping centershopping among our target customers could have a material adverse effect on customer traffic and reduce oursales and net earnings.
The seasonality of our sales may negatively impact our operating results
Our business is seasonal, with a significant amount of sales and earnings occurring in the third and fourthfiscal quarters. Our best quarter in terms of sales and profitability historically has been the fourth quarter. Inaddition, excluding the effects of new store openings, our inventory levels and related short-term financingneeds have been seasonal, with the greatest requirements occurring primarily during our third fiscal quarter aswe increase our inventory in preparation for our peak selling season. Weak sales during the second half of theyear will negatively impact our operating results and cash flow generation.
Disruption to the transportation system, including increases in transportation costs due to transportationindustry challenges and rising fuel costs may negatively impact our operating results
We rely upon various means of transportation, including shipments by air, sea and truck, to deliverproducts to our distribution centers from vendors and from our distribution centers to our stores. Laborshortages in the transportation industry could negatively affect transportation costs and our ability to supplyour stores in a timely manner. In addition, long-term disruptions to the national and international transpor-tation infrastructure that lead to delays or interruptions of service could adversely affect our business. Inparticular, our business is highly dependent on the trucking industry to deliver products to our distributioncenters and our stores. Our operating results may be adversely affected if we are unable to secure adequatetrucking resources to fulfill our delivery schedules to the stores, particularly as we deliver our fall and seasonalmerchandise. We and some of our domestic vendors also depend on ocean transportation to bring importedproducts to the United States; thus, disruptions in the ocean transportation sector or at overseas and domestic
11
ports, or increased costs in the ocean transportation or ports sectors, could negatively impact our operatingresults.
The price of oil has fluctuated significantly in the last few years. Fuel price increases during the past yearhave increased our transportation costs for distribution to our stores, as well as our vendors’ transportationcosts. Further fuel price increases could decrease our operating profits.
Our business could be negatively impacted by changes in the labor market and our cost of doingbusiness could increase as a result of changes in federal, state or local regulations
Our performance is dependent on attracting and retaining a large number of quality employees. Many ofthose employees are in entry level or part-time positions with historically high rates of turnover. Our ability tomeet labor needs while controlling our costs is subject to external factors such as unemployment levels,prevailing wage rates, minimum wage legislation, the costs of providing employee benefits, workers compen-sation costs and changing demographics. Changes that adversely impact our ability to attract and retainquality employees could adversely affect our performance. Changes in the federal or state minimum wage,living wage requirements or changes in other wage or workplace regulations, including, for example, healthcare mandate or employee leave regulations, could adversely affect our financial condition and operatingresults.
The United Steelworkers of America, Upholstery and Allied Industries Division currently representsemployees who work in our Hudson, Ohio distribution center. Our current contract expires on May 5, 2011. Webelieve that our relations with our employees and the union are good, but if a strike were to occur it couldmaterially adversely affect our business, financial conditions and results of operations.
Operational Business Risks
The loss of key executives and failure to attract qualified management could limit our growth andnegatively impact our operations
Our continued success depends upon our ability to attract and retain qualified management, administra-tive and store personnel. Our inability to do so may have a material adverse effect on our business andprospects.
Failure to manage inventory effectively could negatively impact our operations
We strive to ensure the merchandise we offer remains fresh and compelling to our customers. However,due to the nature of our business, we purchase much of our inventory well in advance of each selling season.If we are not successful at predicting our sales trends and misjudge consumer preferences or demands, we willexperience lower sales than expected and will have excess inventory that may need to be held for a longperiod of time, written down or sold at prices lower than expected or discarded in order to clear excessinventory at the end of a selling season. These actions would reduce our operating performance. Conversely, ifwe underestimate consumer demand, we may not be able to provide products to our customers to meet theirdemand. Shortages of key items could also have a material adverse impact on our business, financial conditionand results of operations.
In addition, inventory shrink (inventory theft or loss) rates can significantly impact our businessperformance and financial results. We devote substantial efforts to minimize inventory shrink. Failure tomanage inventory shrink rates could materially adversely affect our business, financial condition and results ofoperations.
Failure to adequately maintain our perpetual inventory and automated replenishment systems couldnegatively impact our operations
We currently operate perpetual inventory, automated replenishment and weighted average cost inventorysystems. We believe these are necessary to adequately forecast, manage, and analyze our inventory levels,monitor our gross margin, and manage merchandise ordering quantities. If we fail to adequately support and
12

maintain these systems, it could have a material adverse impact on our financial condition and results ofoperations.
Inability to provide new and improved product selection could negatively impact our operations
Our products appeal to a broad range of consumers whose preferences cannot be predicted with certaintyand are subject to rapid change. Our success depends, in large part, upon our ability to anticipate, identifyand respond to changing product trends and consumer demand in a timely manner. The retailing industryfluctuates according to changing tastes and seasons, and merchandise usually must be ordered well in advance,frequently before consumer tastes are evidenced by consumer purchases. In addition, in order to ensuresufficient quantities and selection of products, we are required to maintain substantial levels of inventory,especially prior to peak selling seasons when we build up our inventory.
We cannot assure that we will be able to continue to offer an assortment of products that will appeal toour customers or that will satisfy consumer demands in the future. The failure to continue to identify andstock our stores with appealing products could result in reduced sales and thus have a material adverse effecton our business and financial performance.
Failure to grow sales may impact operations
Our comparable same-store sales have fluctuated significantly in the past, on both an annual and aquarterly basis. A variety of factors affect our same-store sales results, including, among other things, fashiontrends, the highly competitive retail store sales environment, new competing stores (proximity of our newstores or our competitor’s new stores to our existing stores), economic conditions, timing and effectiveness ofpromotional events, the effectiveness of our marketing, changes in our merchandise mix, calendar shifts andweather conditions. Annual revenue growth is driven by the opening of new stores and increased same-storesales. We cannot provide assurance that we will continue successfully to open stores or increase same-storesales, which could have an adverse impact on our results of operations.
Our failure to manage our new store growth could have a negative impact on our operations
Our growth is dependent, in large part, upon our ability to successfully add new stores (which primarily,but not exclusively, will be large-format stores) and close poorly performing stores (which primarily, but notexclusively, will be small-format stores). Our large-format stores accounted for 51 percent of our total fiscal2008 net sales. Our growth strategy includes, but is not limited to, the development of additional large-formatstores and an increasing percentage of our revenues coming from our large-format stores. The success of thisstrategy will depend upon a number of factors, summarized as follows:
Store specific risks
• our ability to expand in existing markets and penetrate new markets;
• the availability of desirable locations and the negotiation of acceptable leases for these sites;
• the availability of management resources in a particular area;
• the timely construction, fixturing, merchandising and hiring and training of store personnel;
• the closure of unsuccessful stores may result in the retention of liability for expensive leases;
General risks
• our ability to generate sufficient cash flow from operations;
• the availability of working capital;
• our ability to obtain financing;
• the expansion of our logistics systems to support new stores;
13

• the maintenance or upgrade of our information processing systems and the integration of those systemsat new stores;
• a significant portion of our management’s time and energy may be consumed with issues unrelated toadvancing our core business strategy, which could result in a deterioration of our operating results;
• our suppliers may be unable to meet the increased demand of additional stores in a timely manner; and
• general economic conditions and specific retail economic conditions.
Our failure to open new stores on a timely basis, obtain acceptance in markets in which we currently havelimited or no presence, attract qualified management and personnel or appropriately adjust operational systemsand procedures could have an adverse effect on our growth and profitability prospects. There can be noassurance that we will be able to successfully implement our store growth strategy. Not all of our recentlyopened stores are producing acceptable levels of sales and operating profit. Failure to achieve acceptable levelsof sales and operating profit at new stores could negatively impact our profitability capabilities.
The loss of, or disruption in, or our inability to efficiently operate our distribution network could havea negative impact on our business
We operate three distribution centers to support our business. If complications arise with any one facilityor any facility is severely damaged or destroyed, our other distribution centers may not be able to support theresulting additional distribution demands. This may adversely affect our ability to receive and deliver inventoryon a timely basis.
The majority of our inventory is shipped directly from suppliers to our distribution centers where theinventory is then processed, sorted, picked and shipped to our stores. We rely in large part on the orderlyoperation of this receiving and distribution process, which depends on adherence to shipping schedules andeffective management of our distribution network. Although we believe that our receiving and distributionprocess is efficient and well-positioned to support our expansion plans, we cannot assure that we haveanticipated all issues or that events beyond our control, such as disruptions in operations due to fire or othercatastrophic events, labor disagreements or shipping problems, will not result in delays in the delivery ofmerchandise to our stores. Such delays could negatively impact our business.
The efficient operation of our business is dependent on our information systems. Our failure tomaintain and upgrade our management information systems, including the successful and timelycompletion of significant pending projects, could negatively impact our operation.
We depend on a variety of information systems for the efficient functioning of our business. In particular,we rely on our information systems to effectively process transactions, manage inventory, purchase, sell andship goods on a timely basis and maintain cost-efficient operations. The failure of our information systems toperform as designed could disrupt our business and harm sales and profitability. Any material disruption orslowdown of our systems could cause information to be lost or delayed, which could have a negative impacton our business. We may experience operational problems with our information systems as a result of systemfailures, viruses, computer “hackers” or other causes. We cannot assure that our systems will be adequate tosupport future growth.
In addition, costs and potential problems and interruptions associated with the implementation of new orupgraded systems and technology or with maintenance or adequate support of existing systems could alsodisrupt or reduce the efficiency of our operations. We also rely heavily on our information technology staff. Ifwe cannot meet our staffing needs in this area, we may not be able to fulfill our technology or businessinitiatives while continuing to provide maintenance on existing systems.
Rapid technological change impacts the effectiveness of the adoption of, and could adversely affect therealization of business benefits from, technology. Conversely, not implementing sufficient technologicalchanges could also compromise the operation of our business. We are in the process of implementingsignificant upgrades to our information systems, including the systems used in our stores, and we also are in
14
the process of installing new point-of-sale hardware in many of our stores. Failure to complete these projectssuccessfully and in a timely manner could have a material negative effect on our operations.
Financing needs could restrict our operations
Our level of indebtedness could have negative consequences. For example, it could:
• make it more difficult for us to satisfy our other obligations;
• reduce the availability of our cash flow from operations to fund working capital, capital expenditures,acquisitions and other general corporate requirements because we will have to dedicate a significantportion of our cash flow from operations to payments of our indebtedness;
• limit our ability to borrow funds to pay for future working capital, capital expenditures, acquisitionsand other general corporate requirements;
• limit our flexibility in planning for, or reacting to, changes in our business and the industry in whichwe operate;
• place us at a disadvantage compared to our competitors that may have less debt; and
• make us more vulnerable to negative changes in economic and industry conditions.
In addition, our ability to make payments on our indebtedness depends upon our ability to generate cashflow in the future. Our ability to generate that cash flow depends upon, among other things, our futureoperating performance and our ability to refinance indebtedness when necessary. To some extent, each of thesefactors depends upon economic, financial, competitive and other factors beyond our control. If we cannotgenerate enough cash from operations to make payments on our indebtedness, we will need to refinance ourindebtedness, obtain additional financing or sell assets. We do not anticipate any issues in generatingsufficient cash flow, but we cannot assure that this will be the case, nor can we assure that we will be able toobtain acceptable financing to finance our operations and capital needs, which could restrict our operations.
Our senior bank credit facility expires on April 30, 2009. Our inability to renegotiate a new senior bankcredit facility could restrict our operations.
We may not be able to finance future needs or adapt our business plan to changes because ofrestrictions placed on us by our senior bank credit facility and indenture
The indenture governing our senior subordinated notes and our senior bank credit facility agreementcontain restrictive and financial covenants, which limit our ability to borrow money, make investments, redeemor make payments on our capital stock, incur liens and take other actions.
We currently are in compliance with all of these covenants and do not foresee any issues in continuing tocomply with these covenants in the future. However, our ability to remain in compliance with these covenantsand tests may be affected by unanticipated events or events beyond our control. If we fail to meet these testsor breach any of the covenants, the lenders under the senior bank credit facility or the holders of the notescould declare all amounts outstanding under their indebtedness, including accrued interest, to be immediatelydue and payable. A declaration of acceleration under the senior bank credit facility would constitute a defaultunder the indenture, and a default under the indenture would constitute a default under the senior bank creditfacility. We believe that we have sufficient credit availability to finance our operations and capital needs;however, we cannot assure that the operating and financial restrictions in our credit facilities will notadversely affect and limit or prohibit our ability to finance future operations, or longer term capital needs.
We could incur more debt
Our management currently believes that the cash generated by operations, together with the borrowingavailability under the senior bank credit facility, will be sufficient to meet our working capital needs duringfiscal 2009. However, if we are unable to generate sufficient cash from operations, we may be required toadopt one or more alternatives to raise cash, such as incurring additional indebtedness, selling assets,completing a separate debt or equity offering or restructuring our existing capital structure. If adequate
15

financing is unavailable or is unavailable on acceptable terms, we may be unable to maintain, develop orenhance our operations, including through the opening of new stores, or the introduction of new products andservices, to take advantage of future opportunities or respond to competitive pressures.
Failure to adequately maintain the security of our electronic and other confidential information couldmaterially adversely affect our financial condition and results of operations
We are dependent upon automated information technology processes. Any failure to maintain the securityof our data and our employees’ and customers’ confidential information, including via the penetration of ournetwork security and the misappropriation of confidential information, could result in financial obligations tothird parties, fines, penalties, regulatory proceedings and private litigation with potentially large costs, andalso could put us at a competitive disadvantage, result in deterioration in our employees’ and customers’confidence in us and thus have a material adverse impact on our business, financial condition and results ofoperations.
We currently are certified as being in compliance with the Payment Card Industry Data Security Standard(“PCI DSS”), but must be re-certified on a regular basis with the next re-certification scheduled in August2008. A company processing, storing, or transmitting payment card data must be PCI DSS compliant or risklosing its ability to process credit card payments and being audited and/or fined. Failure to maintain our PCIcertification could result in our inability to accept credit card payments or subject us to penalties and thuscould have a material negative effect on our operations.
Failure to comply with various regulations may result in damage to our business
Our policies and procedures are designed to comply with all applicable laws and regulations, includingthose imposed by the SEC and NYSE. Additional legal and regulatory requirements such as the Sarbanes-OxleyAct have increased the complexity of the regulatory environment. Also, various aspects of our operations aresubject to federal, state, local and foreign laws, rules and regulations, any of which may change from time totime. Additionally, we are regularly involved in various litigation matters that arise in the ordinary course ofour business, including liability claims, employment-related claims, contractual disputes and allegations thatwe have infringed third-party intellectual property rights.
Litigation or regulatory developments could adversely affect our business operations and financialperformance. Also, failure to comply with the various regulations may result in damage to our reputation, civiland criminal liability, fines and penalties, increased cost of regulatory compliance and restatements of financialstatements.
Other Factors
The foregoing list of risk factors is not all inclusive. Other factors and unanticipated events couldadversely affect our business. We do not undertake to revise or update these risks to reflect events orcircumstances that occur after the date of this report.
Item 1B. Unresolved Staff Comments
None.
Item 2. Properties
Our store support center and Hudson distribution center are located in a 1.4 million square foot facilityon 105 acres in Hudson, Ohio. We own both the facility and the real estate. The distribution center occupies1.0 million square feet and the remainder is used as our store support center, a large-format store, and officespace we lease to another tenant. In addition, we own 65 acres of land adjacent to our Hudson, Ohio facility.
We also operate a 630,000 square foot distribution center located on an 80-acre site in Visalia, California(the “facility”). On October 19, 2006, we completed a sale-leaseback transaction of this facility. We sold thefacility to an independent third party for approximately $24.7 million, net of expenses borne by us in
16
connection with the sale. We leased the facility back from the purchaser and we are treating the lease as anoperating lease.
The lease has an initial term of 20 years and will be automatically renewed for eight consecutive five-yearrenewal terms unless we provide notice of non-renewal prior to the commencement of any renewal term. Again of $1.5 million in connection with the sale of the facility was deferred, and is being amortized as areduction of rent expense over the minimum lease term of 20 years.
We opened our third distribution center in April 2006. We own both the facility and the real estate. This705,000 square foot facility is located on a 105-acre site in Opelika, Alabama.
The remaining properties that we occupy are leased retail store facilities, located primarily in high-trafficshopping centers. All store leases are operating leases and generally have initial terms of 5 to 15 years withrenewal options for up to 20 years. Certain store leases contain escalation clauses and contingent rents basedon a percent of net sales in excess of defined minimums. During the fiscal year ended February 2, 2008 weincurred $172.2 million of rental expense, including common area maintenance, taxes and insurance for storelocations. Despite closing 271 stores over the last five years, as of February 2, 2008, we were only paying renton one closed store location for which we have been unable to reach an early lease termination settlementwith the landlord or sublease the property.
As of February 2, 2008, the current terms of our store leases, assuming we exercise all lease renewaloptions, were as follows:
Fiscal Year Lease Terms ExpireNumber of
Store Leases
Month-to-month . . . . . . . . . . . . . . . . . . . . . . . . . . . . . . . . . . . . . . . . . . . . . . . . . . 242009 . . . . . . . . . . . . . . . . . . . . . . . . . . . . . . . . . . . . . . . . . . . . . . . . . . . . . . . . . . 442010 . . . . . . . . . . . . . . . . . . . . . . . . . . . . . . . . . . . . . . . . . . . . . . . . . . . . . . . . . . 322011 . . . . . . . . . . . . . . . . . . . . . . . . . . . . . . . . . . . . . . . . . . . . . . . . . . . . . . . . . . 502012 . . . . . . . . . . . . . . . . . . . . . . . . . . . . . . . . . . . . . . . . . . . . . . . . . . . . . . . . . . 382013 . . . . . . . . . . . . . . . . . . . . . . . . . . . . . . . . . . . . . . . . . . . . . . . . . . . . . . . . . . 55Thereafter. . . . . . . . . . . . . . . . . . . . . . . . . . . . . . . . . . . . . . . . . . . . . . . . . . . . . . . 541
Total . . . . . . . . . . . . . . . . . . . . . . . . . . . . . . . . . . . . . . . . . . . . . . . . . . . . . . . . 784
Item 3. Legal Proceedings
We are involved in various litigation matters in the ordinary course of our business. We are not currentlyinvolved in any litigation which we expect, either individually or in the aggregate, will have a material adverseeffect on our financial condition or results of operations.
Item 4. Submission of Matters to a Vote of Security Holders
No matters were submitted to a vote of shareholders during the fourth quarter.
17

Executive Officers of the Registrant
The following information is set forth pursuant to Item 401(b) of Regulation S-K.
Our executive officers are as follows:Name Age Position
Darrell Webb . . . . . . . . . . . . . . . . . . . . 50 Chairman of the Board, President and ChiefExecutive Officer
Kenneth Haverkost . . . . . . . . . . . . . . . 51 Executive Vice President, Store OperationsJames Kerr . . . . . . . . . . . . . . . . . . . . . 45 Executive Vice President, Chief Financial OfficerTravis Smith . . . . . . . . . . . . . . . . . . . . 35 Executive Vice President, Merchandising and
Marketing
Darrell Webb has been our Chairman of the Board, President and Chief Executive Officer since July 2006.Previously, he was President of Fred Meyer, the 128-store super center division of The Kroger Company, a retailgrocery chain, from 2002 until July 2006 and President of Kroger’s Quality Food Center Division from 1999 to2002.
Kenneth Haverkost has been our Executive Vice President, Store Operations since October 2007. For thetwenty-two years prior to assuming his current role, Mr. Haverkost held positions of increasing responsibilitywith Fred Meyer, the 128-store super center division of The Kroger Company. Immediately prior to joining us,Mr. Haverkost was Senior Vice President and Director of Store Operations of Fred Meyer.
James Kerr has been our Executive Vice President, Chief Financial Officer since July 2006. For the eightyears prior to assuming his current role, Mr. Kerr was our Vice President, Controller and he also served as theChief Accounting Officer from February through July 2006.
Travis Smith has been our Executive Vice President, Merchandising and Marketing since July 2006. For theeight years prior to assuming his current role, Mr. Smith held merchandising and marketing positions ofincreasing responsibility with Fred Meyer, the 128-store super center division of The Kroger Company.Immediately prior to joining us, Mr. Smith was Senior Vice President, General Merchandise of Fred Meyer.
PART II
Item 5. Market for Registrant’s Common Equity, Related Stockholder Matters and Issuer Purchases ofEquity Securities
Our common shares are traded on the New York Stock Exchange under the ticker symbol “JAS.” As ofApril 4, 2008, there were 744 shareholders of record. The closing price of the shares on April 4, 2008 was$16.66.
The quarterly high and low closing stock prices for fiscal 2008 and 2007 are presented in the table below:
High LowCommon Shares
Quarter Ended Fiscal 2008:February 2, 2008 . . . . . . . . . . . . . . . . . . . . . . . . . . . . . . . . . . . . . . . . . . . . . $21.00 $ 9.03November 3, 2007 . . . . . . . . . . . . . . . . . . . . . . . . . . . . . . . . . . . . . . . . . . . . 26.53 17.30August 4, 2007 . . . . . . . . . . . . . . . . . . . . . . . . . . . . . . . . . . . . . . . . . . . . . . 34.75 23.33May 5, 2007 . . . . . . . . . . . . . . . . . . . . . . . . . . . . . . . . . . . . . . . . . . . . . . . . 31.30 21.22
Quarter Ended Fiscal 2007:February 3, 2007 . . . . . . . . . . . . . . . . . . . . . . . . . . . . . . . . . . . . . . . . . . . . . $26.14 $17.37October 28, 2006 . . . . . . . . . . . . . . . . . . . . . . . . . . . . . . . . . . . . . . . . . . . . . 18.31 13.51July 29, 2006 . . . . . . . . . . . . . . . . . . . . . . . . . . . . . . . . . . . . . . . . . . . . . . . 16.80 12.09April 29, 2006 . . . . . . . . . . . . . . . . . . . . . . . . . . . . . . . . . . . . . . . . . . . . . . . 14.19 11.24
18

We did not pay cash dividends on our common shares during fiscal 2008 and fiscal 2007. Our dividendpolicy has been to retain earnings for operations and reinvestment into our business. Payments of dividends, ifany, in the future will be determined by the Board of Directors in light of business conditions and otherconsiderations.
See Part III, Item 12 for information regarding our equity compensation plans.
Total Numberof SharesPurchased
AveragePrice Paidper Share
Total Number ofShares Purchased as
Part of PubliclyAnnounced Plans or
Programs
Maximum Number ofShares that May YetBe Purchased Under
the Plans orPrograms
Purchases of Equity Securities by Jo-Ann Stores, Inc.
November 4 — December 1, 2007 . . . 618 $16.64 1,026,881 1,123,119December 2 — January 5, 2008 . . . . . — — 1,026,881 1,123,119January 6 — February 2, 2008. . . . . . 48 $11.88 1,026,929 1,123,071
Total . . . . . . . . . . . . . . . . . . . . . . . 666 $16.30 1,026,929 1,123,071
In December 1998, our Board of Directors authorized a discretionary program that allowed us to buy back2,150,000 common shares. That program does not have a stated expiration date. In the table above, the totalnumber of shares purchased represents shares repurchased directly from the market, as well as sharesrepurchased from employees related to the lapse of restricted shares that were provided to us to satisfyminimum statutory tax withholding requirements.
STOCK PERFORMANCE GRAPH
The following graph compares the yearly changes in total shareholder return on our common shares withthe total return of the S&P Composite — 500 Stock Index and the S&P Specialty Stores Index for the last fiveyears. In each case, we assumed an initial investment of $100 on February 1, 2003. Each subsequent date onthe chart represents the last day of the indicated fiscal year. We did not pay any dividends during suchfive-year period.
COMPARISON OF FIVE YEAR CUMULATIVE TOTAL RETURN
0
50
100
150
200
$'s
JAS S&P 500 Index S&P Specialty Stores
JAS 100 108 128 68 132 67
S&P 500 Index 100 132 137 150 169 163
S&P Specialty Stores 100 164 150 147 149 103
2003 2004 2005 2006 2007 2008
(1) Prior to the share reclassification on November 5, 2003, the return is based on the Class B common shares
19

Item 6. Selected Financial Data
The following table presents our selected financial data for each of our five fiscal years ending February 2,2008. The selected financial data for all fiscal years presented was derived from the audited financialstatements and should be read in conjunction with “Management’s Discussion and Analysis of FinancialCondition and Results of Operations,” the consolidated financial statements and notes thereto. We reclassifiedcertain amounts in the financial statements for our four fiscal years ending February 3, 2007 to conform to thecurrent year presentation.
February 2,2008
February 3,2007
January 28,2006
January 29,2005
January 31,2004
Fiscal Year-Ended (a)
(Dollars in millions, except per share data)
Operating Results:Net sales . . . . . . . . . . . . . . . . . . . . . . . . . . . . . . $1,878.8 $1,850.6 $1,882.8 $1,812.4 $1,734.1
Total net sales percentage increase (decrease) . . . 1.5% (1.7)% 3.9% 4.5% 3.1%Same-store sales percentage increase
(decrease) (b) . . . . . . . . . . . . . . . . . . . . . . . 3.5% (5.9)% (0.8)% 3.2% 3.6%Gross margin . . . . . . . . . . . . . . . . . . . . . . . . . . . 872.4 859.8 859.2 862.1 810.6Selling, general and administrative expenses . . . . . 774.8 790.5 774.0 708.5 671.2Store pre-opening and closing costs . . . . . . . . . . . 8.4 11.1 23.4 18.5 13.3Depreciation and amortization . . . . . . . . . . . . . . . 51.8 49.2 42.2 43.0 39.0Debt repurchase and share reclassification
expenses (d) . . . . . . . . . . . . . . . . . . . . . . . . . . — — — 4.2 5.5Goodwill impairment . . . . . . . . . . . . . . . . . . . . . . — — 27.1 — —Operating profit (loss) . . . . . . . . . . . . . . . . . . . . . 37.4 9.0 (7.5) 87.9 81.6
Operating profit (loss) as a percent of net sales . . 2.0% 0.5% (0.4)% 4.8% 4.7%Interest expense. . . . . . . . . . . . . . . . . . . . . . . . . 12.5 15.6 12.8 13.7 16.5Income (loss) before cumulative effect of
accounting change . . . . . . . . . . . . . . . . . . . . . 15.4 (2.9) (23.0) 46.2 40.1Cumulative effect of change in accounting principle,
net of tax (c) . . . . . . . . . . . . . . . . . . . . . . . . . — 1.0 — — —Net income (loss) . . . . . . . . . . . . . . . . . . . . . . . . $ 15.4 $ (1.9) $ (23.0) $ 46.2 $ 40.1Net income (loss) as a percent of net sales . . . . . . . 0.8% (0.1)% (1.2)% 2.5% 2.3%Per Share Data (e):Income (loss) per common share — diluted:
Income (loss) before cumulative effect ofaccounting change . . . . . . . . . . . . . . . . . . . . $ 0.62 $ (0.12) $ (1.01) $ 2.02 $ 1.82
Cumulative effect of change in accountingprinciple. . . . . . . . . . . . . . . . . . . . . . . . . . . — 0.04 — — —
Net income (loss) — diluted . . . . . . . . . . . . . . . $ 0.62 $ (0.08) $ (1.01) $ 2.02 $ 1.82Weighted average shares outstanding — diluted
(000’s) . . . . . . . . . . . . . . . . . . . . . . . . . . . . 24,950 23,519 22,716 22,887 22,003Financial Position:Cash and cash equivalents . . . . . . . . . . . . . . . . . . $ 25.4 $ 18.4 $ 17.9 $ 79.6 $ 17.4Inventories . . . . . . . . . . . . . . . . . . . . . . . . . . . . 472.2 453.4 514.7 439.7 404.6Inventory turnover . . . . . . . . . . . . . . . . . . . . . . . 2.2x 2.0x 2.1x 2.3x 2.4xCurrent assets . . . . . . . . . . . . . . . . . . . . . . . . . . 547.8 543.8 605.8 562.9 467.4Property, equipment and leasehold improvements,
net . . . . . . . . . . . . . . . . . . . . . . . . . . . . . . . . 297.5 311.8 331.7 238.0 218.4Total assets . . . . . . . . . . . . . . . . . . . . . . . . . . . . 869.4 866.3 946.8 839.3 719.8Current liabilities . . . . . . . . . . . . . . . . . . . . . . . . 242.4 231.9 240.7 258.8 198.2Long-term debt . . . . . . . . . . . . . . . . . . . . . . . . . 100.0 125.3 203.7 100.0 113.7Shareholders’ equity . . . . . . . . . . . . . . . . . . . . . . 440.0 409.8 399.4 408.9 340.8Long-term debt to total capitalization . . . . . . . . . . 18.5% 23.4% 33.8% 19.7% 25.0%Long-term debt to total capitalization, net of
cash . . . . . . . . . . . . . . . . . . . . . . . . . . . . . . . 14.5% 20.7% 31.7% 4.8% 22.0%
20

Item 6. Selected Financial Data (Continued)
February 2,2008
February 3,2007
January 28,2006
January 29,2005
January 31,2004
Fiscal Year-Ended (a)
(Dollars in millions, except per share data)
Per Share Data (e):Book value (f) . . . . . . . . . . . . . . . . . . . . . . $ 17.97 $ 17.18 $ 17.09 $ 18.10 $ 15.61Shares outstanding, net of treasury shares
(000’s) . . . . . . . . . . . . . . . . . . . . . . . . . 24,485 23,857 23,375 22,585 21,828Other Financial Information:Capital expenditures:
Cash . . . . . . . . . . . . . . . . . . . . . . . . . . . $ 28.6 $ 44.6 $ 118.9 $ 58.2 $ 52.2Cash — landlord reimbursement (g) . . . . . . 9.1 13.5 23.9 8.9 5.4
Total capital expenditures . . . . . . . . . . . . $ 37.7 $ 58.1 $ 142.8 $ 67.1 $ 57.6
Store Count:Small-format stores . . . . . . . . . . . . . . . . . . 578 615 676 733 801Large-format stores . . . . . . . . . . . . . . . . . . 196 186 162 118 91
Total . . . . . . . . . . . . . . . . . . . . . . . . . . . . 774 801 838 851 892
Store Square Footage (000’s) (h)
Small-format stores . . . . . . . . . . . . . . . . . . 8,477 9,034 9,810 10,608 11,492Large-format stores . . . . . . . . . . . . . . . . . . 7,455 7,181 6,388 4,845 3,885
Total . . . . . . . . . . . . . . . . . . . . . . . . . . . . 15,932 16,215 16,198 15,453 15,377
(a) All years include 52 weeks except for the fiscal year-ended February 3, 2007, which includes 53 weeks.(b) Same-store sales are defined as net sales from stores that have been open one year or more. Net sales are included in
the same-store sales calculation on the first day of the first month following the one-year anniversary of a store’s open-ing. In conjunction with the expansion or relocation of the Company’s stores, the net sales results from these storesare excluded from the same-store sales calculation until the first day of the first month following the one-year anniver-sary of its expansion or relocation. Further, in a 53-week year, net sales of the first 52 weeks are compared to the com-parable 52 weeks of the prior period.
(c) Effective January 29, 2006, the Company adopted Statement of Financial Accounting Standards (“SFAS”) No. 123(revised 2004), “Share-Based Payment,” (“SFAS No. 123R”), which replaced SFAS No. 123, using the modified prospec-tive method. SFAS No. 123R requires stock-based compensation to be measured using the fair value method of account-ing. The adoption of the new standard resulted in a cumulative after-tax adjustment related to estimated forfeitures.See “Management’s Discussion and Analysis of Financial Condition and Results of Operations,” “Note 1 — SignificantAccounting Policies” and “Note 8 — Stock-Based Compensation” contained in the notes to the consolidated financialstatements.
(d) Debt repurchase and share reclassification expenses include expenses related to the early extinguishment of debt andcosts associated with the reclassification of our former Class A and Class B common shares into a single class of com-mon stock that was approved by shareholders on November 4, 2003. See “Note 6 — Financing” contained in the notesto consolidated financial statements.
(e) Shares outstanding, as well as average basic and diluted shares outstanding used to calculate earnings per share, reflectthe impact of the increased shares outstanding as a result of the share reclassification that was approved by sharehold-ers on November 4, 2003. Per share data reflects the impact of this share reclassification.
(f) Book value is calculated by dividing shareholders’ equity by shares outstanding, net of treasury shares.(g) Capital expenditures reimbursed by the landlord represent the cost of assets acquired through the utilization of landlord
lease incentives.(h) Total store square footage includes selling floor space and inventory storage areas.
21

Item 7. Management’s Discussion and Analysis of Financial Condition and Results of Operations
This discussion provides the reader with information that will assist in an overall understanding of ourfinancial statements, changes in certain key indicators in those financial statements from year to year, thefactors that account for those changes and how certain accounting principles have impacted our financialstatements. This discussion should be read in conjunction with the audited consolidated financial statementsand notes to the consolidated financial statements presented in this Form 10-K. In addition, the financialinformation presented for years prior to fiscal 2008 has been reclassified for certain amounts to conform to thecurrent year presentation.
Overview
We are the nation’s largest specialty retailer of fabrics and one of the largest specialty retailers of crafts,serving customers in their pursuit of apparel and craft sewing, crafting, home decorating and other creativeendeavors. Our retail stores feature a variety of competitively priced merchandise used in sewing, crafting andhome decorating projects, including fabrics, notions, crafts, frames, paper crafting material, artificial floral,home accents, finished seasonal and home décor merchandise.
We review and manage to a number of key indicators in evaluating financial performance, the mostsignificant of which are:
• Net sales. We closely monitor our net sales, including net sales from stores open one year or more(“same-store sales”), by our two store formats, small-format stores and large-format stores. Net salesare compared to measure our overall sales growth and same-store sales are compared to measurewhether our existing stores continue to grow their sales volume. We also closely monitor per transactionaverage ticket value and customer transactions, both in total and by store format. These indicators helpto measure our effectiveness in attracting customers into our stores and the effectiveness of ourproduct assortment, promotions and service on sales. We also measure our sales per square footperformance in both of our store formats and compare them with our immediate competitors.
• Gross margins. Our management uses gross margin to evaluate merchandising and operating effective-ness for the Company. Merchandise selection and future decisions are, in part, based on gross marginperformance.
• Selling, general and administrative expense as a rate to sales. We also compare selling, general andadministrative expense to those of our competitors.
• Inventory turnover. We closely monitor our inventory investment, which is our single largest investedasset.
• Debt to total capitalization. We monitor our debt balances and leverage as a percent of totalcapitalization. We also monitor current and projected excess availability, as defined under our seniorbank credit facility, in order to ensure that adequate flexibility is available to execute our operatingplans.
An overview of our fiscal 2008 performance compared with fiscal 2007 (which includes 53 weeks with theexception of same-store sales percentage change, which is based on 52 weeks) performance follows:
• Net sales increased 1.5 percent to $1.879 billion. Same-store sales increased 3.5 percent versus a5.9 percent same-store sales decrease for last year. The increase in same-store sales was primarily drivenby higher average ticket due to new product assortments, better in-stocks, more effective marketingand the benefit of competitive withdrawals in the sewing business.
• Our gross margin rate, as a percentage of net sales, was consistent with the prior year. Our grossmargins in our retail stores improved due to reduced clearance markdowns and improved effectiveness,but were essentially offset by the addition of sales from Joann.com, our Internet business, of which wenow own 100% and which has a lower gross margin rate than our stores.
• Our inventory turnover improved from 2.0 turns for fiscal 2007 to 2.2 turns for fiscal 2008.
22

• Our debt to total capitalization ratio improved 490 basis points from 23.4 percent last year to18.5 percent for fiscal 2008.
• Our selling, general and administrative expenses (“SG&A”) as a percentage of net sales, excluding thoseexpenses separately identified in the statement of operations, decreased 150 basis points from42.7 percent last year to 41.2 percent this year. The decrease is primarily the result of our continuedefforts to control expenses, as well as the impact of additional logistics costs incurred in the firstquarter last year related to the opening of the Opelika, Alabama, distribution center, which did notrecur in the current year. The additional sales from Joann.com, which has a lower expense structurethan the retail stores, contributed to the improved leverage.
• Store pre-opening and closing costs decreased $2.7 million to $8.4 million in fiscal 2008, due to alower amount of store activity year-over-year.
• Net income for the year was $15.4 million, or $0.62 income per diluted share, compared with a net lossof $1.9 million, or $0.08 loss per diluted share in fiscal 2007.
During fiscal year 2008 we opened six large-format stores and closed 32 small-format stores and onelarge-format store compared with last year when we opened 26 stores and closed 63 stores.
Executive Overview of Fiscal 2008Qtr 1 Qtr 2 Qtr 3 Qtr 4 Total
Net sales . . . . . . . . . . . . . . . . . . . . . . . . . . . $424.2 $388.5 $480.2 $585.9 $1,878.8Same-store sales percent change . . . . . . . . . . . 1.8% 7.0% 2.4% 3.3% 3.5%Gross margin . . . . . . . . . . . . . . . . . . . . . . . . $200.6 $177.4 $230.5 $263.9 $ 872.4Gross margin percent . . . . . . . . . . . . . . . . . . . 47.3% 45.7% 48.0% 45.0% 46.4%Gross margin basis point change from prior
year . . . . . . . . . . . . . . . . . . . . . . . . . . . . . 70 (170) 60 — (10)Selling, general and administrative
expenses . . . . . . . . . . . . . . . . . . . . . . . . . $185.5 $188.1 $199.1 $202.1 $ 774.8SG&A percent to sales . . . . . . . . . . . . . . . . . . 43.7% 48.4% 41.5% 34.5% 41.2%SG&A basis point change from prior year . . . . . . (100) (310) (150) (140) (150)Net (loss) income . . . . . . . . . . . . . . . . . . . . $ (1.7) $ (18.4) $ 8.0 $ 27.5 $ 15.4Net (loss) income percent to sales . . . . . . . . . . (0.4)% (4.7)% 1.7% 4.7% 0.8%Net (loss) income basis point change from prior
year . . . . . . . . . . . . . . . . . . . . . . . . . . . . . 120 110 170 40 90
In order to deliver balanced and consistent financial improvements over the long term, we outlined a newstrategic growth plan for our company at the end of fiscal 2007, which included the following objectives:
• improve the customer shopping experience in our stores;
• enhance our marketing and merchandising offers; and
• refine our store development program.
These objectives were supported by dozens of initiatives and were enabled by the development of ourpeople, enhancement of our information systems, enhanced efficiencies in our supply chain, and improvedcontrols over inventory and selling, general and administrative expenses.
The execution of our strategic growth plan resulted in solid results for fiscal year 2008:
• We achieved same-store sales growth of 3.5 percent versus a same-store sales decrease of 5.9 percentlast year;
• We gained expense leverage in SG&A as the percentage of net sales decreased 150 basis points fromlast year; and
• Earnings per share for the year improved to $0.62 per diluted share, compared with a loss of $0.08 perdiluted share in the prior year.
23

This balanced and consistent improvement was reflected in our fourth quarter results as well.
Fourth quarter same-store sales increased 3.3 percent, representing our fourth consecutive quarter ofpositive same-store sales. The growth in sales was primarily driven by the fabric and sewing business and byimproved in-stocks. Our craft sales were also up slightly compared to last year’s fourth quarter. Those increaseswere partially offset by a decrease in our seasonal categories.
Overall gross margin was flat for the quarter, due to the consolidation of the Joann.com business, whichcarries a lower margin than our retail stores. Excluding the effect of Joann.com, gross margin improved 50 basispoints in the fourth quarter. The improvement was due to benefits from our global sourcing initiatives andfrom reduced clearance and promotional markdowns. Our decision to reduce purchases of seasonal merchandisewas also timely and helped to avoid a serious impact on gross margin.
We ended the year with more inventory than planned due to the following:
• the decision to delay the disposition of Christmas seasonal carryover, in order to capture more clearancesales through February; and
• the receipt of certain spring seasonal import merchandise earlier than originally planned.
All of the Christmas carryover was either sold or donated as of the end of February in fiscal 2009.
In terms of expense management, we continue to make progress in reducing operating costs in a numberof areas. Some of our largest savings during the year came from distribution centers, administrative overheadand certain insurance-related costs. While we have captured substantial savings over the past year, expensemanagement continues to be an ongoing process and we expect to continue to identify new opportunities forsavings.
Our six new stores and 26 remodels for fiscal year 2008 were all completed by the end of the thirdquarter. In fiscal year 2009, we expect to open 12 to 15 new stores that average slightly less than30,000 square feet. We also plan to remodel 25 to 30 stores that average just under 20,000 square feet. As wecontinue to improve overall business results and deliver more consistent performance from new stores, we planto accelerate new store openings in future years.
Looking ahead, the economic environment has added a degree of uncertainty for fiscal year 2009.However, we will continue to execute our strategic growth plan and continue to take advantage of competitivewithdrawals from the fabric industry. We also expect to be insulated from an economic downturn to a certainextent by the strong demographics of our shoppers and the steady performance of the craft industry duringprevious recessions. We have planned fiscal year 2009 taking into consideration the current economicenvironment.
During fiscal 2009, we will continue to execute and refine the operational and merchandising initiativeswe introduced in the previous year. We have also added a number of new initiatives for fiscal 2009 such as:
• implementation of our new point-of-sale and store systems SAP Retail package, including new humanresources and workforce management applications;
• continued integration of our Joann.com Internet business, to achieve stronger synergy with our retailstores; and
• remerchandising dozens of small-format stores, over and above those we have scheduled for remodels.
Recent Developments and Business Update
During the fourth quarter of fiscal 2008 we completed the purchase of the 62 percent of IdeaForest.com,Inc. (the operator of the Joann.com website) that we previously did not own for $23.6 million. Our currentpriority is to integrate this acquisition into the Company from an operational and a brand image perspective.We expect this transaction to be accretive to earnings for fiscal year 2009. In conjunction with the acquisition,we launched a site redesign of Joann.com. The improved website is more visually compelling, easier tonavigate, includes features such as a community area to share ideas, as well as a place to review and rate
24

products. This transaction provides us with the opportunity to integrate the online shopping experience withour stores to help improve the customer experience.
Results of Operations
The following table sets forth our financial information through operating profit (loss), expressed as apercentage of net sales. The following discussion should be read in conjunction with our consolidated financialstatements and related notes.
Feb 2, 2008 Feb 3, 2007 Jan 28, 2006Fiscal Year-Ended
Net sales. . . . . . . . . . . . . . . . . . . . . . . . . . . . . . . . . . . . 100.0% 100.0% 100.0%Gross margin . . . . . . . . . . . . . . . . . . . . . . . . . . . . . . . . . 46.4% 46.5% 45.6%Selling, general and administrative expenses . . . . . . . . . . . 41.2% 42.7% 41.1%Store pre-opening and closing costs . . . . . . . . . . . . . . . . . 0.4% 0.6% 1.2%Depreciation and amortization . . . . . . . . . . . . . . . . . . . . . 2.8% 2.7% 2.3%Goodwill impairment . . . . . . . . . . . . . . . . . . . . . . . . . . . . — — 1.4%
Operating profit (loss) . . . . . . . . . . . . . . . . . . . . . . . . . 2.0% 0.5% (0.4)%
Comparison of the 52 Weeks Ended February 2, 2008 and the 53 Weeks Ended February 3, 2007
Net sales. Net sales for fiscal 2008 increased 1.5 percent to $1.879 billion from $1.851 billion in theprior year. Same-store sales increased 3.5 percent compared with a same-store sales decrease of 5.9 percent forfiscal 2007. Our total store count at the end of the year was down 27 stores; however, the number oflarge-format stores in operation increased to 196 from 186 in fiscal 2007. The increase in the number oflarge-format stores during fiscal 2008 is the net result of six new stores and five small-format stores that werereclassified as large-format stores due to remodeling efforts during fiscal 2008, less the closing of onelarge-format store. Total store square footage decreased from 16.2 million square feet at the end of fiscal 2007to 15.9 million square feet at the end of fiscal 2008.
Large-format stores net sales for fiscal 2008 increased 6.6 percent to $954.5 million from $895.5 millionlast year. Same-store sales for large-format stores increased 3.9 percent for fiscal 2008, versus a same-storesales decrease of 8.0 percent for the same period last year. The large-format store improvement was due tochanges in our marketing program, improved store in-stocks and overall store conditions, which drove anincrease in customer transactions and an increase in average ticket. Large-format stores accounted forapproximately 51 percent of total net sales during fiscal 2008 compared with approximately 48 percent of totalnet sales for fiscal 2007.
Small-format stores net sales for fiscal 2008 decreased 4.5 percent to $912.4 million from $955.1 millionin the prior year. Our same-store sales performance for small-format stores increased 3.0 percent for fiscal 2008versus a same-store sales decrease of 4.1 percent for the same period last year. The increase in same-storesales for small-format stores was primarily due to increases in average ticket. Small-format stores accounted forapproximately 49 percent of total net sales during fiscal 2008 as compared to 52 percent for the same periodin the prior year.
On a category basis, our sewing businesses represented 50 percent of our fiscal 2008 sales volume, andincreased approximately 5.6 percent on a same-store sales basis. The increase in our sewing businesses wasdriven by consistent growth throughout our fabric and sewing accessory categories.
On a category basis, our non-sewing businesses represented 50 percent of our fiscal 2008 sales volumeand increased slightly on a same-store basis. We experienced positive sales results in our craft and partycategories, which were mostly offset by lower sales of Christmas and floral seasonal merchandise.
Gross margin. Gross margins may not be comparable to those of our competitors and other retailers.Some retailers include all of the costs related to their distribution network in cost of sales, while we exclude a
25
portion of them from gross margin and include them within SG&A. As a percent of net sales, gross margindecreased slightly to 46.4 percent for fiscal 2008 from 46.5 percent in the prior year. Our gross margins in ourretail stores improved due to reduced clearance markdowns and improved effectiveness, but were essentiallyoffset by the addition of sales from Joann.com, our newly consolidated Internet business, which had a lowergross margin rate than our stores.
Selling, general and administrative expenses. SG&A expenses include store and administrative payroll,employee benefits, stock-based compensation, distribution costs, store occupancy costs, advertising expensesand administrative expenses. SG&A expenses, excluding other expenses separately identified in the statementof operations, were $774.8 million for fiscal 2008 versus $790.5 million in the prior year. Included in the prioryear SG&A expenses was $4.4 million of separation costs related to our former chief executive officer and$3.5 million related to the recruitment and relocation of executive officers, as well as severance related to theelimination of positions at our store support center. As a percentage of net sales, SG&A expenses decreased to41.2 percent in fiscal 2008 versus 42.7 percent in the prior year. The decrease as a percentage of net sales isprimarily the result of our continued efforts to control expenses, as well as the impact of additional logisticscosts incurred in the first quarter last year related to the opening of the Opelika, Alabama, distribution center,which did not recur in the current year. The additional sales from Joann.com, which has a lower expensestructure than the retail stores, contributed to the improved leverage.
Stock-based compensation expense was $8.3 million for fiscal 2008, compared with $6.9 million in theprior year.
Store pre-opening and closing costs. Pre-opening costs are expensed as incurred. These costs includelease costs recognized prior to the store opening, hiring and training costs for new employees and processingof initial merchandise. Store closing costs consist of lease termination costs, lease costs for closed locations,loss on disposal of fixtures and equipment, severance for employees, third-party inventory liquidator costs andother costs incidental to store closings.
Store pre-opening and closing costs decreased $2.7 million to $8.4 million in fiscal 2008, due to adecreased level of store activity. Pre-opening costs decreased $1.9 million during fiscal 2008 to $3.1 millionfrom $5.0 million in fiscal 2007. During fiscal 2008, we opened six large-format stores, and we closed 32small-format stores and one large-format store. Store closing costs decreased $0.8 million during fiscal 2008,to $5.3 million compared with $6.1 million in the prior year.
Depreciation and amortization. Depreciation and amortization expense increased $2.6 million to$51.8 million in fiscal 2008 from $49.2 million in fiscal 2007. The increase is due to incremental depreciationassociated with new stores.
Operating profit. Operating profit was $37.4 million in fiscal 2008, compared with $9.0 million for fiscal2007.
Operating profit for large-format stores was $63.0 million in fiscal 2008 versus $51.1 million in the prioryear. Operating profit for small-format stores was $100.6 million in fiscal 2008 versus $95.5 million in fiscal2007. Operating loss for our other segment was $126.2 million in fiscal 2008 versus $137.6 million in fiscal2007. The improvement in large-format store operating profit was primarily driven by increased traffic as wellas higher average ticket. The improvement in operating profit of the small-format stores was driven by thecapture of volume from competitor store closures and category changes. The other segment includesunallocated corporate overhead in addition to the operating results on our Internet business. The improvementin operating loss of our other segment is primarily due to the result of our continued efforts to controlexpenses, as well as the impact of additional logistics costs incurred in the first quarter last year related tothe opening of the Opelika, Alabama, distribution center, which did not recur in the current year.
Interest expense. Interest expense for fiscal 2008 decreased $3.1 million to $12.5 million from$15.6 million in fiscal 2007. The decrease is attributable to lower average debt levels. Our average debt levelswere $145 million in fiscal 2008 versus $199 million in the prior year.
26

Income taxes. Our effective income tax rate for fiscal 2008 decreased to 38.1 percent from 56.1 percentin the prior year. The reduction in the effective tax rate is based primarily on the fact that we were in a bookloss position in the prior year. Our effective rate is subject to change based on the mix of income fromdifferent state jurisdictions, which tax at different rates, as well as the change in status or outcome ofuncertain tax positions.
We adopted Financial Accounting Standards Board (“FASB”) Interpretation No. 48 “Accounting forUncertainty in Income Taxes — An Interpretation of FASB Statement No. 109” (“FIN 48”) at the beginning offiscal year 2008. The interpretation prescribes a recognition threshold and a measurement attribute for thefinancial statement recognition and measurement of tax positions taken or expected to be taken in a taxreturn. For those benefits to be recognized, a tax position must be more-likely-than-not to be sustained uponexamination by taxing authorities. The amount recognized is measured as the largest amount of benefit that isgreater than 50 percent likely of being realized upon ultimate settlement. The adoption of FIN 48 resulted in acumulative effect adjustment to reduce beginning retained earnings equal to $1.6 million, which wascomprised of $1.1 million in taxes and $0.5 million in interest. Our unrecognized tax benefits upon adoptionwere $7.6 million, of which $4.9 million would affect the effective tax rate, if recognized within theconsolidated statement of operations.
Comparison of Fiscal 2007 to Fiscal 2006
Net sales. Net sales for fiscal 2007 decreased 1.7 percent to $1.851 billion from $1.883 billion in theprior year. Same-store sales decreased 5.9 percent compared with a same-store sales decrease of 0.8 percentfor fiscal 2006. Our total store count at the end of the year was down 37 stores; however, the number oflarge-format stores in operation increased to 186 from 162 in fiscal 2006. The increase in the number oflarge-format stores during fiscal 2007 is the net result of 26 new stores less the closing of two large- formatstores. Total store square footage increased slightly to 16.2 million square feet at the end of fiscal 2007.Large-format stores accounted for approximately 48 percent of total net sales during fiscal 2007 compared withapproximately 43 percent of total net sales for fiscal 2006.
Large-format stores net sales for fiscal 2007 increased 10.8 percent to $895.5 million from $808.0 millionfor fiscal 2006. Same-store sales for large-format stores decreased 8.0 percent for fiscal 2007, versus asame-store sales decrease of .05 percent in fiscal 2006. Large-format stores accounted for approximately48 percent of total net sales for fiscal 2007 as compared to 43 percent for the same period in the prior year.
Small-format stores net sales for fiscal 2007 decreased 11.1 percent to $955.1 million from $1,074.8 millionin the prior year. Our same-store sales performance for small-format stores decreased 4.1 percent for fiscal 2007versus a same-store sales decrease of 0.9 percent in the same period in the prior year. Small-format storesaccounted for approximately 52 percent of total net sales for fiscal 2007 as compared to 57 percent for the sameperiod in the prior year.
On a category basis, our non-sewing businesses represented 50 percent of our fiscal 2007 sales volumeand decreased approximately 5.3 percent compared to the prior year on a same-store sales basis. The primarydrivers of the decrease were continued softness in yarn, the planned reduction in our holiday inventory andnegative results in home accents and candles due to space reductions as part of the merchandise assortmentproject completed in fiscal 2006. This decrease was partially offset by increases in paper crafting, jewelry andkids’ crafts during fiscal 2007 versus fiscal 2006.
Our sewing businesses represented 50 percent of our fiscal 2007 sales volume and decreased approximately6.6 percent compared to the prior year on a same-store sales basis. The primary cause of the decrease wascontinued softness in fleece and home decorating fabric.
Gross margin. Gross margins may not be comparable to those of our competitors and other retailers.Some retailers include all of the costs related to their distribution network in cost of sales, while we exclude aportion of them from gross margin and include them within SG&A. As a percent of net sales, gross margin was46.5 percent for fiscal 2007 compared with 45.6 percent in the prior year, an overall increase of 90 basis
27

points. The increase was due to a less promotional pricing strategy, due in part to better sell-through on ourseasonal goods and reduced sales of clearance inventory primarily in the second half of the year.
Selling, general and administrative expenses. SG&A expenses include store and administrative payroll,employee benefits, stock-based compensation, distribution costs, store occupancy costs, advertising expensesand administrative expenses. SG&A expenses, excluding other expenses separately identified in the statementof operations, were $790.5 million for fiscal 2007 versus $774.0 million in the prior year. As a percentage ofnet sales, SG&A expenses increased to 42.7 percent in fiscal 2007 versus 41.1 percent in the prior year. Theincrease as a percentage of net sales was due to a decrease in same-store sales, increases in logistics costsrelated to the opening of a new distribution center, and increases in fixed store expenses, primarily caused bycosts related to the new large-format stores and the larger year-over-year large-format store base. In fiscal2007 we incurred $4.4 million of separation costs related to our former chief executive officer and $3.5 millionrelated to the recruitment and relocation of executive officers, as well as severance related to our eliminationof positions at our store support center.
Stock-based compensation expense was $6.9 million for fiscal 2007, compared with $2.8 million in theprior year. The reduced expense in fiscal 2006 was attributable to a reduced expectation regarding the level ofperformance-based shares that would be earned under the restricted stock program due to a decline in businessconditions at that time. This resulted in the reversal of performance-based expense that had been previouslyrecorded. In addition, stock-based compensation was credited in fiscal 2006 for expense that had beenrecognized related to unvested stock awards for executives who left our Company.
Store pre-opening and closing costs. Pre-opening costs are expensed as incurred. These costs includelease costs recognized prior to the store opening, hiring and training costs for new employees and processingof initial merchandise. Store closing costs consist of lease termination costs, lease costs for closed locations,loss on disposal of fixtures and equipment, severance for employees, third-party inventory liquidator costs andother costs incidental to store closings.
Store pre-opening and closing costs decreased $12.3 million to $11.1 million in fiscal 2007, due to fewerstore openings compared with the prior year. Pre-opening costs decreased $8.0 million during fiscal 2007 to$5.0 million from $13.0 million in fiscal 2006. Store closing costs decreased $4.3 million during fiscal 2007, to$6.1 million compared with $10.4 million in the prior year, although the year-over-year closings increased to63 from 57. During fiscal 2007, we opened 26 large-format stores and closed 61 small-format and two large-format stores.
Depreciation and amortization. Depreciation and amortization expense increased $7.0 million to$49.2 million in fiscal 2007 from $42.2 million in fiscal 2006. The increase was due to the new large-formatstore growth, as well as the opening of our new distribution center, which started to depreciate during thefirst quarter of fiscal 2007.
Operating profit (loss). Operating profit was $9.0 million in fiscal 2007, compared with an operating lossof $7.5 million for fiscal 2006. Operating profit for large-format stores was $51.1 million in fiscal 2007 versus$38.7 million for fiscal 2006. Operating profit for small-format stores was $95.5 million in fiscal 2007 versus$107.4 million for fiscal 2006. Operating loss for our other segment was $137.6 million in fiscal 2007 versus$153.6 million for fiscal 2006. The improvement in large-format store operating profit was primarily driven bythe increase in the number of large-format stores year-over-year. The decrease in small-format store operatingprofit was primarily driven by a decrease in the number of small-format stores year-over-year. In fiscal 2007and 2006, the other segment included unallocated corporate overhead. The improvement in operating loss ofour other segment is primarily due to the goodwill write off of $27.1 million that occurred in fiscal 2006 butdid not recur in fiscal 2007.
Interest expense. Interest expense for fiscal 2007 increased $2.8 million to $15.6 million from $12.8 millionin fiscal 2006. The increase was attributable to higher average debt levels as well as higher average borrowingcosts. Our average debt levels were $199 million in fiscal 2007 versus $183 million in fiscal 2006 while ouraverage borrowing costs were 7.1 percent in fiscal 2007 versus 6.7 percent in fiscal 2006.
28

Income taxes. Our effective income tax rate for fiscal 2007 increased to 56.1 percent from 39.7 percent,before goodwill impairment, in fiscal 2006. The effective tax rate differed from the statutory rate primarily dueto the impact of our book loss position, charitable contributions of retail inventory, state and local incometaxes and federal income tax credits.
Cumulative effect of change in accounting principle. Effective January 29, 2006, we adopted SFAS No. 123R,which, among other things, changes the method of accounting for forfeited share-based awards. Under the newstandard, forfeitures are required to be estimated at the time of the award grant, rather than accounting forthem as they occur. Prior to fiscal 2007, we had been expensing share-based awards without estimatingforfeitures, and reduced the expense recognized as forfeitures actually occurred. Accordingly, as of theadoption date, we were required to reduce our previously recognized expense based on estimated forfeitures ofexisting awards, which had not yet vested. The amount of this reduction was presented on the statement ofoperations as a cumulative effect of change in accounting principle, net of tax. The cumulative adjustmentincreased fiscal 2007 net earnings by $1.0 million, or $0.04 per diluted common share.
Store Closing Charges
As discussed in Note 1 — Significant Accounting Policies, we account for the costs of store closings inaccordance with the provisions of SFAS No. 146, “Accounting for Costs Associated with Exit or DisposalActivities.” We account for asset impairment in accordance with SFAS No. 144, “Accounting for the Impairmentor Disposal of Long-Lived Assets.” We review the productivity of our store base on an ongoing basis andactively manage our real estate to preserve maximum flexibility in lease terms. As of the end of fiscal 2008, wehad 16 stores that were open for one year or more where the store contribution was not cash flow positive. Inaddition, as of the end of fiscal 2008, we were paying rent on one closed store location where we had not yetobtained a sublease tenant or executed a lease termination.
Expenses recorded relating to store closings were $5.3 million, $6.1 million and $10.4 million in fiscal2008, 2007 and 2006, respectively. These charges are included in the line item “Store pre-opening and closingcosts” in the statements of operations included in the consolidated financial statements.
The store closing reserve was $0.7 million and $0.8 million as of February 2, 2008 and February 3, 2007,respectively. The reserve is comprised of charges related to non-cancelable lease obligations and other costs.
Stock-Based Compensation
During fiscal 2008 we returned to a “pay-for-performance” approach to compensation, whereas duringfiscal 2007 we focused on recruitment and retention of key management employees. The issuance ofperformance shares was based on the achievement of specific measurable performance criteria. In fiscal 2008,we granted 5,633 performance shares to operating officers and above, 172,435 time-based restricted sharesand 660,173 non-qualified stock options to team members at the manager level and above. However, we didnot grant any time-based restricted shares to our executive officers with the exception of 31,847 sharesgranted to a new executive officer in connection with his commencement of employment and which areincluded in the 172,435 shares mentioned above.
Liquidity and Capital Resources
Our capital requirements are primarily for capital expenditures in connection with infrastructure invest-ments, new store openings, and working capital requirements for seasonal inventory builds and new storeinventory purchases. Working capital requirements needed to finance our operations fluctuate during the yearand reach their highest levels during the third fiscal quarter as we increase our inventory in preparation forour peak selling season during the months of September through December. These requirements are fundedthrough a combination of internally generated cash flows from operations, credit extended by suppliers andborrowings under our credit facility.
29

The following table provides cash flow related information for the three fiscal years ended February 2,2008.
2008 2007 2006
Net cash provided by (used for) operating activities . . . . . . . . . . . . . $ 73.6 $105.8 $ (31.5)Net cash used for investing activities . . . . . . . . . . . . . . . . . . . . . . . (49.4) (33.4) (142.8)Net cash (used for) provided by financing activities . . . . . . . . . . . . . (17.2) (71.9) 112.6
Net increase (decrease) in cash and cash equivalents. . . . . . . . . . . . . $ 7.0 $ 0.5 $ (61.7)
Ending cash and cash equivalents . . . . . . . . . . . . . . . . . . . . . . . . . . $ 25.4 $ 18.4 $ 17.9
Net Cash Provided By (Used For) Operating Activities
Net cash provided by operating activities was $73.6 million in fiscal 2008, compared with $105.8 millionin fiscal 2007, a decrease of $32.2 million. The decrease was primarily attributable to the increase ininventories, net of accounts payable support, in fiscal 2008 as compared with the decrease in inventories, netof accounts payable support in fiscal 2007.
Inventories increased by $18.8 million, in fiscal 2008, compared with a decrease of $61.3 million in fiscal2007. The increase in inventory is primarily due to a higher investment in basic categories to support ourinitiative to improve in-stocks and the timing of spring merchandise receipts. Inventory turns for fiscal 2008were approximately 2.2, compared with 2.0 in fiscal 2007 and 2.1 in fiscal 2006. On a same-store basis,inventory levels in our small-format stores increased approximately four percent while large-format storesdecreased approximately one percent.
Total operating assets and liabilities in fiscal 2008 decreased by $5.1 million, which is net of landlordlease incentives of $9.1 million. We negotiate landlord lease incentives as we build certain new large-formatstore locations. See the discussion under “Capital Expenditures” below.
Net cash provided for operating activities was $105.8 million in fiscal 2007, compared with net cash usedfor operating activities of $31.5 million in fiscal 2006, an increase of $137.3 million. The increase wasgenerated by changes in operating assets and liabilities, which in fiscal 2007 represented a $49.1 millionsource of cash versus a $67.3 million use in cash in fiscal 2006.
During fiscal 2008, we received federal income tax refunds in the combined amount of $9.5 million dueprimarily to net operating loss carrybacks applied to prior years.
During fiscal 2007, the Internal Revenue Service concluded its examination of our returns for the fiscal2003 through fiscal 2005 tax years. On December 18, 2006, we remitted requested payments to the IRS whichtotaled $14.6 million including interest of $2.3 million and no penalties.
Net Cash Used For Investing Activities
Net cash used for investing activities totaled $49.4 million in fiscal 2008, which was comprised of capitalexpenditures of $37.7 million and the initial cash purchase price of the acquisition of the remaining equity ofJoann.com of $11.7 million (net of cash acquired). Net cash used for investing activities totaled $33.4 millionin fiscal 2007, which was comprised of capital expenditures of $58.1 million, partially offset by proceeds of$24.7 million from the sale-leaseback of our distribution center in Visalia, California. Capital expenditures arediscussed further under the caption “Capital Expenditures.” Cash used for investing activities in fiscal 2006consisted entirely of capital expenditures.
Capital Expenditures
Capital expenditures estimated for fiscal 2009 and for the last three fiscal years consist of cashexpenditures and cash expenditures reimbursed by our landlords. Capital expenditures primarily relate to theoperation of the stores, including new store openings, distribution center construction and informationtechnology. We also incur capital outlays for distribution center equipment and other non-store capital
30

investments. Landlord reimbursed capital expenditures represent the cost of assets acquired with landlord leaseincentives. Capital expenditures are summarized as follows:
2009Outlook 2008 2007 2006
Cash . . . . . . . . . . . . . . . . . . . . . . . . . . . . . . . . . . . . . . . . $50-$55 $28.6 $44.6 $118.9Cash — landlord-reimbursed. . . . . . . . . . . . . . . . . . . . . . . . 11.0 9.1 13.5 23.9
Total . . . . . . . . . . . . . . . . . . . . . . . . . . . . . . . . . . . . . . . $61-$66 $37.7 $58.1 $142.8
Capital expenditures for fiscal 2008 totaled $37.7 million. Store-related expenditures, including ourlarge-format store openings, accounted for approximately 70 percent, or $26.4 million, of total capitalspending in fiscal 2008. Expenditures related to technology accounted for approximately 23 percent, or$8.7 million, of total capital spending in fiscal 2008. During fiscal 2008, we opened six large-format storesand remodeled 26 stores.
Capital expenditures for fiscal 2007 totaled $58.1 million. Store-related expenditures, including those forour large-format store openings, accounted for approximately 74 percent of total capital spending in fiscal2007. Expenditures related to the construction of our distribution center in Opelika, Alabama, which opened inApril 2006, accounted for approximately six percent, or $4 million, of total capital spending in fiscal 2007.The total capital cost of this project was $48 million. During fiscal 2007, we opened 26 large-format stores.
Capital expenditures for fiscal 2006 totaled $142.8 million. Store related expenditures, including ourlarge-format store openings, accounted for approximately 65 percent of total capital spending in fiscal 2006.Capital expenditures related to the construction of our distribution center in Opelika, Alabama accounted forapproximately 30 percent of total capital spending in fiscal 2006. Capital spending on this project was$44 million for fiscal 2006.
We anticipate that capital expenditures in fiscal 2009 will be approximately $61 to $66 million or $50 to$55 million, net of landlord lease incentives received. We plan to open approximately 12 to 15 new stores. Wealso plan to remodel approximately 25 to 30 stores. Included in our capital spending plan is approximately $18to $20 million allocated for information technology spending primarily as it relates to implementing the newSAP modules.
Sale-Leaseback Transaction
On October 19, 2006, we completed a sale-leaseback transaction of our distribution center located inVisalia, California (the “Facility”). We sold the Facility to an independent third party for approximately$24.7 million, net of expenses incurred by us in connection with the sale. We leased the Facility back from thepurchaser and are treating the lease as an operating lease.
The lease has an initial term of 20 years and will be automatically renewed for eight consecutive five-yearrenewal terms unless we provide notice of non-renewal prior to the commencement of any renewal term. Again of $1.5 million in connection with the sale of the Facility was deferred, and is being amortized as areduction of rent expense over the minimum lease term of 20 years. Rent payments under the lease will bepayable monthly in advance. During each of the first five years of the term of the lease, annual rent paymentswill total $1.8 million. Thereafter, the annual rent payments will increase by 6 percent for each subsequentfive-year period (whether during the initial term or with respect to a renewal term), subject to either party’sright to have rent payments adjusted to a fair market rent, based on one or more appraisals, as necessary, inyear 41. Total scheduled rent payments during the initial term of the lease will be approximately $38.8 million.
Net Cash (Used For) Provided By Financing Activities
Net cash used for financing activities was $17.2 million in fiscal 2008 compared with net cash used forfinancing activities of $71.9 million in fiscal 2007. Long-term debt at the end of fiscal 2008 was $100.0 millionand consisted entirely of our 7.5 percent senior subordinated notes (the “Notes”). No borrowings wereoutstanding on our senior bank credit facility (the “Credit Facility”). Debt levels decreased $25.3 million
31

during fiscal 2008, compared with a net decrease of $78.4 million in the prior year. The decrease is dueprimarily to improved operating results, offset by increases in inventory and net capital investments, includingthe acquisition of the remaining equity of IdeaForest.com.
Net cash used for financing activities was $71.9 million in fiscal 2007 compared with net cash providedby financing activities of $112.6 million during fiscal 2006. Long-term debt at the end of fiscal 2007 was$125.3 million and consisted of $25.3 million on our senior bank credit facility and our $100.0 million7.5 percent senior subordinated notes. Debt levels decreased $78.4 million during fiscal 2007, compared with anet increase of $103.7 million in the prior year. The decrease was primarily due to lower inventory levels andother working capital improvements. In addition, we used the proceeds from the sale-leaseback transaction,noted above, to pay down borrowings on our Credit Facility.
In November 2007, we amended our Credit Facility to allow for the acquisition of the remaining equity ofIdeaForest.com. In February 2006, we amended our Credit Facility primarily to increase the commitment from$350 million to $425 million. The February 2006 amendment, among other things, also improved advance rateson inventory during peak borrowing periods and modified the consolidated net worth covenant. See “Sourcesof Liquidity” below for further discussion of the Credit Facility.
As of February 2, 2008, we had the ability to borrow up to an additional $231 million under our CreditFacility.
Common Share Repurchases
During fiscal 2008, we purchased 59,987 of our common shares at an aggregate price of $1.4 million,which represented shares repurchased from employees to satisfy minimum statutory tax withholding require-ments in connection with the vesting of restricted shares. As of February 2, 2008, we were authorized topurchase up to an additional 1.1 million common shares under previous authorizations from our Board ofDirectors.
Sources of Liquidity
We have three principal sources of liquidity: cash from operations, cash and cash equivalents on hand andour Credit Facility.
We believe that our Credit Facility, coupled with cash on hand and cash from operations, will be sufficientto cover our working capital, capital expenditure and debt service requirement needs for the foreseeablefuture.
Our liquidity is based, in part, on our debt ratings. As of the end of fiscal 2008, our long-term unsecureddebt was rated “Caa2” by Moody’s Investor Services and “CCC” by Standard & Poor’s. Moody’s rates our outlookas stable while Standard & Poor’s rates our outlook as positive. In March 2007, Moody’s confirmed the “Caa2”rating and changed their outlook from negative to stable. In June 2007, Standard & Poor’s confirmed our “CCC”rating and changed their outlook from negative to stable. In October 2007, Standard and Poor’s againconfirmed our “CCC” rating and changed their outlook from stable to positive. The change in outlook byMoody’s and Standard and Poor’s reflects their view that operating results have improved and the expectationthat working capital, free cash flow and debt protection measures will continue to improve. In assessing ourcredit strength, both Moody’s and Standard & Poor’s consider our capital structure and financial policies, aswell as our consolidated balance sheet and other financial information. Downgrades of our credit ratings couldadversely impact, among other things, our future borrowing costs, access to capital markets and new storeoperating lease costs, although we anticipate no short-term effect under our current credit arrangements.
Our current debt obligations as of the end of fiscal 2008 represent $100.0 million outstanding under our7.5 percent Notes. No borrowings were outstanding under our Credit Facility.
Senior Bank Credit Facility. Our Credit Facility is a $425 million revolver led by Bank of America RetailFinance, Inc., that expires on April 30, 2009, which the Company expects to renew prior to its expiration. InNovember 2007, we amended our Credit Facility to allow for the acquisition of the remaining equity of
32

IdeaForest.com. In February 2006, we amended the Credit Facility primarily to increase the commitment from$350 million to $425 million. The February 2006 amendment, among other things, also improved advance rateson inventory during peak borrowing periods and modified the consolidated net worth covenant.
The Credit Facility is secured by a first priority perfected security interest in our inventory, accountsreceivable, property and other assets and is fully and unconditionally guaranteed by certain of our wholly-owned subsidiaries. Interest on borrowings under the Credit Facility is calculated at the bank’s base rate orLondon Interbank Offered Rate (“LIBOR”) plus 1.25 percent to 2.00 percent, depending on the level of excessavailability (as defined in the Credit Facility) that is maintained. At February 2, 2008, interest on ourborrowings under the Credit Facility was at the bank’s base rate. The Credit Facility contains a sub-limit forletters of credit of $200 million. Deferred financing costs of $1.8 million, related to the unamortized portionof the deferred financing costs of the original financing, as well as the amendment fees, are being amortizedover the term of the Credit Facility.
As of February 2, 2008, we had no borrowings outstanding under the Credit Facility and $44.3 million inletters of credit outstanding.
Our weighted average interest rate and weighted average borrowings under the Credit Facility and priorsenior bank credit facility were 6.9 percent and $45.3 million during fiscal 2008 and 6.7 percent and$99.2 million during fiscal 2007.
The Credit Facility contains covenants that, among other things, restrict our ability to incur additionalindebtedness or guarantee obligations, engage in mergers or consolidations, dispose of assets, makeinvestments, acquisitions, loans or advances, engage in certain transactions with affiliates, conduct certaincorporate activities, create liens or change the nature of our business. We are restricted in our ability to prepayor modify the terms of other indebtedness, pay dividends and make other distributions when excessavailability, as defined, falls below certain levels. Further, we are required to comply with a minimumconsolidated net worth financial covenant if excess availability, as defined, is less than $35 million at anytime. As of February 2, 2008, excess availability was $231.3 million, and at our peak borrowing level duringfiscal 2008, the excess availability was $175.0 million. The Credit Facility also defines various events ofdefault, including cross-default provisions, defaults for any material judgments or a change in control. Duringfiscal 2008 we were in compliance with all covenants under the Credit Facility.
Senior Subordinated Notes. On February 26, 2004, we issued $100 million 7.5 percent Notes due 2012.Interest on the Notes is payable on March 1 and September 1 of each year. Deferred financing costs recordedat issuance of $2.6 million are reflected in other long-term assets and are being amortized as interest expenseover the term of the Notes utilizing the effective interest method. We have the option of redeeming the Notesat any time after March 1, 2008, in accordance with certain call provisions of the related indenture. The Notesrepresent unsecured obligations that are subordinated to the Credit Facility and are fully and unconditionallyguaranteed by certain of our wholly-owned subsidiaries.
The Note indenture contains covenants that, among other things, restrict our ability to incur additionalindebtedness, make restricted payments, engage in certain transactions with affiliates, create liens, sell assets, issueguarantees of and pledges securing indebtedness, and require an offer to repurchase the Notes in the event of achange in control. The indenture defines various events of default, including cross-default provisions and defaultsfor any material judgments. At February 2, 2008, we were in compliance with all covenants under the indenture.
Failure to comply with these restrictions and covenants could result in defaults under our Credit Facilityand/or the Note indenture. Any default, if not waived, could result in our debt becoming immediately due andpayable.
Off-Balance Sheet Transactions
Our liquidity is not dependent on the use of off-balance sheet transactions other than letters of credit andoperating leases, which are typical in a retail environment. In October 2006, we completed a sale-leasebacktransaction of our distribution center located in Visalia, California. For more information regarding thattransaction, see “Note 11 — Leases” contained in the notes to consolidated financial statements.
33

Contractual Obligations and Commitments
The following table summarizes our future cash outflows resulting from contractual obligations andcommitments as of February 2, 2008:
TotalLess than
1 Year 1-3 Years 4-5 YearsAfter
5 Years
Payments Due by Period (1)
7.5 percent senior subordinated notes . . . . . $ 100.0 $ — $ — $100.0 $ —7.5 percent senior subordinated notes
accrued interest(1) . . . . . . . . . . . . . . . . . 33.8 7.5 22.5 3.8 —Letters of credit(2) . . . . . . . . . . . . . . . . . . . 44.3 44.3 — — —Purchase commitments(3) . . . . . . . . . . . . . . 18.3 5.6 12.7 — —Operating leases . . . . . . . . . . . . . . . . . . . . 859.9 148.0 261.0 192.4 258.5FIN 48 — Uncertain tax positions(4) . . . . . . 10.7 — 1.9 8.8 —Promissory notes(5) . . . . . . . . . . . . . . . . . . 8.6 3.1 5.5 — —
Total Contractual Cash Obligations . . . . . . . . $1,075.6 $208.5 $303.6 $305.0 $258.5
(1) Interest is included as a contractual obligation on the 7.5 percent Notes only. The calculation of intereston the Credit Facility is dependent on the average borrowings during the year and a variable interest rate.See “Liquidity and Capital Resources — Sources of Liquidity” for further discussion of the Credit Facility.
(2) Includes commercial letters of credit of $22.1 million and $22.2 million of standby letters of credit.(3) Purchase commitments include legally binding contracts such as firm commitments for significant inven-
tory purchases. Purchase orders that are not binding agreements are excluded from the table.(4) The Company adopted FIN 48 at the beginning of fiscal year 2008.(5) Represents delayed payments in relation to the Joann.com acquisition.
Seasonality and Inflation
Our business exhibits seasonality, which is typical for most retail companies. Our sales are much strongerin the second half of the year than the first half of the year. Net earnings are highest during the months ofSeptember through December when sales volumes provide significant operating leverage. Working capitalrequirements needed to finance our operations fluctuate during the year and reach their highest levels duringthe second and third fiscal quarters as we increase our inventory in preparation for our peak selling seasonduring the fourth quarter.
Summarized below are key line items by quarter from our statements of operations and balance sheets:
Qtr 1 Qtr 2 Qtr 3 Qtr 4 Qtr 1 Qtr 2 Qtr 3 Qtr 4Fiscal 2008 Fiscal 2007
Net sales . . . . . . . . . . . . . $424.2 $388.5 $480.2 $585.9 $424.7 $363.2 $461.9 $600.8Same-store sales percentage
change . . . . . . . . . . . . . 1.8% 7.0% 2.4% 3.3% (3.9)% (8.4)% (5.4)% (6.0)%Gross margin. . . . . . . . . . . $200.6 $177.4 $230.5 $263.9 $198.0 $172.3 $219.1 $270.4Gross margin percent to
sales . . . . . . . . . . . . . . 47.3% 45.7% 48.0% 45.0% 46.6% 47.4% 47.4% 45.0%Operating profit (loss) . . . . $ 0.1 $ (26.2) $ 16.7 $ 46.8 $ (8.8) $ (29.5) $ 5.0 $ 42.3Operating profit (loss)
percent to sales . . . . . . . 0.0% (6.7)% 3.5% 8.0% (2.1)% (8.1)% 1.1% 7.0%Net (loss) income . . . . . . . $ (1.7) $ (18.4) $ 8.0 $ 27.5 $ (6.6) $ (21.2) $ 0.1 $ 25.8Inventories. . . . . . . . . . . . 434.9 507.9 570.9 472.2 463.0 511.3 535.8 453.4Long-term debt . . . . . . . . . 117.8 159.0 202.0 100.0 190.0 225.0 200.3 125.3
34

We believe that inflation has not had a significant effect on the growth of net sales or on net income(loss) over the past three years. There can be no assurance, however, that our operating results will not beaffected by inflation in the future.
Critical Accounting Policies and Estimates
Management strives to report our financial results in a clear and understandable manner. We followgenerally accepted accounting principles in preparing our consolidated financial statements. These principlesrequire us to make estimates and judgments that affect the reported amounts of assets, liabilities, revenues,expenses and related disclosures of contingent assets and liabilities. We base our estimates on historicalexperience and on other assumptions that we believe to be relevant under the circumstances, the results ofwhich form the basis for making judgments about carrying values of assets and liabilities that are not readilyapparent from other sources. Actual results could differ from these estimates under different assumptionsand/or conditions. We continually evaluate the information used to make these estimates as our business andthe economic environment changes. The use of estimates is pervasive throughout our financial statements, butthe accounting policies and estimates we consider most critical are as follows:
Inventory Valuation
Inventories are stated at the lower of cost or market with cost determined on a weighted average basis.Inventory valuation methods require certain management estimates and judgments. These include estimates ofshrink, as well as estimates of net realizable value on product designated for clearance, which affects theending inventory valuation at cost, as well as the gross margins reported for the year.
Our accrual for shrink is based on the actual historical shrink results of recent distribution centerinventory cycle counts and store physical inventories. These estimates are compared to actual results asphysical inventory counts are taken and reconciled to the general ledger. Substantially all of our store physicalinventory counts are taken during the first three quarters of each fiscal year, and the shrink accrual recordedat February 2, 2008 is based on shrink results of these prior physical inventories. All of our store locationsthat have been open one year or more are physically inventoried once a year. We will continue to monitor andadjust our shrink rate estimates based on the results of store physical inventories and shrink trends.
We estimate our reserve for clearance product based on a number of factors, including, but not limited to,quantities of slow moving or carryover seasonal merchandise on hand, historical recovery statistics and futuremerchandising plans. The accuracy of our estimates can be affected by many factors, some of which are beyondour control, including changes in economic conditions and consumer buying trends.
Revenue Recognition
Retail sales, net of estimated returns, and excluding sales taxes, are recorded at the point of sale whenpayment is made and customers take possession of the merchandise in the stores, at the point of shipment ofmerchandise ordered through the Internet, or in the case of custom orders, when the product is delivered tothe customer and any remaining balance due from the customer is collected. Deposits received for customorders are deferred as a liability until the related product is delivered to the customer. Shipping and handlingfees charged to customers are also recorded as retail sales with related costs recorded as cost of goods sold.Sales taxes are not included in retail sales because we act as a conduit for collecting and remitting sales taxesto the appropriate governmental authorities.
We allow for merchandise to be returned under most circumstances. Our current policy allows for ourcustomers to receive an even exchange or full refund based upon the original method of payment when thereturned purchase is accompanied with a receipt and the return is within 90 days of purchase.
Vendor Allowances
We receive vendor support in the form of cash payments or allowances through a variety of programs,including co-operative advertising, volume discounts, vendor compliance and defective merchandise. We have
35

agreements in place with each vendor setting forth the specific conditions for each allowance or payment. Inaccordance with Emerging Issues Task Force 02-16, “Accounting by a Customer (Including a Reseller) forCertain Consideration Received from a Vendor,” depending on the arrangement, we either recognize theallowance as a reduction of current costs or defer the payment over the period the related merchandise is sold.Payments that are a reimbursement of specific, incremental and identifiable costs incurred to promote vendors’products are recorded as an offset against advertising expense.
Gift Cards and Gift Card Breakage
Proceeds from the sale of gift cards are recorded as a liability and recognized as net sales when redeemedby the holder. Gift card breakage represents the remaining balance of our liability for gift cards for which thelikelihood of redemption by the customer is remote. This gift card breakage is recognized under the redemptionmethod and is determined based on the historical redemption patterns of gift cards sold since fiscal 2002.Beginning in fiscal 2006, we began to recognize gift card breakage as a component of net sales in theconsolidated statement of operations and in the fourth quarter of fiscal 2006, we recognized $3.2 million ofpre-tax income. In fiscal 2008 and 2007, we recognized $1.1 million and $0.8 million, respectively, of pre-taxincome related to gift card breakage.
Valuation of Long-Lived Assets
Long-lived assets and certain identifiable intangibles are reviewed for impairment whenever events orchanges in circumstances indicate that the carrying amount of an asset may not be recoverable. Recoverabilityof assets to be held and used is measured by a comparison of the carrying amount of the assets to futureestimated net cash flows to be generated by those assets. If such assets are considered to be impaired, theimpairment recognized is the amount by which the carrying amount of the assets exceeds the fair value of theassets.
Under SFAS No. 144, “Accounting for the Impairment or Disposal of Long-Lived Assets,” long-lived assets,except for goodwill and indefinite lived intangible assets, are reviewed for impairment when circumstancesindicate the carrying value of an asset may not be recoverable. Assets to be disposed of are recorded at thelower of carrying value or estimated net realizable value. We conduct this review on an ongoing basis andrecord any required impairment charge. During the fourth quarters of fiscal 2008, fiscal 2007 and fiscal 2006,we performed impairment tests as required by SFAS No. 144. As a result of the evaluation, we recordedimpairments of $0.6 million, $4.1 million and $3.0 million, respectively, on assets of certain stores still inoperation.
During the fourth quarter of fiscal 2006, we conducted the annual impairment testing required bySFAS No. 142, “Goodwill and Other Intangible Assets.” As a result of the evaluation, we determined that thecarrying amount of our goodwill totaling $27.1 million exceeded its implied fair value and that a fullimpairment of goodwill existed.
Capitalized Software Costs
Costs associated with the acquisition or development of software for internal use are capitalized inProperty, Equipment and Leasehold Improvements in our Consolidated Balance Sheets and are amortized overthe expected useful life of the software, generally between three and five years. Subsequent additions,modifications or upgrades to internal-use software are capitalized only to the extent that they allow thesoftware to perform a task it previously did not perform. Software maintenance and training costs are expensedin the period incurred.
Store Pre-Opening Costs
Store pre-opening costs are expensed as incurred and relate to the costs incurred prior to a new storeopening, which includes the hiring and training costs for new employees, processing costs of initialmerchandise and rental expense for the period prior to the store opening for business.
36

Store Closing Costs
We account for store closing costs according to the requirements of SFAS No. 146, “Accounting for CostsAssociated with Exit or Disposal Activities.” SFAS No. 146 requires companies to recognize costs associatedwith exit or disposal activities when they are incurred rather than at the date of a commitment to an exit ordisposal plan. SFAS No. 146 also establishes that the liability should initially be measured and recorded at fairvalue.
Accrued Expenses
We estimate certain material expenses in an effort to record those expenses in the period incurred. Ourmost material estimates relate to compensation, taxes and insurance-related expenses, significant portions ofwhich are self-insured. The ultimate cost of our workers’ compensation and general liability insurance accrualsare recorded based on actuarial valuations and historical claims experience. Our employee medical insuranceaccruals are recorded based on our medical claims processed as well as historical medical claims experience forclaims incurred but not yet reported. We maintain stop-loss coverage to limit the exposure to certaininsurance-related risks. Certain of our workers’ compensation and general liability accruals are recorded at anestimate of their net present value; other liabilities are not discounted. Differences in our estimates andassumptions could result in an accrual requirement materially different from the calculated accrual. Historically,such differences have not been significant.
Operating Leases
Rent expense for our operating leases, which may have escalating rentals over the term of the lease, isrecorded on a straight-line basis over the initial lease term and those renewal periods that are reasonablyassured. The initial lease term includes the “build-out” period of our leases, where no rent payments aretypically due under the terms of the lease. The difference between rent expense and rent paid is recorded as adeferred rent liability and is included in the consolidated balance sheets.
Construction allowances and landlord incentives received from landlords are recorded as a deferred rentliability and amortized to rent expense over the initial term of the lease. Our statement of cash flows reflectsthe receipt of incentives as an increase in cash flows from operating activities.
Income Taxes
We do business in various jurisdictions that impose income taxes. Management determines the aggregateamount of income tax expense to accrue and the amount currently payable based upon the tax statutes ofeach jurisdiction, pursuant to the asset and liability method. This process involves adjusting book income foritems that are treated differently by the applicable taxing authorities. Deferred tax assets and liabilities arereflected on our balance sheet for temporary differences that will reverse in subsequent years. If differentjudgments had been made, our tax expense, assets and liabilities could have been different. Our current taxprovision can be affected by our mix of income and identification or resolution of uncertain tax positions.Because income from different jurisdictions may be taxed at different rates, the shift in mix during a year orover years can cause the effective tax rate to change. We base our rate during the year on our best estimate ofan annual effective rate, and update those estimates quarterly. We also regularly evaluate the status and likelyoutcome of uncertain tax positions.
As a matter of course, we are regularly audited by federal and state tax authorities. We provide reservesfor potential exposures when we consider it probable that a taxing authority may take a sustainable positionon a matter contrary to our position. We evaluate these reserves, including interest thereon, on a quarterlybasis to ensure that they have been appropriately adjusted for events, including audit settlements that mayimpact our ultimate payment for such exposures.
37

Recent Accounting Pronouncements
In addition to the accounting pronouncements referenced above in our discussion of critical accountingpolicies, the following accounting pronouncements may have an impact on our results of operations orfinancial position in future years, as discussed further below.
Statement of Financial Accounting Standards No. 157, “Fair Value Measurement”
In September 2006, the FASB issued Statement No. 157, “Fair Value Measurements” (“SFAS 157”), whichprovides a definition of fair value, establishes a framework for measuring fair value and requires expandeddisclosures about fair value measurements. SFAS 157 is effective for us in fiscal 2009. The provisions ofSFAS 157 were applied prospectively effective February 3, 2008. The adoption of SFAS 157 did not have amaterial impact on our consolidated financial statements.
Statement of Financial Accounting Standards No. 159, “The Fair Value Option for Financial Assets and FinancialLiabilities”
In February 2007, the FASB issued Statement No. 159, “The Fair Value Option for Financial Assets andFinancial Liabilities” (“SFAS 159”). SFAS 159 allows entities the option to measure eligible financialinstruments at fair value as of specified dates. Such election, which may be applied on an instrument byinstrument basis, typically is irrevocable once elected. SFAS 159 is effective for us in fiscal 2009. Inaccordance with provisions within SFAS 159, adoption was elective. As such, we elected not to adopt SFAS 159.
Statement of Financial Accounting Standards No. 141 (revised 2007), “Business Combinations”
In December 2007, the FASB issued SFAS No. 141 (revised 2007), Business Combinations (“SFAS 141R”).SFAS 141R establishes principles and requirements for how an acquirer in a business combination recognizesand measures in its financial statements the identifiable assets acquired, the liabilities assumed and anynon-controlling interest in the acquiree at the acquisition date fair value. SFAS 141R significantly changes theaccounting for business combinations in a number of areas including the treatment of contingent consider-ation, pre-acquisition contingencies, transaction costs, in-process research and development and restructuringcosts. In addition, under SFAS 141R, changes in an acquired entity’s deferred tax assets and uncertain taxpositions after the measurement period will impact income tax expense. SFAS 141R provides guidance regardingwhat information to disclose to enable users of the financial statements to evaluate the nature and financialeffects of the business combination. SFAS 141R is effective for the Company in fiscal 2010 with earlyapplication prohibited. We do not expect the adoption of SFAS 141R to have a material impact on ourconsolidated financial statements.
Statement of Financial Accounting Standards No. 160, “Non-controlling Interests in Consolidated FinancialStatements, an amendment of ARB No. 51”
In December 2007, the FASB issued SFAS No. 160, Non-controlling Interests in Consolidated FinancialStatements, an amendment of ARB No. 51 (“SFAS 160”). SFAS 160 changes the accounting and reporting forminority interests, which will be recharacterized as non-controlling interests and classified as a component ofequity. This new consolidation method significantly changes the accounting for transactions with minorityinterest holders. SFAS 160 is effective for fiscal years beginning after December 15, 2008 with early applicationprohibited. We will adopt SFAS 160 beginning in the first quarter of fiscal 2010 and do not expect theadoption of SFAS 160 to have a material impact on our consolidated financial statements.
Cautionary Statement Concerning Forward-Looking Statements
Certain statements contained in this report that are not historical facts are forward-looking statementswithin the meaning of that term set forth in the Private Securities Litigation Reform Act of 1995. Suchforward-looking statements, which reflect our current views of future events and financial performance, involvecertain risks and uncertainties. When used herein, the terms “anticipates,” “plans,” “estimates,” “expects,”“believes,” and similar expressions as they relate to us or future events or conditional verbs such as “will,”
38

“should,” “would,” “may,” and “could” are intended to identify such forward-looking statements. All statementsthat address operating performance, events or developments that we expect or anticipate will occur in thefuture are forward-looking statements. Our actual results, performance or achievements may differ materiallyfrom those expressed or implied in the forward-looking statements. Risks and uncertainties that could cause orcontribute to such material differences include, but are not limited to, the items described in “Item 1A. RiskFactors” as well as general economic conditions, changes in customer demand, changes in trends in the fabricand craft industry, seasonality, failure to manage new store growth and the store transition strategy, theavailability of merchandise, changes in the competitive pricing for products, the impact of competitors’ storeopenings and closings, longer-term unseasonable weather or widespread severe weather, our ability toeffectively manage our distribution network, our ability to recruit and retain highly qualified personnel, ourability to sell-through our inventory at acceptable prices, energy costs, increases in transportation costs, ourindebtedness and limits on obtaining additional financing, failure to maintain the security of our electronicand other confidential information, failure to comply with various laws and regulations, consumer confidenceand debt levels, and other capital market and geo-political conditions. We caution readers not to place unduereliance on these forward-looking statements. We assume no obligation to update any of the forward-lookingstatements.
Item 7A. Quantitative and Qualitative Disclosures About Market Risk
We are indirectly exposed to foreign currency fluctuations on merchandise that is sourced internationallyand the impact of interest rate changes on our outstanding borrowings under our Credit Facility.
We believe foreign currency exchange rate fluctuations do not contain significant market risk due to thenature of our relationships with our international vendors. All merchandise contracts are denominated inU.S. dollars and are subject to negotiation prior to our commitment for purchases. As a result, there is not adirect correlation between merchandise prices and fluctuations in the exchange rate. We sourced approximatelyone-third of our purchases internationally in fiscal 2008. Our international purchases are concentrated in Chinaand other Asian countries.
In the normal course of business we employ established policies and procedures to manage our exposureto changes in interest rates. Our objective in managing the exposure to interest rate changes is to limit thevolatility and impact of interest rate changes on earnings and cash flows. This is accomplished through thedebt structure we set in place in fiscal 2005, which consists of the fixed rate $100 million Notes and ourvariable rate Credit Facility, which is designed to be a working capital facility. We estimate that a one-percentincrease or decrease in interest rates, based on fiscal 2008 average debt levels, would cause an increase ordecrease to interest expense of $0.5 million.
39

Item 8. Financial Statements and Supplementary Data
Jo-Ann Stores, Inc.
Index to Consolidated Financial Statements
Page
Report of Independent Registered Public Accounting Firm . . . . . . . . . . . . . . . . . . . . . . . . . . . . . . . . . 41Consolidated Balance Sheets as of February 2, 2008 and February 3, 2007 . . . . . . . . . . . . . . . . . . . . . . 42Consolidated Statements of Operations for each of the three fiscal years in the period ended February 2,
2008. . . . . . . . . . . . . . . . . . . . . . . . . . . . . . . . . . . . . . . . . . . . . . . . . . . . . . . . . . . . . . . . . . . . 43Consolidated Statements of Cash Flows for each of the three fiscal years in the period ended February 2,
2008. . . . . . . . . . . . . . . . . . . . . . . . . . . . . . . . . . . . . . . . . . . . . . . . . . . . . . . . . . . . . . . . . . . . 44Consolidated Statements of Shareholders’ Equity for each of the three fiscal years in the period ended
February 2, 2008 . . . . . . . . . . . . . . . . . . . . . . . . . . . . . . . . . . . . . . . . . . . . . . . . . . . . . . . . . . . 45Notes to Consolidated Financial Statements . . . . . . . . . . . . . . . . . . . . . . . . . . . . . . . . . . . . . . . . . . . 46
40

Report of Independent Registered Public Accounting Firm
To the Shareholders and Board of Directors of Jo-Ann Stores, Inc.:
We have audited the accompanying consolidated balance sheets of Jo-Ann Stores, Inc. (the Company) asof February 2, 2008 and February 3, 2007, and the related consolidated statements of operations, cash flows,and shareholders’ equity for each of the three years in the period ended February 2, 2008. These financialstatements are the responsibility of the Company’s management. Our responsibility is to express an opinion onthese financial statements based on our audits.
We conducted our audits in accordance with the standards of the Public Company Accounting OversightBoard (United States). Those standards require that we plan and perform the audit to obtain reasonableassurance about whether the financial statements are free of material misstatement. An audit includesexamining, on a test basis, evidence supporting the amounts and disclosures in the financial statements. Anaudit also includes assessing the accounting principles used and significant estimates made by management,as well as evaluating the overall financial statement presentation. We believe that our audits provide areasonable basis for our opinion.
In our opinion, the financial statements referred to above present fairly, in all material respects, theconsolidated financial position of Jo-Ann Stores, Inc. at February 2, 2008 and February 3, 2007, and theconsolidated results of its operations and its cash flows for each of the three years in the period endedFebruary 2, 2008, in conformity with U.S. generally accepted accounting principles.
As discussed in Note 5 to the consolidated financial statements, the Company adopted FinancialAccounting Standards Board Interpretation No. 48, “Accounting for Uncertainty in Income Taxes”, effectiveFebruary 4, 2007. As discussed in Note 1 to the consolidated financial statements, the Company adoptedStatement of Financial Accounting Standards No. 123(R), “Share-Based Payment,” effective January 29, 2006.
We also have audited, in accordance with the standards of the Public Company Accounting OversightBoard (United States), Jo-Ann Stores, Inc.’s internal control over financial reporting as of February 2, 2008,based on criteria established in Internal Control — Integrated Framework issued by the Committee ofSponsoring Organizations of the Treadway Commission and our report dated April 5, 2008 expressed anunqualified opinion thereon.
/s/ Ernst & Young LLP
Cleveland, OhioApril 5, 2008
41

Jo-Ann Stores, Inc.
Consolidated Balance Sheets
February 2,2008
February 3,2007
(Dollars in millions, exceptshare and per share data)
AssetsCurrent assets:
Cash and cash equivalents . . . . . . . . . . . . . . . . . . . . . . . . . . . . . . . . . . . . . . . . $ 25.4 $ 18.4Inventories . . . . . . . . . . . . . . . . . . . . . . . . . . . . . . . . . . . . . . . . . . . . . . . . . . 472.2 453.4Deferred income taxes . . . . . . . . . . . . . . . . . . . . . . . . . . . . . . . . . . . . . . . . . . . 26.4 41.6Prepaid expenses and other current assets . . . . . . . . . . . . . . . . . . . . . . . . . . . . . 23.8 30.4
Total current assets . . . . . . . . . . . . . . . . . . . . . . . . . . . . . . . . . . . . . . . . . . . . . . 547.8 543.8Property, equipment and leasehold improvements, net. . . . . . . . . . . . . . . . . . . . . . . 297.5 311.8Goodwill, net. . . . . . . . . . . . . . . . . . . . . . . . . . . . . . . . . . . . . . . . . . . . . . . . . . . 11.8 —Other assets . . . . . . . . . . . . . . . . . . . . . . . . . . . . . . . . . . . . . . . . . . . . . . . . . . . 12.3 10.7
Total assets . . . . . . . . . . . . . . . . . . . . . . . . . . . . . . . . . . . . . . . . . . . . . . . . . . . . $869.4 $866.3
Liabilities and Shareholders’ EquityCurrent liabilities:
Accounts payable . . . . . . . . . . . . . . . . . . . . . . . . . . . . . . . . . . . . . . . . . . . . . . $145.3 $147.5Accrued expenses . . . . . . . . . . . . . . . . . . . . . . . . . . . . . . . . . . . . . . . . . . . . . . 97.1 84.4
Total current liabilities . . . . . . . . . . . . . . . . . . . . . . . . . . . . . . . . . . . . . . . . . . . . 242.4 231.9Long-term debt . . . . . . . . . . . . . . . . . . . . . . . . . . . . . . . . . . . . . . . . . . . . . . . . . 100.0 125.3Long-term deferred income taxes . . . . . . . . . . . . . . . . . . . . . . . . . . . . . . . . . . . . . — 14.2Lease obligations and other long-term liabilities . . . . . . . . . . . . . . . . . . . . . . . . . . 87.0 85.1Commitments and contingencies (Note 10)Shareholders’ equity:
Preferred stock, no par value, 5,000,000 shares authorized, none issued. . . . . . . . . — —Common stock, stated value $0.05 per share; 150,000,000 authorized, issued
28,072,032 and 27,400,347, respectively . . . . . . . . . . . . . . . . . . . . . . . . . . . . 1.4 1.4Additional paid-in capital . . . . . . . . . . . . . . . . . . . . . . . . . . . . . . . . . . . . . . . . 194.6 176.9Retained earnings . . . . . . . . . . . . . . . . . . . . . . . . . . . . . . . . . . . . . . . . . . . . . . 288.5 274.7
484.5 453.0Treasury stock, at cost, 3,586,872 shares and 3,542,885 shares, respectively. . . . . . (44.5) (43.2)
Total shareholders’ equity . . . . . . . . . . . . . . . . . . . . . . . . . . . . . . . . . . . . . . . . . . 440.0 409.8
Total liabilities and shareholders’ equity . . . . . . . . . . . . . . . . . . . . . . . . . . . . . . . . $869.4 $866.3
See notes to consolidated financial statements
42

Jo-Ann Stores, Inc.
Consolidated Statements of Operations
February 2,2008
February 3,2007
January 28,2006
Fiscal Year-Ended
(Dollars in millions,except earnings per share data)
Net sales . . . . . . . . . . . . . . . . . . . . . . . . . . . . . . . . . . . . . . . . . . . . $1,878.8 $1,850.6 $1,882.8Cost of sales (exclusive of depreciation and amortization shown
separately below). . . . . . . . . . . . . . . . . . . . . . . . . . . . . . . . . . . . . 1,006.4 990.8 1,023.6
Gross margin . . . . . . . . . . . . . . . . . . . . . . . . . . . . . . . . . . . . . . . . 872.4 859.8 859.2Selling, general and administrative expenses . . . . . . . . . . . . . . . . . . . . 774.8 790.5 774.0Store pre-opening and closing costs . . . . . . . . . . . . . . . . . . . . . . . . . . 8.4 11.1 23.4Depreciation and amortization. . . . . . . . . . . . . . . . . . . . . . . . . . . . . . 51.8 49.2 42.2Goodwill impairment . . . . . . . . . . . . . . . . . . . . . . . . . . . . . . . . . . . . — — 27.1
Operating profit (loss) . . . . . . . . . . . . . . . . . . . . . . . . . . . . . . . . . 37.4 9.0 (7.5)Interest expense, net . . . . . . . . . . . . . . . . . . . . . . . . . . . . . . . . . . . . 12.5 15.6 12.8
Income (loss) before income taxes . . . . . . . . . . . . . . . . . . . . . . . . . 24.9 (6.6) (20.3)Income tax provision (benefit) . . . . . . . . . . . . . . . . . . . . . . . . . . . . . 9.5 (3.7) 2.7
Income (loss) before cumulative effect of accounting change . . . . . . . . 15.4 (2.9) (23.0)Cumulative effect of change in accounting principle, net of tax . . . . . . . — 1.0 —
Net income (loss) . . . . . . . . . . . . . . . . . . . . . . . . . . . . . . . . . . . . . . $ 15.4 $ (1.9) $ (23.0)
Income (loss) per common share — basic:Income (loss) before cumulative effect of accounting change. . . . . . . $ 0.63 $ (0.12) $ (1.01)Cumulative effect of change in accounting principle . . . . . . . . . . . . . — 0.04 —
Net income (loss) . . . . . . . . . . . . . . . . . . . . . . . . . . . . . . . . . . . . $ 0.63 $ (0.08) $ (1.01)
Income (loss) per common share — diluted:Income (loss) before cumulative effect of accounting change. . . . . . . $ 0.62 $ (0.12) $ (1.01)Cumulative effect of change in accounting principle . . . . . . . . . . . . . 0.04 —
Net income (loss) . . . . . . . . . . . . . . . . . . . . . . . . . . . . . . . . . . . . $ 0.62 $ (0.08) $ (1.01)
See notes to consolidated financial statements
43

Jo-Ann Stores, Inc.
Consolidated Statements of Cash Flows
February 2,2008
February 3,2007
January 28,2006
Fiscal Year-Ended
(Dollars in millions)
Net cash flows from operating activities:Net income (loss) . . . . . . . . . . . . . . . . . . . . . . . . . . . . . . . . . . . . $ 15.4 $ (1.9) $ (23.0)Adjustments to reconcile net income (loss) to net cash provided by
(used for) operating activities:Depreciation and amortization . . . . . . . . . . . . . . . . . . . . . . . . . . 51.8 49.2 42.2Deferred income taxes . . . . . . . . . . . . . . . . . . . . . . . . . . . . . . . . 0.7 (3.0) (21.1)Stock-based compensation expense . . . . . . . . . . . . . . . . . . . . . . . 8.3 6.9 2.8Cumulative effect of change in accounting principle . . . . . . . . . . . — (1.0) —Amortization of deferred financing costs . . . . . . . . . . . . . . . . . . . 0.9 0.9 0.9Loss on disposal and impairment of fixed assets . . . . . . . . . . . . . . 1.6 5.6 6.9Goodwill impairment . . . . . . . . . . . . . . . . . . . . . . . . . . . . . . . . . — — 27.1
Changes in operating assets and liabilities:(Increase) decrease in inventories. . . . . . . . . . . . . . . . . . . . . . . . (18.8) 61.3 (75.0)Decrease (increase) in prepaid expenses and other current assets . . 6.6 4.8 (12.9)(Decrease) increase in accounts payable . . . . . . . . . . . . . . . . . . . (2.2) 0.9 (20.6)Increase (decrease) in accrued expenses . . . . . . . . . . . . . . . . . . . 8.2 (10.3) 2.5(Decrease) increase in lease obligations, net . . . . . . . . . . . . . . . . (2.6) 3.6 34.8Increase in other long-term liabilities . . . . . . . . . . . . . . . . . . . . . 4.5 0.2 1.0Other, net . . . . . . . . . . . . . . . . . . . . . . . . . . . . . . . . . . . . . . . . (0.8) (11.4) 2.9
Net cash provided by (used for) operating activities. . . . . . . . . . . . . . . 73.6 105.8 (31.5)Net cash used for investing activities:
Capital Expenditures . . . . . . . . . . . . . . . . . . . . . . . . . . . . . . . . . . . (37.7) (58.1) (142.8)Net proceeds from sale-leaseback transaction . . . . . . . . . . . . . . . . . . — 24.7 —Payment for Acquisition, net of cash acquired . . . . . . . . . . . . . . . . . (11.7) — —
Net cash used for investing activities . . . . . . . . . . . . . . . . . . . . . . . . . (49.4) (33.4) (142.8)Net cash flows (used for) provided by financing activities:
Net change in revolving credit facility. . . . . . . . . . . . . . . . . . . . . . . (25.3) (78.4) 103.7Proceeds from stock-based compensation plans . . . . . . . . . . . . . . . . 7.8 5.2 7.9Other, net . . . . . . . . . . . . . . . . . . . . . . . . . . . . . . . . . . . . . . . . . . 0.3 1.3 1.0
Net cash (used for) provided by financing activities . . . . . . . . . . . . . . . (17.2) (71.9) 112.6
Net increase (decrease) in cash and cash equivalents . . . . . . . . . . . . . . 7.0 0.5 (61.7)Cash and cash equivalents at beginning of year . . . . . . . . . . . . . . . . . . 18.4 17.9 79.6
Cash and cash equivalents at end of year . . . . . . . . . . . . . . . . . . . . . . $ 25.4 $ 18.4 $ 17.9
Supplemental disclosures of cash flow information:Cash paid during the year for:
Interest . . . . . . . . . . . . . . . . . . . . . . . . . . . . . . . . . . . . . . . . . $ 12.5 $ 15.2 $ 12.8Income taxes, net of refunds . . . . . . . . . . . . . . . . . . . . . . . . . . . (7.2) 20.1 26.9
See notes to consolidated financial statements
44
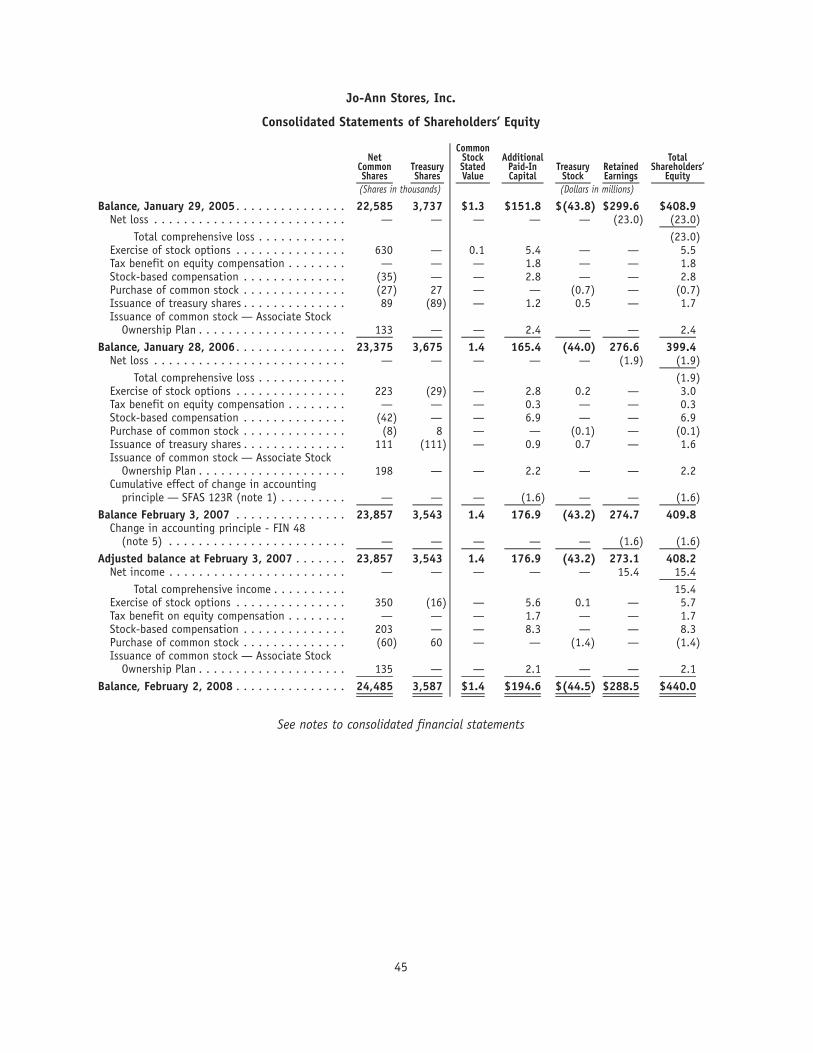
Jo-Ann Stores, Inc.
Consolidated Statements of Shareholders’ Equity
NetCommonShares
TreasuryShares
CommonStockStatedValue
AdditionalPaid-InCapital
TreasuryStock
RetainedEarnings
TotalShareholders’
Equity(Shares in thousands) (Dollars in millions)
Balance, January 29, 2005 . . . . . . . . . . . . . . . 22,585 3,737 $1.3 $151.8 $(43.8) $299.6 $408.9Net loss . . . . . . . . . . . . . . . . . . . . . . . . . . — — — — — (23.0) (23.0)
Total comprehensive loss . . . . . . . . . . . . (23.0)Exercise of stock options . . . . . . . . . . . . . . . 630 — 0.1 5.4 — — 5.5Tax benefit on equity compensation . . . . . . . . — — — 1.8 — — 1.8Stock-based compensation . . . . . . . . . . . . . . (35) — — 2.8 — — 2.8Purchase of common stock . . . . . . . . . . . . . . (27) 27 — — (0.7) — (0.7)Issuance of treasury shares . . . . . . . . . . . . . . 89 (89) — 1.2 0.5 — 1.7Issuance of common stock — Associate Stock
Ownership Plan . . . . . . . . . . . . . . . . . . . . 133 — — 2.4 — — 2.4Balance, January 28, 2006 . . . . . . . . . . . . . . . 23,375 3,675 1.4 165.4 (44.0) 276.6 399.4
Net loss . . . . . . . . . . . . . . . . . . . . . . . . . . — — — — — (1.9) (1.9)Total comprehensive loss . . . . . . . . . . . . (1.9)
Exercise of stock options . . . . . . . . . . . . . . . 223 (29) — 2.8 0.2 — 3.0Tax benefit on equity compensation . . . . . . . . — — — 0.3 — — 0.3Stock-based compensation . . . . . . . . . . . . . . (42) — — 6.9 — — 6.9Purchase of common stock . . . . . . . . . . . . . . (8) 8 — — (0.1) — (0.1)Issuance of treasury shares . . . . . . . . . . . . . . 111 (111) — 0.9 0.7 — 1.6Issuance of common stock — Associate Stock
Ownership Plan . . . . . . . . . . . . . . . . . . . . 198 — — 2.2 — — 2.2Cumulative effect of change in accounting
principle — SFAS 123R (note 1) . . . . . . . . . — — — (1.6) — — (1.6)Balance February 3, 2007 . . . . . . . . . . . . . . . 23,857 3,543 1.4 176.9 (43.2) 274.7 409.8
Change in accounting principle - FIN 48(note 5) . . . . . . . . . . . . . . . . . . . . . . . . — — — — — (1.6) (1.6)
Adjusted balance at February 3, 2007 . . . . . . . 23,857 3,543 1.4 176.9 (43.2) 273.1 408.2Net income . . . . . . . . . . . . . . . . . . . . . . . . — — — — — 15.4 15.4
Total comprehensive income . . . . . . . . . . 15.4Exercise of stock options . . . . . . . . . . . . . . . 350 (16) — 5.6 0.1 — 5.7Tax benefit on equity compensation . . . . . . . . — — — 1.7 — — 1.7Stock-based compensation . . . . . . . . . . . . . . 203 — — 8.3 — — 8.3Purchase of common stock . . . . . . . . . . . . . . (60) 60 — — (1.4) — (1.4)Issuance of common stock — Associate Stock
Ownership Plan . . . . . . . . . . . . . . . . . . . . 135 — — 2.1 — — 2.1Balance, February 2, 2008 . . . . . . . . . . . . . . . 24,485 3,587 $1.4 $194.6 $(44.5) $288.5 $440.0
See notes to consolidated financial statements
45

Jo-Ann Stores, Inc.
Notes to Consolidated Financial Statements
Note 1 — Significant Accounting Policies
Nature of Operations
Jo-Ann Stores, Inc. (the “Company”), an Ohio corporation, is a fabric and craft retailer with 774 retailstores in 47 states at February 2, 2008. The 578 small-format and 196 large-format stores feature a variety ofcompetitively priced merchandise used in sewing, crafting and home decorating projects, including fabrics,notions, crafts, frames, paper crafting material, artificial floral, home accents, finished seasonal and homedécor merchandise.
The Company manages its business in operating segments that are reportable segments: large-formatstores, small-format stores and other. See Note 12 — Segment Reporting for further detail.
The significant accounting policies applied in preparing the accompanying consolidated financialstatements of the Company are summarized below.
Basis of Presentation
The consolidated financial statements include the accounts of the Company and its subsidiaries. Allsignificant intercompany accounts and transactions have been eliminated. Certain amounts in the fiscal 2007and 2006 financial statements have been reclassified to conform to the current year presentation.
Use of Estimates
The preparation of financial statements in conformity with accounting principles generally accepted in theUnited States (“GAAP”) requires management to make estimates and assumptions that affect reported amountsof assets and liabilities at the date of the financial statements and the reported amounts of revenues andexpenses during the reporting period. Since actual results may differ from those estimates, the Company revisesits estimates and assumptions, as new information becomes available.
Fiscal Year
The Company’s fiscal year ends on the Saturday closest to January 31. Fiscal years consist of 52 weeks,unless noted otherwise. The fiscal year refers to the year in which the period ends (e.g., fiscal 2008 refers tothe year-ended February 2, 2008). Fiscal 2007 was a 53-week year.
Cash and Cash Equivalents
Cash equivalents are all highly liquid investments with original maturities of three months or less.
Inventories
Inventories are stated at the lower of cost or market with cost determined on a weighted average basis.Inventory valuation methods require certain management estimates and judgments, which affect the endinginventory valuation at cost, as well as the gross margins reported for the year. These valuation methodsinclude estimates of net realizable value on product designated for clearance and estimates of shrink betweenperiods when the Company conducts distribution center inventory cycle counts and store physical inventoriesto substantiate inventory balances.
The Company’s accrual for shrink is based on the actual historical shrink results of recent distributioncenter inventory cycle counts and store physical inventories. These estimates are compared to actual results asphysical inventory counts are taken and reconciled to the general ledger. Substantially all of the Company’sentire store physical inventory counts are taken in the first three quarters of each year and the shrink accrualrecorded at February 2, 2008 is based on shrink results of these prior physical inventories. All store locations
46

Note 1 — Significant Accounting Policies (Continued)
that have been open one year or longer are physically inventoried once a year. The Company continuallymonitors and adjusts the shrink rate estimates based on the results of store physical inventories and shrinktrends.
Inventory reserves for clearance product are estimated based on a number of factors, including, but notlimited to, quantities of slow moving or carryover seasonal merchandise on hand, historical recovery statisticsand future merchandising plans. The accuracy of the Company’s estimates can be affected by many factors,some of which are outside of the Company’s control, including changes in economic conditions and consumerbuying trends.
Property, Equipment and Leasehold Improvements
Property, equipment and leasehold improvements are stated at cost less accumulated depreciation andamortization. Depreciation and amortization are recorded over the estimated useful life of the assets principallyby the straight-line method. The major classes of assets and ranges of estimated useful lives are: buildingsfrom 10 to 40 years; furniture, fixtures and equipment from 2 to 10 years; and leasehold improvements for thelesser of 10 years or over the remaining life of the lease. Maintenance and repair expenditures are charged toexpense as incurred and improvements and major renewals are capitalized.
Property, equipment and leasehold improvements consist of the following:
2008 2007Fiscal Year
(Dollars in millions)
Land and buildings . . . . . . . . . . . . . . . . . . . . . . . . . . . . . . . . . . . . . . . . . . $ 68.4 $ 66.5Furniture, fixtures and equipment . . . . . . . . . . . . . . . . . . . . . . . . . . . . . . . . 460.1 436.6Leasehold improvements. . . . . . . . . . . . . . . . . . . . . . . . . . . . . . . . . . . . . . . 148.0 140.8Construction in progress . . . . . . . . . . . . . . . . . . . . . . . . . . . . . . . . . . . . . . . 11.5 12.2
688.0 656.1Less accumulated depreciation and amortization . . . . . . . . . . . . . . . . . . . . . . (390.5) (344.3)
Property, equipment and leasehold improvements, net . . . . . . . . . . . . . . . . . . $ 297.5 $ 311.8
The Company capitalized interest of $0.4 million in fiscal 2007 relating to the construction of a newdistribution center in Opelika, Alabama.
Software Development
The Company capitalized $6.5 million and $6.8 million in fiscal 2008 and fiscal 2007, respectively, forinternal use software acquired from third parties. The capitalized amounts are included in property, equipmentand leasehold improvements. The Company amortizes internal use software on a straight-line basis over periodsranging from three to five years beginning at the time the software becomes operational. Amortization expensewas $2.1 million and $2.0 million in fiscal 2008 and fiscal 2007, respectively.
Goodwill
The goodwill carried on the Company’s balance sheet at February 2, 2008 represented the excess ofpurchase price and related costs over the preliminary fair value assigned to the net assets of IdeaForest.com,Inc. (“IdeaForest”). The Company acquired the equity of IdeaForest that it previously did not own in the fourthquarter of fiscal 2008. The fair value assigned to the net assets and related goodwill will be finalized no later
47
Jo-Ann Stores, Inc.
Notes to Consolidated Financial Statements (Continued)

Note 1 — Significant Accounting Policies (Continued)
than the end of the third quarter of fiscal 2009. The goodwill recorded was non-deductible for tax purposes.See Note 2 — Goodwill for further detail.
At the beginning of the fourth quarter of fiscal 2006, the Company conducted the annual impairmenttesting required by Statement of Financial Accounting Standards (“SFAS”) No. 142, “Goodwill and OtherIntangible Assets,” for fiscal 2006. As a result of the evaluation, the Company determined that the carryingamount of the goodwill exceeded its implied fair value and that a full impairment of goodwill existed. Thisimpairment conclusion was reached considering the market capitalization of the Company, declining businesstrends, softness in the industry, deteriorating Company performance particularly in its seasonally significantfourth quarter, and the Company’s assessment of near-term future performance. Accordingly, during the fourthquarter of fiscal 2006, the Company recorded a non-cash and non-tax deductible charge of $27.1 million,which represented a write-off of the goodwill. This charge was reported as a separate line item in thestatement of operations included in the consolidated financial statements.
Impairment of Long-Lived Assets
In accordance with SFAS No. 144, “Accounting for the Impairment or Disposal of Long-Lived Assets,” theCompany evaluates long-lived assets for impairment whenever events or changes in circumstances indicate thatthe carrying amount of those assets may not be recoverable. Factors considered important that could triggeran impairment review include, but are not limited to, significant underperformance relative to historical orprojected future operating results and significant changes in the manner of use of the assets or the Company’soverall business strategies. Potential impairment exists if the estimated undiscounted cash flow expected toresult from the use of the assets is less than the carrying value of the asset. The amount of the impairmentloss represents the excess of the carrying value of the asset over its fair value. Management estimates fairvalue based on a projected discounted cash flow method using a discount rate that is considered to becommensurate with the risk inherent in the Company’s current business model. Additional factors are takeninto consideration, such as local market conditions, operating environment and other trends.
Based on management’s ongoing review of the performance of its stores and other facilities, the followingimpairment losses were recorded and are reflected in selling, general and administrative expenses (“SG&A”) onthe consolidated statement of operations.
2008 2007 2006Fiscal Year-Ended
(Dollars in millions)
SegmentLarge-format stores . . . . . . . . . . . . . . . . . . . . . . . . . . . . . . . . . . . . . . . . . $0.4 $3.8 $2.6Small-format stores . . . . . . . . . . . . . . . . . . . . . . . . . . . . . . . . . . . . . . . . . 0.2 0.3 0.4
Total . . . . . . . . . . . . . . . . . . . . . . . . . . . . . . . . . . . . . . . . . . . . . . . . . . . $0.6 $4.1 $3.0
Store Pre-Opening and Closing Costs
Store pre-opening costs are expensed as incurred and relate to the costs incurred prior to a new storeopening, which includes the hiring and training costs for new employees, processing costs of initialmerchandise and rental expense for the period prior to the store opening for business. See Note 4 — StoreClosings for further detail.
The Company accounts for store closing costs according to the requirements of SFAS No. 146, “Accountingfor Costs Associated with Exit or Disposal Activities.” SFAS No. 146 requires companies to recognize costsassociated with exit or disposal activities when they are incurred rather than at the date of a commitment to
48
Jo-Ann Stores, Inc.
Notes to Consolidated Financial Statements (Continued)

Note 1 — Significant Accounting Policies (Continued)
an exit or disposal plan. SFAS No. 146 also establishes that the liability should initially be measured andrecorded at fair value. See Note 4 — Store Closings.
2008 2007 2006Fiscal Year-Ended
(Dollars in millions)
Store pre-opening costs . . . . . . . . . . . . . . . . . . . . . . . . . . . . . . . . . . . . $3.1 $ 5.0 $13.0Store closing costs . . . . . . . . . . . . . . . . . . . . . . . . . . . . . . . . . . . . . . . . 5.3 6.1 10.4
$8.4 $11.1 $23.4
Accrued Expenses
We estimate certain material expenses in an effort to record those expenses in the period incurred. Ourmost material estimates relate to compensation, taxes and insurance-related expenses, significant portions ofwhich are self-insured. The ultimate cost of our workers’ compensation and general liability insurance accrualsare recorded based on actuarial valuations and historical claims experience. Our employee medical insuranceaccruals are recorded based on our medical claims processed as well as historical medical claims experience forclaims incurred but not yet reported. We maintain stop-loss coverage to limit the exposure to certaininsurance-related risks. Certain of our workers’ compensation and general liability accruals are recorded at anestimate of their net present value; other liabilities are not discounted. Differences in our estimates andassumptions could result in an accrual requirement materially different from the calculated accrual. Historically,such differences have not been significant.
Accrued expenses consisted of the following:
2008 2007Fiscal Year
(Dollars in millions)
Accrued taxes . . . . . . . . . . . . . . . . . . . . . . . . . . . . . . . . . . . . . . . . . . . . . . . . $26.2 $18.6Accrued compensation . . . . . . . . . . . . . . . . . . . . . . . . . . . . . . . . . . . . . . . . . . 28.2 24.4Accrued insurance-related reserves . . . . . . . . . . . . . . . . . . . . . . . . . . . . . . . . . . 23.7 22.8Other accrued expenses . . . . . . . . . . . . . . . . . . . . . . . . . . . . . . . . . . . . . . . . . 19.0 18.6
Total accrued expenses . . . . . . . . . . . . . . . . . . . . . . . . . . . . . . . . . . . . . . . . $97.1 $84.4
Financial Instruments
A financial instrument is cash or a contract that imposes an obligation to deliver, or conveys a right toreceive cash or another financial instrument. The carrying values of cash and cash equivalents and accountspayable are considered to be representative of fair value due to the short maturity of these instruments. Theprice of the 7.5 percent senior subordinated notes (the “Notes”) at February 2, 2008 in the high yield debtmarket was approximately 85 percent to par value. Accordingly, the fair value of the Notes was $85 millionversus their carrying value of approximately $100 million.
In the normal course of business, the Company employs established policies and procedures to manageexposure to changes in interest rates. The Company’s objective in managing the exposure to interest ratechanges is to limit the volatility and impact of interest rate changes on earnings and cash flows. This isaccomplished through the debt structure set in place in fiscal 2005, which consisted of the fixed rate Notesand the variable rate senior bank credit facility (the “Credit Facility”), which is designed to be a workingcapital facility.
49
Jo-Ann Stores, Inc.
Notes to Consolidated Financial Statements (Continued)

Note 1 — Significant Accounting Policies (Continued)
Income Taxes
The Company adopted Financial Accounting Standards Board (“FASB”) Interpretation No. 48 “Accountingfor Uncertainty in Income Taxes — An Interpretation of FASB Statement No. 109” (“FIN 48”), at the beginningof fiscal year 2008. The interpretation suggests a recognition threshold and a measurement attribute for thefinancial statement recognition and measurement of tax positions taken or expected to be taken in a taxreturn. For those benefits to be recognized, a tax position must be more-likely-than-not to be sustained uponexamination by taxing authorities. The amount recognized is measured as the largest amount of benefit that isgreater than 50 percent likely of being realized upon ultimate settlement. The adoption of FIN 48 resulted in atransition adjustment reducing beginning retained earnings by $1.6 million, which was comprised of$1.1 million in taxes and $0.5 million in interest. The Company’s unrecognized tax benefits upon adoptionwere $7.6 million, of which $4.9 million would affect the effective tax rate, if recognized within theconsolidated statement of operations.
The Company does business in various jurisdictions that impose income taxes. The aggregate amount ofincome tax expense to accrue and the amount currently payable are based upon the tax statutes of eachjurisdiction, pursuant to the asset and liability method. This process involves adjusting book income for itemsthat are treated differently by the applicable taxing authorities. Deferred tax assets and liabilities are reflectedon the balance sheet for temporary differences that will reverse in subsequent years. Deferred tax assets andliabilities are measured using tax rates expected to apply to taxable income in the years in which thosetemporary differences are estimated to be recovered or settled. The effect on deferred tax assets and liabilitiesof a change in the tax rate is recognized in income or expense in the period that the change is effective. Thecurrent tax provision can be affected by the mix of income and identification or resolution of uncertain taxpositions. Because income from different jurisdictions may be taxed at different rates, the shift in mix duringa year or over years can cause the effective tax rate to change. The rate is based on the best estimate of anannual effective rate, and those estimates are updated quarterly. The Company also regularly evaluates thestatus and likely outcome of uncertain tax positions.
As a matter of course, the Company is regularly audited by federal, state and local tax authorities.Reserves are provided for potential exposures when it is considered probable that a taxing authority may takea sustainable position on a matter contrary to the Company’s position. The Company evaluates these reserves,including interest thereon, on a quarterly basis to ensure that they have been appropriately adjusted forevents, including audit settlements that may impact the ultimate payment for such exposure.
Revenue Recognition
Retail sales, net of estimated returns, and excluding sales taxes, are recorded at the point of sale whenpayment is made and customers take possession of the merchandise in stores, at the point of shipment ofmerchandise ordered through the Internet or, in the case of custom orders, when the product is delivered tothe customer and any remaining balance due from the customer is collected. Deposits received for customorders are deferred as a liability until the related product is delivered to the customer. Shipping and handlingfees charged to customers are also recorded as retail sales with related costs recorded as cost of goods sold.Sales taxes are not included in retail sales as the Company acts as a conduit for collecting and remitting salestaxes to the appropriate governmental authorities.
The Company allows for merchandise to be returned under most circumstances. The current policy allowsfor customers to receive an even exchange or full refund based upon the original method of payment when thereturned purchase is accompanied with a receipt and the return is within 90 days of purchase. The reserve forreturns was $0.6 million at February 2, 2008 and $0.5 million at February 3, 2007, respectively. Returnshistorically have not had a material impact on the consolidated financial statements.
50
Jo-Ann Stores, Inc.
Notes to Consolidated Financial Statements (Continued)

Note 1 — Significant Accounting Policies (Continued)
Proceeds from the sale of gift cards are recorded as a liability and recognized as net sales when redeemedby the holder. Gift card breakage represents the remaining balance of our liability for gift cards for which thelikelihood of redemption by the customer is remote. Gift card breakage is recognized under the redemptionmethod and is determined based on the historical redemption patterns of gift cards sold since fiscal 2002.Beginning in fiscal 2006, we began to recognize gift card breakage as a component of net sales in theconsolidated statement of operations and in the fourth quarter of fiscal 2006, we recognized $3.2 million ofpre-tax income. In fiscal 2008 and 2007, we recognized $1.1 million and $0.8 million of pre-tax income,respectively.
Cost of Sales
Inbound freight and duties related to import purchases and internal transfer costs are considered to bedirect costs of the Company’s merchandise and accordingly are recognized when the related merchandise issold as cost of sales. Purchasing and receiving costs, warehousing costs and other costs of the Company’sdistribution network are considered to be period costs not directly attributable to the value of merchandiseand, accordingly, are expensed as incurred as SG&A. Distribution network costs of $59.5 million, $68.6 millionand $65.5 million were included in SG&A expenses for fiscal 2008, 2007 and 2006, respectively.
The Company receives vendor support including cash discounts, volume discounts, allowances and co-operative advertising. We have agreements in place with each vendor setting forth the specific conditions foreach allowance or payment. In accordance with Emerging Issues Task Force 02-16, “Accounting by a Customer(Including a Reseller) for Certain Consideration Received from a Vendor,” depending on the arrangement, weeither recognize the allowance as a reduction of current costs or defer the payment over the period the relatedmerchandise is sold through cost of sales. Historically, vendor consideration has not had a significant impacton cost of sales or gross margin. Payments that are a reimbursement of specific, incremental and identifiablecosts incurred to promote vendors’ products are recorded as an offset against advertising expense.
Operating Leases
Rent expense for operating leases, which may have escalating rentals over the term of the lease, isrecorded on a straight-line basis over the initial lease term and those renewal periods that are reasonablyassured. The initial lease term for our stores includes the “build-out” period of leases, when no rent paymentsare typically due under the terms of the lease. The difference between rent expense and rent paid is recordedas a deferred rent liability and is included in the consolidated balance sheets.
Construction allowances and other incentives received from landlords are recorded as a deferred rentliability and amortized to rent expense over the initial term of the lease. The Company’s statement of cashflows reflects the receipt of incentives as an increase in cash flows from operating activities.
Advertising Costs
The Company expenses production costs of advertising the first time the advertising takes place.Advertising expense, net of co-operative advertising agreements was $67.8 million, $65.2 million and$66.1 million for fiscal 2008, 2007 and 2006, respectively. Included in prepaid and other current assets are$1.2 million and $1.3 million, respectively, at the end of fiscal 2008 and 2007 relating to prepayments ofproduction costs for advertising.
51
Jo-Ann Stores, Inc.
Notes to Consolidated Financial Statements (Continued)

Note 1 — Significant Accounting Policies (Continued)
Earnings Per Share
Basic and diluted earnings (loss) per common share are calculated in accordance with SFAS No. 128,“Earnings per Share.” Basic earnings (loss) per common share are computed by dividing net income (loss) bythe weighted average number of shares outstanding during the year. Diluted earnings (loss) per common shareinclude the effect of the assumed exercise of dilutive stock-based compensation awards (comprised of stockoptions and restricted shares) under the treasury stock method. Basic and diluted earnings (loss) per commonshare are as follows:
2008 2007 2006Fiscal Year-Ended
(Dollars in millions, except per share data)
Income (loss) before cumulative effect of accounting change . . . . . $ 15.4 $ (2.9) $ (23.0)Cumulative effect of change in accounting principle, net of tax . . . — 1.0 —
Net income (loss) . . . . . . . . . . . . . . . . . . . . . . . . . . . . . . . . . . . $ 15.4 $ (1.9) $ (23.0)
Weighted average shares outstanding (shares in thousands):Basic. . . . . . . . . . . . . . . . . . . . . . . . . . . . . . . . . . . . . . . . . . 24,296 23,519 22,716
Incremental shares from assumed exercise of stock options . . . 324 — —Incremental restricted shares . . . . . . . . . . . . . . . . . . . . . . . 330 — —
Diluted . . . . . . . . . . . . . . . . . . . . . . . . . . . . . . . . . . . . . . . . 24,950 23,519 22,716Income (loss) per common share — basic:Income (loss) before cumulative effect of accounting change . . . . . $ 0.63 $ (0.12) $ (1.01)Cumulative effect of change in accounting principle . . . . . . . . . . . — 0.04 —
Net income (loss) per common share . . . . . . . . . . . . . . . . . . . . . . $ 0.63 $ (0.08) $ (1.01)
Income (loss) per common share — diluted:Income (loss) before cumulative effect of accounting change . . . . . $ 0.62 $ (0.12) $ (1.01)Cumulative effect of change in accounting principle . . . . . . . . . . . — 0.04 —
Net income (loss) per common share . . . . . . . . . . . . . . . . . . . . . . $ 0.62 $ (0.08) $ (1.01)
For fiscal 2008 the above calculation of the diluted net income per common share reflects the impact ofstock options that had exercise prices below the average market price of the Company’s common shares for theyear. An average of 707,303 stock options was not included in the computation of diluted net income percommon share because the exercise price of the stock options exceeded the average market price and wouldhave been anti-dilutive.
For fiscal 2007 and 2006, all outstanding stock options were excluded from the calculation of diluted netloss per common share due to the Company’s net loss, because they would have had an anti-dilutive effect.
Stock-Based Compensation
In accordance with SFAS No. 123 (revised 2004), “Share-Based Payment” (“SFAS No. 123R”), costsassociated with stock-based compensation are measured using the fair value method of accounting. TheCompany estimates expected forfeitures as of the date the awards are granted and records compensationexpense only for those awards that are ultimately expected to vest. Stock-based compensation expense isrecognized over the vesting period of the awards.
52
Jo-Ann Stores, Inc.
Notes to Consolidated Financial Statements (Continued)

Note 1 — Significant Accounting Policies (Continued)
Cash flows resulting from the tax benefits of deductions in excess of the compensation cost recognizedfor stock-based awards are classified as financing cash flows.
The following table shows the expense recognized by the Company for stock-based compensation.
2008 2007 2006Fiscal Year-Ended
(Dollars in millions)
Stock option compensation expense(a) . . . . . . . . . . . . . . . . . . . . . . . . . . . . $2.9 $3.3 $2.5Restricted stock award amortization . . . . . . . . . . . . . . . . . . . . . . . . . . . . . . 5.4 3.6 0.3
$8.3 $6.9 $2.8
(a) Included within stock option compensation expense is expense related to the employee stock purchaseplan (the Associate Stock Ownership Plan or “ASOP”). The associated expense is not significant.
The Company estimates the fair value of options granted using the Black-Scholes option-pricing model.The Black-Scholes model requires several assumptions, which management updates regularly based on historicaltrends and current market observations. The fair values of the options granted under the stock plans aredetermined at the date of grant. The Company does not pay dividends, thus, no dividend rate assumption isused.
The Company estimates expected volatility based on the historical volatility of the price of the commonstock over the expected life of the awards. The Company believes its historical volatility is a reasonableexpectation of future volatility. The Company also uses historical experience to estimate the expected life ofstock-based compensation awards and employee terminations. The risk-free interest rate is based on applicableU.S. Treasury yields that approximate the expected life of stock-based awards granted.
The significant assumptions used to calculate the fair value of option grants were as follows:
2008 2007 2006Fiscal Year-Ended
Weighted average fair value of optionsgranted . . . . . . . . . . . . . . . . . . . . . . . . . $7.99 $5.69 $6.64
Expected volatility of underlying stock . . . . . . .388 to .417 .418 to .584 .513 to .568Risk-free interest rates. . . . . . . . . . . . . . . . . 3.3% to 4.9% 4.2% to 5.2% 3.5% to 4.4%Expected life . . . . . . . . . . . . . . . . . . . . . . . 2.2 to 5.2 years 2.2 to 5.2 years 4 yearsExpected life — Associate Stock Ownership
Plan. . . . . . . . . . . . . . . . . . . . . . . . . . . . 6 months 6 months 6 months
See Note 8 — Stock-Based Compensation for further detail.
Recent Accounting Pronouncements
The following accounting pronouncements may have an impact on the Company’s results of operations orfinancial position in future years, as discussed further below.
Statement of Financial Accounting Standards No. 157, “Fair Value Measurement”
In September 2006, the FASB issued Statement No. 157, “Fair Value Measurements” (“SFAS 157”), whichprovides a definition of fair value, establishes a framework for measuring fair value and requires expandeddisclosures about fair value measurements. SFAS 157 is effective for the Company in fiscal 2009. The provisions
53
Jo-Ann Stores, Inc.
Notes to Consolidated Financial Statements (Continued)

Note 1 — Significant Accounting Policies (Continued)
of SFAS 157 were applied prospectively effective February 3, 2008. The adoption of SFAS 157 did not have amaterial impact on the Company’s consolidated financial statements.
Statement of Financial Accounting Standards No. 159, “The Fair Value Option for Financial Assets and FinancialLiabilities”
In February 2007, the FASB issued Statement No. 159, “The Fair Value Option for Financial Assets andFinancial Liabilities” (“SFAS 159”). SFAS 159 allows entities the option to measure eligible financialinstruments at fair value as of specified dates. Such election, which may be applied on an instrument byinstrument basis, typically is irrevocable once elected. SFAS 159 is effective for the Company in fiscal 2009. Inaccordance with the provisions of SFAS 159, adoption was elective. As such, the Company elected not to adoptSFAS 159.
Statement of Financial Accounting Standards No. 141 (revised 2007), “Business Combinations”
In December 2007, the FASB issued SFAS No. 141 (revised 2007), Business Combinations (“SFAS 141R”).SFAS 141R establishes principles and requirements for how an acquirer in a business combination recognizesand measures in its financial statements the identifiable assets acquired, the liabilities assumed and any non-controlling interest in the acquiree at the acquisition date fair value. SFAS 141R significantly changes theaccounting for business combinations in a number of areas including the treatment of contingent consider-ation, pre-acquisition contingencies, transaction costs, in-process research and development and restructuringcosts. In addition, under SFAS 141R, changes in an acquired entity’s deferred tax assets and uncertain taxpositions after the measurement period will impact income tax expense. SFAS 141R provides guidance regardingwhat information to disclose to enable users of the financial statements to evaluate the nature and financialeffects of the business combination. SFAS 141R is effective for the Company in fiscal 2010 with earlyapplication prohibited. The Company does not expect the adoption of SFAS 141R to have a material impact onits consolidated financial statements.
Statement of Financial Accounting Standards No. 160, “Non-controlling Interests in Consolidated FinancialStatements, an amendment of ARB No. 51”
In December 2007, the FASB issued SFAS No. 160, Non-controlling Interests in Consolidated FinancialStatements, an amendment of ARB No. 51 (“SFAS 160”). SFAS 160 changes the accounting and reporting forminority interests, which will be recharacterized as non-controlling interests and classified as a component ofequity. This new consolidation method significantly changes the accounting for transactions with minorityinterest holders. SFAS 160 is effective for fiscal years beginning after December 15, 2008 with early applicationprohibited. The Company will adopt SFAS 160 beginning in the first quarter of fiscal 2010 and does not expectthe adoption of SFAS 160 to have a material impact on its consolidated financial statements.
Note 2 — Goodwill
The entire amount of goodwill carried on the Company’s balance sheet at February 2, 2008 representedthe excess of purchase price and related costs over the preliminary fair value assigned to the net assets ofIdeaForest. The Company acquired the remaining equity of IdeaForest in the fourth quarter of fiscal 2008. Thefair value assigned to the acquired net assets and related goodwill of $11.8 million will be finalized no laterthan the third quarter of fiscal 2009. The goodwill recorded was non-deductible for tax purposes. Theacquisition of IdeaForest is included as part of the Company’s Other segment.
At the beginning of the fourth quarter of fiscal 2006, the Company conducted the annual impairmenttesting required by SFAS No. 142, “Goodwill and Other Intangible Assets,” for fiscal 2006. As a result of theevaluation, the Company determined that the carrying amount of the goodwill exceeded its implied fair value
54
Jo-Ann Stores, Inc.
Notes to Consolidated Financial Statements (Continued)

Note 2 — Goodwill (Continued)
and that a full impairment of goodwill existed. This impairment conclusion was reached considering the marketcapitalization of the Company, declining business trends, softness in the industry, deteriorating Companyperformance particularly in its seasonally significant fourth quarter, and the Company’s assessment of near-termfuture performance. Accordingly, during the fourth quarter of fiscal 2006, the Company recorded a non-cashand non-tax deductible charge of $27.1 million, which represented a write-off of the goodwill. This charge wasreported as a separate line item in the statement of operations included in the consolidated financialstatements.
Note 3 — Business Combinations
On November 5, 2007, the Company completed the acquisition of the 62 percent portion of IdeaForestthat the Company previously did not own. IdeaForest was the operator of the Joann.com website. IdeaForest,which has been renamed Joann.com, Inc., is now a wholly owned subsidiary of the Company and is included aspart of the Other segment.
Per the merger agreement, the purchase price was $23.6 million and was comprised of a gross cashpayment of $14.6 million ($11.7 million net of cash acquired) which was due upon closing, severancepayments of $0.3 million payable subsequent to closing and delayed payments of $8.7 million, subject toadjustment, as described in the agreement, over the three years following the closing. The delayed payments,before adjustment, are non-interest bearing and are payable in three installments as follows: $3.1 million inNovember 2008, $3.1 million in November 2009 and $2.5 in November 2010.
The acquisition was accounted for as a purchase business combination and, accordingly, the purchaseprice was allocated to identifiable tangible and intangible assets acquired and liabilities assumed, based upontheir respective fair values, with the excess allocated to goodwill. The preliminary estimate of goodwill wasapproximately $11.8 million. The fair value assigned to the acquired net assets and related goodwill will befinalized no later than the third quarter of fiscal 2009. Results of operations of Joann.com, Inc. from the dateof acquisition are included in the consolidated statements of operations of the Company.
The following table summarizes the preliminary fair values of the assets acquired and liabilities assumedas of November 5, 2007 for the IdeaForest acquisition:
As ofNovember 5,
2007(Dollars inmillions)
Cash . . . . . . . . . . . . . . . . . . . . . . . . . . . . . . . . . . . . . . . . . . . . . . . . . . . . . . . . . . $ 2.9Inventories . . . . . . . . . . . . . . . . . . . . . . . . . . . . . . . . . . . . . . . . . . . . . . . . . . . . . 0.8Prepaid expenses and other current assets . . . . . . . . . . . . . . . . . . . . . . . . . . . . . . . . 0.5Property, plant and equipment . . . . . . . . . . . . . . . . . . . . . . . . . . . . . . . . . . . . . . . . 1.4Deferred income taxes . . . . . . . . . . . . . . . . . . . . . . . . . . . . . . . . . . . . . . . . . . . . . . 11.4Goodwill . . . . . . . . . . . . . . . . . . . . . . . . . . . . . . . . . . . . . . . . . . . . . . . . . . . . . . . 11.8Accounts payable . . . . . . . . . . . . . . . . . . . . . . . . . . . . . . . . . . . . . . . . . . . . . . . . . (2.6)Accrued expenses . . . . . . . . . . . . . . . . . . . . . . . . . . . . . . . . . . . . . . . . . . . . . . . . . (2.6)
Total acquisition cost . . . . . . . . . . . . . . . . . . . . . . . . . . . . . . . . . . . . . . . . . . . . . . $23.6
55
Jo-Ann Stores, Inc.
Notes to Consolidated Financial Statements (Continued)

Note 4 — Store Closings
Store closing charges included within the consolidated statement of operations for fiscal years 2008, 2007and 2006 are summarized below, and represent charges incurred to close stores related to the large-formatstore growth strategy and store performance. These charges are included in the line item “Store pre-openingand closing costs” in the statements of operations included in the consolidated financial statements.
2008 2007 2006Fiscal Year-Ended
(Dollars in millions)
Store Closing Charges:Non-cancelable lease obligations . . . . . . . . . . . . . . . . . . . . . . . . . . . . . $1.3 $0.7 $ 2.3Asset related charges . . . . . . . . . . . . . . . . . . . . . . . . . . . . . . . . . . . . . 0.9 1.5 3.9Other costs . . . . . . . . . . . . . . . . . . . . . . . . . . . . . . . . . . . . . . . . . . . . 3.1 3.9 4.2
Total . . . . . . . . . . . . . . . . . . . . . . . . . . . . . . . . . . . . . . . . . . . . . . . . . . $5.3 $6.1 $10.4
The store closing reserve was $0.7 million and $0.8 million as of February 2, 2008 and February 3, 2007,respectively. The reserve is comprised of miscellaneous liquidation costs.
Non-cancelable lease obligations, as discussed in Note 1, are accounted for in accordance withSFAS No. 146.
Asset related charges include write-downs of fixed assets to their estimated fair value for stores closed, orscheduled to be closed. The asset related charges represent the difference between the asset carrying valueand the future net discounted cash flows estimated by the Company to be generated by those assets.
Other costs represent miscellaneous store closing costs, including among other things, third-partyinventory liquidator costs and costs related to fixtures, signage and register removal.
Note 5 — Income Taxes
The Company adopted Financial Accounting Standards Board (“FASB”) Interpretation No. 48 “Accountingfor Uncertainty in Income Taxes — An Interpretation of FASB Statement No. 109” (“FIN 48”), at the beginningof fiscal year 2008. The interpretation suggests a recognition threshold and a measurement attribute for thefinancial statement recognition and measurement of tax positions taken or expected to be taken in a taxreturn. For those benefits to be recognized, a tax position must be more-likely-than-not to be sustained uponexamination by taxing authorities. The amount recognized is measured as the largest amount of benefit that isgreater than 50 percent likely of being realized upon ultimate settlement. The adoption of FIN 48 resulted in atransition adjustment reducing beginning retained earnings by $1.6 million, which was comprised of$1.1 million in taxes and $0.5 million in interest. The Company’s unrecognized tax benefits upon adoptionwere $7.6 million, of which $4.9 million would affect the effective tax rate, if recognized within theconsolidated statement of operations.
During fiscal 2008, the Company made no material changes to tax related reserves under FIN 48. At theend of fiscal 2008, the Company’s unrecognized tax benefits are $7.8 million, of which $5.0 million wouldaffect the effective tax rate, if recognized.
The Company records interest and penalties on uncertain tax positions as a component of the income taxprovision. The total amount of interest and penalties accrued as of the date of adoption of FIN 48 was$2.6 million and as of the end of fiscal 2008 was increased to $2.9 million.
The Company files income tax returns in the U.S. and various state and local jurisdictions. For U.S. federalpurposes, the Company is no longer subject to income tax examinations by taxing authorities for fiscal years
56
Jo-Ann Stores, Inc.
Notes to Consolidated Financial Statements (Continued)

Note 5 — Income Taxes (Continued)
prior to fiscal year 2006 and, for state and local purposes, with some exceptions due to longer statutes oflimitations or the extensions of statutes of limitations, the Company is no longer subject to income taxexaminations by taxing authorities for fiscal years prior to fiscal year 2004. The Company believes that, due tovarious factors, including the settlement of ongoing audits and the expiration or extension of underlyingstatutes of limitation, it is impractical to determine whether the total of uncertain tax positions willsignificantly increase or decrease within the next twelve months.
The Company adopted the provisions of FIN 48 on February 4, 2007. The Company recognized a$1.6 million debit to retained earnings as of February 4, 2007 to increase its reserve for unrecognized taxbenefits as a result of the implementation of FIN 48. A reconciliation of the beginning and ending amount ofunrecognized tax benefits is as follows:
Fiscal Year2008
(Dollars inmillions)
Balance at February 4, 2007 . . . . . . . . . . . . . . . . . . . . . . . . . . . . . . . . . . . . . . . . . . $ 7.6Increases related to prior year tax positions . . . . . . . . . . . . . . . . . . . . . . . . . . . . . . . . —Decreases related to prior year tax positions . . . . . . . . . . . . . . . . . . . . . . . . . . . . . . . . —Increases related to current year tax positions . . . . . . . . . . . . . . . . . . . . . . . . . . . . . . . 1.0Settlements . . . . . . . . . . . . . . . . . . . . . . . . . . . . . . . . . . . . . . . . . . . . . . . . . . . . . . —Lapse of statue of limitations . . . . . . . . . . . . . . . . . . . . . . . . . . . . . . . . . . . . . . . . . . (0.8)
Balance at February 2, 2008 . . . . . . . . . . . . . . . . . . . . . . . . . . . . . . . . . . . . . . . . . . $ 7.8
The significant components of the income tax (benefit) provision are as follows (dollars in millions):
2008 2007 2006Fiscal Year-Ended
Current:Federal . . . . . . . . . . . . . . . . . . . . . . . . . . . . . . . . . . . . . . . . . . . . . . $7.3 $(3.3) $ 20.4State and local . . . . . . . . . . . . . . . . . . . . . . . . . . . . . . . . . . . . . . . . 1.5 2.6 3.4
8.8 (0.7) 23.8Deferred . . . . . . . . . . . . . . . . . . . . . . . . . . . . . . . . . . . . . . . . . . . . . . . 0.7 (3.0) (21.1)
Income tax provision (benefit) . . . . . . . . . . . . . . . . . . . . . . . . . . . . . . . $9.5 $(3.7) $ 2.7
The reconciliation of income tax at the statutory rate to the income tax (benefit) provision is as follows:
2008 2007 2006Fiscal Year-Ended
(Dollars in millions)
Federal income tax at the statutory rate . . . . . . . . . . . . . . . . . . . . . . . . . $ 8.7 $(2.3) $(7.1)Effect of:
Non-deductible goodwill impairment . . . . . . . . . . . . . . . . . . . . . . . . . . — — 9.5State and local taxes . . . . . . . . . . . . . . . . . . . . . . . . . . . . . . . . . . . . 1.4 0.4 0.3Settlement of federal tax liabilities from prior years . . . . . . . . . . . . . . . — (1.1) —Other, net . . . . . . . . . . . . . . . . . . . . . . . . . . . . . . . . . . . . . . . . . . . . (0.6) (0.7) —
Income tax provision (benefit) . . . . . . . . . . . . . . . . . . . . . . . . . . . . . . . $ 9.5 $(3.7) $ 2.7
57
Jo-Ann Stores, Inc.
Notes to Consolidated Financial Statements (Continued)

Note 5 — Income Taxes (Continued)
Deferred income taxes reflect the net tax effects of temporary differences between the carrying amount ofassets and liabilities for financial reporting purposes and the amounts used for income tax purposes. Thesignificant components of the Company’s deferred tax assets and liabilities are as follows:
2008 2007
Fiscal YearAsset/(Liability)
(Dollars in millions)
CurrentDeferred tax assets:
Inventory items . . . . . . . . . . . . . . . . . . . . . . . . . . . . . . . . . . . . . . . . . . . . $ 10.7 $ 15.1Lease obligations . . . . . . . . . . . . . . . . . . . . . . . . . . . . . . . . . . . . . . . . . . . 0.6 0.9Employee benefits . . . . . . . . . . . . . . . . . . . . . . . . . . . . . . . . . . . . . . . . . . . 9.0 8.9Federal net operating loss carryback. . . . . . . . . . . . . . . . . . . . . . . . . . . . . . . — 9.5Other . . . . . . . . . . . . . . . . . . . . . . . . . . . . . . . . . . . . . . . . . . . . . . . . . . . . 6.1 7.2
Net current deferred tax asset. . . . . . . . . . . . . . . . . . . . . . . . . . . . . . . . . . . . . $ 26.4 $ 41.6
Non-currentDeferred tax assets:
Lease obligations . . . . . . . . . . . . . . . . . . . . . . . . . . . . . . . . . . . . . . . . . . . $ 29.6 $ 30.5Equity investment . . . . . . . . . . . . . . . . . . . . . . . . . . . . . . . . . . . . . . . . . . . — 2.5Employee benefits . . . . . . . . . . . . . . . . . . . . . . . . . . . . . . . . . . . . . . . . . . . 8.0 6.7Federal net operating loss carryforwards . . . . . . . . . . . . . . . . . . . . . . . . . . . . 11.1 —State net operating loss carryforwards . . . . . . . . . . . . . . . . . . . . . . . . . . . . . 3.0 1.1Other . . . . . . . . . . . . . . . . . . . . . . . . . . . . . . . . . . . . . . . . . . . . . . . . . . . . 7.1 2.4Valuation allowances . . . . . . . . . . . . . . . . . . . . . . . . . . . . . . . . . . . . . . . . . (1.7) (2.7)
57.1 40.5Deferred tax liabilities:
Depreciation . . . . . . . . . . . . . . . . . . . . . . . . . . . . . . . . . . . . . . . . . . . . . . . (54.4) (54.1)Other . . . . . . . . . . . . . . . . . . . . . . . . . . . . . . . . . . . . . . . . . . . . . . . . . . . . (0.6) (0.6)
(55.0) (54.7)
Net non-current deferred tax asset (liability) . . . . . . . . . . . . . . . . . . . . . . . . . . $ 2.1 $(14.2)
The Company has approximately $33.4 million of federal net operating loss carryforwards and $49.9 millionof state net operating loss carryforwards which expire in fiscal year 2020 through fiscal year 2028 and fiscalyear 2009 through fiscal year 2028, respectively. Included in these amounts are $33.4 million of federal netoperating loss carryforwards and $28.8 million of state net operating loss carryforwards acquired as part of theIdeaForest.com transaction. The acquired federal losses may be utilized to offset income realized by anymember of the affiliated group in future years, up to an annual amount calculated in accordance with the losscarryover limitation rules under Section 382 of the Internal Revenue Code of 1986, as amended. The acquiredCalifornia net operating loss carryforwards are also subject to limitation rules comparable to the FederalSection 382 limitations. The Company believes that it will be able to utilize the federal net operating lossesincluded in the deferred tax asset and, accordingly, no valuation allowance has been recorded. The valuationallowance for state net operating loss carryovers was increased during the year to reflect the fact that theCompany believes that it is more likely than not that all but $0.1 million of the acquired California netoperating loss carryovers included in the deferred tax asset will not be realized prior to their expiration.
58
Jo-Ann Stores, Inc.
Notes to Consolidated Financial Statements (Continued)

Note 6 — Financing
Long-term debt consists of the following at the end of fiscal 2008 and 2007:
2008 2007Fiscal Year
(Dollars in millions)
Credit Facility . . . . . . . . . . . . . . . . . . . . . . . . . . . . . . . . . . . . . . . . . . . . . . . $ — $ 25.37.5 percent senior subordinated notes . . . . . . . . . . . . . . . . . . . . . . . . . . . . . . 100.0 100.0
Total Long-term debt . . . . . . . . . . . . . . . . . . . . . . . . . . . . . . . . . . . . . . . . . . $100.0 $125.3
Secured Credit Facility
The Credit Facility as amended is a $425 million revolver led by Bank of America Retail Finance, Inc. thatexpires April 30, 2009, which the Company expects to renew prior to its expiration. In November 2007, theCompany amended the Credit Facility to allow for the acquisition of the remaining equity of IdeaForest.com. InFebruary 2006, the Company amended the Credit Facility primarily to increase the commitment from $350 mil-lion to $425 million. The February 2006 amendment, among other things, also improved advance rates oninventory during peak borrowing periods and modified the consolidated net worth covenant.
The Credit Facility is secured by a first priority perfected security interest in the Company’s inventory,accounts receivable, property and other assets and is fully and unconditionally guaranteed by certain of theCompany’s wholly-owned subsidiaries. Interest on borrowings under the Credit Facility is calculated at thebank’s base rate or LIBOR plus 1.25 percent to 2.00 percent, depending on the level of excess availability (asdefined in the credit agreement) that is maintained. At February 2, 2008, interest on the Company’s borrowingsunder the Credit Facility was at the bank’s base rate. The Credit Facility contains a sub-limit for letters ofcredit of $200 million. Deferred financing costs of $1.8 million, related to the unamortized portion of thedeferred financing costs of the original financing, as well as the amendment fees, are being amortized over theterm of the Credit Facility. As of February 2, 2008, the Company had no borrowings outstanding under theCredit Facility and $44.3 million in letters of credit outstanding.
The Company’s weighted average interest rate and weighted average borrowings under the Credit Facilityand prior senior bank credit facility were 6.9 percent and $45.3 million during fiscal 2008 and 6.7 percent and$99.2 million during fiscal 2007.
The Credit Facility contains covenants that, among other things, restrict the Company’s ability to incuradditional indebtedness or guarantee obligations, engage in mergers or consolidations, dispose of assets, makeinvestments, acquisitions, loans or advances, engage in certain transactions with affiliates, conduct certaincorporate activities, create liens, or change the nature of its business. The Company is restricted in its abilityto prepay or modify the terms of other indebtedness, pay dividends and make other distributions when excessavailability, as defined, falls below certain levels. Further, the Company is required to comply with the modifiedminimum consolidated net worth financial covenant if excess availability, as defined, is less than $35 millionat any time. As of February 2, 2008, excess availability was $231.3 million, and at the Company’s peakborrowing level during fiscal 2008, the excess availability was $175.0 million. The Credit Facility also definesvarious events of default, including cross-default provisions, defaults for any material judgments or a changein control. At February 2, 2008, the Company was in compliance with all covenants under the Credit Facility.
The fair value of the debt outstanding under the Company’s Credit Facility approximated carrying value atFebruary 2, 2008 and February 3, 2007.
59
Jo-Ann Stores, Inc.
Notes to Consolidated Financial Statements (Continued)

Note 6 — Financing (Continued)
Senior Subordinated Notes
On February 26, 2004, the Company issued $100 million 7.5 percent Notes due on March 1, 2012. Intereston the Notes is payable on March 1 and September 1 of each year. Deferred debt costs recorded at issuance of$2.6 million are reflected in other long-term assets and are being amortized as interest expense over the termof the Notes utilizing the effective interest method. The Company has the option of redeeming the Notes atany time after March 1, 2008 in accordance with certain call provisions of the related Note indenture. TheNotes represent unsecured obligations that are subordinated to the Credit Facility and are fully andunconditionally guaranteed by certain of the Company’s wholly-owned subsidiaries.
The Note indenture contains covenants that, among other things, restrict the Company’s ability to incuradditional indebtedness, make restricted payments, engage in certain transactions with affiliates, create liens,sell assets and issue guarantees of and pledges to secure indebtedness. In the event of a change in control,the Company would be required to offer to repurchase the Notes. The indenture defines various events ofdefault, including cross-default provisions and defaults for any material judgments. Failure to comply withthese restrictions and covenants could result in defaults under the Company’s Credit Facility and/or Noteindenture. Any default, if not waived, could result in the Company’s debt becoming immediately due andpayable. At February 2, 2008, the Company was in compliance with all covenants under its Note indenture. Theentire amount of the Company’s $100.0 million long-term debt matures in fiscal year 2013.
Note 7 — Capital Stock
Shareholders’ Rights Plan
On February 26, 2007, the Company amended and restated its Shareholders’ Rights Plan (the “RightsPlan”). Under the Rights Plan, as amended and restated, one right is issued for each common shareoutstanding. The rights are exercisable only if a person or group buys or announces a tender offer for15 percent or more of the outstanding common shares as defined in the Rights Plan. When exercisable, eachright initially entitles a holder of common shares to purchase one common share for $52.17, or under certaincircumstances one common share for $0.43. The rights, which do not have voting privileges, expire at theclose of business on October 31, 2010, but may be redeemed by the Board of Directors prior to that time,under certain circumstances, for $0.005 per right. Until the rights become exercisable, they have no effect onearnings per share.
Right to Acquire Shares
The Company is a party to an agreement with certain members of the two founding families of theCompany, whereby the Company has a right of first refusal to acquire, at market prices, common sharesdisposed of by either of the families. Approximately 2.0 million shares are subject to this agreement as ofFebruary 2, 2008.
Note 8 — Stock-Based Compensation
The Company has various stock-based compensation plans that it utilizes as long-term compensation forits board of directors, executive officers, senior management and other key employees. The Company issuescommon shares and stock options under these various stock-based compensation plans. Stock-based compen-sation expense resulting from the issuance of restricted shares and stock options is recognized over the vestingperiod of the awards.
60
Jo-Ann Stores, Inc.
Notes to Consolidated Financial Statements (Continued)

Note 8 — Stock-Based Compensation (Continued)
Summarized below are the various plans used by the Company to administer its stock-based compensationaward programs.
Plan Overview
1998 Incentive Compensation Plan (the “1998 Plan”) Allows for the grant of stock appreciation rights,stock awards, stock options, stock purchase rights andincentive compensation awards (payable in shares orcash) to employees and non-employee directors. Italso allows the operation of an employee stockpurchase program and a deferred stock program fornon-employee directors. At February 2, 2008,1,661,585 stock options and 570,930 restricted shareswere outstanding under the 1998 Plan. This planterminates on June 3, 2008, but the termination willnot affect awards that are outstanding under the planat the termination date.
1996 Stock Option Plan for Non-Employee Directors(the “Directors Stock Option Plan”)
Previously used to award stock options tonon-employee directors. The plan is no longer used togrant stock options. At February 2, 2008, 12,900stock options were outstanding under the DirectorsStock Option Plan.
1994 Executive Incentive Plan (the “Executive Plan”) Previously used to award restricted share awards toexecutive officers, senior management and other keyemployees. This plan terminated on January 31, 2004.The termination of the plan does not affect awardsthat are currently outstanding under the plan. AtFebruary 2, 2008, 21,850 restricted shares wereoutstanding under the Executive Plan.
1990 Employee Stock Option and Stock AppreciationRights Plan (the “1990 Plan”)
Previously used to award stock options to officers andkey employees. This plan terminated on March 14,2000. The termination of the plan does not affectawards that are currently outstanding under the plan.At February 2, 2008, 2,500 options were outstandingunder the 1990 Plan.
Stock appreciation rights, stock awards, stock options, stock purchase rights and incentive compensationawards (payable in shares or cash) are available for grant to executive officers and employees under the 1998Incentive Compensation Plan (“1998 Plan”), which expires on June 3, 2008. The Compensation Committeeoversees the 1998 Plan, specifically approves all awards to executive officers and other senior managementemployees, and approves, on a program basis, grants to other employees. Stock options, time-based restrictedshares and performance shares have been issued under this plan.
Stock Options
The employee and non-employee director stock options granted under the 1998 Plan generally becomeexercisable to the extent of one-fourth of the optioned shares for each full year of continuous employment orservice following the date of grant and as of fiscal 2008, non-employee director stock options are exercisableat their vesting date or upon termination if the non-employee director terminates service one year or moreafter the grant date. Both the employee and non-employee stock options generally expire seven years after thedate of the grant, though some options granted in the past had ten-year expiration dates. Stock options
61
Jo-Ann Stores, Inc.
Notes to Consolidated Financial Statements (Continued)

Note 8 — Stock-Based Compensation (Continued)
granted under the 1998 Plan may become exercisable or expire under different terms as approved by theCompensation Committee of the Board of Directors.
Summarized below is stock option activity for the 1998 Plan, the 1990 Plan and the Directors StockOption Plan:
The following table summarizes activity, pricing and other information for the Company’s stock options forfiscal 2008:
Number ofOptions
Weighted-AverageExercise Price
per Option
Weighted-AverageRemaining
Contractual Term
AggregateIntrinsicValue(a)
Outstanding at February 3, 2007 . . . 1,607,297 $15.51Granted . . . . . . . . . . . . . . . . . . . . 660,173 24.26Exercised . . . . . . . . . . . . . . . . . . . (347,877) 16.02Cancelled . . . . . . . . . . . . . . . . . . . (242,608) 20.90
Outstanding at February 2, 2008 . . . 1,676,985 $18.06 4.4 years $1,672,019
Expected to vest . . . . . . . . . . . . . . 1,440,575 $17.84 4.2 years $1,649,263
Exercisable at February 2, 2008 . . . . 727,340 $14.38 2.6 years $1,609,610
(a) The intrinsic value of a stock option is the amount by which the fair value of the underlying stock exceedsthe exercise price of the option.
The total intrinsic value of options exercised during fiscal 2008, 2007 and 2006 was $4.0 million,$1.3 million and $5.1 million, respectively.
Restricted Share Awards — Time-Based Awards
The vesting periods for the restricted shares and restricted stock units granted under the 1998 Plan duringfiscal years 2006 — 2008 are up to four years for employee restricted shares, and one year for non-employeedirector restricted shares and restricted stock units. As of fiscal 2008, the restrictions lapse on restrictedshares and restricted stock unit awards when a non-employee director terminates service one year or moreafter the grant date and a pro rata acceleration of the lapse of restrictions occurs when a director terminatesservice less than one year after such grants. All restrictions on restricted shares and restricted stock unitsterminate if the grantee remains in the continuous service of the Company throughout the vesting period
In fiscal 2006, the Compensation Committee of the Board of Directors approved an annual base award ofrestricted shares to certain of the Company’s employees that was coupled with performance awards. The baseaward grants, which are time-based awards and amounted to approximately 166,000 restricted shares, vest50 percent at the end of three years, with the remaining 50 percent vesting at the end of the fourth year.
On November 18, 2005, the Compensation Committee of the Board of Directors approved a retentionprogram that provided a guaranteed cash retention payment, in lieu of a bonus opportunity under theManagement Incentive Plan, and awarded restricted share and stock options under the 1998 Plan to keymanagement employees. The restricted share awards amounted to approximately 233,000 shares and vested50 percent on March 1, 2007 and 50 percent on March 1, 2008. The stock option awards amounted toapproximately 390,000 shares and vest 50 percent on March 1, 2009 and 50 percent on March 1, 2010.
62
Jo-Ann Stores, Inc.
Notes to Consolidated Financial Statements (Continued)

Note 8 — Stock-Based Compensation (Continued)
As of February 2, 2008, 592,780 restricted shares were outstanding in which the restrictions lapse uponthe achievement of continued employment over a specified period of time (time-based restricted shareawards).
The following table summarizes activity for the 1998 Plan and the Executive Plan for time-based restrictedstock awards for fiscal 2008:
Number ofShares
Weighted-Average GrantDate Fair Value
Outstanding at February 3, 2007 . . . . . . . . . . . . . . . . . . . . . . . . . . . . . 707,750 $17.21Granted . . . . . . . . . . . . . . . . . . . . . . . . . . . . . . . . . . . . . . . . . . . . . . 178,068 24.00Vested. . . . . . . . . . . . . . . . . . . . . . . . . . . . . . . . . . . . . . . . . . . . . . . (212,422) 22.77Cancelled . . . . . . . . . . . . . . . . . . . . . . . . . . . . . . . . . . . . . . . . . . . . . (80,616) 21.73
Outstanding at February 2, 2008 . . . . . . . . . . . . . . . . . . . . . . . . . . . . . 592,780 $19.75
The fair value of restricted shares is determined based on the closing trading price of the Company’sshares on the grant date.
During fiscal 2008, 2007 and 2006, the Company granted time-based restricted share awards withweighted-average grant-date fair values of $24.00, $14.14 and $19.73, respectively. As of February 2, 2008,there was $4.4 million of total unrecognized compensation cost related to restricted awards expected to vest,which is expected to be recognized over a weighted-average period of 1.1 years. During fiscal 2008, 2007 and2006, the total fair value of shares fully vested was $4.8 million, $0.5 million and $0.3 million, respectively.
Restricted Shares — Performance-Based Awards
The performance-based awards approved by the Compensation Committee of the Board of Directors duringfiscal 2008 and 2006 are issued only upon the achievement of specific measurable performance criteria.Performance shares are awarded at plus or minus the target grant depending upon the level of achievement ofthe specified performance metric at the end of the fiscal year. In fiscal 2008, the Company grantedperformance shares to its officers at and above the Vice President level. The performance objective associatedwith the fiscal 2008 performance shares is based on the Company’s earnings per share during fiscal 2008, aone-year performance period, established as a range (Threshold, Target, Maximum). The threshold for earningany performance shares was set at earnings per share of $0.61 per share. Target had been set at $0.75 pershare and maximum had been set at $0.91 per share. The achievement of the Target performance level forearnings per share would have resulted in the issuance of 97,100 shares. The expense for performance-basedawards is recognized over the vesting period when the related criteria are probable of being achieved. Basedupon the Company’s fiscal 2008 results, 5,633 performance shares were issued, which will vest in equalinstallments over a four-year period following the date of grant. Expense of $0.1 million was recognized duringfiscal 2008 for these performance shares.
The performance-based awards approved in fiscal 2006 were dependent on the Company achieving certainnet income performance criteria that are measured at the end of fiscal 2008. The threshold performance levelwas not attained for the fiscal 2006 performance-based restricted awards, and, therefore, none of theseperformance-based award shares were issued. No expense was recognized during fiscal 2007 and 2008 for theseawards based on the Company’s performance.
63
Jo-Ann Stores, Inc.
Notes to Consolidated Financial Statements (Continued)

Note 8 — Stock-Based Compensation (Continued)
Shares Available to Grant
The total number of shares available for awards under the 1998 plan, other than those granted under theemployee stock purchase program, are limited in any fiscal year to (1) four percent of the number of sharesoutstanding at the beginning of the fiscal year, plus (2) for each of the two prior fiscal years, the excess offour percent of the number of shares outstanding at the beginning of each such fiscal year over the number ofshare awards actually granted in each such fiscal year. The number of shares available for future awards underthe 1998 Plan as of February 2, 2008 was 2,218,108. However, since the 1998 Plan expires on June 3, 2008,no further awards will be made under that Plan after that date. The Company will be seeking shareholderapproval of a new plan at its 2008 Annual Meeting of Shareholders.
Employee Stock Purchase Program
The employee stock purchase program (the Associate Stock Ownership Plan or “ASOP”) enables allemployees, except temporary and seasonal employees, to purchase shares of the Company’s common shares onoffering dates at six-month intervals, at a purchase price equal to the lesser of 85 percent of the fair marketvalue of the common shares on the first or last day of the offering period. The ASOP meets the requirements ofSection 423 of the Internal Revenue Code of 1986 and the Company is, therefore, not required to file incometax returns or pay income taxes. The total number of shares subject to stock purchase rights granted in anyfiscal year for the ASOP may not exceed 1,000,000 shares. During fiscal 2008, 2007 and 2006, stock purchaserights of 134,942 shares, 197,850 shares and 132,787 shares, respectively, were granted and exercised underthe ASOP. The 15 percent discount from market value granted to ASOP participants on the purchase of sharesat the end of each accumulation period represents the Company’s non-cash contribution to the ASOP and isrecognized as compensation expense. The stock-based compensation expense was not significant for any of theyears presented. The ASOP will expire on June 3, 2008 along with the 1998 plan, and no offering period willcommence after that date. The Company will be seeking shareholder approval of a new plan at its 2008 AnnualMeeting of Shareholders.
Non-Employee Directors Deferred Stock Program
The Company maintains a deferred stock program for non-employee directors. This program allowsnon-employee directors to elect to convert their cash compensation into deferred stock units. Under thisfeature, non-employee directors make an irrevocable election prior to each calendar year whereby they canelect to convert a percentage (0 percent to 100 percent in 25 percent increments) of their cash compensationfor the following calendar year to deferred stock units. The conversion of cash compensation to deferred stockunits is based on the closing market price of the Company’s common shares on the date the cash compensationwould have been payable if it were paid in cash. These deferred stock units are credited to an account of eachnon-employee director, although no stock is issued until the earlier of an elected distribution date, as selectedby the non-employee director, or retirement. During fiscal 2008, 2007 and 2006, 842 deferred stock units,2,626 deferred stock units and 2,064 deferred stock units, respectively, were deferred under the deferred stockprogram.
Note 9 — Savings Plan Retirement and Postretirement Benefits
The Company sponsors the Jo-Ann Stores, Inc. 401(k) Savings Plan (the “Savings Plan”), which is a taxdeferred savings plan whereby eligible employees may elect quarterly to contribute up to the lesser of15 percent of annual compensation or the statutory maximum. The Company makes a 50 percent matchingcontribution up to a maximum employee contribution of six percent of the employee’s annual compensation,which was increased from four percent as of February 1, 2005. Effective January 2007, the match is made incash and can be participant-directed. Prior to January 2007, employer contributions in the form of the
64
Jo-Ann Stores, Inc.
Notes to Consolidated Financial Statements (Continued)

Note 9 — Savings Plan Retirement and Postretirement Benefits (Continued)
Company’s common shares had been made through the issuance of shares out of treasury or by purchasingshares on the open market. The amount of the Company’s matching contributions during fiscal 2008, 2007 and2006 were $1.7 million, $1.8 million and $1.7 million, respectively. Holders of the common shares are entitledto vote their respective shares. The Company does not provide postretirement health care benefits for itsemployees.
The Company participates in a multi-employer pension plan for its union employees located at the HudsonDistribution Center. The Plan is administered by the United Steelworkers Union. The Plan is the “SteelworkersPension Trust” and the Company contributed $0.6 million, $0.7 million and $0.9 million for fiscal years 2008,2007 and 2006, respectively.
Note 10 — Commitments and Contingencies
The Company is involved in various litigation matters in the ordinary course of its business. The Companyis not currently involved in any litigation, which it expects, either individually or in the aggregate, will have amaterial adverse effect on its financial condition or results of operations.
Note 11 — Leases
With the exception of one large-format store, all of the Company’s retail stores operate out of leasedfacilities. Our store leases generally have initial terms of five to fifteen years with renewal options for up to20 years. The Company also leases certain computer and store equipment, with lease terms that are generallyfive years or less. Included in the future minimum rental payments is the operating lease for our distributioncenter located in Visalia, California. The lease has an initial term of 20 years.
The Company recognizes lease expense for step rent provisions, escalation clauses, rent holiday, capitalimprovement funding and other lease concessions using the straight-line method over the minimum lease term.The Company does not have lease arrangements that have minimum lease payments dependent on an existingindex or rate, such as the consumer price index or the prime interest rate. Certain leases contain escalationclauses and provide for contingent rents based on a percent of sales in excess of defined minimums. In certaininstances, the Company is required to pay its pro rata share of real estate taxes and common area maintenanceexpenses.
The following is a schedule of future minimum rental payments under non-cancelable operating leases.Future minimum rental payments are reduced by $9.9 million of sublease income.
Fiscal Year-EndedMinimumRentals
(Dollars in millions)
2009 . . . . . . . . . . . . . . . . . . . . . . . . . . . . . . . . . . . . . . . . . . . . . . . . . . . . . . . . . . . . $148.02010 . . . . . . . . . . . . . . . . . . . . . . . . . . . . . . . . . . . . . . . . . . . . . . . . . . . . . . . . . . . . 138.32011 . . . . . . . . . . . . . . . . . . . . . . . . . . . . . . . . . . . . . . . . . . . . . . . . . . . . . . . . . . . . 122.72012 . . . . . . . . . . . . . . . . . . . . . . . . . . . . . . . . . . . . . . . . . . . . . . . . . . . . . . . . . . . . 103.82013 . . . . . . . . . . . . . . . . . . . . . . . . . . . . . . . . . . . . . . . . . . . . . . . . . . . . . . . . . . . . 88.6Thereafter . . . . . . . . . . . . . . . . . . . . . . . . . . . . . . . . . . . . . . . . . . . . . . . . . . . . . . . . 258.5
$859.9
65
Jo-Ann Stores, Inc.
Notes to Consolidated Financial Statements (Continued)
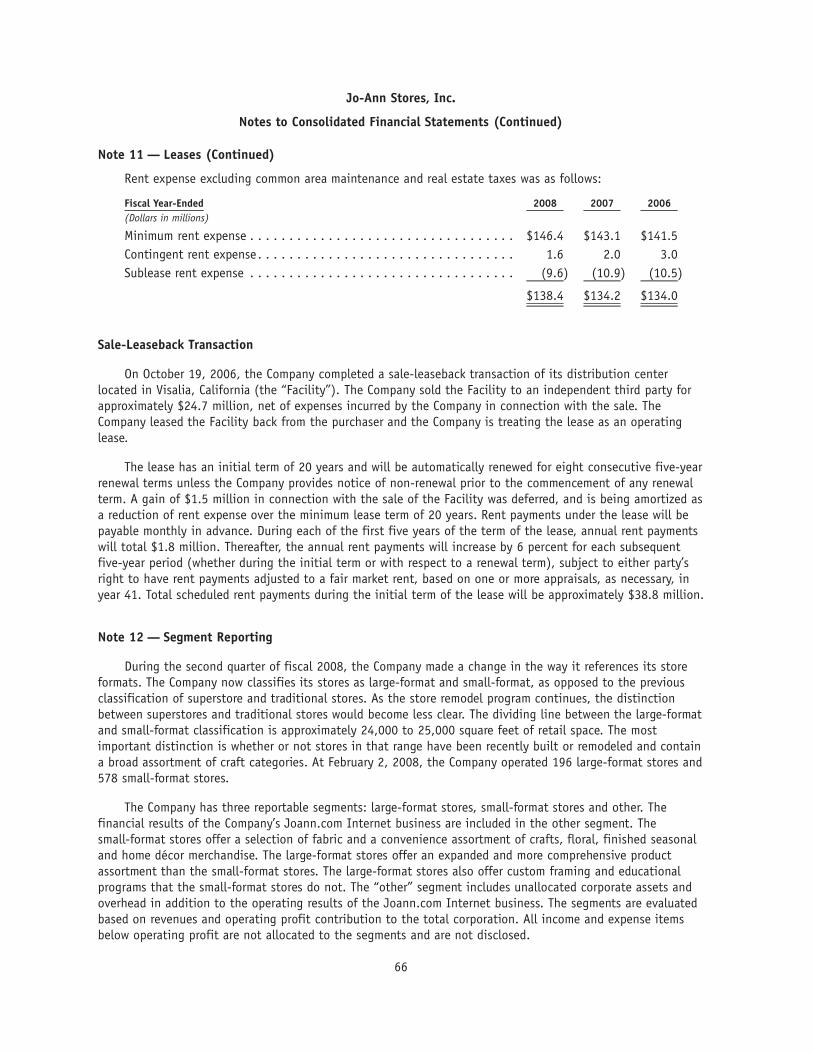
Note 11 — Leases (Continued)
Rent expense excluding common area maintenance and real estate taxes was as follows:
Fiscal Year-Ended 2008 2007 2006(Dollars in millions)
Minimum rent expense . . . . . . . . . . . . . . . . . . . . . . . . . . . . . . . . . . $146.4 $143.1 $141.5Contingent rent expense. . . . . . . . . . . . . . . . . . . . . . . . . . . . . . . . . 1.6 2.0 3.0Sublease rent expense . . . . . . . . . . . . . . . . . . . . . . . . . . . . . . . . . . (9.6) (10.9) (10.5)
$138.4 $134.2 $134.0
Sale-Leaseback Transaction
On October 19, 2006, the Company completed a sale-leaseback transaction of its distribution centerlocated in Visalia, California (the “Facility”). The Company sold the Facility to an independent third party forapproximately $24.7 million, net of expenses incurred by the Company in connection with the sale. TheCompany leased the Facility back from the purchaser and the Company is treating the lease as an operatinglease.
The lease has an initial term of 20 years and will be automatically renewed for eight consecutive five-yearrenewal terms unless the Company provides notice of non-renewal prior to the commencement of any renewalterm. A gain of $1.5 million in connection with the sale of the Facility was deferred, and is being amortized asa reduction of rent expense over the minimum lease term of 20 years. Rent payments under the lease will bepayable monthly in advance. During each of the first five years of the term of the lease, annual rent paymentswill total $1.8 million. Thereafter, the annual rent payments will increase by 6 percent for each subsequentfive-year period (whether during the initial term or with respect to a renewal term), subject to either party’sright to have rent payments adjusted to a fair market rent, based on one or more appraisals, as necessary, inyear 41. Total scheduled rent payments during the initial term of the lease will be approximately $38.8 million.
Note 12 — Segment Reporting
During the second quarter of fiscal 2008, the Company made a change in the way it references its storeformats. The Company now classifies its stores as large-format and small-format, as opposed to the previousclassification of superstore and traditional stores. As the store remodel program continues, the distinctionbetween superstores and traditional stores would become less clear. The dividing line between the large-formatand small-format classification is approximately 24,000 to 25,000 square feet of retail space. The mostimportant distinction is whether or not stores in that range have been recently built or remodeled and containa broad assortment of craft categories. At February 2, 2008, the Company operated 196 large-format stores and578 small-format stores.
The Company has three reportable segments: large-format stores, small-format stores and other. Thefinancial results of the Company’s Joann.com Internet business are included in the other segment. Thesmall-format stores offer a selection of fabric and a convenience assortment of crafts, floral, finished seasonaland home décor merchandise. The large-format stores offer an expanded and more comprehensive productassortment than the small-format stores. The large-format stores also offer custom framing and educationalprograms that the small-format stores do not. The “other” segment includes unallocated corporate assets andoverhead in addition to the operating results of the Joann.com Internet business. The segments are evaluatedbased on revenues and operating profit contribution to the total corporation. All income and expense itemsbelow operating profit are not allocated to the segments and are not disclosed.
66
Jo-Ann Stores, Inc.
Notes to Consolidated Financial Statements (Continued)
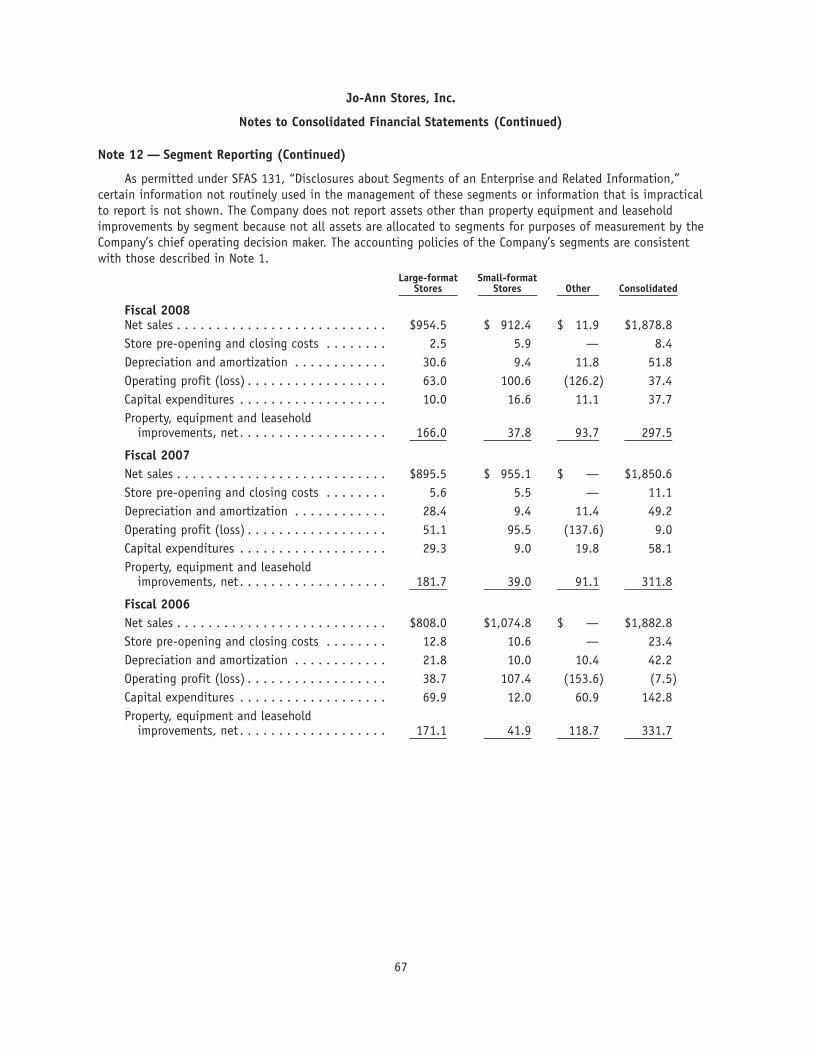
Note 12 — Segment Reporting (Continued)
As permitted under SFAS 131, “Disclosures about Segments of an Enterprise and Related Information,”certain information not routinely used in the management of these segments or information that is impracticalto report is not shown. The Company does not report assets other than property equipment and leaseholdimprovements by segment because not all assets are allocated to segments for purposes of measurement by theCompany’s chief operating decision maker. The accounting policies of the Company’s segments are consistentwith those described in Note 1.
Large-formatStores
Small-formatStores Other Consolidated
Fiscal 2008Net sales . . . . . . . . . . . . . . . . . . . . . . . . . . . $954.5 $ 912.4 $ 11.9 $1,878.8Store pre-opening and closing costs . . . . . . . . 2.5 5.9 — 8.4Depreciation and amortization . . . . . . . . . . . . 30.6 9.4 11.8 51.8Operating profit (loss) . . . . . . . . . . . . . . . . . . 63.0 100.6 (126.2) 37.4Capital expenditures . . . . . . . . . . . . . . . . . . . 10.0 16.6 11.1 37.7Property, equipment and leasehold
improvements, net . . . . . . . . . . . . . . . . . . . 166.0 37.8 93.7 297.5
Fiscal 2007Net sales . . . . . . . . . . . . . . . . . . . . . . . . . . . $895.5 $ 955.1 $ — $1,850.6Store pre-opening and closing costs . . . . . . . . 5.6 5.5 — 11.1Depreciation and amortization . . . . . . . . . . . . 28.4 9.4 11.4 49.2Operating profit (loss) . . . . . . . . . . . . . . . . . . 51.1 95.5 (137.6) 9.0Capital expenditures . . . . . . . . . . . . . . . . . . . 29.3 9.0 19.8 58.1Property, equipment and leasehold
improvements, net . . . . . . . . . . . . . . . . . . . 181.7 39.0 91.1 311.8
Fiscal 2006Net sales . . . . . . . . . . . . . . . . . . . . . . . . . . . $808.0 $1,074.8 $ — $1,882.8Store pre-opening and closing costs . . . . . . . . 12.8 10.6 — 23.4Depreciation and amortization . . . . . . . . . . . . 21.8 10.0 10.4 42.2Operating profit (loss) . . . . . . . . . . . . . . . . . . 38.7 107.4 (153.6) (7.5)Capital expenditures . . . . . . . . . . . . . . . . . . . 69.9 12.0 60.9 142.8Property, equipment and leasehold
improvements, net . . . . . . . . . . . . . . . . . . . 171.1 41.9 118.7 331.7
67
Jo-Ann Stores, Inc.
Notes to Consolidated Financial Statements (Continued)

Note 13 — Quarterly Financial Information (Unaudited)
Summarized below are the unaudited results of operations by quarter for fiscal 2008 and 2007:
Fiscal 2008First
QuarterSecondQuarter
ThirdQuarter
FourthQuarter
(Dollars in millions, except per share data)
Net sales . . . . . . . . . . . . . . . . . . . . . . . . . . . . . . . . . . . . $424.2 $388.5 $480.2 $585.9Gross margin . . . . . . . . . . . . . . . . . . . . . . . . . . . . . . . . . 200.6 177.4 230.5 263.9Net (loss) income . . . . . . . . . . . . . . . . . . . . . . . . . . . . . . (1.7) (18.4) 8.0 27.5Net (loss) income per common share:
Basic . . . . . . . . . . . . . . . . . . . . . . . . . . . . . . . . . . . . . $ (0.07) $(0.76) $ 0.33 $ 1.12Diluted . . . . . . . . . . . . . . . . . . . . . . . . . . . . . . . . . . . (0.07) (0.76) 0.32 1.10
Fiscal 2007First
QuarterSecondQuarter
ThirdQuarter
FourthQuarter
(Dollars in millions, except per share data)
Net sales . . . . . . . . . . . . . . . . . . . . . . . . . . . . . . . . . . . . $424.7 $363.2 $461.9 $600.8Gross margin . . . . . . . . . . . . . . . . . . . . . . . . . . . . . . . . . 198.0 172.3 219.1 270.4(Loss) income before cumulative effect of accounting
change. . . . . . . . . . . . . . . . . . . . . . . . . . . . . . . . . . . . (7.6) (21.2) 0.1 25.8Net (loss) income . . . . . . . . . . . . . . . . . . . . . . . . . . . . . . (6.6) (21.2) 0.1 25.8Net (loss) income per common share:(Loss) income per common share — basic:
(Loss) income before cumulative effect of accountingchange . . . . . . . . . . . . . . . . . . . . . . . . . . . . . . . . . . $ (0.32) $(0.90) $ 0.00 $ 1.09Net (loss) income. . . . . . . . . . . . . . . . . . . . . . . . . . . (0.28) (0.90) 0.00 1.09
(Loss) income per common share — diluted:(Loss) income before cumulative effect of accounting
change . . . . . . . . . . . . . . . . . . . . . . . . . . . . . . . . . . (0.32) (0.90) 0.00 1.05Net (loss) income. . . . . . . . . . . . . . . . . . . . . . . . . . . (0.28) (0.90) 0.00 1.05
68
Jo-Ann Stores, Inc.
Notes to Consolidated Financial Statements (Continued)

Note 14 — Consolidating Financial Statements
The Company’s 7.5 percent Notes and Credit Facility are fully and unconditionally guaranteed, on a jointand several basis, by certain wholly-owned subsidiaries of the Company. The Notes are subordinated to theCompany’s Credit Facility. Summarized consolidating financial information of the Company (excluding itssubsidiaries) and the guarantor subsidiaries as of and for fiscal years 2008, 2007 and 2006 is as follows:
ConsolidatingBalance Sheets Parent
GuarantorSubsidiaries Eliminations Consolidated Parent
GuarantorSubsidiaries Eliminations Consolidated
February 2, 2008 February 3, 2007
(Dollars in millions)
AssetsCurrent assets:
Cash and cash equivalents . . . . . $ (1.0) $ 26.4 $ 25.4 $ (8.8) $ 27.2 $ 18.4
Inventories . . . . . . . . . . . . . . 208.5 263.7 472.2 200.8 252.6 453.4
Deferred income taxes . . . . . . . . 20.1 6.3 26.4 35.2 6.4 41.6
Prepaid expenses and othercurrent assets . . . . . . . . . . . 17.8 6.0 23.8 20.7 9.7 30.4
Total current assets . . . . . . . . . . . 245.4 302.4 — 547.8 247.9 295.9 — 543.8
Property, equipment and leaseholdimprovements, net . . . . . . . . . . 142.8 154.7 297.5 149.6 162.2 311.8
Goodwill, net . . . . . . . . . . . . . . . 11.8 — 11.8 — — —
Other assets . . . . . . . . . . . . . . . 12.8 (0.5) 12.3 9.2 1.5 10.7
Investment in subsidiaries . . . . . . . 70.9 — (70.9) — 50.3 — (50.3) —
Intercompany receivable . . . . . . . . 355.5 — (355.5) — 358.1 — (358.1) —
Total assets . . . . . . . . . . . . . . . . $839.2 $456.6 $(426.4) $869.4 $815.1 $459.6 $(408.4) $866.3
Liabilities and Shareholders’Equity
Current liabilities:
Accounts payable . . . . . . . . . . . $151.6 $ (6.3) $145.3 $144.2 $ 3.3 $147.5
Accrued expenses . . . . . . . . . . . 96.5 0.6 97.1 82.8 1.6 84.4
Total current liabilities . . . . . . . . . 248.1 (5.7) — 242.4 227.0 4.9 — 231.9
Long-term debt . . . . . . . . . . . . . 100.0 — 100.0 125.3 — 125.3
Long-term deferred income taxes . . . (5.2) 5.2 — (1.5) 15.7 14.2
Lease obligations and other long-term liabilities . . . . . . . . . . . . 56.3 30.7 87.0 54.5 30.6 85.1
Intercompany payable . . . . . . . . . — 355.5 (355.5) — — 358.1 (358.1) —
Shareholders’ equity:
Preferred stock . . . . . . . . . . . . — — — — — —
Common stock . . . . . . . . . . . . . 1.4 — 1.4 1.4 — 1.4
Additional paid-in capital . . . . . . 194.6 — 194.6 176.9 — 176.9
Retained earnings . . . . . . . . . . 288.5 70.9 (70.9) 288.5 274.7 50.3 (50.3) 274.7
484.5 70.9 (70.9) 484.5 453.0 50.3 (50.3) 453.0
Treasury stock, at cost . . . . . . . . (44.5) — (44.5) (43.2) — (43.2)
Total shareholders’ equity . . . . . . . 440.0 70.9 (70.9) 440.0 409.8 50.3 (50.3) 409.8
Total liabilities and shareholders’equity . . . . . . . . . . . . . . . . . . $839.2 $456.6 $(426.4) $869.4 $815.1 $459.6 $(408.4) $866.3
69
Jo-Ann Stores, Inc.
Notes to Consolidated Financial Statements (Continued)

Note 14 — Consolidating Financial Statements (Continued)
Consolidating Statementof Operations Parent
GuarantorSubsidiaries Eliminations Consolidated Parent
GuarantorSubsidiaries Eliminations Consolidated
February 2, 2008 February 3, 2007Fiscal Year-Ended
(Dollars in millions)
Net sales . . . . . . . . . . . . . . . $1,024.6 $1,405.2 $(551.0) $1,878.8 $1,029.3 $1,387.8 $(566.5) $1,850.6
Cost of sales (exclusive ofdepreciation and amortizationshown separately below) . . . . 612.4 945.0 (551.0) 1,006.4 605.8 951.5 (566.5) 990.8
Gross margin . . . . . . . . . . . 412.2 460.2 — 872.4 423.5 436.3 — 859.8
Selling, general andadministrative expenses . . . . 383.9 390.9 774.8 395.4 395.1 790.5
Store pre-opening and closingcosts . . . . . . . . . . . . . . . . 4.0 4.4 8.4 4.5 6.6 11.1
Depreciation and amortization . . 25.8 26.0 51.8 24.7 24.5 49.2
Operating (loss) profit . . . . . (1.5) 38.9 — 37.4 (1.1) 10.1 — 9.0
Interest expense, net. . . . . . . . 5.5 7.0 12.5 6.5 9.1 15.6
(Loss) income before incometaxes . . . . . . . . . . . . . . (7.0) 31.9 — 24.9 (7.6) 1.0 — (6.6)
Income tax (benefit) provision . . (1.8) 11.3 9.5 (2.1) (1.6) (3.7)
(Loss) income before equityincome (loss) andcumulative effect . . . . . . . (5.2) 20.6 — 15.4 (5.5) 2.6 — (2.9)
Equity income (loss) fromsubsidiaries . . . . . . . . . . . . 20.6 — (20.6) — 2.6 — (2.6) —
Income (loss) beforecumulative effect . . . . . . . 15.4 20.6 (20.6) 15.4 (2.9) 2.6 (2.6) (2.9)
Cumulative effect of accountingchange, net of tax . . . . . . . . — — — 1.0 — 1.0
Net income (loss) . . . . . . . . . . $ 15.4 $ 20.6 $ (20.6) $ 15.4 $ (1.9) $ 2.6 $ (2.6) $ (1.9)
Consolidating Statement of Operations ParentGuarantor
Subsidiaries Eliminations Consolidated
Fiscal Year-Ended January 28, 2006
(Dollars in millions)
Net sales . . . . . . . . . . . . . . . . . . . . . . . . . . . . . . . . . . . . . . . . . . . . . $1,041.5 $1,452.5 $(611.2) $1,882.8
Cost of sales (exclusive of depreciation and amortization shown separatelybelow) . . . . . . . . . . . . . . . . . . . . . . . . . . . . . . . . . . . . . . . . . . . . . 622.8 1,012.0 (611.2) 1,023.6
Gross margin . . . . . . . . . . . . . . . . . . . . . . . . . . . . . . . . . . . . . . . . . 418.7 440.5 — 859.2
Selling, general and administrative expenses . . . . . . . . . . . . . . . . . . . . . . . . 369.7 404.3 774.0
Store pre-opening and closing costs . . . . . . . . . . . . . . . . . . . . . . . . . . . . . 14.9 8.5 23.4
Depreciation and amortization . . . . . . . . . . . . . . . . . . . . . . . . . . . . . . . . 21.0 21.2 42.2
Goodwill impairment . . . . . . . . . . . . . . . . . . . . . . . . . . . . . . . . . . . . . . — 27.1 27.1
Operating profit (loss) profit . . . . . . . . . . . . . . . . . . . . . . . . . . . . . . . . 13.1 (20.6) — (7.5)
Interest expense, net . . . . . . . . . . . . . . . . . . . . . . . . . . . . . . . . . . . . . . 5.0 7.8 12.8
Income (loss) before income taxes . . . . . . . . . . . . . . . . . . . . . . . . . . . . 8.1 (28.4) — (20.3)
Income tax provision (benefit) . . . . . . . . . . . . . . . . . . . . . . . . . . . . . . . . 3.2 (0.5) 2.7
Income (loss) before equity loss. . . . . . . . . . . . . . . . . . . . . . . . . . . . . . 4.9 (27.9) — (23.0)
Equity loss from subsidiaries . . . . . . . . . . . . . . . . . . . . . . . . . . . . . . . . . (27.9) — 27.9 —
Net loss . . . . . . . . . . . . . . . . . . . . . . . . . . . . . . . . . . . . . . . . . . . . . . $ (23.0) $ (27.9) $ 27.9 $ (23.0)
70
Jo-Ann Stores, Inc.
Notes to Consolidated Financial Statements (Continued)

Note 14 — Consolidating Financial Statements (Continued)
Consolidating Statements ofCash Flows Parent
GuarantorSubsidiaries Eliminations Consolidated Parent
GuarantorSubsidiaries Eliminations Consolidated
February 2, 2008 February 3, 2007Fiscal Year-Ended
(Dollars in millions)
Net cash provided by operatingactivities . . . . . . . . . . . . . . $ 55.7 $ 17.9 $— $ 73.6 $ 54.8 $ 51.0 $— $105.8
Net cash flows used for investingactivities:
Capital expenditures . . . . . . . . (19.0) (18.7) — (37.7) (22.2) (35.9) — (58.1)
Payment for Acquisition, net ofcash acquired . . . . . . . . . . (11.7) — — (11.7) — — — —
Net proceeds from sale-leaseback transaction . . . . . — — — — — 24.7 — 24.7
Net cash used for investingactivities . . . . . . . . . . . . . . (30.7) (18.7) — (49.4) (22.2) (11.2) — (33.4)
Net cash flows used for financingactivities:
Net change in revolving creditfacility . . . . . . . . . . . . . . (25.3) — — (25.3) (78.4) — — (78.4)
Dividends paid . . . . . . . . . . . — — — 15.0 (15.0)
Proceeds from stock-basedcompensation plans . . . . . . 7.8 — — 7.8 5.2 — — 5.2
Other, net . . . . . . . . . . . . . . 0.3 — — 0.3 1.3 — — 1.3
Net cash used for financingactivities . . . . . . . . . . . . . . (17.2) — — (17.2) (56.9) (15.0) — (71.9)
Net (decrease) increase in cashand cash equivalents . . . . . . . 7.8 (0.8) — 7.0 (24.3) 24.8 — 0.5
Cash and cash equivalents atbeginning of year . . . . . . . . . (8.8) 27.2 — 18.4 15.5 2.4 — 17.9
Cash and cash equivalents at endof year . . . . . . . . . . . . . . . . $ (1.0) $ 26.4 $— $ 25.4 $ (8.8) $ 27.2 $— $ 18.4
Consolidating Statements of Cash Flows ParentGuarantor
Subsidiaries Eliminations Consolidated
Fiscal Year-Ended January 28, 2006
(Dollars in millions)
Net cash provided by (used for) operating activities . . . . . . . . . . . . . . . . . . . . $(101.1) $ 69.6 $— $ (31.5)
Net cash flows used for investing activities:
Capital expenditures . . . . . . . . . . . . . . . . . . . . . . . . . . . . . . . . . . . . . (72.6) (70.2) — (142.8)
Net cash used for investing activities . . . . . . . . . . . . . . . . . . . . . . . . . . . . . (72.6) (70.2) — (142.8)
Net cash flows provided by financing activities:
Net change in revolving credit facility . . . . . . . . . . . . . . . . . . . . . . . . . . . 103.7 — — 103.7
Proceeds from stock-based compensation plans . . . . . . . . . . . . . . . . . . . . . 7.9 — — 7.9
Other, net . . . . . . . . . . . . . . . . . . . . . . . . . . . . . . . . . . . . . . . . . . . . 1.0 — — 1.0
Net cash provided by financing activities . . . . . . . . . . . . . . . . . . . . . . . . . . 112.6 — — 112.6
Net decrease in cash and cash equivalents . . . . . . . . . . . . . . . . . . . . . . . . . . (61.1) (0.6) — (61.7)
Cash and cash equivalents at beginning of year. . . . . . . . . . . . . . . . . . . . . . . 76.6 3.0 — 79.6
Cash and cash equivalents at end of year . . . . . . . . . . . . . . . . . . . . . . . . . . $ 15.5 $ 2.4 $— $ 17.9
71
Jo-Ann Stores, Inc.
Notes to Consolidated Financial Statements (Continued)

Item 9. Changes in and Disagreements with Accountants on Accounting and Financial Disclosure
None.
Item 9A. Controls and Procedures
Disclosure Controls and Procedures — We maintain disclosure controls and procedures that are designed toprovide reasonable assurance that information required to be disclosed in our reports under the SecuritiesExchange Act of 1934, as amended (the “Exchange Act”), is recorded, processed, summarized and reportedwithin the time periods specified in the Securities and Exchange Commission’s (“SEC”) rules and forms, andthat such information is accumulated and communicated to the management of Jo-Ann Stores, Inc. (the“Management”), including our Principal Executive Officer and our Principal Financial Officer, as appropriate, toallow timely decisions regarding required disclosure. In designing and evaluating the disclosure controls andprocedures, Management recognized that any controls and procedures, no matter how well designed andoperated, can provide only reasonable assurance of achieving the desired control objectives.
In connection with the preparation of this Annual Report on Form 10-K, as of February 2, 2008, anevaluation was performed under the supervision and with the participation of our Management, including thePrincipal Executive Officer and Principal Financial Officer, of the effectiveness of the design and operation ofthe Company’s disclosure controls and procedures (as defined in Rule 13a-15(e) under the Exchange Act).Based upon that evaluation, our Principal Executive Officer and our Principal Financial Officer have concludedthat our disclosure controls and procedures were effective at the reasonable assurance level as of the end ofthe period covered by this Annual Report on Form 10-K.
Management’s Annual Report on Internal Control over Financial Reporting — Our management is responsiblefor establishing and maintaining adequate internal control over financial reporting as defined in Rule 13a-15(f)under the Exchange Act. Our internal control system is designed to provide reasonable assurance to ourmanagement and Board of Directors regarding the preparation and fair presentation of published financialstatements. All internal control systems, no matter how well designed, have inherent limitations. Therefore,even those systems determined to be effective can provide only reasonable assurance with respect to financialstatement preparation and presentation.
Management has assessed the effectiveness of our internal control over financial reporting as ofFebruary 2, 2008. In making its assessment of internal control over financial reporting, management used thecriteria set forth by the Committee of Sponsoring Organizations (“COSO”) of the Treadway Commission inInternal Control — Integrated Framework.
Based on management’s assessment of internal controls over financial reporting under the criteriaestablished in Internal Control — Integrated Framework, we concluded that, as of February 2, 2008, ourinternal control over financial reporting was effective to provide reasonable assurance regarding the reliabilityof financial reporting and preparation of financial statements for external purposes in accordance withaccounting principles generally accepted in the United States. Ernst & Young LLP, an independent registeredpublic accounting firm, has audited the effectiveness of our internal control over financial reporting as ofFebruary 2, 2008, and their report appears on the next page.
Changes in Internal Control Over Financial Reporting — There were no changes in our internal control overfinancial reporting that occurred during our last fiscal quarter that have materially affected, or are reasonablylikely to materially affect, our internal control over financial reporting.
72

Report of Independent Registered Public Accounting Firm
To the Shareholders and Board of Directors of Jo-Ann Stores, Inc.:
We have audited Jo-Ann Stores, Inc.’s internal control over financial reporting as of February 2, 2008,based on criteria established in Internal Control — Integrated Framework issued by the Committee ofSponsoring Organizations of the Treadway Commission (the COSO criteria). Jo-Ann Stores, Inc.’s management isresponsible for maintaining effective internal control over financial reporting, and for its assessment of theeffectiveness of internal control over financial reporting included in the accompanying Management’s AnnualReport on Internal Control over Financial Reporting. Our responsibility is to express an opinion on thecompany’s internal control over financial reporting based on our audit.
We conducted our audit in accordance with the standards of the Public Company Accounting OversightBoard (United States). Those standards require that we plan and perform the audit to obtain reasonableassurance about whether effective internal control over financial reporting was maintained in all materialrespects. Our audit included obtaining an understanding of internal control over financial reporting, assessingthe risk that a material weakness exists, testing and evaluating the design and operating effectiveness ofinternal control based on the assessed risk, and performing such other procedures as we considered necessaryin the circumstances. We believe that our audit provides a reasonable basis for our opinion.
A company’s internal control over financial reporting is a process designed to provide reasonable assuranceregarding the reliability of financial reporting and the preparation of financial statements for external purposesin accordance with generally accepted accounting principles. A company’s internal control over financialreporting includes those policies and procedures that (1) pertain to the maintenance of records that, inreasonable detail, accurately and fairly reflect the transactions and dispositions of the assets of the company;(2) provide reasonable assurance that transactions are recorded as necessary to permit preparation of financialstatements in accordance with generally accepted accounting principles, and that receipts and expenditures ofthe company are being made only in accordance with authorizations of management and directors of thecompany; and (3) provide reasonable assurance regarding prevention or timely detection of unauthorizedacquisition, use, or disposition of the company’s assets that could have a material effect on the financialstatements.
Because of its inherent limitations, internal control over financial reporting may not prevent or detectmisstatements. Also, projections of any evaluation of effectiveness to future periods are subject to the riskthat controls may become inadequate because of changes in conditions, or that the degree of compliance withthe policies or procedures may deteriorate.
In our opinion, Jo-Ann Stores, Inc. maintained, in all material respects, effective internal control overfinancial reporting as of February 2, 2008, based on the COSO criteria.
We also have audited, in accordance with the standards of the Public Company Accounting OversightBoard (United States), the consolidated balance sheets of Jo-Ann Stores, Inc. as of February 2, 2008 andFebruary 3, 2007, and the related consolidated statements of operations, cash flows, and shareholders’ equityfor each of the three years in the period ended February 2, 2008 and our report dated April 5, 2008 expressedan unqualified opinion thereon.
/s/ Ernst & Young LLP
Cleveland, OhioApril 5, 2008
73
Item 9B. Other Information
Upon recommendation of our Corporate Governance Committee, our Board of Directors approved DirectorIndemnification Agreements with each of our non-management directors (Scott Cowen, Joseph DePinto, IraGumberg, Patricia Morrison, Frank Newman, David Perdue, Beryl Raff, Alan Rosskamm and Tracey Travis), whichagreements were entered into on April 14, 2008. The purpose of these agreements is to ensure that each ofour non-management directors receives the maximum indemnification protection permitted under Ohio law.The agreements clarify the procedures to follow if a non-management director is entitled to indemnification,provide for the advancement of legal defense costs, allow the non-management director to recover enforcementcosts if he or she is required to take action to enforce his or her indemnification rights, and obligate us to usecommercially reasonable efforts to maintain D&O insurance coverage generally at a level that is substantiallycomparable in scope and amount to that currently provided. We must maintain this coverage for the durationof the non-management director’s service on our Board of Directors and for at least six years thereafter. Eitherparty may terminate the agreement on 60 days’ notice.
PART III
Item 10. Directors, Executive Officers and Corporate Governance
Information required by this Item 10 as to our directors is incorporated herein by reference to theinformation set forth under the caption “Election of Directors — Nominees and Continuing Directors” in ourdefinitive proxy statement for our 2008 Annual Meeting of Shareholders to be held on June 11, 2008 (the“Proxy Statement”), which is expected to be filed with the Securities and Exchange Commission pursuant toRegulation 14A of the Securities Exchange Act of 1934 within 120 days after the end of our fiscal year.
The information regarding the Audit Committee of our Board of Directors and “audit committee financialexperts” is incorporated herein by reference to the information set forth under the caption “CorporateGovernance and Board Matters — Committees of the Board — Audit Committee” in the Proxy Statement.
Information required by this Item 10 as to our executive officers is included under Item 4 of Part I of thisForm 10-K as permitted by Instruction 3 to Item 401(b) of Regulation S-K. Information required by Item 405of Regulation S-K is incorporated herein by reference to the information set forth under the caption“Section 16(a) Beneficial Ownership Reporting Compliance” in the Proxy Statement.
Our Code of Business Conduct and Ethics (the “Code”) is applicable to our directors, officers (includingour principal executive officer and principal financial officer) and employees. The Code is posted on ourwebsite at www.Joann.com. We intend to disclose on our website any amendment to, or waiver of, anyprovision of the Code that would be required to be disclosed under the rules of the Securities and ExchangeCommission or the New York Stock Exchange.
Item 11. Executive Compensation
The information required by this Item 11 is incorporated herein by reference to the information set forthunder the captions “Director Compensation,” “Executive Compensation,” “Compensation Discussion and Analy-sis” and “Compensation Committee Report” in the Proxy Statement.
Item 12. Security Ownership of Certain Beneficial Owners and Management and Related StockholderMatters
The information required by this Item 12 is incorporated herein by reference to the information set forthunder the captions “Principal Shareholders” and “Equity Compensation Plan Information” in the ProxyStatement.
74

Item 13. Certain Relationships and Related Transactions, and Director Independence
Betty Rosskamm (a member of one of our original founding families and the mother of Alan Rosskamm, acurrent member of the Board of Directors), Alma Zimmerman, (a member of one of our original foundingfamilies and who is now deceased), and the Company are parties to an agreement, dated October 30, 2003, asamended on February 22, 2007, relating to their Jo-Ann Stores common shares. Under this agreement, BettyRosskamm and her lineal descendants and permitted holders (the “Rosskamms”) and Alma Zimmerman and herlineal descendants and permitted holders (the “Zimmermans”) may each sell up to 400,000 common shares inany calendar year and may not sell more than 200,000 of those shares in any 180-day period. If either theRosskamms or Zimmermans plan to sell a number of their respective common shares in excess of the numberpermitted under the agreement, they must first offer to sell those shares to the Company. Each of theRosskamms and the Zimmermans are permitted to sell an unlimited number of shares to each other free of ourright of first refusal.
Additional information required by this Item 13 is incorporated herein by reference to the information setforth under the captions “Certain Relationships and Related Transactions” and “Corporate Governance andBoard Matters — Board Independence” in the Proxy Statement.
Item 14. Principal Accountant Fees and Services
The information required by this Item 14 is incorporated herein by reference to the information set forthunder the captions “Principal Accounting Firm Fees” and “Audit Committee Pre-Approval of Audit and PermittedNon-Audit Services” in the Proxy Statement.
75

PART IV
Item 15. Exhibits and Financial Statement Schedules
(a) The following documents are filed as part of this report:
(1) Financial Statements
The consolidated financial statements filed as part of this Form 10-K are located as set forth in theindex on page 40 of this report.
(2) Financial Statement Schedules
All schedules have been omitted because they are not applicable or the required information isincluded in the consolidated financial statements or notes thereto.
(3) Exhibits
The exhibits listed in the Index to Exhibits, which appears on pages 77 through 79 of this Form 10-K,are filed as part of this Form 10-K.
76

Index to ExhibitsExhibitNumber Exhibit Description
3.1 Amended and Restated Articles of Incorporation of Jo-Ann Stores, Inc.3.2 Amended and Restated Code of Regulations4.1 Indenture between the Company and Jo-Ann Stores Supply Chain Management, Inc., Team Jo-Ann,
Inc., FCA of Ohio, Inc., and House of Fabrics, Inc., as guarantors, and National City Bank, as trustee,relating to the 7.50% Senior Subordinated Notes due 2012, including the form of note (filed asExhibit 4.4 to the Company’s Form 10-K filed with the Commission on April 15, 2004 and incorporatedherein by reference)
4.2 Third Amended and Restated Rights Agreement, dated as of February 26, 2007, by and betweenJo-Ann Stores, Inc. and National City Bank, as Rights Agent (filed as Exhibit 4.1 to the Company’sForm 8-A/A filed with the Commission on March 2, 2007 and incorporated herein by reference)
10.1 Jo-Ann Stores, Inc. Supplemental Retirement Benefit Plan, as amended (filed as Exhibit 10.3 to theCompany’s Form 10-Q filed with the Commission on December 13, 2007 and incorporated herein byreference)*
10.2 Schedule to Jo-Ann Stores, Inc. Supplemental Retirement Benefit Plan, effective as of November 13,2007 (filed as Exhibit 10.4 to the Company’s Form 10-Q filed with the Commission on December 13,2007 and incorporated herein by reference)*
10.3 Employment Agreement dated October 21, 2005 between the Company and Alan Rosskamm (filed asExhibit 10.1 to the Company’s Form 8-K filed with the Commission on October 26, 2005 andincorporated herein by reference)*
10.4 Employment Agreement dated October 21, 2005 between the Company and David Holmberg (filed asExhibit 10.2 to the Company’s Form 8-K filed with the Commission on October 26, 2005 andincorporated herein by reference)*
10.5 Fabri-Centers of America, Inc. 1990 Employees Stock Option and Stock Appreciation Rights Plan, asamended (filed as Exhibit 10.8 to the Company’s Form 10-K filed with the Commission on May 2, 2003and incorporated herein by reference)*
10.6 Jo-Ann Stores, Inc. (formerly Fabri-Centers of America, Inc.) 1998 Incentive Compensation Plan, asamended, dated November 13, 2007 (filed as Exhibit 10.6 to the Company’s Form 10-Q filed with theCommission on December 13, 2007 and incorporated herein by reference)*
10.7 Agreement dated October 30, 2003 among Jo-Ann Stores, Inc., Betty Rosskamm and AlmaZimmerman, a member of one of the Company’s original founding families and who is now deceased(Second Amended and Restated) (filed as Exhibit 10.10 to the Company’s Form 10-K filed with theCommission on April 15, 2004 and incorporated herein by reference)*
10.8 Amendment to the Second Amended and Restated Agreement dated February 22, 2007 among andbetween Jo-Ann Stores, Inc., Betty Rosskamm, and Joan Wittenberg, Sandra Zucker and LarryZimmerman (the successors to Alma Zimmerman, a member of one of the Company’s original foundingfamilies and who is now deceased) (filed as Exhibit 10.8 to the Company’s Form 10-K filed with theCommission on April 19, 2007 and incorporated herein by reference)*
10.9 Credit Agreement dated as of April 24, 2001 among the Company, as borrower, Fleet National Bank, asIssuing Bank, Fleet Retail Finance Inc., as Administrative Agent and Collateral Agent, CongressFinancial Corporation, as Documentation Agent, GMAC Commercial Credit, LLC, National CityCommercial Finance, Inc. and The CIT Group/Business Credit, Inc., as Co-Agents, and Fleet SecuritiesInc., as Arranger and Syndication Agent (filed as Exhibit 10.9 to the Company’s Form 10-K filed withthe Commission on April 19, 2007 and incorporated herein by reference)
10.10 First Amendment to Credit Agreement dated as of April 24, 2001 (filed as Exhibit 10.10 to theCompany’s Form 10-K filed with the Commission on April 19, 2007 and incorporated herein byreference)
10.11 Second Amendment to Credit Agreement dated as of March 17, 2003 (filed as Exhibit 10.13 to theCompany’s Form 10-K filed with the Commission on April 15, 2004 and incorporated herein byreference)
77

ExhibitNumber Exhibit Description
10.12 Third Amendment to Credit Agreement dated as of February 18, 2004 (filed as Exhibit 10.14 to theCompany’s Form 10-K filed with the Commission on April 15, 2004 and incorporated herein byreference)
10.13 Fourth Amendment to Credit Agreement dated April 16, 2004 (filed as Exhibit 10.15 to the Company’sForm S-4 filed with the Commission on May 24, 2004 and incorporated herein by reference)
10.14 Fifth Amendment to Credit Agreement dated February 23, 2006 (filed as Exhibit 10.14 to theCompany’s Form 10-K filed with the Commission on April 13, 2006 and incorporated herein byreference)
10.15 Sixth Amendment to Credit Agreement dated November 5, 2007 (filed as Exhibit 10.1 to theCompany’s Form 10-Q filed with the Commission on December 13, 2007 and incorporated herein byreference)
10.16 Jo-Ann Stores, Inc. Deferred Compensation Plan, as amended on January 30, 2008*10.17 Fabri-Centers of America, Inc. Executive Incentive Plan (filed as Exhibit 11 to the Company’s
Form 10-K filed with the Commission on May 2, 2003 and incorporated herein by reference)*10.18 Fabri-Centers of America, Inc. 1996 Stock Option Plan for Non-Employee Directors (filed as
Exhibit 10.16 to the Company’s Form 10-K filed with the Commission on April 19, 2007 andincorporated herein by reference)*
10.19 Form of Restricted Stock Award Agreement of the Company (filed as Exhibit 10.1 to the Company’sForm 8-K filed with the Commission on November 23, 2005 and incorporated herein by reference)*
10.20 Form of Notice of Grant of Non-Qualified Stock Option (filed as Exhibit 10.2 to the Registrant’sForm 8-K filed with the Commission on November 23, 2005 and incorporated herein by reference)*
10.21 Letter Agreement entered into on November 22, 2005 between the Registrant and David Bolenregarding Mr. Bolen’s departure from the Company (filed as Exhibit 10.21 to the Registrant’s Form 10-Kfiled with the Commission on April 13, 2006 and incorporated herein by reference)*
10.22 Letter Agreement entered into on November 23, 2005 between the Registrant and David Holmbergregarding Mr. Holmberg’s employment with the Company (filed as Exhibit 10.22 to the Registrant’sForm 10-K filed with the Commission on April 13, 2006 and incorporated herein by reference)*
10.23 Letter Agreement entered into on February 28, 2006 between the Registrant and Alan Rosskammregarding Mr. Rosskamm’s cessation of the Chairman, President and Chief Executive Officer positionsupon the assumption of those roles by another individual (filed as Exhibit 10.23 to the Registrant’sForm 10-K filed with the Commission on April 13, 2006 and incorporated herein by reference)*
10.24 Letter Agreement entered into on June 29, 2006 between the Company and Darrell Webb regardingMr. Webb’s employment with the Company (filed as Exhibit 10.1 to the Registrant’s Form 10-Q filedwith the Commission on September 7, 2006 and incorporated herein by reference)*
10.25 Amended Employment Agreement dated February 19, 2008 between the Company and Darrell Webb*10.26 Letter Agreement entered into on July 10, 2006 between the Company and Travis Smith regarding
Mr. Smith’s employment with the Company (filed as Exhibit 10.3 to the Registrant’s Form 10-Q filedwith the Commission on September 7, 2006 and incorporated herein by reference)*
10.27 Amended Employment Agreement dated February 19, 2008 between the Company and Travis Smith*10.28 Letter Agreement entered into on July 27, 2006 between the Company and James Kerr regarding
Mr. Kerr’s employment with the Company (filed as Exhibit 10.5 to the Registrant’s Form 10-Q filedwith the Commission on September 7, 2006 and incorporated herein by reference)*
10.29 Amended Employment Agreement dated February 19, 2008 between the Company and James Kerr*10.30 Split Dollar Insurance Agreement dated July 27, 2006 between the Company and James Kerr (filed as
Exhibit 10.7 to the Registrant’s Form 10-Q filed with the Commission on September 7, 2006 andincorporated herein by reference)*
10.31 Split Dollar Insurance Agreement dated July 28, 2006 between the Company and David Holmberg(filed as Exhibit 10.8 to the Registrant’s Form 10-Q filed with the Commission on September 7, 2006and incorporated herein by reference)*
78

ExhibitNumber Exhibit Description
10.32 Lease Agreement, dated as of October 19, 2006, between BPVisalia LLC, as Landlord, and Jo-AnnStores Supply Chain Management, Inc., as Tenant (incorporated by reference to Exhibit 10.1 ofForm 8-K, filed with the Securities and Exchange Commission on October 25, 2006)
10.33 Split Dollar Insurance Agreement dated August 14, 2007 between the Company and Darrell Webb (filedas Exhibit 10.1 to the Registrant’s Form 8-K filed with the Commission on August 20, 2007 andincorporated herein by reference)*
10.34 Split Dollar Insurance Agreement dated August 14, 2007 between the Company and Travis Smith (filedas Exhibit 10.2 to the Registrant’s Form 8-K filed with the Commission on August 20, 2007 andincorporated herein by reference)*
10.35 Letter Agreement entered into on September 12, 2007 between the Company and David Holmbergregarding the termination of Mr. Holmberg’s employment with the Company (filed as Exhibit 10.5 tothe Registrant’s Form 10-Q filed with the Commission on December 13, 2007 and incorporated hereinby reference)*
10.36 Employment Agreement dated November 19, 2007 between the Company and Kenneth Haverkost (filedas Exhibit 10.2 to the Registrant’s Form 10-Q filed with the Commission on December 13, 2007 andincorporated herein by reference)*
10.37 Form of Director Indemnification Agreements21 Subsidiaries of Jo-Ann Stores, Inc.23 Consent of Ernst & Young LLP, Independent Auditors24 Power of Attorney31.1 Section 302 Certification By Chief Executive Officer31.2 Section 302 Certification By Chief Financial Officer32.1 Section 906 Certification of Principal Executive Officer and Principal Financial Officer
* Indicates a management contract or compensatory plan or arrangement
79
SIGNATURES
Pursuant to the requirements of Section 13 or 15(d) of the Securities Exchange Act of 1934, the Registranthas duly caused this report to be signed on its behalf by the undersigned, thereunto duly authorized.
JO-ANN STORES, INC.
April 17, 2008By: /s/ DARRELL WEBB
Darrell WebbPresident and Chief Executive Officer
Pursuant to the requirements of the Securities Exchange Act of 1934, this report has been signed belowby the following persons on behalf of the Registrant and in the capacities and on the dates indicated:
Signature Title
/s/ DARRELL WEBB
Darrell WebbChairman of the Board, President,Chief Executive Officer and Director(Principal Executive Officer)
/s/ JAMES KERR
James KerrExecutive Vice President and Chief Financial Officer(Principal Financial and Accounting Officer)
/s/ SCOTT COWEN*Scott Cowen
Director
/s/ IRA GUMBERG*Ira Gumberg
Director
/s/ PATRICIA MORRISON*Patricia Morrison
Director
/s/ FRANK NEWMAN*Frank Newman
Director
/s/ BERYL RAFF*Beryl Raff
Director
/s/ ALAN ROSSKAMM*Alan Rosskamm
Director
/s/ TRACEY TRAVIS*Tracey Travis
Director
*The undersigned, by signing his name hereto, does hereby sign this Form 10-K Annual Report on behalfof the above-named directors of Jo-Ann Stores, Inc., pursuant to powers of attorney executed on behalf ofeach of such directors.
April 17, 2008By: /s/ JAMES KERR
James Kerr, Attorney-in-Fact
NOTE: The Company did not request Mr. DePinto and Mr. Perdue to sign since they were elected to the Boardsubsequent to the conclusion of the fiscal year to which this Form 10-K relates.
80