investor day 11 15 v3 - iis windows...
TRANSCRIPT

1
VistaPrint © 2007 1
Investor Day
November 15, 2007
2
Safe HarborThis presentation contains information about future expectations, plans and prospects of our management that constitute forward-looking statements for purposes of the safe harbor provisions under The Private Securities Litigation Reform Act of 1995, including, but not limited to, statements concerning the expected growth and development of our business including financial guidance, operating performance, our margins, our market position, investments made or to be made in our business, and our ability to successfully attract and retain customers. Actual results may differ materially from those indicated by these forward-looking statements as a result of various important factors including, but not limited to, our ability to attract customers and to retain customers and to do so in a cost-effective manner, willingness of purchasers of graphic design services and printed products to shop online, failure of our investments, unexpected increases in our use of funds, failure to increase our revenue and keep our expenses consistent with revenues, failures of our web sites or network infrastructure, failure to maintain the prices we charge for our products and services, the inability of our manufacturing operations to meet customer demand, and other factors that are discussed in our Form 10-K for the year-ended June 30, 2007, our Form 10-Q for the quarter-ended September 30, 2007, and other documents periodically filed with the SEC.
In addition, the statements in this presentation represent our expectations and beliefs as of the date of this presentation. We anticipate that subsequent events and developments may cause these expectations and beliefs to change. We specifically disclaim any obligation to update any forward-looking statements. These forward-looking statements should not be relied upon as representing our expectations or beliefs as of any date subsequent to the date of this presentation.

2
3
Agenda
Robert S. Keane President, CEO and ChairmanTrynka Shineman SVP North American Marketing
Mike Ewing SVP Global Partnerships
Wendy Cebula EVP & Chief Operating Officer
Harpreet Grewal EVP & Chief Financial Officer
Q&A
VistaPrint © 2007 4
Robert S. Keane
President, CEO and Chairman

3
5
Small Office and Home Office (SOHO) Businesses
6
SOHO Businesses are Very Small Businesses
Source: US SBA
Non employer
1 to 4 FTEs
5 to 9 FTEs
Part time only3%

4
7
But there are a Lot of SOHOs
Canada
US
EU
~50 Million SOHOs in Europe and North America
Sources: European Commission Observatory of European SMEs,US Census Bureau, Statistics Canada, Eurostat and VistaPrint estimates
8
Our Vision

5
9
10
Expanding Value Proposition
“VistaPrint lowered our printing costs…”
Anita Mo, Graphic Designer
“I mailed them and got orders…”
Lisa Rhodes, OwnerHome based business

6
11
Business Model
• Produce in volume
• Sell in small quantities
• Broadly applicable
VistaPrint
Volume
Cost per Unit
Low Volume Markets
High VolumeMarkets
12
Fiscal Year Revenues*
$360 -$380
$5 $17$35
$59
$256
$152
$91
'01 '02 '03 '04 '05 '06 '07 '08Guidance
*Millions, FYE June

7
13
Guidance
Net Profit* Growth$51 - $55
$27
$19
$5$3
'01 '02 '03 '04 '05 '06 '07 '08
* Millions, FYE June, excluding SBC and contract termination
14
Helping Small Business Market Their Business
Presentation Folders
Letterhead
Envelopes
Postcards
Note Pads
T-Shirts
Rubber Stamps
Logo design
Checksvia partnershipMailing services Sticky Notes
Business Cards
Pens
CreativeServices
From the desk ofTiffany Hanson

8
15
Proprietary Capabilities
Direct Marketing • Customer acquisition
• Over 300k / month at low cost per customer• Sophisticated testing systems and analytically-driven culture
Software and Network Operations• Seamless software integration of all aspects of the business
• Extensive internal development teams and proprietary technology
Computer Integrated Manufacturing • Automated workflow and production environment
• >26,000 custom-designed, custom-produced orders per day
16
Volume
ValueRepeat
• Marketing capabilities and economics• Proprietary software• Engineering, automation• High-volume production & service• Channel and geographic reach
Increased profitper customer• Cross-selling• Up-selling• Repeat-purchases• Brand equity
• Content & format breadth• Low costs• Service levels

9
17
Volume: Average Orders Processed Per Day*
5 6 79 9 9
1214 15 16
1821 22
26
Q4 Q1FY 05
Q2 Q3 Q4 Q1FY 06
Q2 Q3 Q4 Q1FY 07
Q2 Q3 Q4 Q1 FY08
* Thousands, FYE June
18
Volume: Non-US Order Growth
Q1 '03 Q1 '04 Q1 '05 Q1 '06 Q1 '07 Q1 '08
Other non-US
Top 4 non-US (France, Germany, Netherlands, & UK)

10
19
Volume: Unique Customers Purchasing Per Fiscal Year*
0.4
1.01.3
1.62.0
4.1
2.7
'01 '02 '03 '04 '05 '06 '07
* Millions, FYE June
20
Value: Amanda Murphy, SOHO Customer
VistaPrint makes it easy to get great looking materials that I can afford.
“1,000 Datasheets $243.49
1,000 Postcards $74.99
5,000 Business Cards $94.97
420 Return Address Labels $19.99
200 Thank You Cards $54.73
Total $488.17
”

11
21
Repeat: Average Revenue per Customer Purchasing in the Fiscal Year*
$12$17
$27
$36
$44
$53$58
'01 '02 '03 '04 '05 '06 '07
* Excluding Referral Fees, FYE June
22
Repeat Customer Revenues*
$10$12
$15 $16 $17$22
$26$28
$32
$41$44 $45
$51
Q1FY'05
Q2 Q3 Q4 Q1FY'06
Q2 Q3 Q4 Q1FY'07
Q2 Q3 Q4 Q1FY'08
* Millions, Excluding Referral Fees

12
23
Land Grab
• Volume: expand market share lead– Acquire as many customers as possible
– Build management and systems infrastructure to scale
• Value: improve customer value proposition– Reduce unit production costs and share savings with customers
• Repeat: raise per-customer revenue– More products, services, and content at higher service levels
• Meet our EPS commitments, then reinvest excess
24
Broad and Deep Leadership Team
Over 25 executives at Vice President and above levels• Average over 20 years of experience
Highly sophisticated technologists and manufacturing experts• 150 degreed engineers
Direct marketing talent: analytics, creative, media placement
Comparable expertise in HR, Finance and other functions
Continuously recruiting experts from large-scale companies

13
25
Agenda
Robert S. Keane President, CEO and Chairman
Trynka Shineman SVP North American MarketingMike Ewing SVP Global Partnerships
Wendy Cebula EVP & Chief Operating Officer
Harpreet Grewal EVP & Chief Financial Officer
Q&A
26
Trynka Shineman
SVP North American Marketing Marketing Techniques and New Product Introductions

14
27
Small Businesses Want to Look Like Big Businesses
Ken and Marge GaragiolaManaging Partner and AdministratorCentury 4 Retail Advisors, LLCEgg Harbor Township, New Jersey
We went to VistaPrint We went to VistaPrint for our brand identity.for our brand identity.“ ”
2828
Compelling Value with First Time Profitability
AOV of new Free Business Card orders is over $17• All pay shipping and processing fees
• A third take an additional product
• Many pay an $9.99 customization fee
• Some select other upgrades Plus – over 2 Billion impressions including the VistaPrint brand and message

15
29
New Customer Acquisitions*
329 351 352388 399 407
450528 564
603687
800850
975
Q4 Q1FY'05
Q2 Q3 Q4 Q1FY'06
Q2 Q3 Q4 Q1FY'07
Q2 Q3 Q4 Q1FY'08
*Approximate number of new customers acquired per quarter, in thousands
30
New Visitors’ Home Page
• Highlight lead acquisition offer showing compelling value
• Maximize conversion rate of first time visitors
• Product & service awareness
• Merchandising
• User consistency and ease

16
31
Returning Visitor Home Page
• Maximize value of return visits
• Easy to resume a design in progress and complete it
• Increase revenue per customer by cross-selling matching items
• Provide easy access to post-purchase information such as shipping dates, prior order quantities, addresses, etc.
32
Automated Graphic Design & Cross Selling

17
3333
Website Improvements Raise Session Productivity
Idea database
Analytic tools
Customer research
Competitive research
Employees
Prioritize &
Build
>50 split-run tests per release
Rollout
Each release improves conversion and cross selling efficiency
34Company Confidential – VistaPrint © 2007 34
Direct Marketing at VistaPrint
Rigorous, repeated, and relentless testing
Test • Analyze every program’s results against control group and/or
hypothesis• Robust channel, offer, and website testing reduces risk, raises
efficiency, and visibility into our businessInvest
• Apply lessons learned• Quickly scale positive results to maximize growth, shareholder value,
and competitive advantage• Increase spending in most profitable programs, no fixed ‘budget’

18
35
New Channels Accelerate Customer Acquisition
36
Channel Optimization Improves Performance
First page competition are postcard-focused companies.
First page competition are postcard-focused companies.

19
37
Expansion Broadens ReachAustralia
Belgium
Denmark
Europe
France
Germany
Ireland
Japan
Italy
Netherlands
New Zealand
Norway
Germany
Poland
Spain
Switzerland
Sweden
United Kingdom
38
Catalogs Increase Life Time Value

20
39
One to One Targeting Improves Response
4040
Trial Offers Drive Product Adoption

21
41
New Products
42
SOHO Marketing Spending Survey
Business Cards
Brochures, Flyers
Letterhead, Envelopes
Holiday Cards
Mailing Services
Website Design
Search Marketing
Online Directories
Email Marketing
Promotional Gifts
Custom Printed Apparel
Signage

22
43
Diversifying Product Mix
FY’03 FY’07
T-ShirtSticky Notes
EnvelopesNotepads
Business Card HoldersRubber Stamps
Business Cards
Postcards
Consumer Products
Magnets
Other
Brochures
RAL
Letterhead
Business Cards
Postcards
Consumer ProductsOther
Brochures
RAL Letterhead
44
New Product Testing Criteria
CompetitiveLandscape
Cross Selling
Customer Demand
CompetitiveAdvantage
New Products

23
45
New Product Demand Rankings
46
Competitive Advantage Matrix
Quantity Content X-selling Price Patents Back-End Attributes/Quality
Product K
Product A
Product B
Product C
Product D
Product E
Product F
Product G
Product H
Product I
Product J

24
4711/15/2007 47
New Product: Pens
• Custom pen has high perceived value
• Leverage power of matching content full color printing
• Production technology margins improve with volume
4848
New Product: T-Shirts
• Leverage power of matching content full color printing
• Scale and engineering improve manufacturing productivity
• Digital printing enables small quantities, often as few as 1

25
49
Going Forward, More of the Same
Sell better• Multiple site improvements
Know our customers better• More split run testing
• More segmentation and differentiation
Continue to accelerate new customer acquisition• Better European targeting
• New channels: direct mail and telemarketing
• New product introductions
50
Agenda
Robert S. Keane President, CEO and Chairman
Trynka Shineman SVP North American Marketing
Mike Ewing SVP Global PartnershipsWendy Cebula EVP & Chief Operating Officer
Harpreet Grewal EVP & Chief Financial Officer
Q&A

26
51
Mike Ewing
SVP Global Partnerships
Partnerships
52
3 Types of PartnershipGlobal Partnerships
Expand Distribution Channels
Wholesale Retail
Business Solutions
Expand Scope of Product and
Services
Advertising
Referral Partners
StrategicPartnerships
27
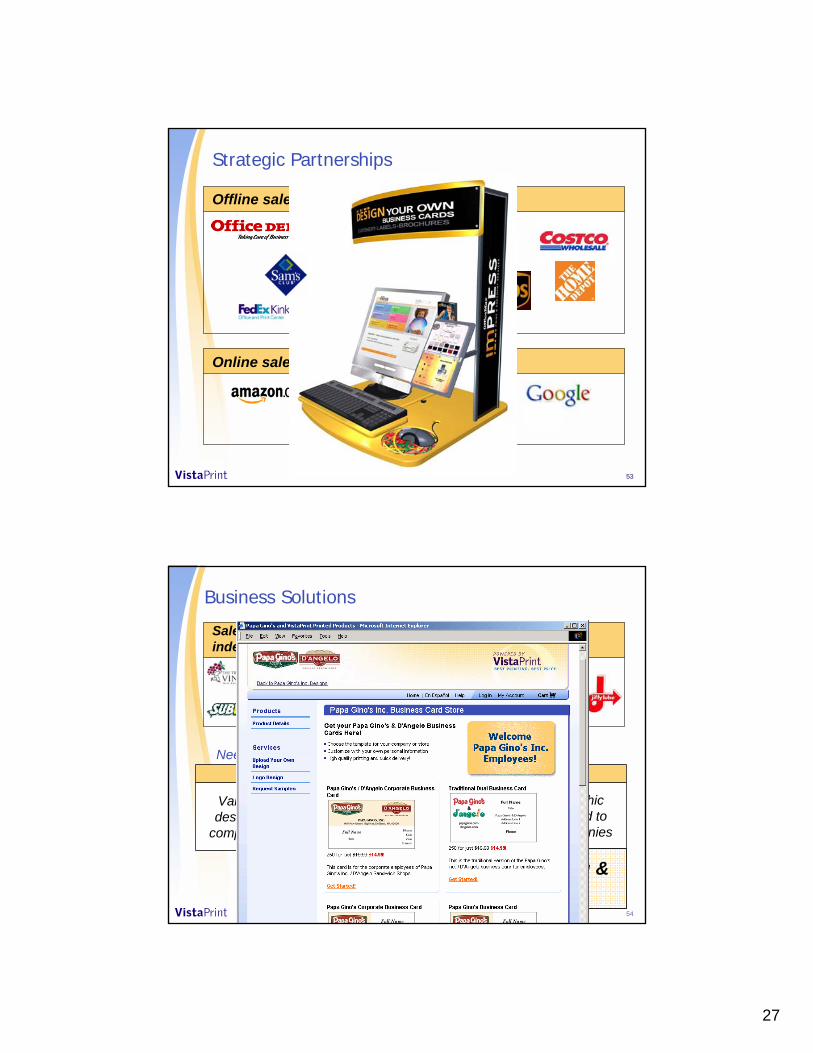
5353
Strategic Partnerships
Offline sales targets, illustrative
Online sales targets, illustrative
54
Business Solutions
Value, sophisticated graphic design, convenience, need to
compete with larger companies
Distributed billing &Brand integrity
Business Solutions
Value, sophisticated graphic design, convenience, need to
compete with larger companies
SOHO
Sales Targets: franchises, independent sales channels, independent distributors. Illustrative list:
Needs

28
55
Referral Partners
SOHO Marketing Services
SOHO Operational Services
Other Products and Services
56
Referral Partners: In Context Marketing

29
57
Expanding Scope
Marketing Software Serviceoperations Production
Referral Partners
Channel Partners
Referral Partners
Channel Partners
VistaPrint
58
Summary of Partnerships at VistaPrint
Investing ahead of the curve
Substantial opportunity
Good economics
Technology enabled…

30
59
Agenda
Robert S. Keane President, CEO and Chairman
Trynka Shineman SVP North American Marketing
Mike Ewing SVP Global Partnerships
Wendy Cebula EVP & Chief Operating OfficerHarpreet Grewal EVP & Chief Financial Officer
Q&A
60
Wendy Cebula
EVP and COO
Technology and Manufacturing Review

31
61
Technology and Manufacturing Team: Recent Leadership Recruiting Success
• Chief SW Architect: Former chief SW architect at Fidelity Investments
• SVP Cap Dev: Former CIO, Sapient
• SVP Manufacturing Engineering: Former CTO, $1 billion automationengineering and equipment firm
• VP Generate Demand: Former VP at Trilogy Software
• Director of Operations, Windsor: 15+ years of manufacturing leadership at Kodak
• Plant Director, Windsor: 20+ years of manufacturing experience in Toyota Production System for tier-1 auto supplier
62
Technology Supports Our Virtuous Cycle
Volume
ValueRepeat
• Proprietary software• Engineering, integration• Automation• Utilization and customization
• Test & invest• New products• New channels • New geographies• Brand strength
• Low prices, high quality• Reliability, satisfaction• Trust

32
63
Technology Enables Our Business
Generate Demand• Marketing and Global Partnerships, New Products, Modular Graphic Design
Fulfill Demand• Manufacturing, Service Center Operations, Scheduling, Logistics
Support the Business• Finance, HR, Intellectual Property
Technology Operations• Network Operations, Internal Support
Automated orderaggregation& cost optimization
High-volume computer integrated manufacturing
Software-driven order assembly& package addressing
Cost and speed optimized order shipment
Interactive customer service & graphic design help
Customer designs, reviews & orders online
Decision support systems, testing architecture
64
Split-Runs Drive Marketing Efficiency
High volume of sessions creates statistically significant results within hours, not weeks

33
65
Generate Demand: VistaStudio
66
Modular Graphics Enable Automated Cross-Selling and New Product Generation
From the desk ofTiffany Hanson
Post CardPost Card

34
67
CustomerCustomer
Generate Demand: Graphic Design Assistance
Internet
VistaPrint DesignVistaPrint Design& Service Center& Service Center
68
Generate Demand: Business Solutions Micro-Sites

35
69
Generate Demand: Strategic Partnerships
70
Fulfill Demand: Complex Scheduling Algorithms Drive Production Efficiency

36
71
Support The Business: Intellectual Property
13 Issued US Patents• 5 relate to Generating Demand
• Computerized pre-press
• Modular graphic-design
• Dynamic document editing in a browser
• 8 relate to Fulfilling Demand• Ganging and managing print jobs
• Consistency between printed products and product images viewed by users
More than 40 patents pending
72

37
73
74

38
75
76
Manufacturing Summary
>26,000 custom orders per day, on average
Highly automated, efficient front-end
Much more than presses
Ongoing capacity increases
• Venlo:• Phase A Jan. 2004
• Phase B April 2006
• Phase C Jan. 2008
• Windsor: • Phase A Sept. 2005
• Phase B Oct. 2006
• Phase C…

39
77
Schematic Diagram of Windsor
MultiMulti--Part Part OrderOrder
BinningBinning
ShippingShipping
Conveyor beltConveyor belt
OffsetOffsetPressPressCellCell
OffsetOffsetPressPressCellCell
OffsetOffsetPressPressCellCell
OtherOtherCellCell
DigitalDigitalPressPressCellCell
DigitalDigitalPressPressCellCell
78
Manufacturing FacilitiesWindsor Venlo

40
79
Windsor press
80
Venlo Press

41
81
Venlo Interior
82
Line of Digital Presses

42
83
Technology Summary
Strong leadership team
Technology-enabled business
Volume and proprietary software enable cost advantages
Highly visible data enable fact & analytics-based decisions
84
Agenda
Robert S. Keane President, CEO and Chairman
Trynka Shineman SVP North American Marketing
Mike Ewing SVP Global Partnerships
Wendy Cebula EVP & Chief Operating Officer
Harpreet Grewal EVP & Chief Financial OfficerQ&A

43
85
Harpreet Grewal
EVP and CFO
Financial Review
86
Financial Overview
Solid and consistent execution• Quarterly revenue, non-GAAP net income and EPS, repeat customer
revenues, non-US revenue growth, cash flow, customer acquisition costs, operating and free cash flow
Cadence and predictability of our business• Quarterly and Trailing Twelve Month (TTM) results
Financial strategy to build a transformational company• Invest for the future while delivering on stated EPS targets

44
87
$36.4$41.6
$45.3$50.0
$64.0$69.3 $72.5
$79.5
Q2 '06 Q3 Q4 Q1 '07 Q2 Q3 Q4 Q1 '08
Non-US
US
Solid Execution: High Revenue Growth*
* $, millions
88
$5.8
$7.2 $7.2 $7.3
$10.0$9.3 $9.3
$9.9
Q2 '06 Q3 Q4 Q1 '07 Q2 Q3 Q4 Q1 '08
Solid Execution: Non-GAAP Net Income* Growth
* Excludes SBC, $, millions

45
89
$0.21$0.20$0.20
$0.22
$0.16$0.16$0.16
$0.13
Q2 '06 Q3 Q4 Q1 '07 Q2 Q3 Q4 Q1 '08
Solid Execution: Non-GAAP EPS* Growth
* Excludes SBC and other adjustments, see reconciliation in the appendix
90
64%63%63%64%64%63%63%61%
Q2 Q3 Q4 Q1 '07 Q2 Q3 Q4 Q1 '08
Solid Execution: High Repeat Customer Bookings
46
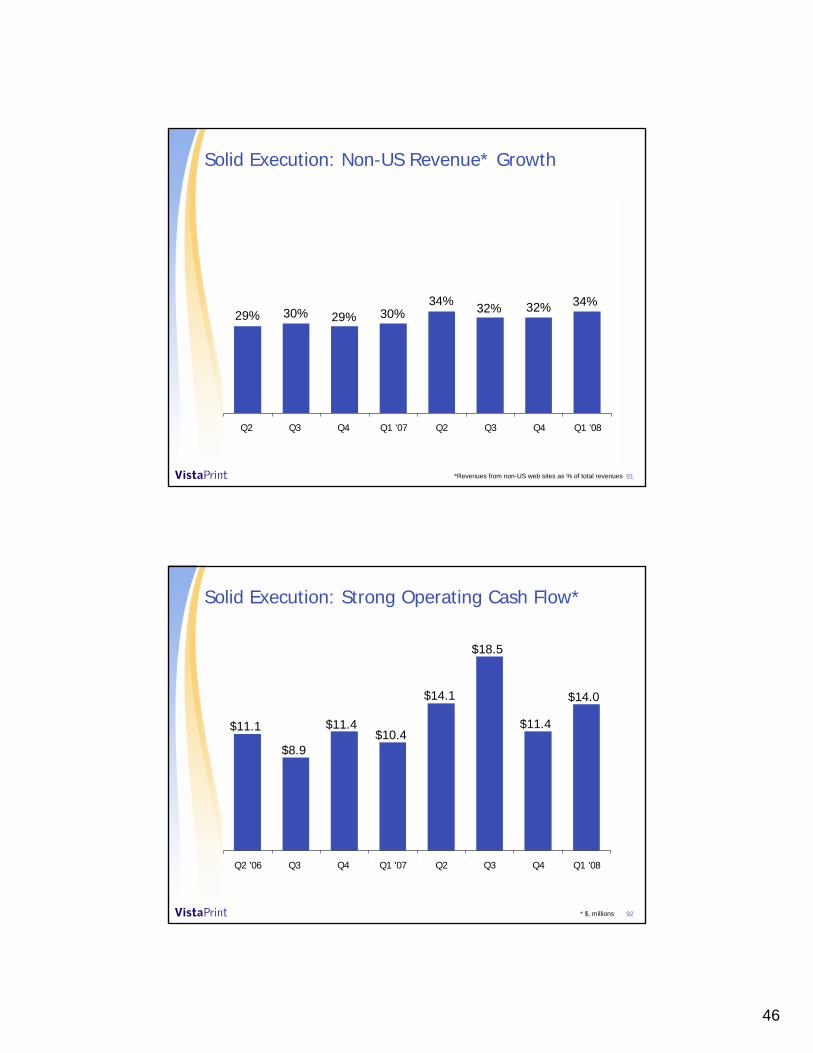
91
34%32%32%34%30%29%30%29%
Q2 Q3 Q4 Q1 '07 Q2 Q3 Q4 Q1 '08
Solid Execution: Non-US Revenue* Growth
*Revenues from non-US web sites as % of total revenues
92
$14.0
$11.4
$18.5
$14.1
$10.4$11.4
$8.9
$11.1
Q2 '06 Q3 Q4 Q1 '07 Q2 Q3 Q4 Q1 '08
Solid Execution: Strong Operating Cash Flow*
* $, millions

47
93
(3.6)
(7.8)
2.9
(3.4)(4.5)
1.51.0
5.1
Q2 '06 Q3 Q4 Q1 '07 Q2 Q3 Q4 Q1 '08
Solid Execution: Free Cash Flow*
* $, millions
94
Strong Balance Sheet: $104.5 Million in Cash*
$2.7 $4.0$9.2
$34.6
$54.3
$14.3
FY '02 FY '03 FY '04 FY '05 FY '06 FY '07
* As of September 30, 2007** $, millions, excluding FY ’05 contract termination charge
Cash Flow from Operations**

48
95
Cadence of our Business: Quarterly & TTMRevenue* and Q2 Guidance**
$117.2$133.7
$152.1
$173.3
$200.9
$228.7
$255.9
$285.4
$313-319
Q2FY'06
Q3 Q4 Q1FY'07
Q2 Q3 Q4 Q1FY'08
Q2**
TTMQuarterly
$36.4$41.6
$45.3$50.0
$64.0$69.3
$72.5
$79.5
$92-98
Q2FY'06
Q3 Q4 Q1FY'07
Q2 Q3 Q4 Q1FY'08
Q2**
$, millions** Guidance as of October 25, 2007
2007 TTM y/y growth range: 65-71%2007 quarterly y/y growth range: 59-76%
96
Cadence of our Business: Quarterly & TTM non-GAAP Net Income* & Guidance**
$5.8
$7.2 $7.2 $7.3
$10.0$9.3 $9.3
$9.9
$12.6-14.4
Q2FY'06
Q3 Q4 Q1FY'07
Q2 Q3 Q4 Q1FY'08
Q2**
$, millions** Guidance as of October 25, 2007
$12.8
$17.8
$23.1
$27.5
$31.7$33.9
$35.9
$38.5
$41-43
Q2FY'06
Q3 Q4 Q1FY'07
Q2 Q3 Q4 Q1FY'08
Q2**
TTMQuarterly
Steady sequential increasesStep function and plateaus

49
97
Financial strategy
Three pronged financial strategy• Grow as fast as we can for as long as we can to leverage large
market opportunity• Deliver against strong but fixed net profit and EPS growth objectives• Re-invest additional earning potential back into business to gain
market share and scale-based advantages
Disciplined and analytically-driven investment decisions• Returns (ROIC) remain far in excess of hurdle rate
When growth slows, margins can expand• Leverage from lower expenses relating to marketing, product and
software development, and G&A along with higher capacity utilization enables additional EPS growth
98
FY ’07: Reinvest Excess Earnings
$0.65
$0.70
$0.75
$0.80
$0.85
$0.75
$0.71
Prior guidance as of 10/23/06
$0.84
$0.78
Post Q2 potential run rate range
($0.06)
Select incremental discretionary 2H
investments (manufacturing & org. architecture)
$0.78
Year-end results (07/31/07)
170 bpoperating
margin impact in 2H FY ‘07

50
99
Closing Financial Remarks
Large market opportunity
Consistently strong and predictable financial performance
Building a disruptive, industry-changing business institution
Three pronged financial strategy in support of vision
100
Agenda
Robert S. Keane President, CEO and Chairman
Trynka Shineman SVP North American Marketing
Mike Ewing SVP Global Partnerships
Wendy Cebula EVP & Chief Operating Officer
Harpreet Grewal EVP & Chief Financial Officer
Q&A

51
101
Q&A
Investor Day
November 15, 2007
102
Appendix A

52
103
Financial Guidance
Revenue $92 - $98 mm
Growth over FY ’07 period 42% - 53%
Gross Margins n/a3
GAAP EPS $0.19 - $0.23
Non-GAAP EPS2 $0.27 - $0.31
Cap ex (% of revenue guidance) 17% – 20%
Notes:1. As of October 25, 2007.
2. Q2 FY ’08 non-GAAP results exclude an estimated $3.7 million of share based compensation expense. 2008 full fiscal year non-GAAP results exclude an estimated $15.5 million of share based compensation expense.
3. As announced on July 31, 2007, VistaPrint no longer provides quarterly gross margin guidance.
FY’08 Q2 ending 12/31/07
$360 - $380 mm
41% - 48%
63% - 67%
$0.78 - $0.86
$1.10 - $1.18
15% - 20%
FY ‘08 ending 6/30/08
1
104
7%11% 11%
11%5%
1%
7%
3%1%
2%
2%2%
3%
2%
3%
12%
0%
10%
20%
30%
FY 2004 FY 2005 FY 2006 FY 2007 FY 2008 Guidance
Other
Post-PressAutomation
New Products
Land
Facilities
Off-set & DigitalPresses
July 31st Guidance: Cap-Ex to Revenue
23%20%
16%
Total capital expenditures (million)$25$13 $19
Capi
tal e
xpen
ditu
res
as
a %
of
reve
nue
25%
$63 $55 to $75
15% to 20%

53
105
$14
44.6
10.212.2
13.6 14.315.6 15.8
18.620.2
27.8
25.327.3 27.1
34.3
34.934.9
$0
$5
$10
$15
$20
$25
$30
$35
$40
$45
Q2'04
Q3'04
Q4'04
Q1'05
Q2'05
Q3'05
Q4'05
Q1'06
Q2'06
Q3'06
Q4'06
Q1'07
Q2'07
Q3'07
Q4'07
Q1'08
1.0%
2.0%
3.0%
4.0%
5.0%
6.0%Sessions (million)Average order value (AOV)Conversion Rate
$16 $17 $18$25$21
$29$27
$36
$42$45
$50
$64
$69$73
Revenues, Sessions, Conversion & AOV
Revenues ($ million)
$80
106
Appendix B
Including a Reconciliation of GAAP to Non-GAAP Financial Measures

54
107
About non-GAAP financial measures
To supplement VistaPrint’s consolidated financial statements presented in accordance with GAAP, VistaPrint uses the following measures defined as non-GAAP financial measures by the SEC: non-GAAP adjusted net income and non-GAAP adjusted earnings per share. The presentation of this financial information is not intended to be considered in isolation or as a substitute for the financial information prepared and presented in accordance with GAAP. For more information on these non-GAAP financial measures, please see the slides captioned "Reconciliation GAAP to Non-GAAP Results” included at the end of this presentation.
VistaPrint’s management believes that these non-GAAP financial measures provide meaningful supplemental information regarding our performance by excluding certain expenses that may not be indicative of our core business operating results. VistaPrint believes that both management and investors benefit from referring to these non-GAAP financial measures in assessing VistaPrint’s performance and when planning, forecasting and analyzing future periods. These non-GAAP financial measures also facilitate management's internal comparisons to VistaPrint’s historical performance and our competitors' operating results. VistaPrint believes these non-GAAP financial measures are useful to investors in allowing for greater transparency with respect to supplemental information used by management in its financial and operational decision making. Management uses these supplemental measures to evaluate performance period over period and to analyze the underlying trends in the Company's business and to establish operational goals and forecasts that are used in allocating resources.
VistaPrint expects to compute its non-GAAP financial measures using the same consistent method from quarter to quarter and year to year. The accompanying table has more details on the GAAP financial measures that are most directly comparable to non-GAAP financial measures and the related reconciliation between these financial measures. The items excluded from the non-GAAP measurements for fiscal year 2007 and the first quarter of fiscal year 2008 are share based compensation expense and; for the fourth quarter and full fiscal year 2006 are share based compensation expense and tax accrual adjustments related to prior years’ tax settlement; and, for fiscal year 2005, a loss on a contract termination recorded in fiscal year 2005 is excluded.
(Continued on next slide)
108
About non-GAAP financial measurescontinued…
Share-based compensation expenseVistaPrint adopted SFAS 123(R) Share-Based Payments on July 1, 2005 and began expensing the fair value of share option grants issued to employees and directors. Prior to that date, the Company had accounted for share option grants under the provisions of APB No. 25, Accounting for Stock Issued to Employees, and therefore had not recorded any compensation related to such grants. Management has excluded share based compensation from the non-GAAP measurements for fiscal years 2006 and 2007 to facilitate comparison and analysis to historical performance and our competitors’ operating results.
Tax accrual adjustments related to prior yearsIn the quarter ending March 31, 2006, VistaPrint reversed excess income tax reserves related to the completion of an Internal Revenue Service audit of a prior fiscal year for its VistaPrint USA, Incorporated subsidiary. In the quarter ending June 30, 2006, VistaPrint reversed excess income tax reserves related to the expiration of a tax audit statute of limitations relating to a prior fiscal year. These reversals were accounted for as discrete events and resulted in income tax benefits during these periods. Management has excluded the impact of these tax accrual adjustments from the non-GAAP measurements for fiscal year 2006 to facilitate comparison and analysis of historical performance and to present a view of the current fiscal year’s effective tax rate that management believes is more consistent with both historical performance and expected future financial results.
Contract Termination LossIn the quarter ended September 30, 2004, the Company recorded a loss of $21 million related to the termination of a supply agreement with its North American print supplier. This loss was the result of a one-time payment made to this supplier that terminated all existing supply agreements in force at that time. Management has excluded the contract termination loss from the non-GAAP measurement to facilitate comparison and analysis to historical and future performance and our competitors’ operating results.
Although management believes that these non-GAAP financial measures are helpful to understanding the Company’s financial performance, to gain a complete picture of all effects on the Company's profit and loss from any and all events, management does (and investors should) rely upon the GAAP statement of operations.

55
109
Reconciliation: GAAP to Non-GAAP Results
Fiscal Year Ending June 2006
$9,280
-
$3,883
$5,397
Q4
$9,920
-
$3,041
$6,879
Q1
Fiscal Year 2008
$9,320
-
$1,935
$7,385
Q3
$10,027
-
$1,715
$8,312
Q2
Fiscal Year Ending June 2007
$7,281
-
$1,233
$6,048
Q1
$5,792
-
$326
$5,466
Q2
$7,193
$(252)
$2,181
$5,264
Q3
$7,246
$(686)
$2,329
$5,603
Q4
Non-GAAPNet-Income
Reversal ofTax Accruals
Share-based Compensation
GAAP Net Income
Net Income – Quarterly($ in thousands)
110
Diluted Earnings Per Share Quarterly
$0.16
$(0.01)
$0.05
$0.12
Q3 FY2006
$0.13
-
$0.00
$0.13
Q2 FY2006
$0.16
-
$0.02
$0.14
Q1 FY2007
$0.16
$(0.01)
$0.05
$0.12
Q4 FY2006
$0.20
-
$0.04
$0.16
Q3 FY2007
$0.22
-
$0.04
$0.18
Q2 FY2007
$0.20
-
$0.08
$0.12
Q4 FY2007
$0.21
-
$0.06
$0.15
Q1 FY2008
Non-GAAPNet-Income
Reversal ofTax Accruals
Share-based Compensation
GAAP Net Income
Reconciliation: GAAP to Non-GAAP Results