cit group inc. - iis windows serverlibrary.corporate-ir.net/.../091505lehmanfsccitgroup.pdfcit group...
TRANSCRIPT
1
CIT Group Inc.
Lehman Financial Services ConferenceSeptember 15, 2005
2
NoticesForward Looking StatementsCertain statements made in these presentations that are not historical facts may constitute "forward-looking" statements under the Private Securities Litigation Reform Act of 1995, including those that are signified by words such as "anticipate", "believe", "expect", "estimate", “target”, and similar expressions. These forward-looking statements reflect the current views of CIT and its management and are subject to risks, uncertainties, and changes in circumstances. CIT's actual results or performance may differ materially from those expressed in, or implied by, such forward-looking statements. Factors that could affect actual results and performance include, but are not limited to, potential changes in interest rates, competitive factors and general economic conditions, changes in funding markets, industry cycles and trends, uncertainties associated with risk management, risks associated with residual value of leased equipment, and other factors described in our Form 10-K for the year ended December 31, 2004 and our Form 10-Q for the quarter ended June 30, 2005. CIT does not undertake to update any forward-looking statements.
Non-GAAP Financial MeasuresThese presentations include certain non-GAAP financial measures, as defined in Regulation G promulgated by the Securities and Exchange Commission. Any references to non-GAAP financial measures are intended to provide additional information and insight into CIT's financial condition and operating results. These measures are not in accordance with, or a substitute for, GAAP and may be different from or inconsistent with non-GAAP financial measures used by other companies. For a reconciliation of these non-GAAP measures to GAAP, please refer to the appendix within this presentation or access the reconciliations through CIT's Investor Relations website at [email protected].
Data as of June 30, 2005 unless otherwise noted.
3
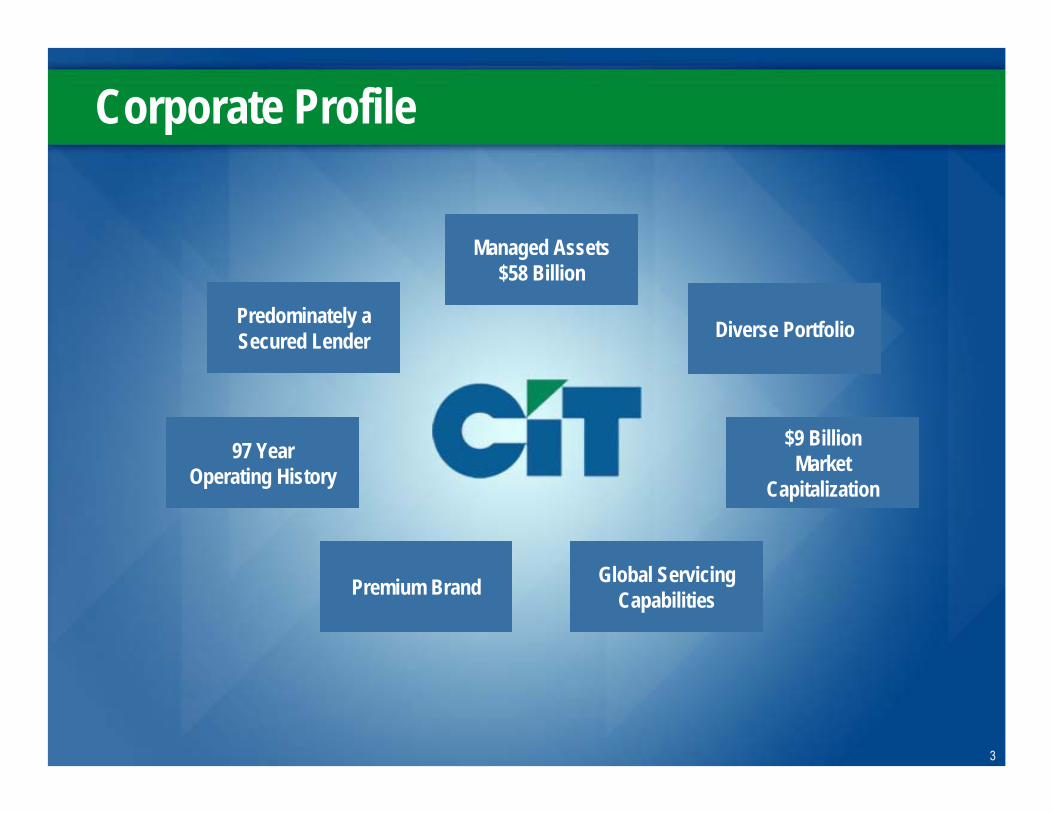
Corporate Profile
$9 BillionMarket
Capitalization
Global Servicing Capabilities
Predominately a Secured Lender
97 YearOperating History
Managed Assets$58 Billion
Premium Brand
Diverse Portfolio
3
4
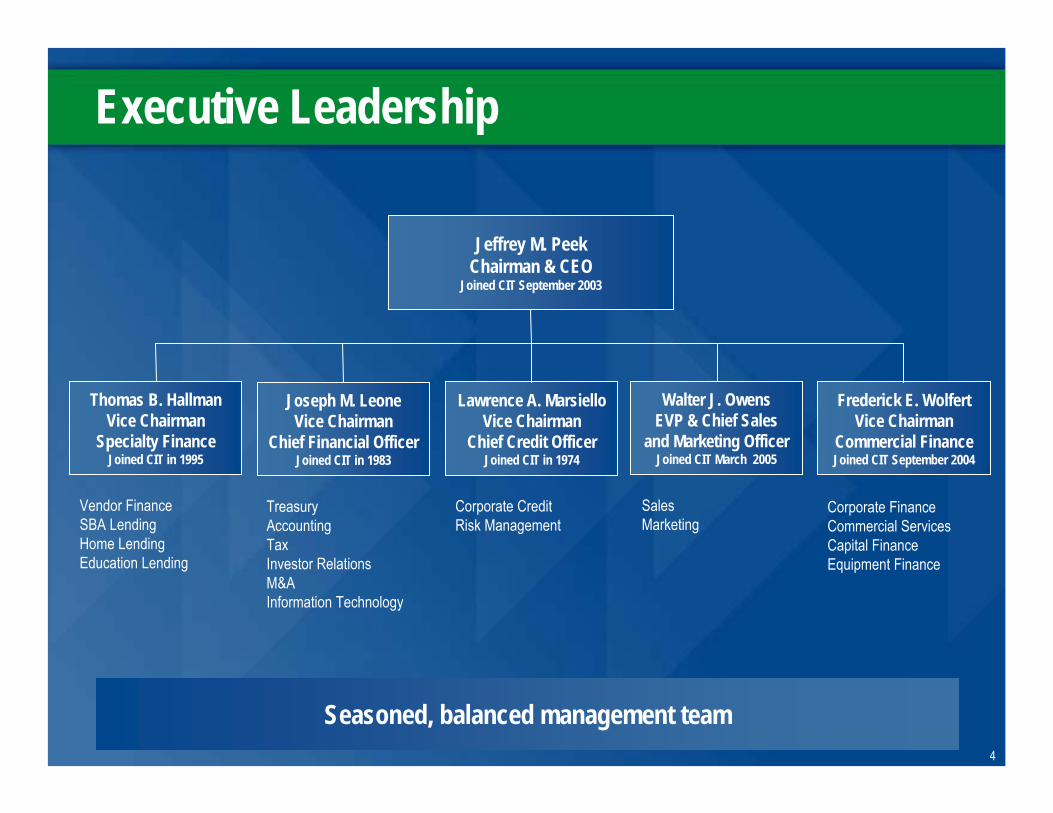
Executive Leadership
Lawrence A. MarsielloVice Chairman
Chief Credit OfficerJoined CIT in 1974
Corporate CreditRisk Management
Joseph M. LeoneVice Chairman
Chief Financial OfficerJoined CIT in 1983
TreasuryAccountingTaxInvestor RelationsM&AInformation Technology
Thomas B. HallmanVice Chairman
Specialty FinanceJoined CIT in 1995
Vendor FinanceSBA LendingHome LendingEducation Lending
Frederick E. WolfertVice Chairman
Commercial FinanceJoined CIT September 2004
Corporate FinanceCommercial ServicesCapital FinanceEquipment Finance
Walter J. OwensEVP & Chief Sales
and Marketing OfficerJoined CIT March 2005
SalesMarketing
Seasoned, balanced management team
Jeffrey M. PeekChairman & CEO
Joined CIT September 2003
5
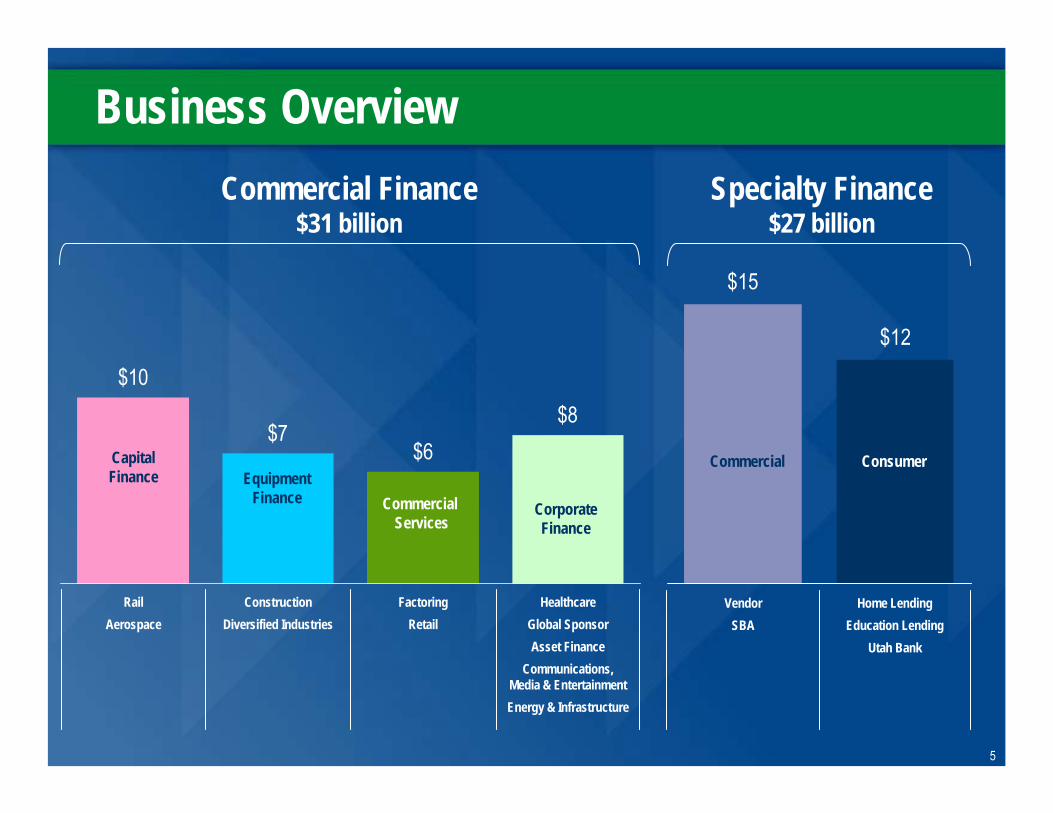
HealthcareGlobal Sponsor Asset Finance
Communications, Media & EntertainmentEnergy & Infrastructure
FactoringRetail
ConstructionDiversified Industries
RailAerospace
Business Overview
$10
$7$6
$8
$15
$12
Home LendingEducation Lending
Utah Bank
VendorSBA
Commercial Services
Corporate Finance
Capital Finance Equipment
Finance
Commercial Consumer
Commercial Finance $31 billion
Specialty Finance $27 billion
6
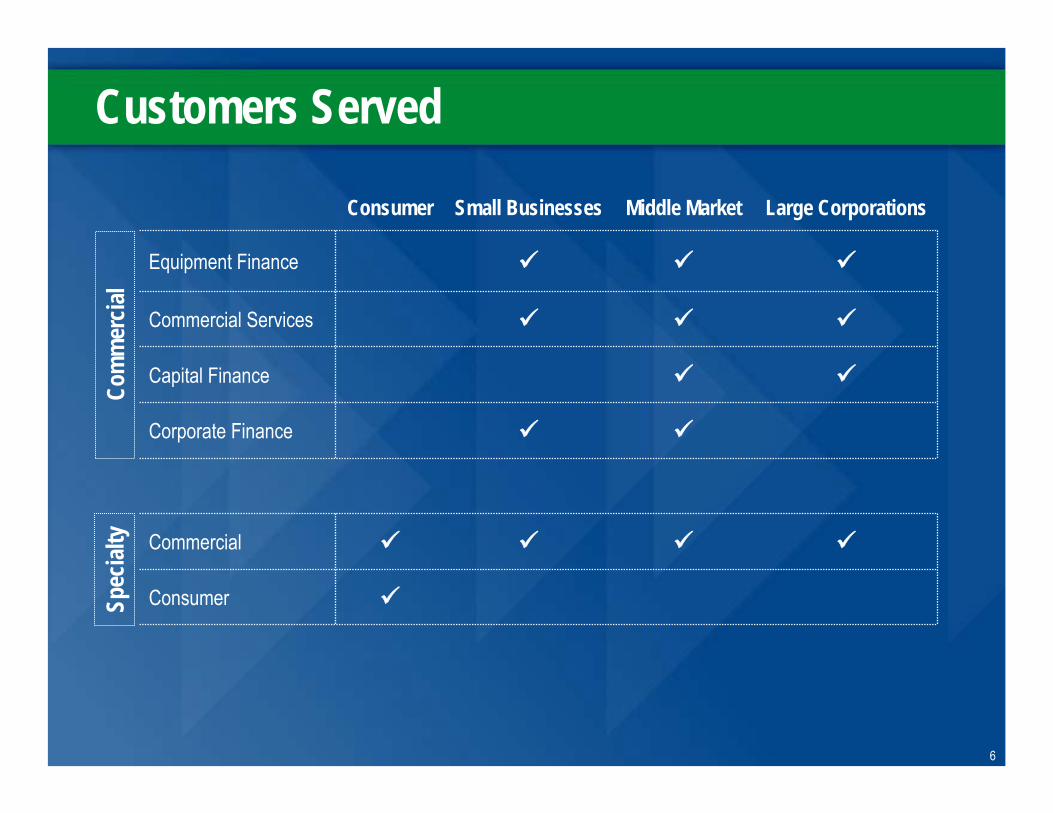
Customers Served
Capital Finance
Commercial
Consumer
Corporate Finance
Commercial Services
Equipment Finance
Large CorporationsMiddle MarketSmall BusinessesConsumer
Com
mer
cial
Spec
ialty
7
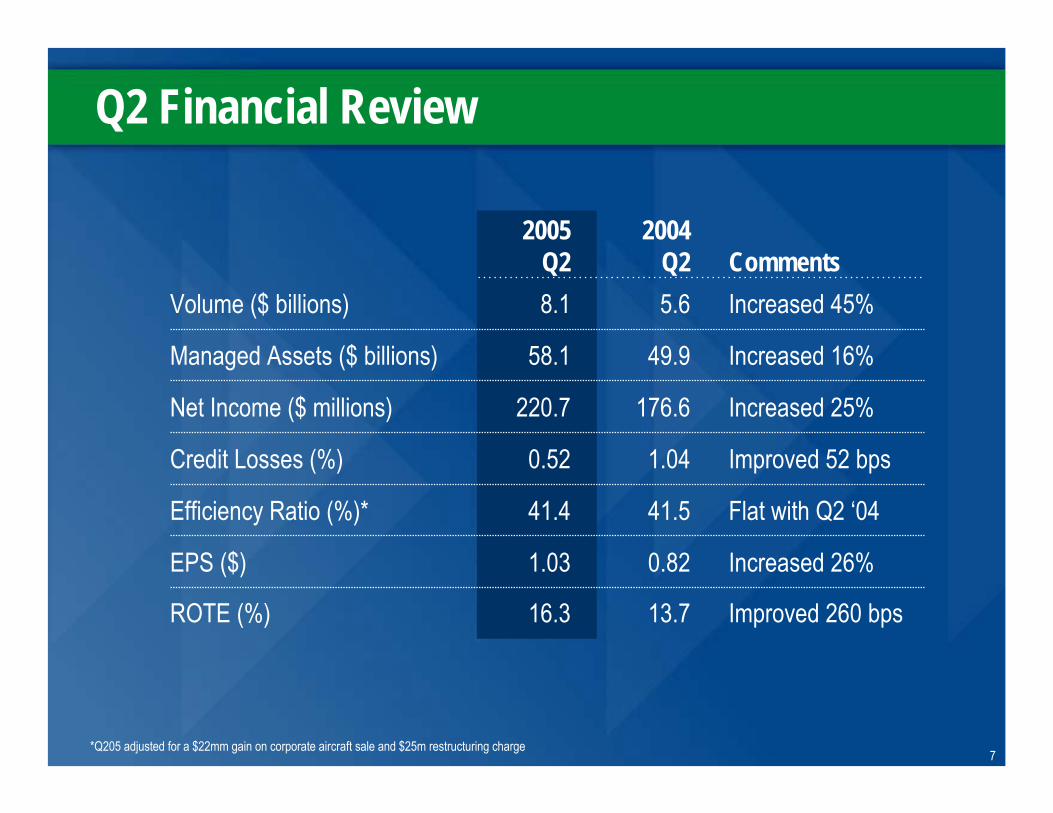
Increased 45%5.68.1Volume ($ billions)
Improved 260 bps
Increased 26%
Flat with Q2 ‘04
Improved 52 bps
Increased 25%
Increased 16%
Comments
41.541.4Efficiency Ratio (%)*
1.040.52Credit Losses (%)
49.958.1Managed Assets ($ billions)
20042005
13.7
0.82
176.6
Q2
16.3
1.03
220.7
Q2
ROTE (%)
EPS ($)
Net Income ($ millions)
Q2 Financial Review
*Q205 adjusted for a $22mm gain on corporate aircraft sale and $25m restructuring charge
8
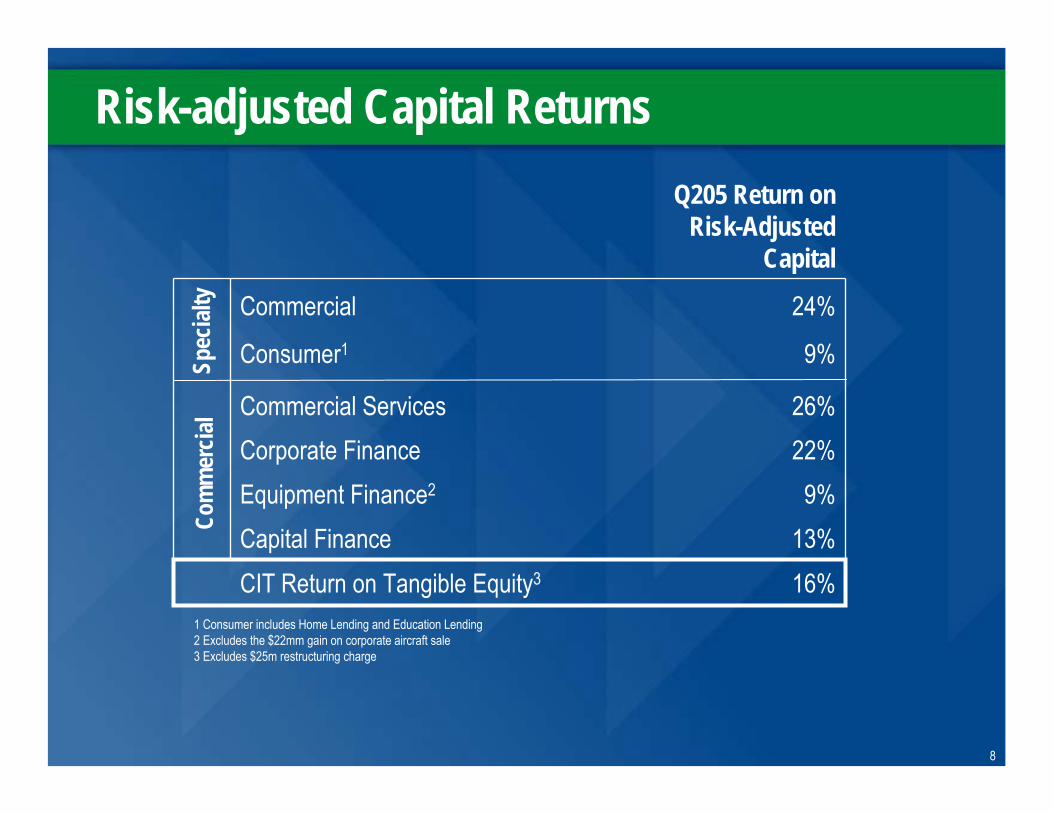
16%CIT Return on Tangible Equity3
13%9%
22%26%
9%
24%
Q205 Return on Risk-Adjusted
Capital
Equipment Finance2
Corporate Finance
Consumer1
Commercial
Capital Finance
Commercial Services
Com
mer
cial
Spec
ialty
Risk-adjusted Capital Returns
1 Consumer includes Home Lending and Education Lending2 Excludes the $22mm gain on corporate aircraft sale3 Excludes $25m restructuring charge
9
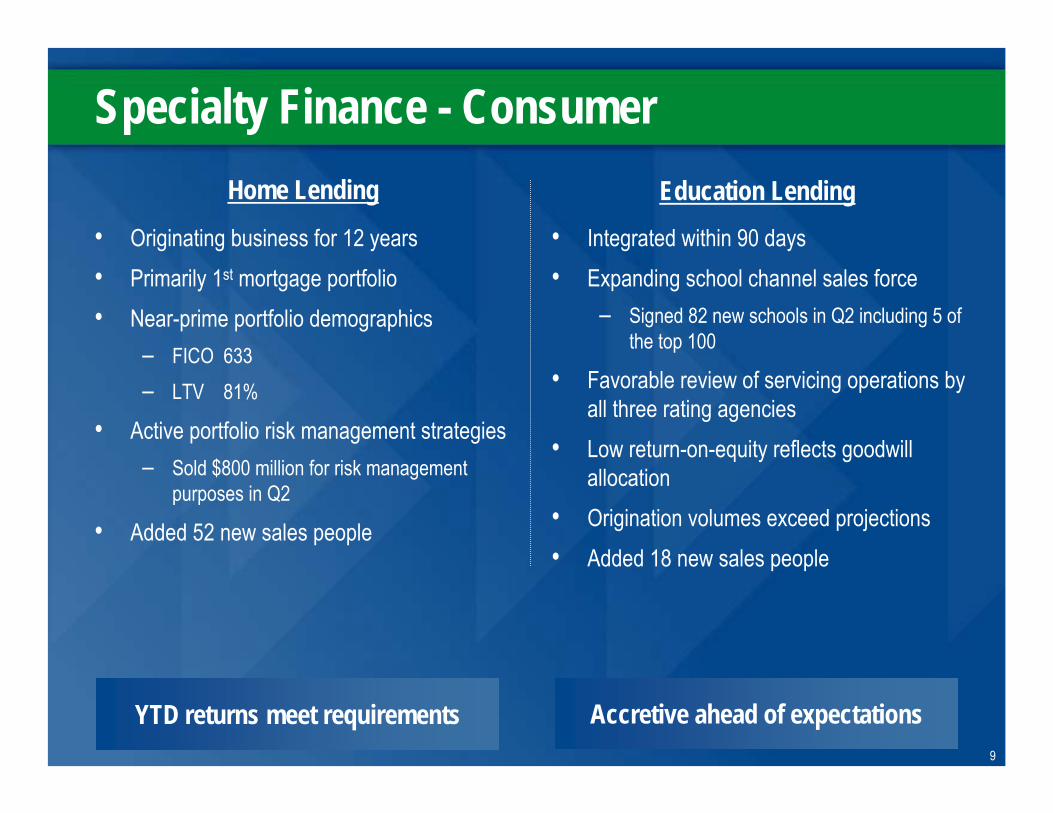
Specialty Finance - Consumer
• Originating business for 12 years• Primarily 1st mortgage portfolio• Near-prime portfolio demographics
– FICO 633– LTV 81%
• Active portfolio risk management strategies– Sold $800 million for risk management
purposes in Q2
• Added 52 new sales people
• Integrated within 90 days• Expanding school channel sales force
– Signed 82 new schools in Q2 including 5 of the top 100
• Favorable review of servicing operations by all three rating agencies
• Low return-on-equity reflects goodwill allocation
• Origination volumes exceed projections• Added 18 new sales people
Home Lending Education Lending
YTD returns meet requirements Accretive ahead of expectations
10
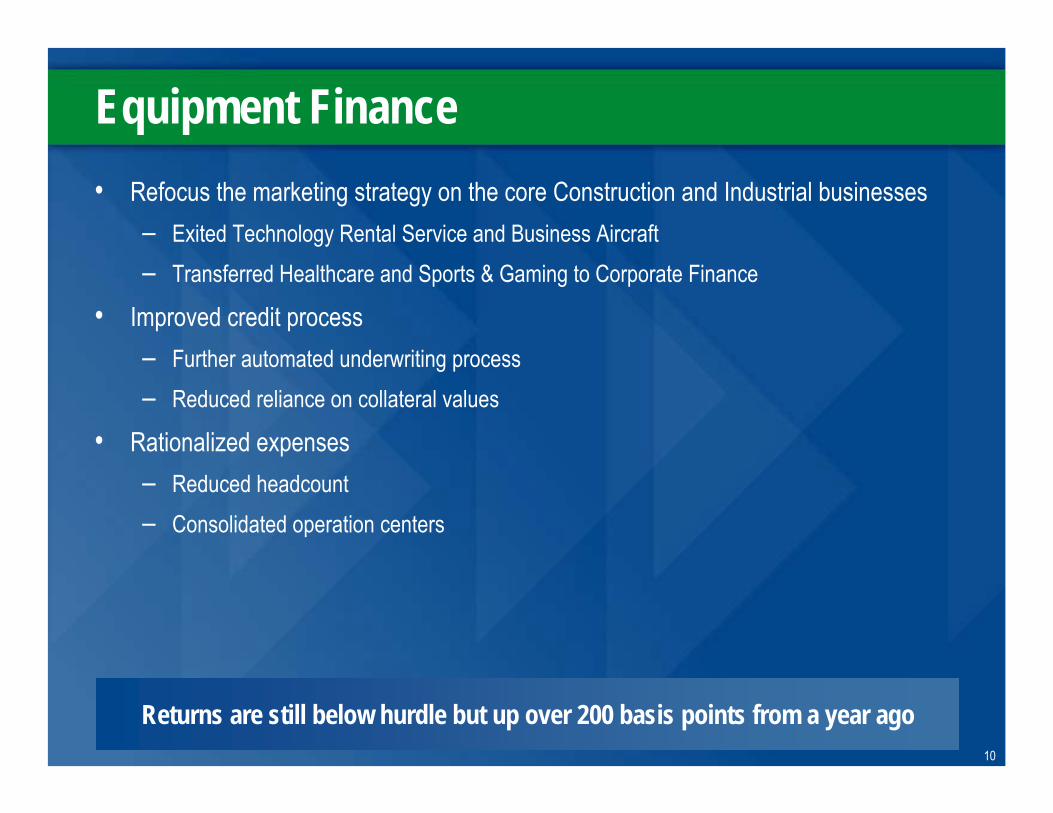
Equipment Finance• Refocus the marketing strategy on the core Construction and Industrial businesses
– Exited Technology Rental Service and Business Aircraft– Transferred Healthcare and Sports & Gaming to Corporate Finance
• Improved credit process– Further automated underwriting process– Reduced reliance on collateral values
• Rationalized expenses– Reduced headcount– Consolidated operation centers
Returns are still below hurdle but up over 200 basis points from a year ago
11
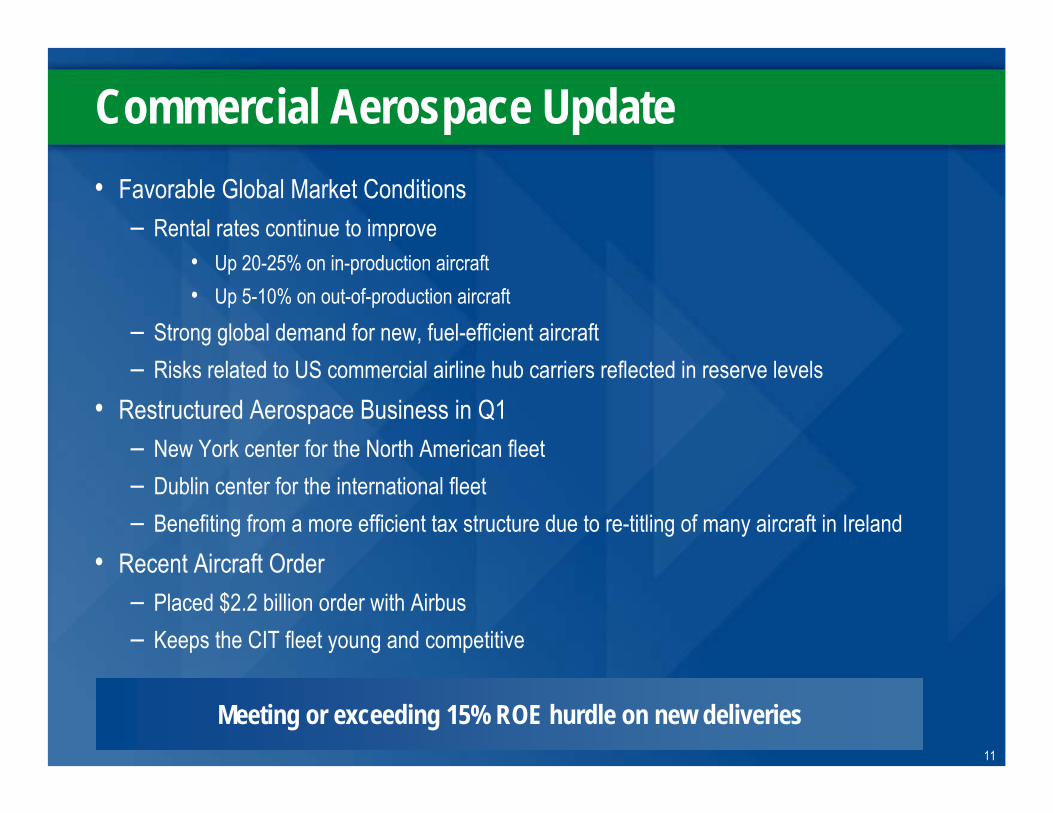
Commercial Aerospace Update• Favorable Global Market Conditions
– Rental rates continue to improve• Up 20-25% on in-production aircraft• Up 5-10% on out-of-production aircraft
– Strong global demand for new, fuel-efficient aircraft– Risks related to US commercial airline hub carriers reflected in reserve levels
• Restructured Aerospace Business in Q1– New York center for the North American fleet– Dublin center for the international fleet– Benefiting from a more efficient tax structure due to re-titling of many aircraft in Ireland
• Recent Aircraft Order– Placed $2.2 billion order with Airbus– Keeps the CIT fleet young and competitive
Meeting or exceeding 15% ROE hurdle on new deliveries
12
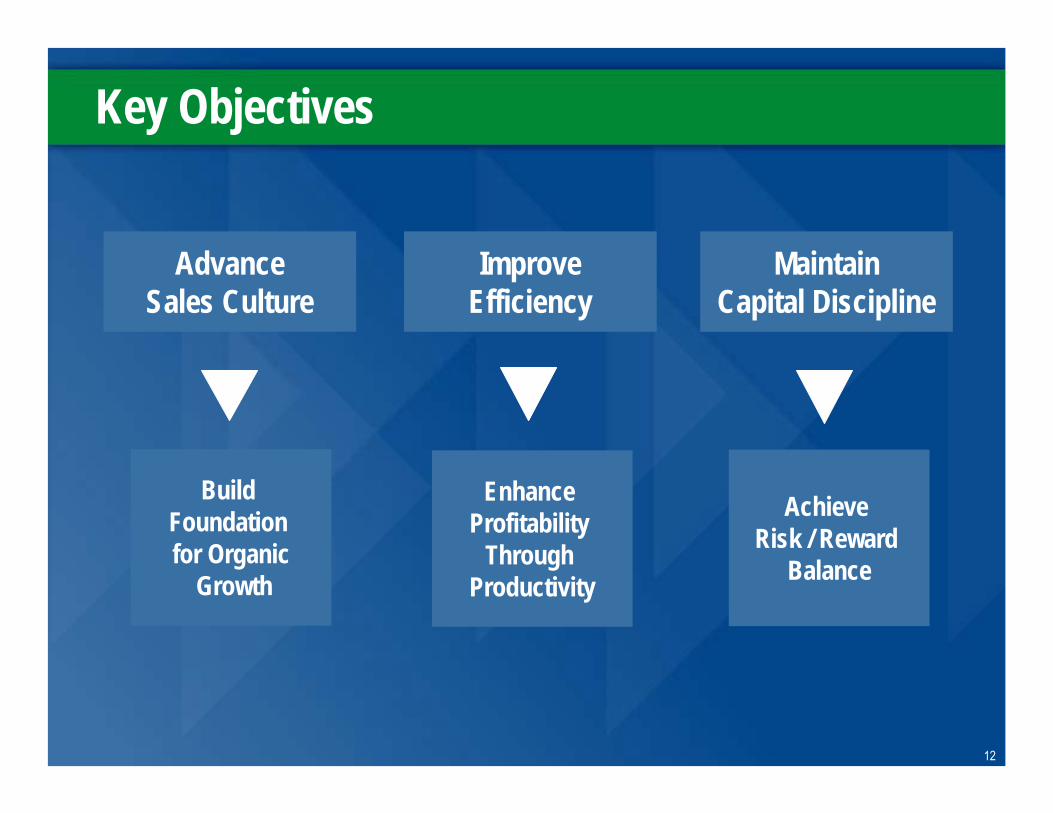
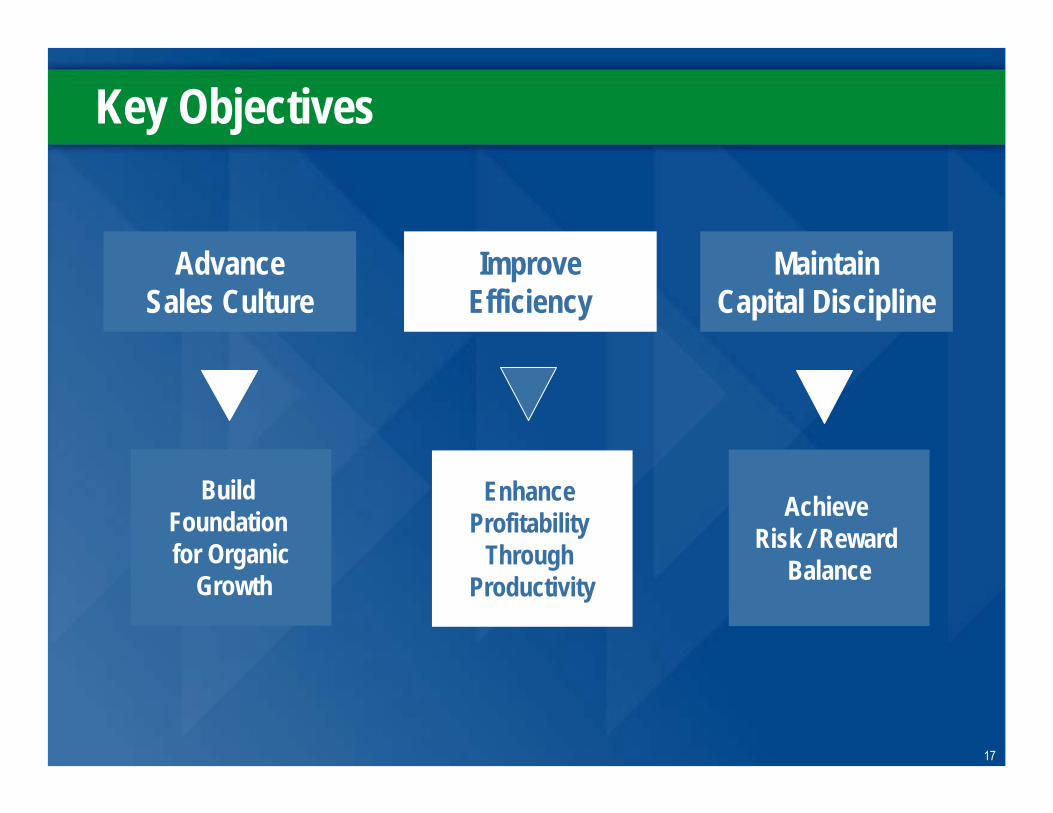
Key Objectives
ImproveEfficiency
MaintainCapital Discipline
Enhance Profitability
Through Productivity
Achieve Risk / Reward
Balance
AdvanceSales Culture
Build Foundation for Organic
Growth
13
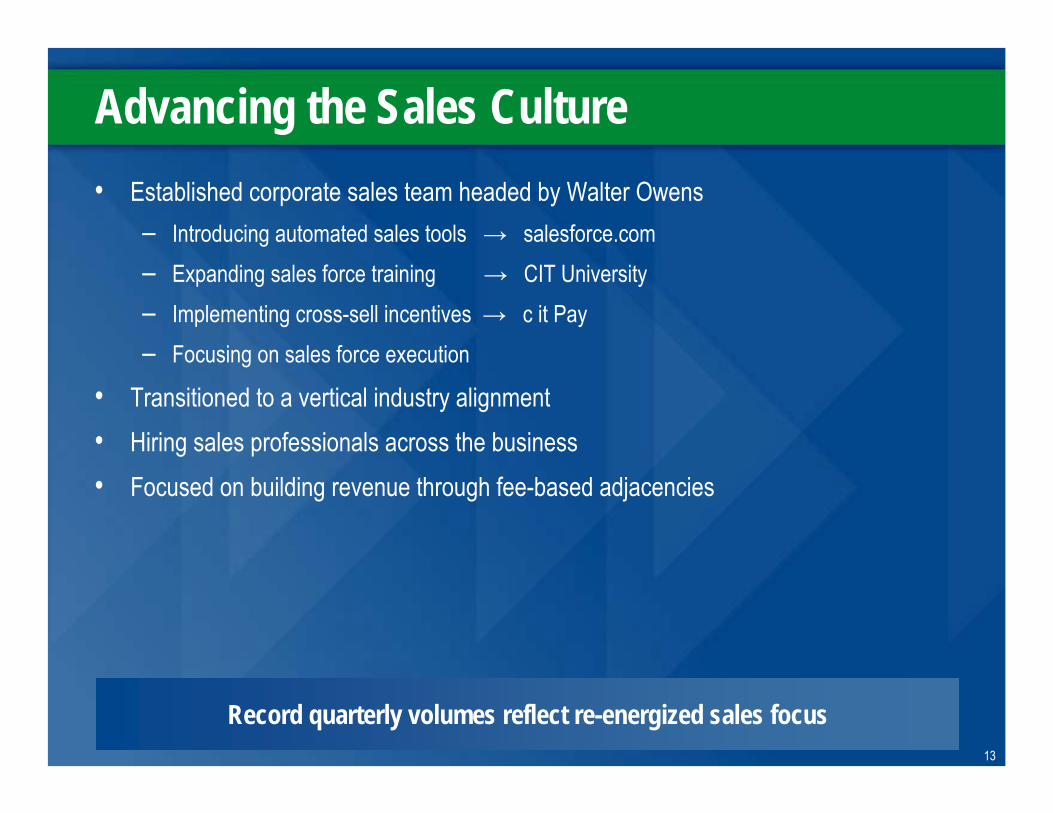
Advancing the Sales Culture• Established corporate sales team headed by Walter Owens
– Introducing automated sales tools → salesforce.com– Expanding sales force training → CIT University– Implementing cross-sell incentives → c it Pay– Focusing on sales force execution
• Transitioned to a vertical industry alignment • Hiring sales professionals across the business• Focused on building revenue through fee-based adjacencies
Record quarterly volumes reflect re-energized sales focus
14
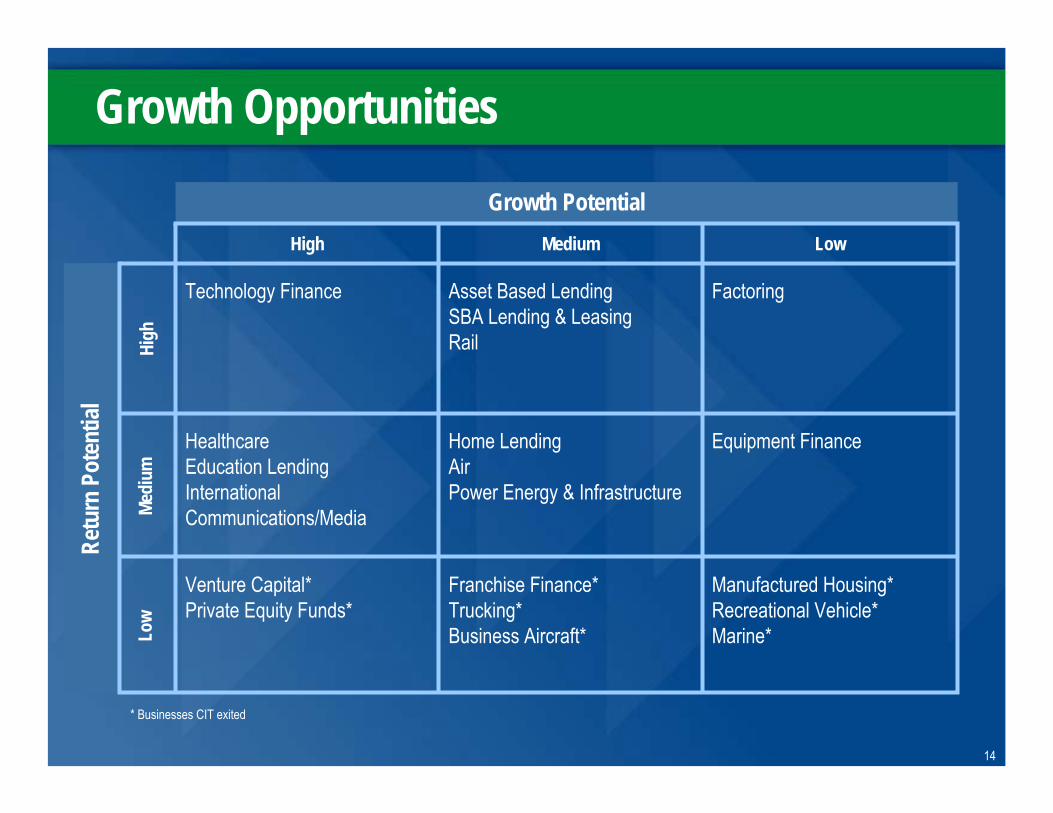
Growth Opportunities
Manufactured Housing*Recreational Vehicle*Marine*
Franchise Finance*Trucking*Business Aircraft*
Venture Capital*Private Equity Funds*
Equipment FinanceHome LendingAirPower Energy & Infrastructure
Healthcare Education LendingInternational Communications/Media
FactoringAsset Based LendingSBA Lending & LeasingRail
Technology Finance
LowMediumHigh
Growth Potential
High
Medi
umLo
w
Retu
rn P
oten
tial
* Businesses CIT exited
15
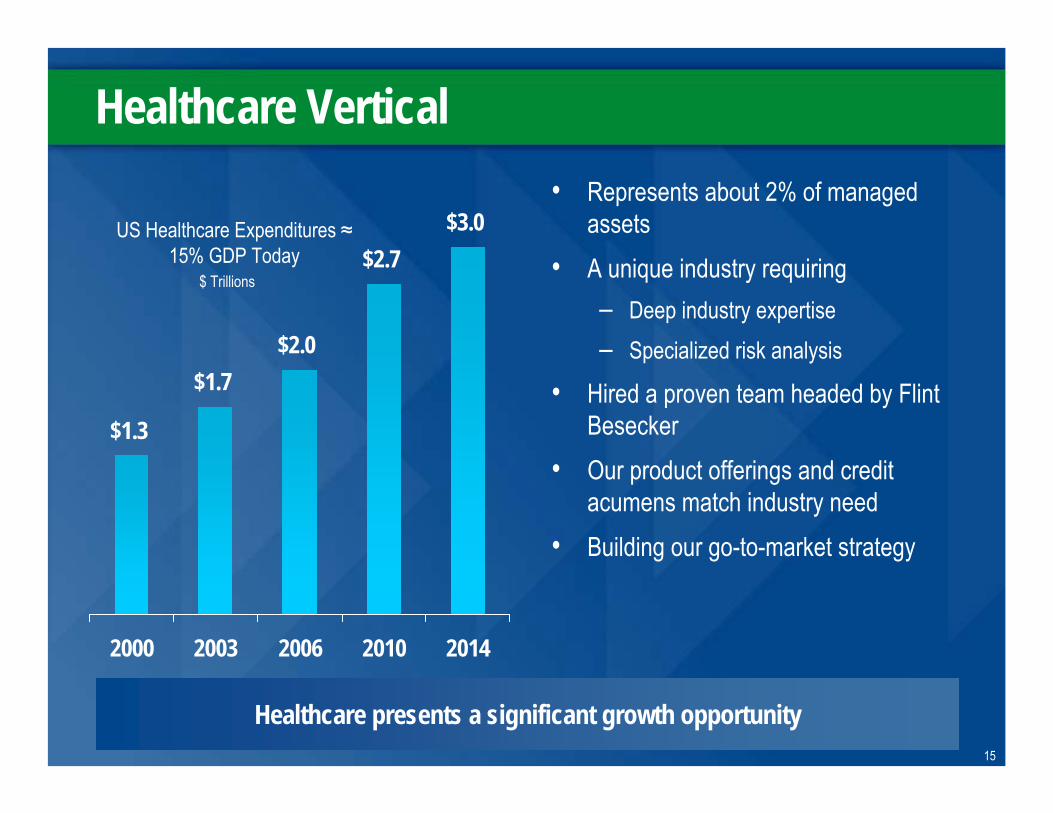
Healthcare Vertical
$1.3
$1.7$2.0
$2.7$3.0
2000 2003 2006 2010 2014
• Represents about 2% of managed assets
• A unique industry requiring – Deep industry expertise– Specialized risk analysis
• Hired a proven team headed by Flint Besecker
• Our product offerings and credit acumens match industry need
• Building our go-to-market strategy
Healthcare presents a significant growth opportunity
US Healthcare Expenditures ≈15% GDP Today
$ Trillions
16
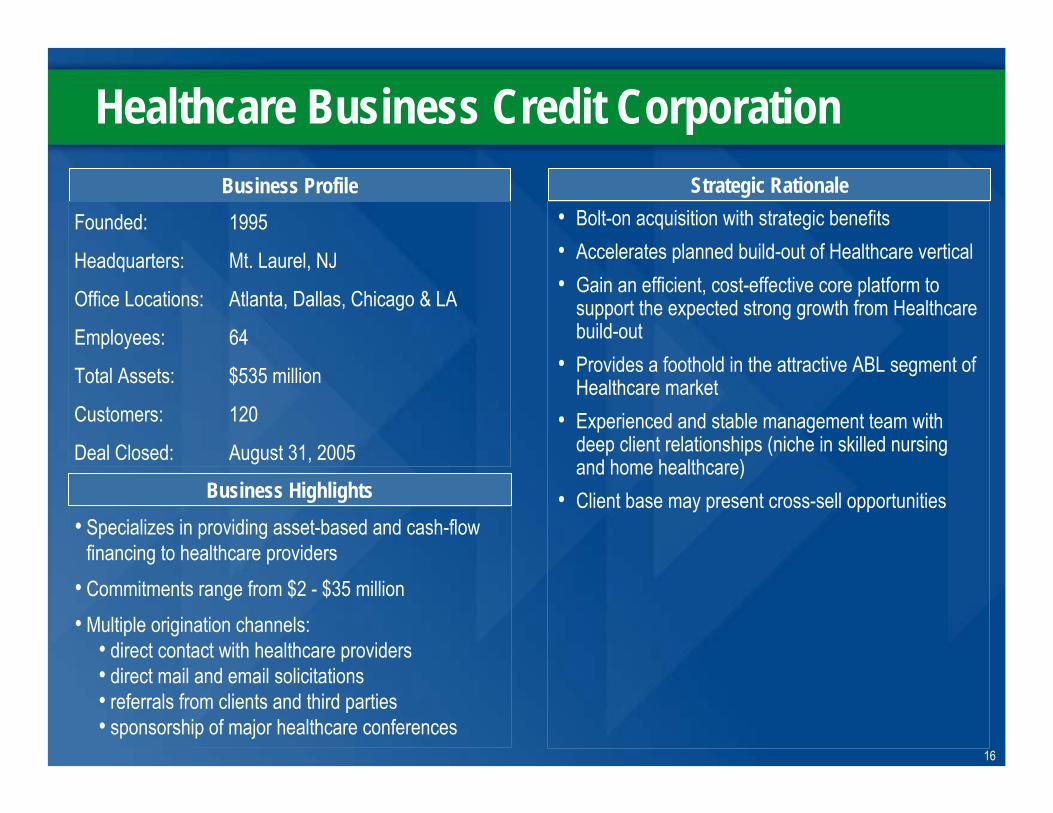
Healthcare Business Credit CorporationBusiness Profile
Founded: 1995
Headquarters: Mt. Laurel, NJ
Office Locations: Atlanta, Dallas, Chicago & LA
Employees: 64
Total Assets: $535 million
Customers: 120
Deal Closed: August 31, 2005
• Specializes in providing asset-based and cash-flow financing to healthcare providers
• Commitments range from $2 - $35 million • Multiple origination channels:
• direct contact with healthcare providers• direct mail and email solicitations• referrals from clients and third parties• sponsorship of major healthcare conferences
• Bolt-on acquisition with strategic benefits• Accelerates planned build-out of Healthcare vertical• Gain an efficient, cost-effective core platform to
support the expected strong growth from Healthcare build-out
• Provides a foothold in the attractive ABL segment of Healthcare market
• Experienced and stable management team with deep client relationships (niche in skilled nursing and home healthcare)
• Client base may present cross-sell opportunities
Strategic Rationale
Business Highlights
17
Key Objectives
ImproveEfficiency
MaintainCapital Discipline
Enhance Profitability
Through Productivity
Achieve Risk / Reward
Balance
AdvanceSales Culture
Build Foundation for Organic
Growth
18
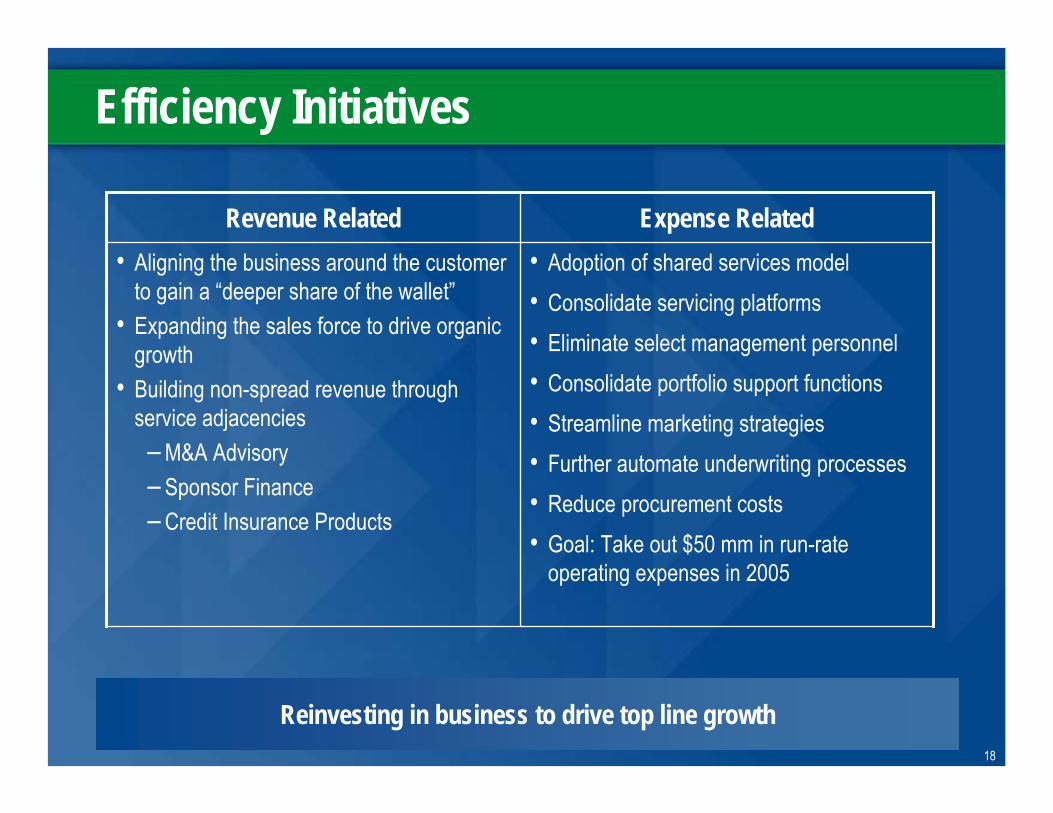
Efficiency Initiatives
• Adoption of shared services model• Consolidate servicing platforms• Eliminate select management personnel• Consolidate portfolio support functions• Streamline marketing strategies• Further automate underwriting processes• Reduce procurement costs• Goal: Take out $50 mm in run-rate
operating expenses in 2005
• Aligning the business around the customer to gain a “deeper share of the wallet”
• Expanding the sales force to drive organic growth
• Building non-spread revenue through service adjacencies– M&A Advisory– Sponsor Finance– Credit Insurance Products
Expense RelatedRevenue Related
Reinvesting in business to drive top line growth
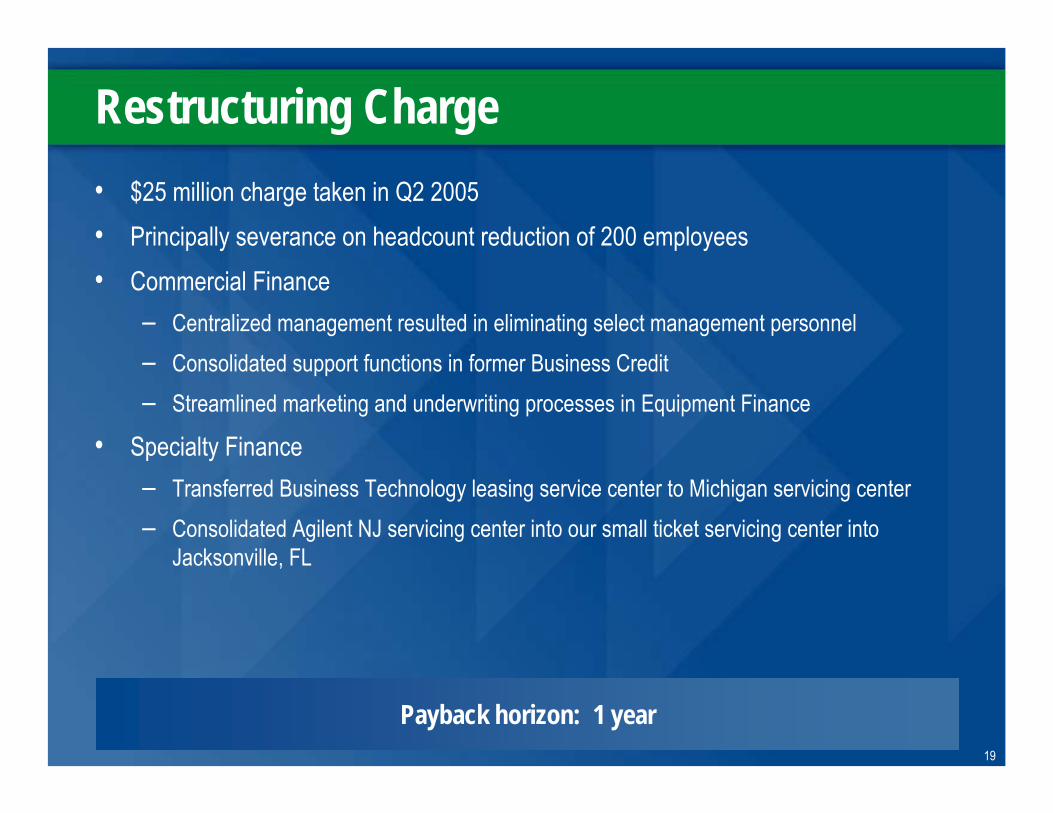
19
Payback horizon: 1 year
Restructuring Charge• $25 million charge taken in Q2 2005• Principally severance on headcount reduction of 200 employees• Commercial Finance
– Centralized management resulted in eliminating select management personnel– Consolidated support functions in former Business Credit– Streamlined marketing and underwriting processes in Equipment Finance
• Specialty Finance– Transferred Business Technology leasing service center to Michigan servicing center – Consolidated Agilent NJ servicing center into our small ticket servicing center into
Jacksonville, FL
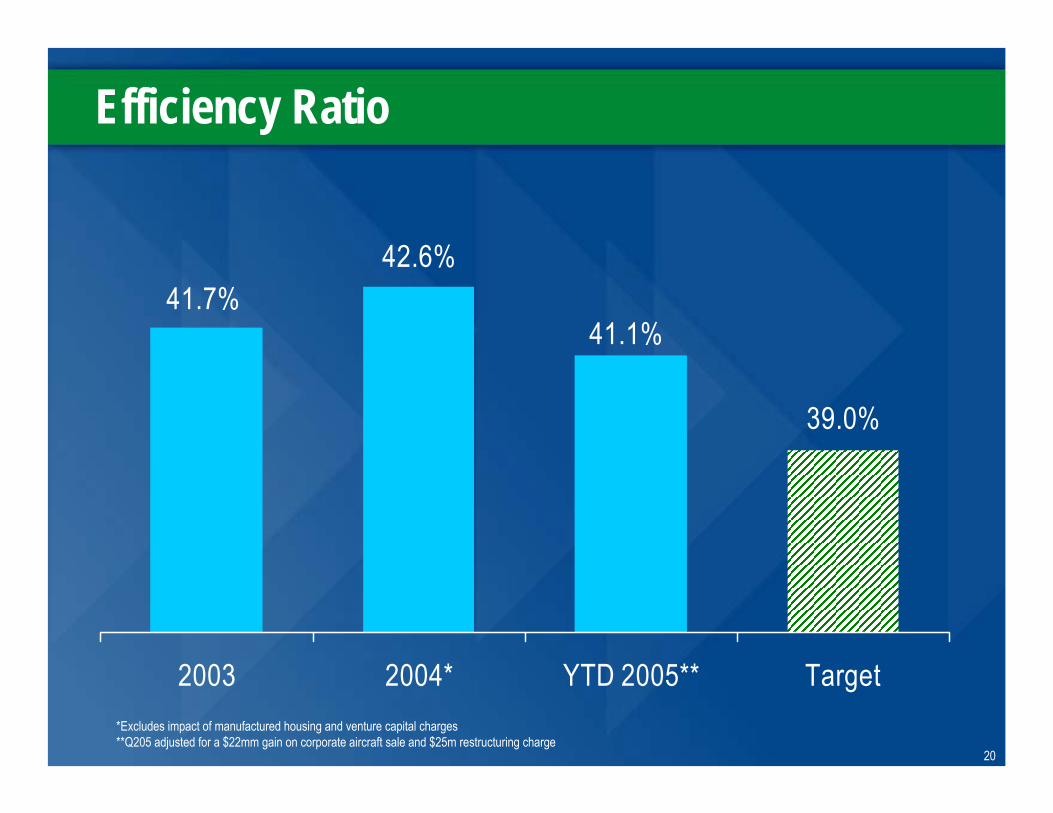
20
39.0%
41.1%
42.6%41.7%
2003 2004* YTD 2005** Target
Efficiency Ratio
*Excludes impact of manufactured housing and venture capital charges**Q205 adjusted for a $22mm gain on corporate aircraft sale and $25m restructuring charge
21
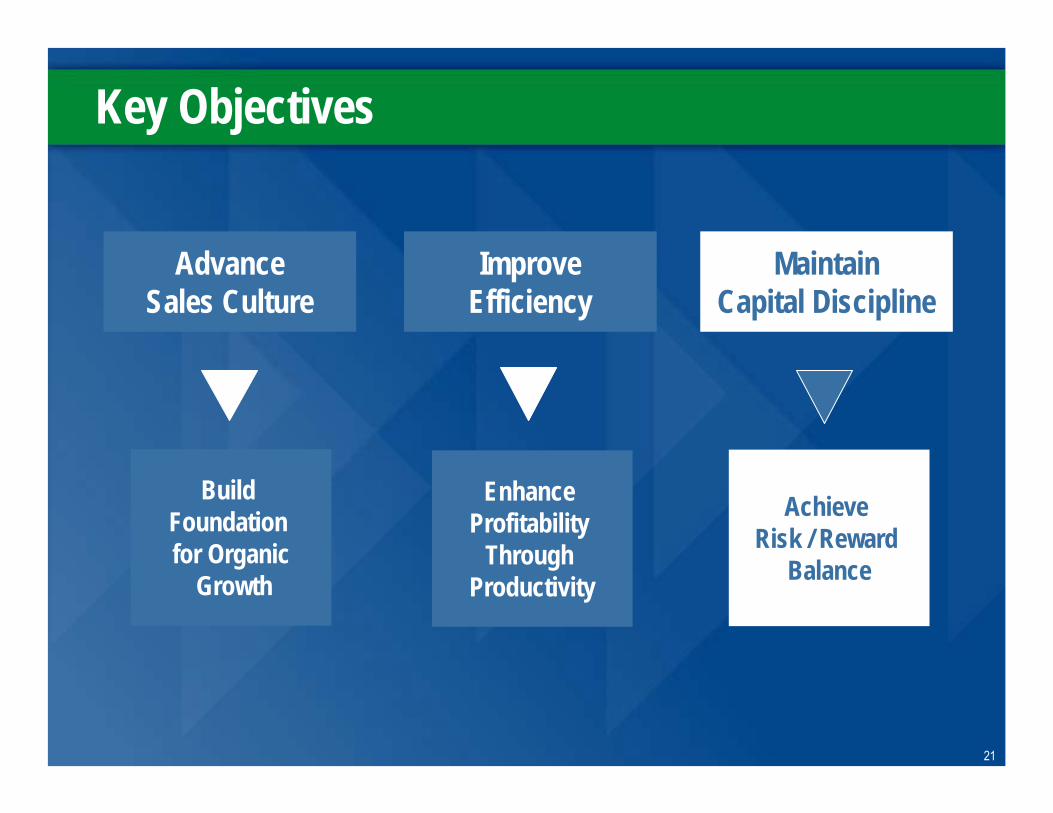
Key Objectives
ImproveEfficiency
MaintainCapital Discipline
Enhance Profitability
Through Productivity
Achieve Risk / Reward
Balance
AdvanceSales Culture
Build Foundation for Organic
Growth
22
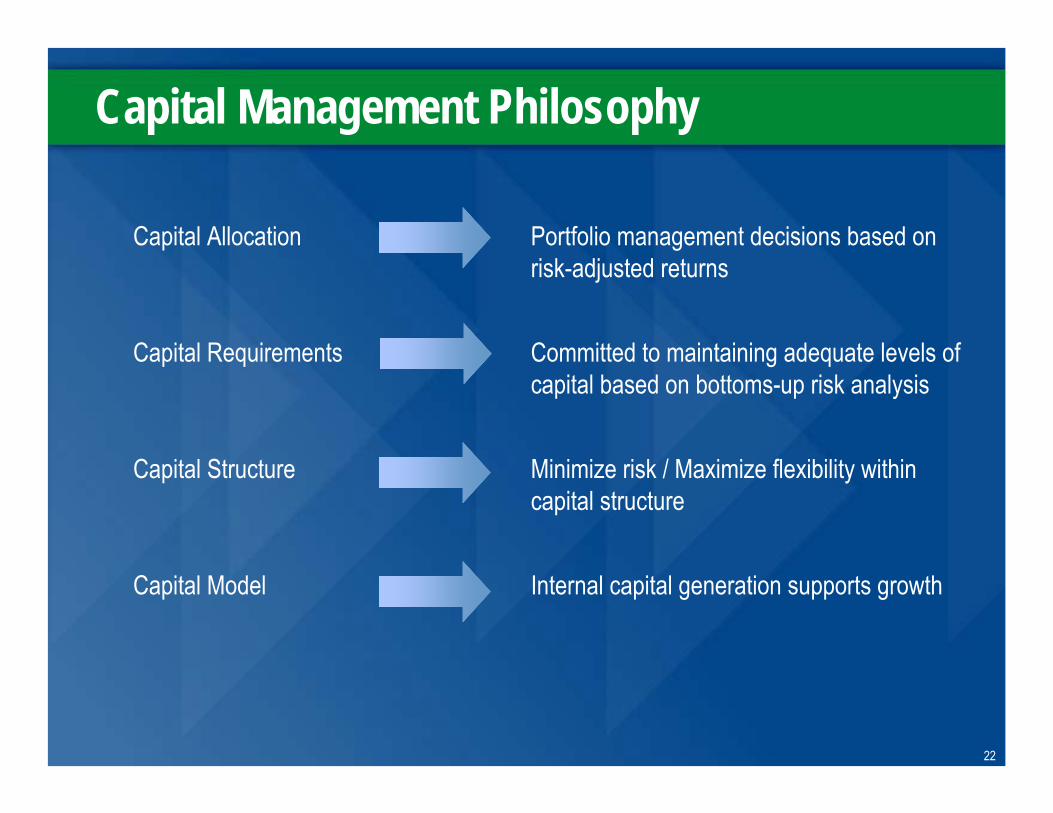
Portfolio management decisions based on risk-adjusted returns
Capital Allocation
Minimize risk / Maximize flexibility within capital structure
Capital Structure
Committed to maintaining adequate levels of capital based on bottoms-up risk analysis
Capital Requirements
Internal capital generation supports growthCapital Model
Capital Management Philosophy
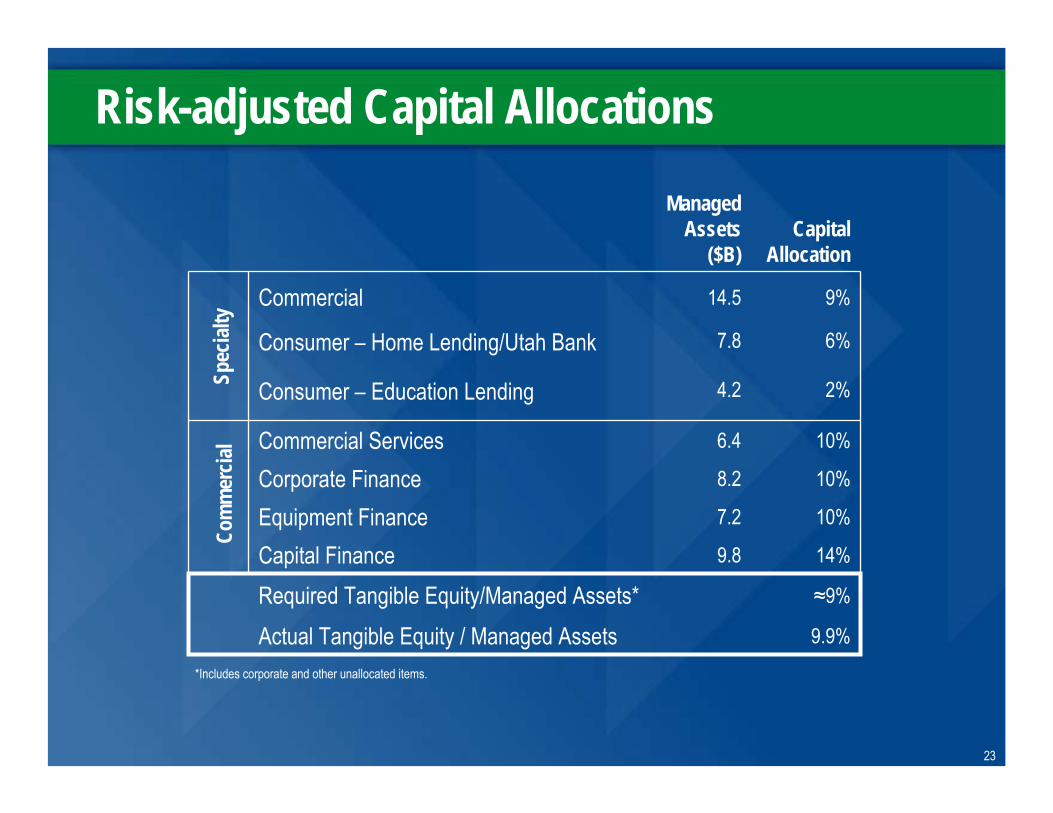
23
2%4.2Consumer – Education Lending
9.8
7.2
8.2
6.4
7.8
14.5
Managed Assets
($B)
≈9%Required Tangible Equity/Managed Assets* 9.9%Actual Tangible Equity / Managed Assets
14%
10%
10%
10%
6%
9%
Capital Allocation
Equipment FinanceCorporate Finance
Consumer – Home Lending/Utah Bank
Commercial
Capital Finance
Commercial Services
Com
mer
cial
Spec
ialty
Risk-adjusted Capital Allocations
*Includes corporate and other unallocated items.
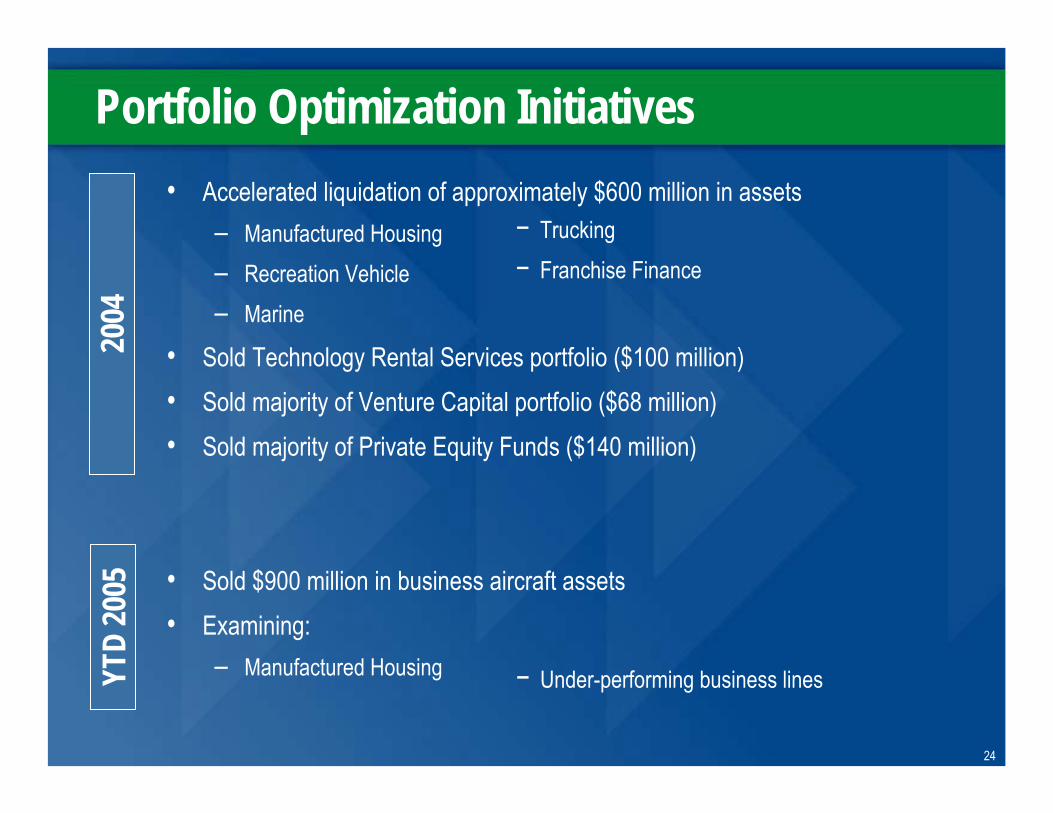
24
Portfolio Optimization Initiatives• Accelerated liquidation of approximately $600 million in assets
– Manufactured Housing– Recreation Vehicle– Marine
• Sold Technology Rental Services portfolio ($100 million)• Sold majority of Venture Capital portfolio ($68 million)• Sold majority of Private Equity Funds ($140 million)
• Sold $900 million in business aircraft assets• Examining:
– Manufactured Housing
2004
YTD
2005
− Trucking− Franchise Finance
− Under-performing business lines
25
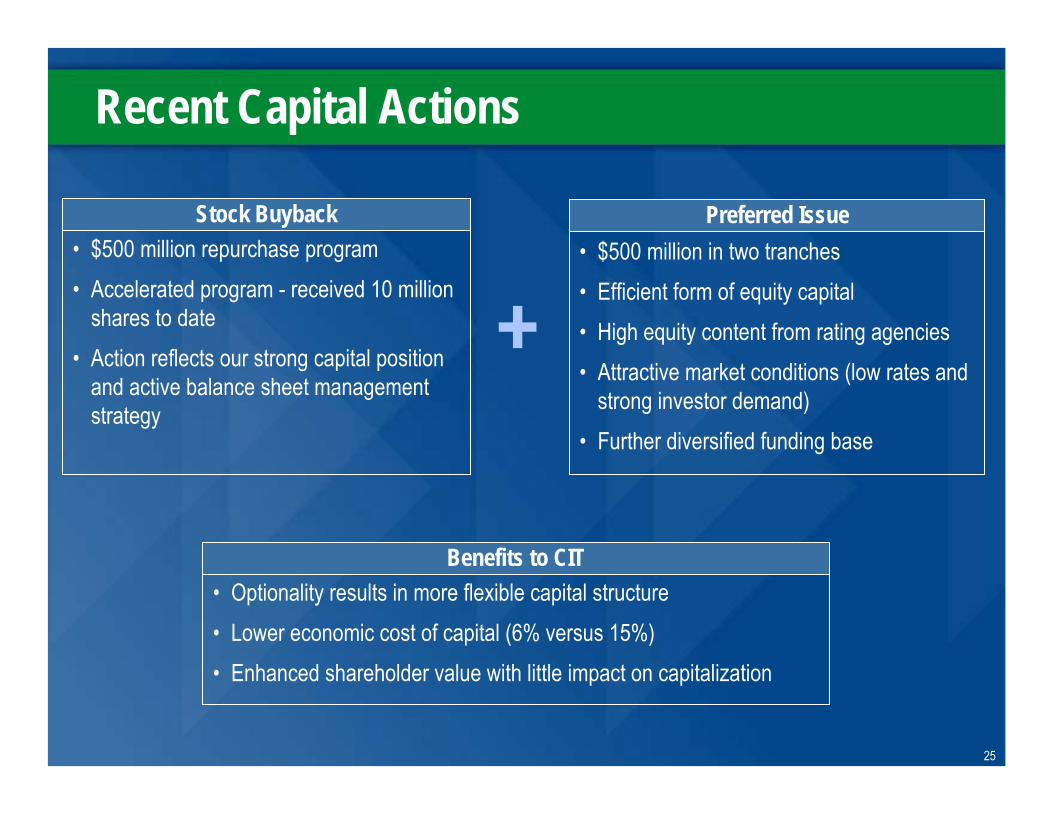
Recent Capital Actions
• $500 million repurchase program• Accelerated program - received 10 million
shares to date• Action reflects our strong capital position
and active balance sheet management strategy
• $500 million in two tranches• Efficient form of equity capital• High equity content from rating agencies• Attractive market conditions (low rates and
strong investor demand)• Further diversified funding base
Stock Buyback Preferred Issue
+
• Optionality results in more flexible capital structure• Lower economic cost of capital (6% versus 15%)• Enhanced shareholder value with little impact on capitalization
Benefits to CIT
26
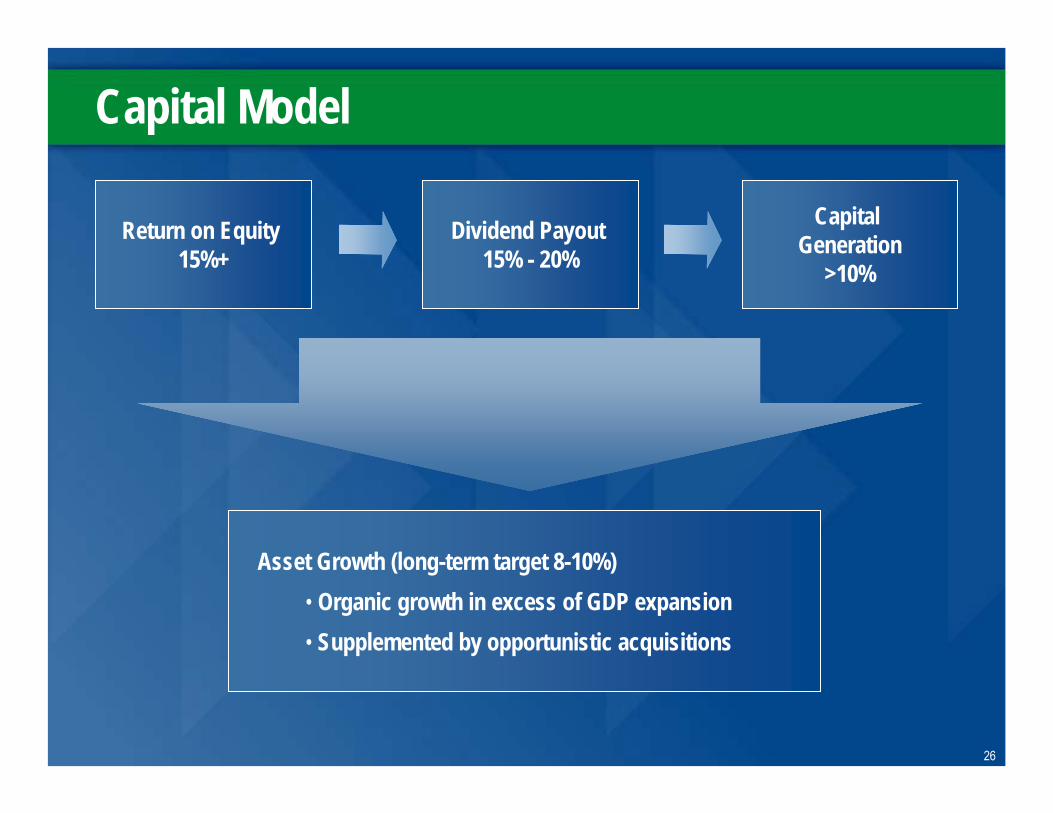
Capital Model
Return on Equity 15%+
Dividend Payout 15% - 20%
Capital Generation
>10%
Asset Growth (long-term target 8-10%)• Organic growth in excess of GDP expansion• Supplemented by opportunistic acquisitions
27
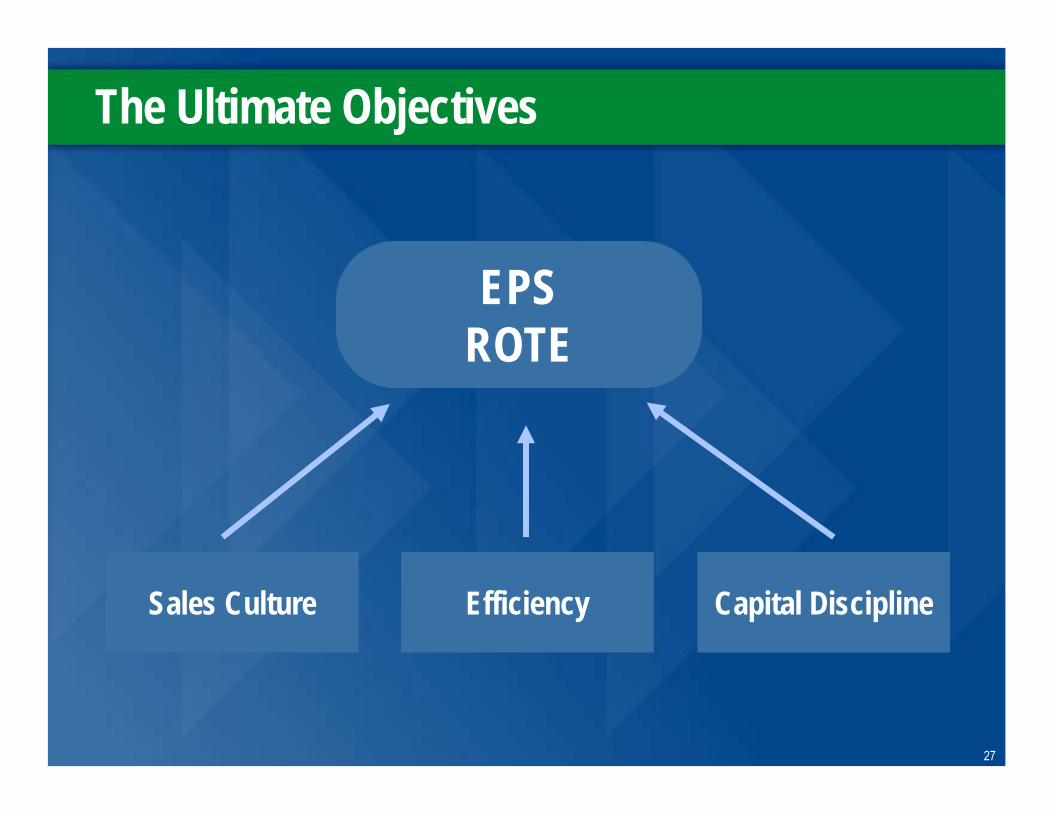
The Ultimate Objectives
EPSROTE
Efficiency Capital DisciplineSales Culture
28
9.0%
10.0%
11.0%
12.0%
13.0%
14.0%
15.0%
16.0%
17.0%
Perce
nt RO
TE
Mar-03 Jun-03 Sep-03 Dec-03* Mar-04* Jun-04 Sep-04* Dec-04* Mar-05* Jun-05$0.50
$0.60
$0.70
$0.80
$0.90
$1.00
$1.10
$1.20
Earni
ngs P
er Sh
are
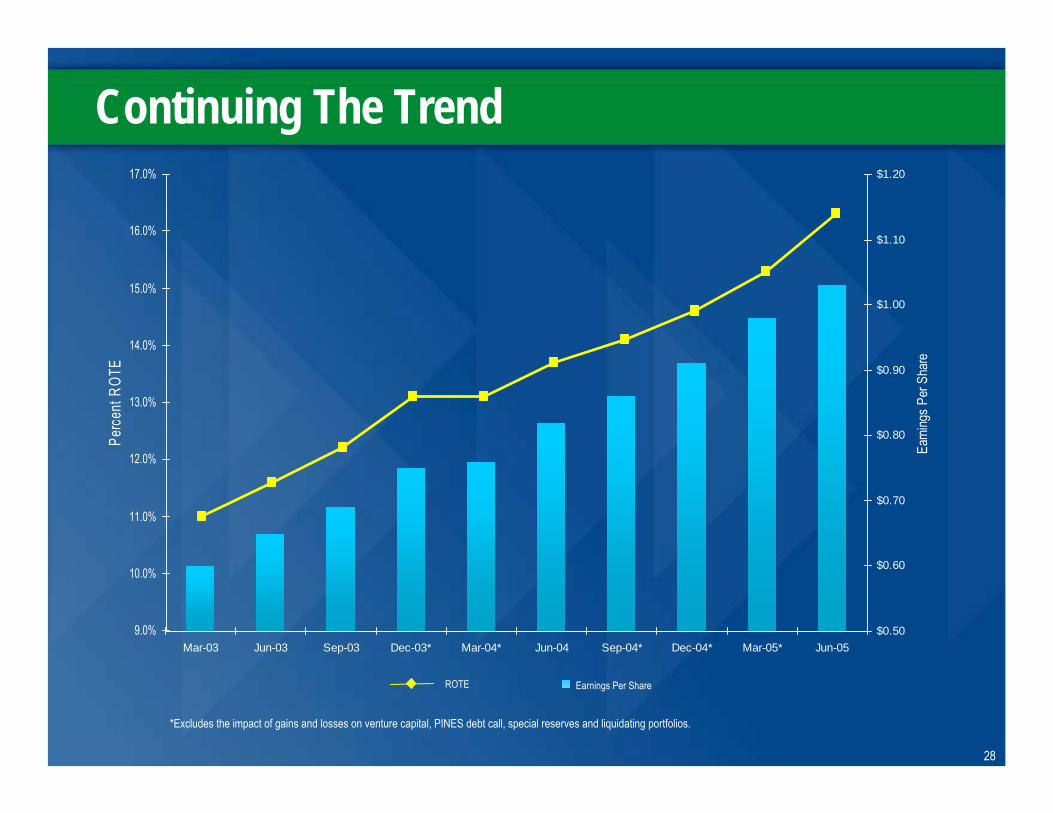
Continuing The Trend
*Excludes the impact of gains and losses on venture capital, PINES debt call, special reserves and liquidating portfolios.
ROTE Earnings Per Share
29
Appendix
30
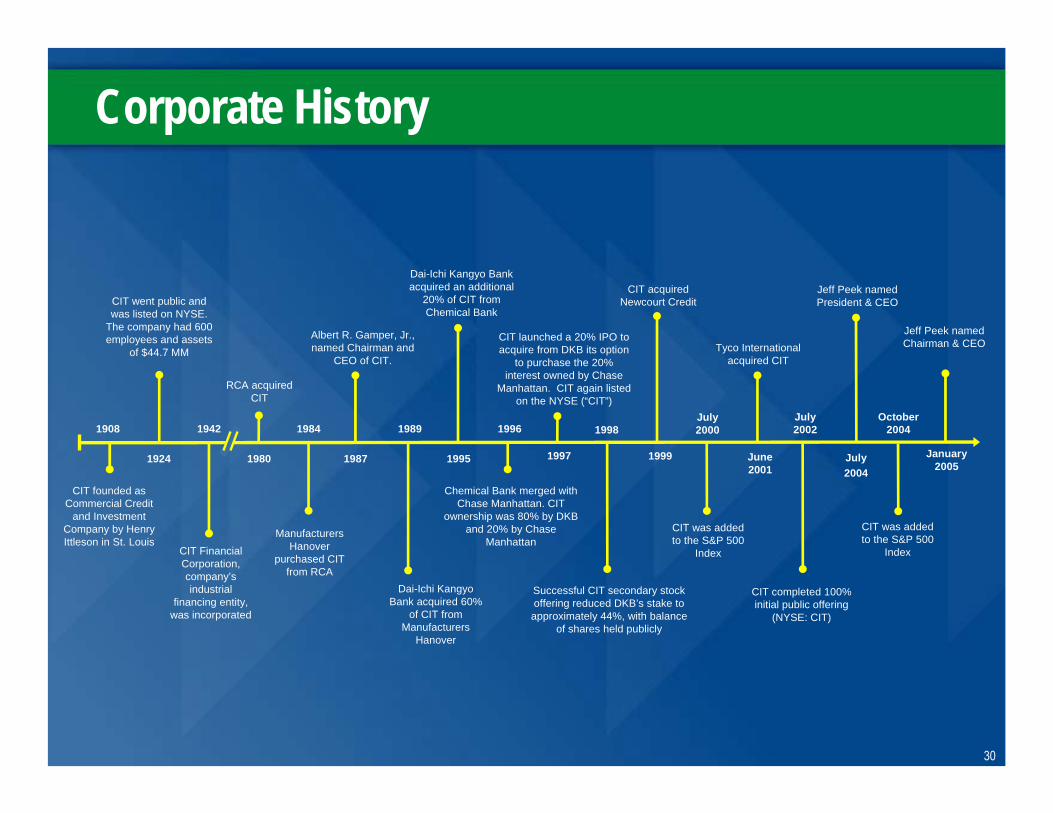
Corporate History
Dai-Ichi Kangyo Bank acquired 60%
of CIT from Manufacturers
Hanover
CIT Financial Corporation, company’s industrial
financing entity, was incorporated
CIT founded as Commercial Credit
and Investment Company by Henry Ittleson in St. Louis
CIT launched a 20% IPO to acquire from DKB its option
to purchase the 20% interest owned by Chase
Manhattan. CIT again listed on the NYSE (“CIT”)
Albert R. Gamper, Jr., named Chairman and
CEO of CIT.
CIT completed 100% initial public offering
(NYSE: CIT)
Tyco International acquired CIT
CIT acquired Newcourt Credit
Successful CIT secondary stock offering reduced DKB’s stake to approximately 44%, with balance
of shares held publicly
1997
Chemical Bank merged with Chase Manhattan. CIT
ownership was 80% by DKB and 20% by Chase
Manhattan
Dai-Ichi Kangyo Bank acquired an additional
20% of CIT from Chemical Bank
Manufacturers Hanover
purchased CIT from RCA
CIT went public and was listed on NYSE.
The company had 600 employees and assets
of $44.7 MM
July 2002
June 2001
July 2000
CIT was added to the S&P 500
Index
1999
19981996
1995
1989
1987
1984
1980
RCA acquired CIT
1942
1924
1908
July2004
Jeff Peek named President & CEO
CIT was added to the S&P 500
Index
October 2004
January 2005
Jeff Peek named Chairman & CEO
31
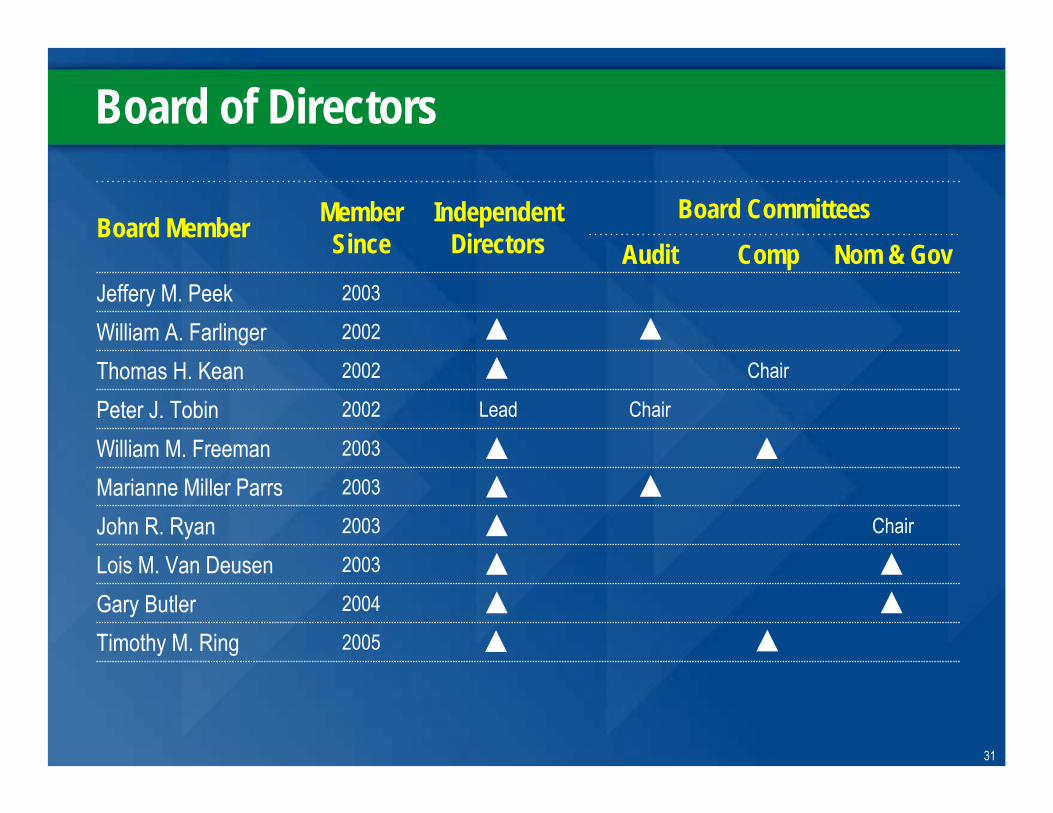
Board of Directors
2005Timothy M. Ring2004Gary Butler2003Lois M. Van Deusen
Chair2003John R. Ryan2003Marianne Miller Parrs2003William M. Freeman
ChairLead2002Peter J. TobinChair2002Thomas H. Kean
2002William A. Farlinger2003Jeffery M. Peek
Nom & GovCompAuditBoard Member
Board CommitteesIndependent Directors
Member Since
32
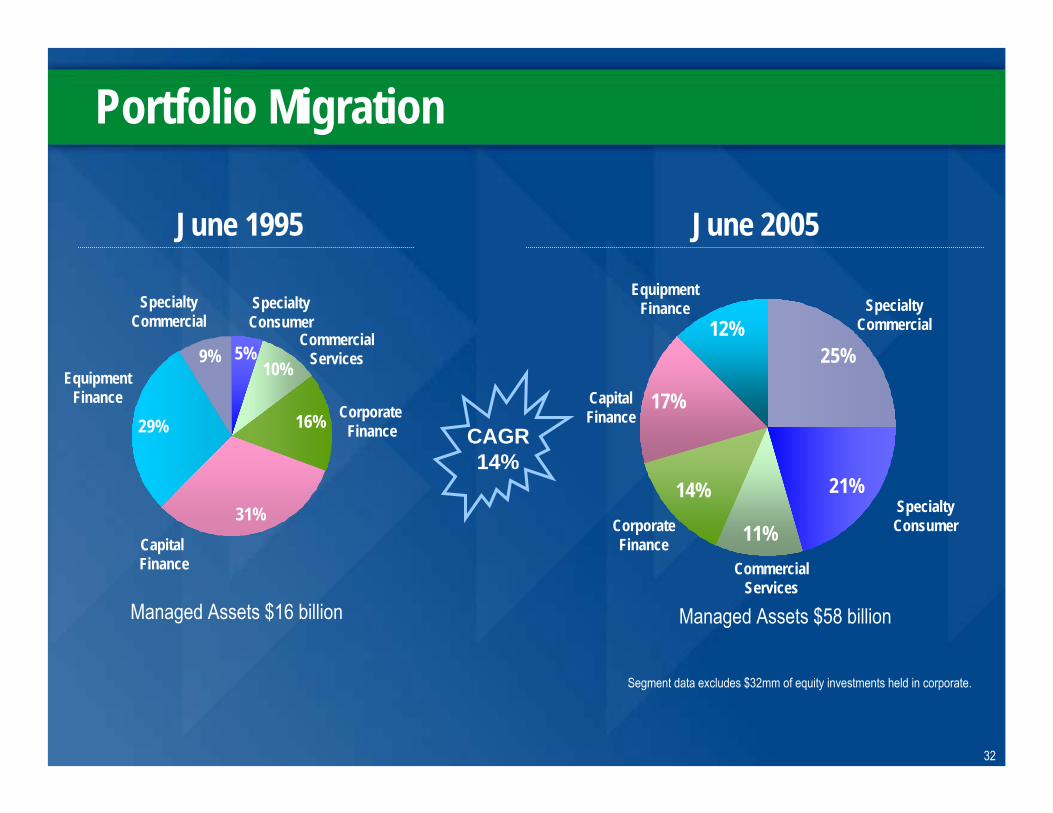
Portfolio Migration
Managed Assets $16 billion Managed Assets $58 billion
5%10%
16%
31%
29%
9%Commercial
Services
Capital Finance
SpecialtyConsumer
Corporate Finance
25%
21%
11%
14%
17%
12%
EquipmentFinance
CommercialServices
CapitalFinance
SpecialtyCommercial
SpecialtyConsumer Corporate
Finance
Segment data excludes $32mm of equity investments held in corporate.
June 1995 June 2005
CAGR14%
Equipment Finance
SpecialtyCommercial
33
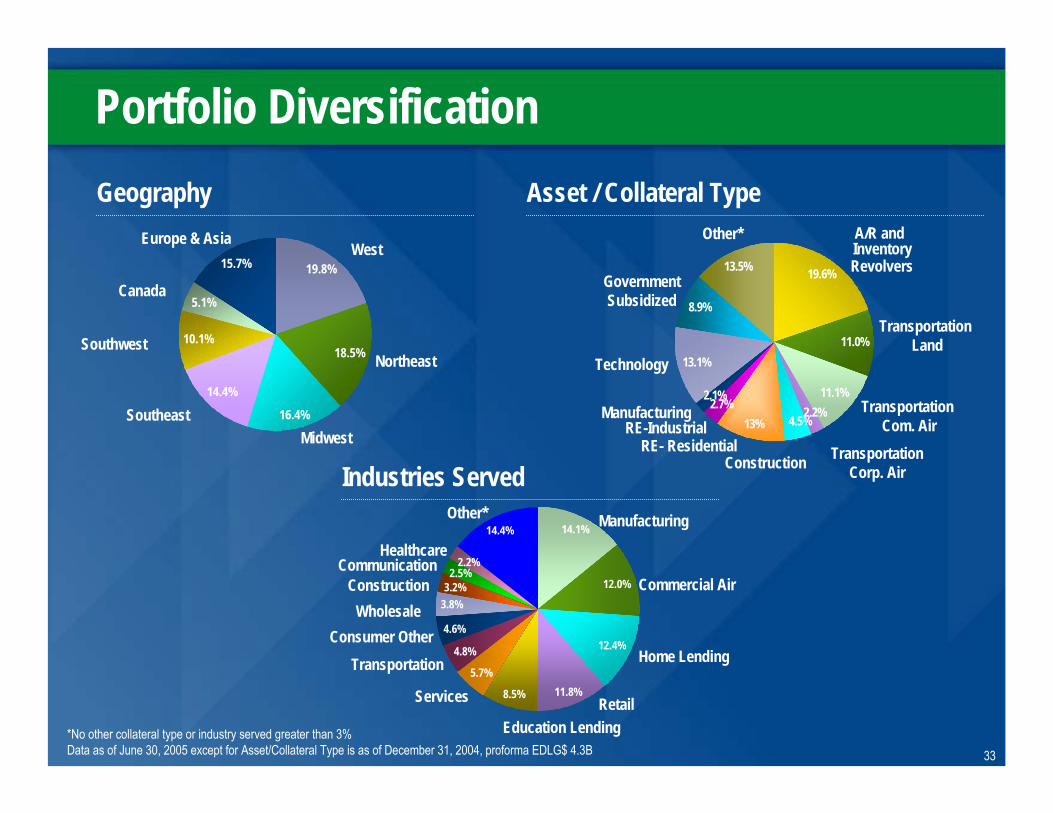
19.6%
11.0%
11.1%2.7%2.1%
13.1%
8.9%
13.5%
4.5%2.2%13%
19.8%15.7%
5.1%
10.1%
14.4%
16.4%
18.5%
14.1%
12.0%
12.4%
11.8%8.5%
5.7%
4.8%
4.6%
3.8%3.2%
2.5%2.2%
14.4%
Portfolio DiversificationGeography Asset / Collateral Type
Industries Served
Northeast
Europe & Asia
Canada
Southwest
SoutheastMidwest
WestA/R and Inventory Revolvers
Technology
Manufacturing
Construction
Transportation Land
Other*
RE- Residential
Manufacturing
Commercial Air
Home LendingTransportation
Services
Consumer Other
Construction Wholesale
CommunicationHealthcare
Other*
Retail
Transportation Com. Air
TransportationCorp. Air
RE-Industrial
*No other collateral type or industry served greater than 3%Data as of June 30, 2005 except for Asset/Collateral Type is as of December 31, 2004, proforma EDLG$ 4.3B
Education Lending
GovernmentSubsidized
34
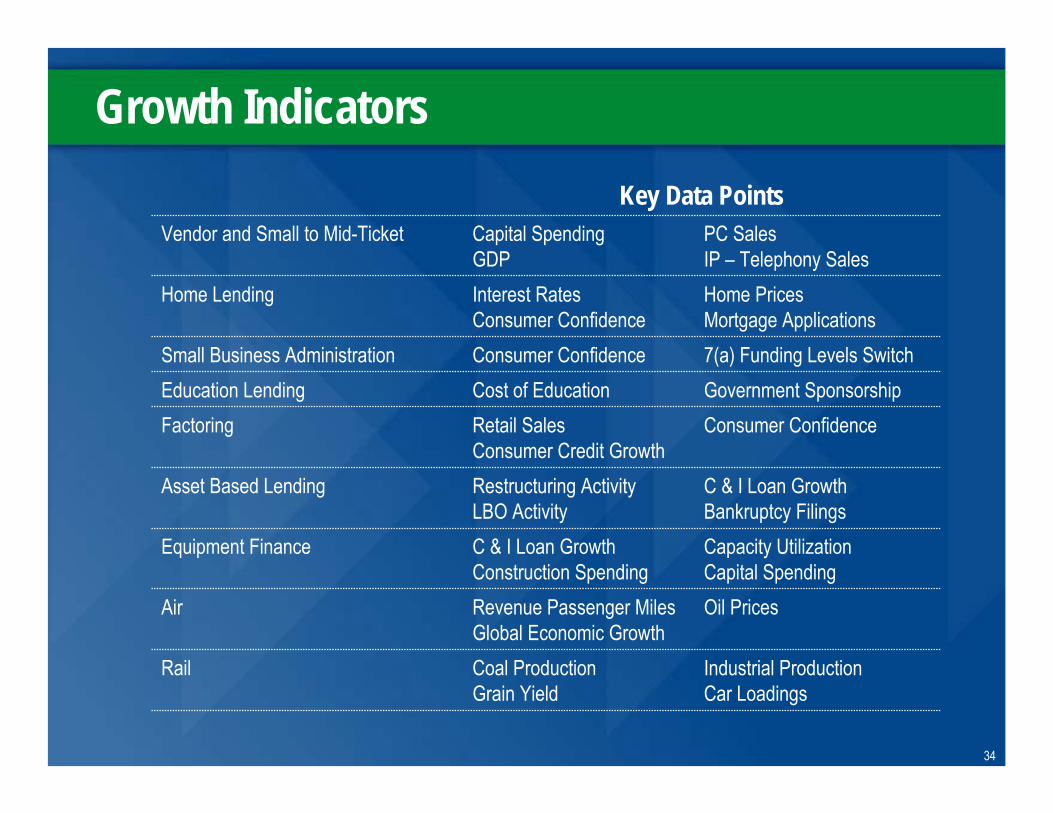
Growth Indicators
Industrial ProductionCar Loadings
Oil Prices
Capacity UtilizationCapital Spending
C & I Loan GrowthBankruptcy Filings
Consumer ConfidenceGovernment Sponsorship7(a) Funding Levels Switch
Home PricesMortgage Applications
PC SalesIP – Telephony Sales
C & I Loan GrowthConstruction Spending
Equipment Finance
Consumer ConfidenceSmall Business AdministrationCost of EducationEducation Lending
Restructuring ActivityLBO Activity
Asset Based Lending
Coal ProductionGrain Yield
Rail
Revenue Passenger MilesGlobal Economic Growth
Air
Retail SalesConsumer Credit Growth
Factoring
Interest RatesConsumer Confidence
Home Lending
Capital SpendingGDP
Vendor and Small to Mid-TicketKey Data Points
35
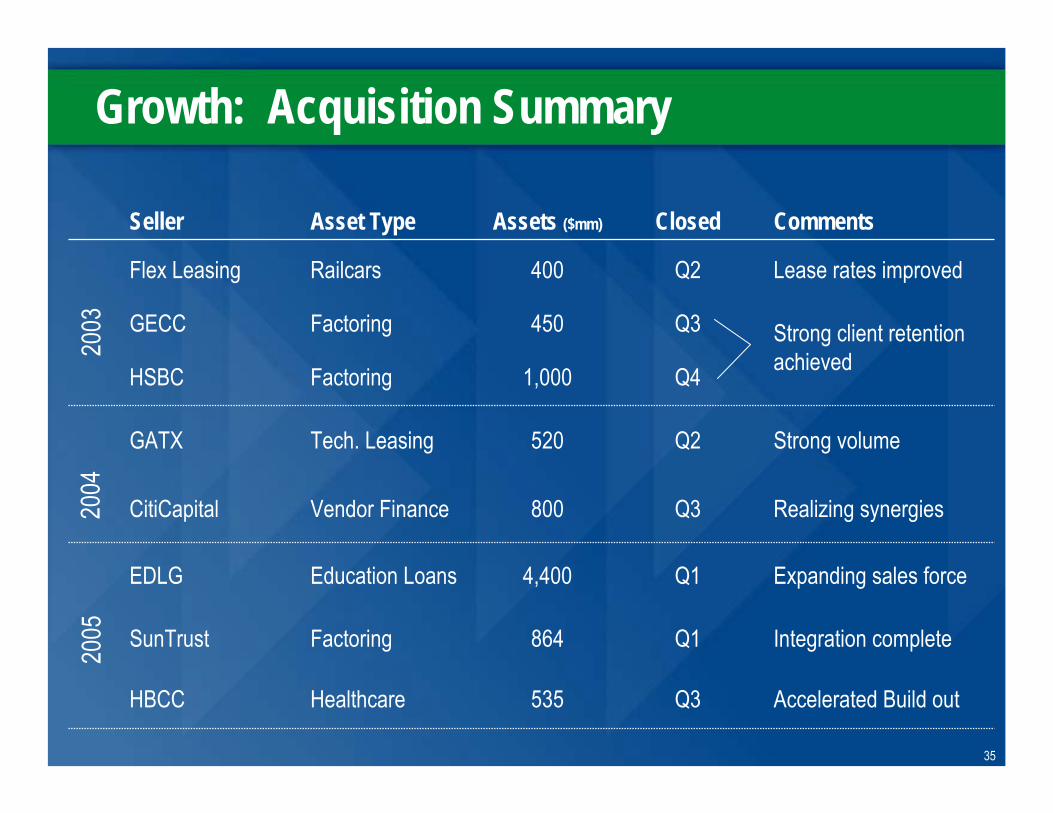
Growth: Acquisition Summary
Accelerated Build outQ3535HealthcareHBCC
Integration completeQ1864FactoringSunTrust
Expanding sales force
Realizing synergies
Strong volume
Strong client retention achieved
Lease rates improved
Comments
4,400
800
520
1,000
450
400
Assets ($mm)
Q1Education LoansEDLG
Q3Vendor FinanceCitiCapital
Q2Tech. LeasingGATX
Q4FactoringHSBC
Q3FactoringGECC
Q2RailcarsFlex Leasing
ClosedAsset TypeSeller
2003
2004
2005
36
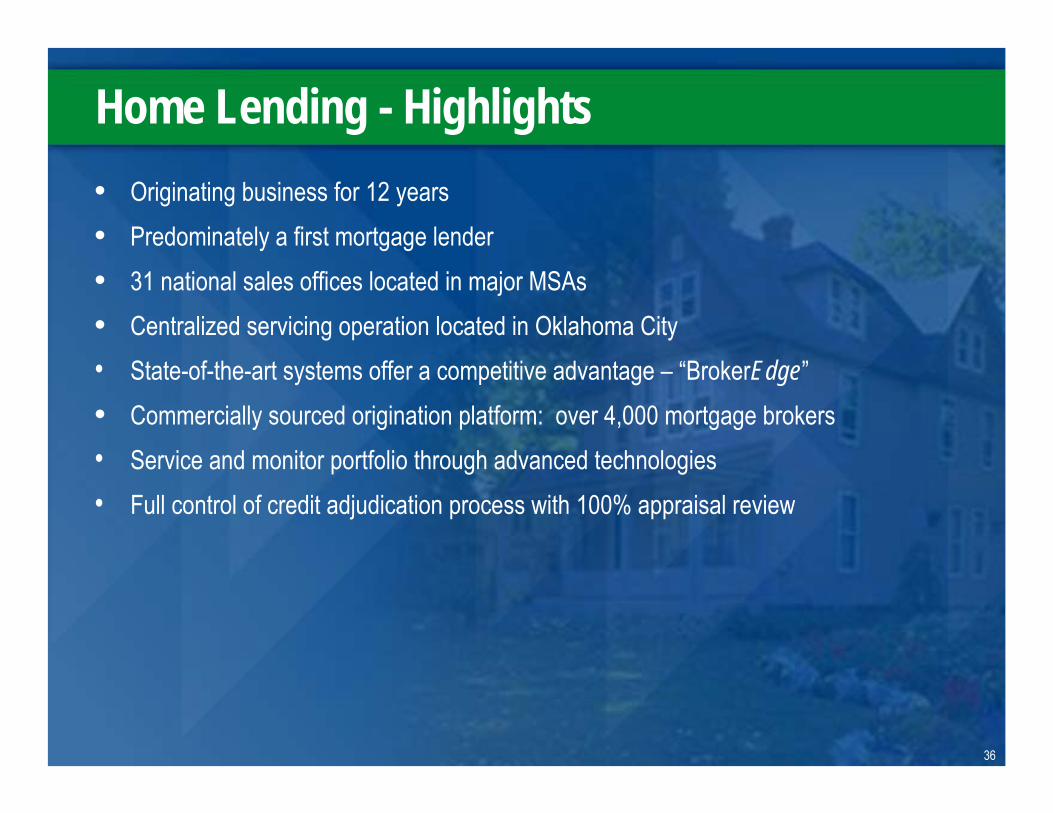
Home Lending - Highlights• Originating business for 12 years• Predominately a first mortgage lender• 31 national sales offices located in major MSAs• Centralized servicing operation located in Oklahoma City• State-of-the-art systems offer a competitive advantage – “BrokerEdge”• Commercially sourced origination platform: over 4,000 mortgage brokers• Service and monitor portfolio through advanced technologies• Full control of credit adjudication process with 100% appraisal review
36
37
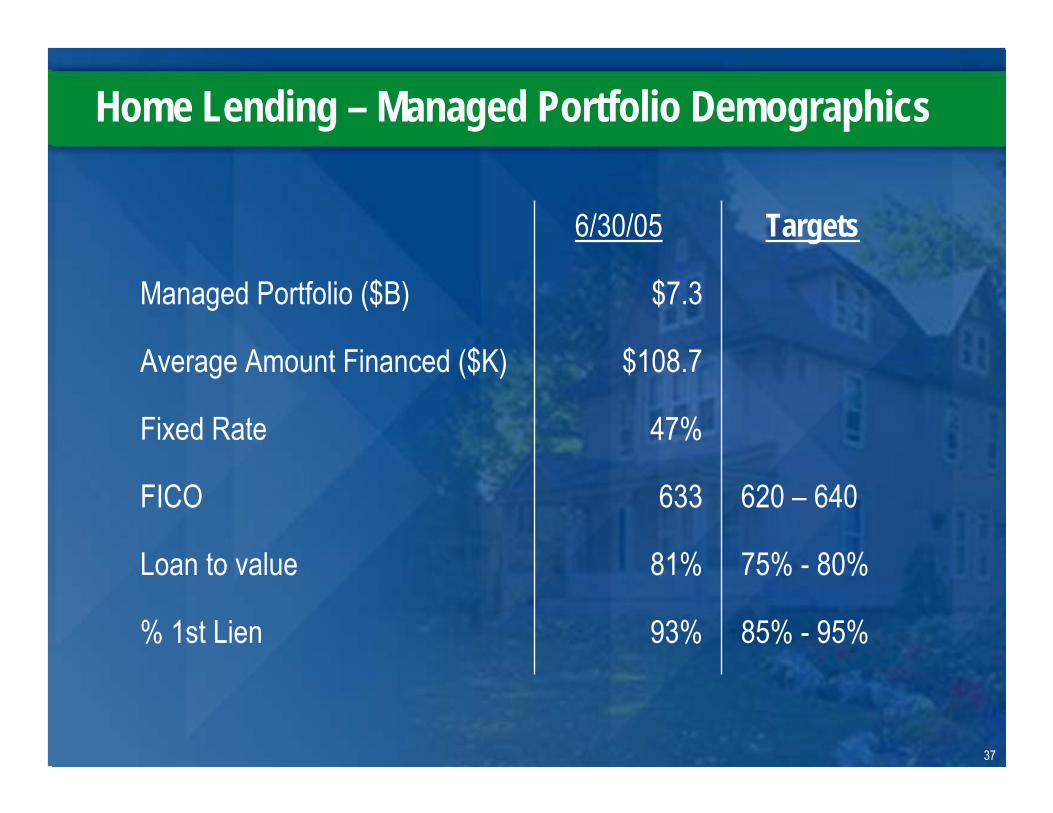
Home Lending – Managed Portfolio Demographics
37
Targets6/30/05
85% - 95%93%% 1st Lien
75% - 80%81%Loan to value
620 – 640633FICO
47%Fixed Rate
$108.7Average Amount Financed ($K)
$7.3Managed Portfolio ($B)
38
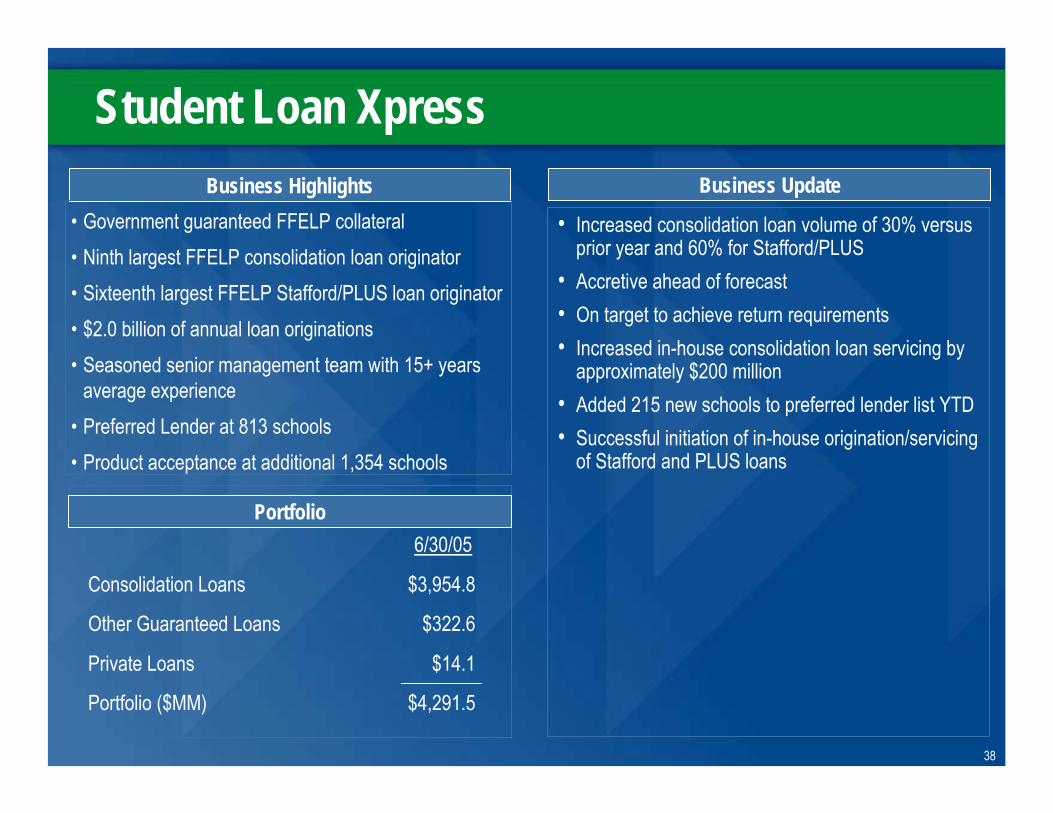
Student Loan XpressBusiness Highlights
• Government guaranteed FFELP collateral• Ninth largest FFELP consolidation loan originator• Sixteenth largest FFELP Stafford/PLUS loan originator • $2.0 billion of annual loan originations • Seasoned senior management team with 15+ years
average experience• Preferred Lender at 813 schools• Product acceptance at additional 1,354 schools
Portfolio
• Increased consolidation loan volume of 30% versus prior year and 60% for Stafford/PLUS
• Accretive ahead of forecast• On target to achieve return requirements• Increased in-house consolidation loan servicing by
approximately $200 million• Added 215 new schools to preferred lender list YTD• Successful initiation of in-house origination/servicing
of Stafford and PLUS loans
Business Update
$4,291.5Portfolio ($MM)
$14.1Private Loans
$322.6Other Guaranteed Loans
$3,954.8Consolidation Loans
6/30/05
39
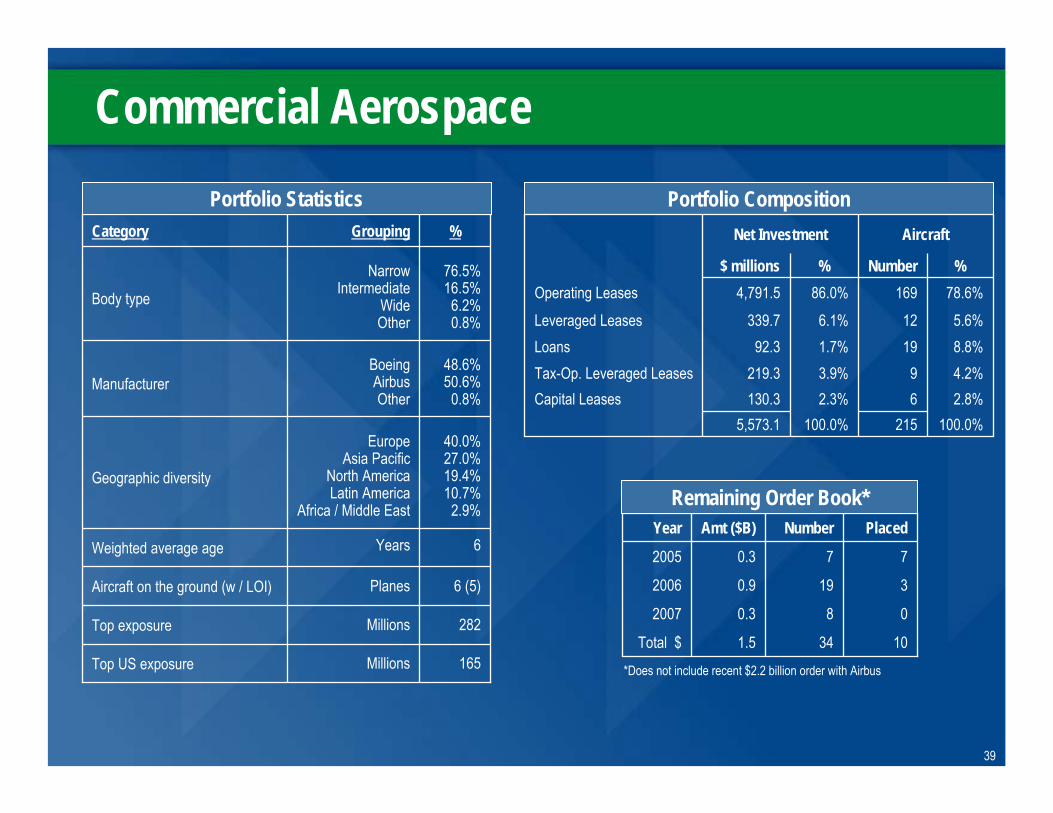
Portfolio Composition
Commercial Aerospace
AircraftNet Investment
100.0%215100.0%5,573.12.8%62.3%130.3Capital Leases4.2%93.9%219.3Tax-Op. Leveraged Leases8.8%191.7%92.3Loans5.6%126.1%339.7Leveraged Leases
78.6%16986.0%4,791.5Operating Leases%Number%$ millions
165MillionsTop US exposure
282MillionsTop exposure
Planes
Years
EuropeAsia Pacific
North AmericaLatin America
Africa / Middle East
BoeingAirbusOther
NarrowIntermediate
WideOther
Grouping
48.6%50.6%
0.8%Manufacturer
6 (5) Aircraft on the ground (w / LOI)
6Weighted average age
40.0% 27.0%19.4%10.7% 2.9%
Geographic diversity
76.5%16.5%
6.2% 0.8%
Body type
%Category
10341.5Total $
0 8 0.3 2007
3 19 0.9 2006
7 7 0.3 2005
PlacedNumberAmt ($B)Year
Portfolio Statistics
Remaining Order Book*
*Does not include recent $2.2 billion order with Airbus
40
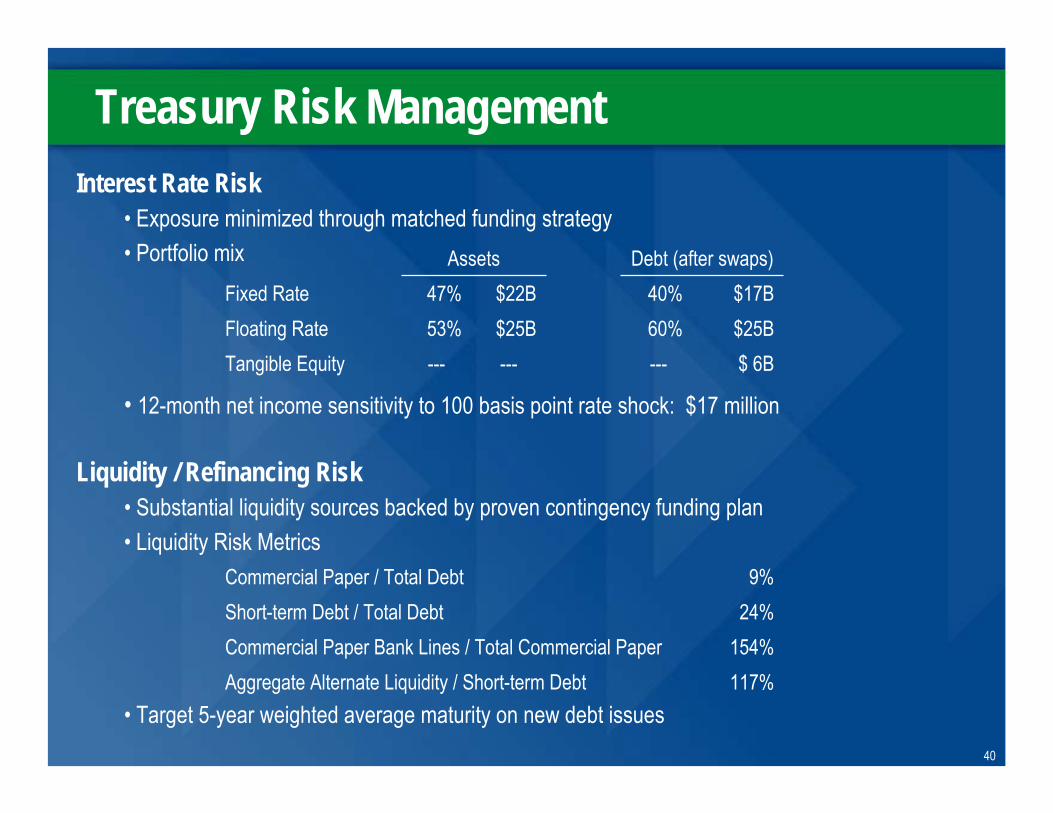
Treasury Risk ManagementInterest Rate Risk
• Exposure minimized through matched funding strategy• Portfolio mix
• 12-month net income sensitivity to 100 basis point rate shock: $17 million
Liquidity / Refinancing Risk• Substantial liquidity sources backed by proven contingency funding plan• Liquidity Risk Metrics
• Target 5-year weighted average maturity on new debt issues
$ 6B---------Tangible Equity$25B60%$25B53%Floating Rate$17B40%$22B47%Fixed Rate
Debt (after swaps)Assets
117%Aggregate Alternate Liquidity / Short-term Debt154%Commercial Paper Bank Lines / Total Commercial Paper24%Short-term Debt / Total Debt9%Commercial Paper / Total Debt
41
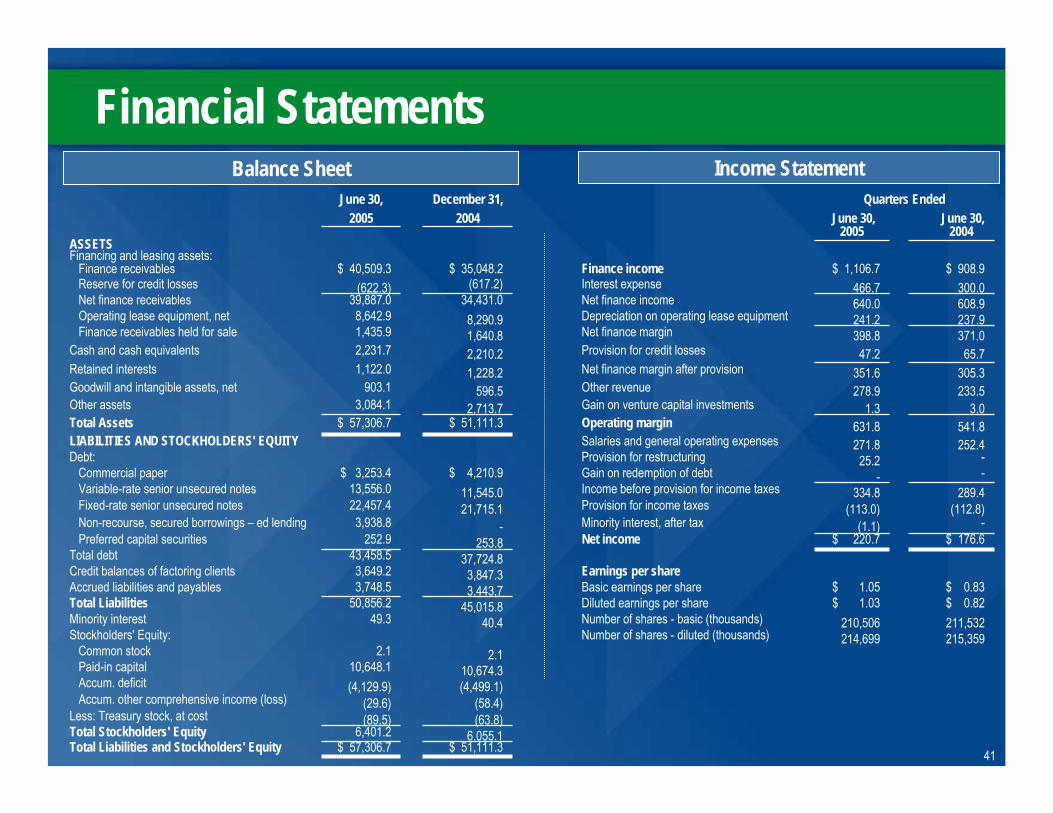
Financial Statements
$ 51,111.3 $ 57,306.7 Total Liabilities and Stockholders' Equity6,055.1 6,401.2 Total Stockholders' Equity
(63.8)(89.5)Less: Treasury stock, at cost(58.4)(29.6)Accum. other comprehensive income (loss)
(4,499.1)(4,129.9)Accum. deficit10,674.3 10,648.1 Paid-in capital
2.1 2.1 Common stock215,359 214,699 Number of shares - diluted (thousands)Stockholders' Equity:211,532 210,506 Number of shares - basic (thousands)40.4 49.3 Minority interest$ 0.82 $ 1.03 Diluted earnings per share45,015.8 50,856.2 Total Liabilities$ 0.83 $ 1.05 Basic earnings per share3,443.7 3,748.5 Accrued liabilities and payables
Earnings per share3,847.3 3,649.2 Credit balances of factoring clients37,724.8 43,458.5 Total debt
$ 176.6 $ 220.7 Net income253.8 252.9 Preferred capital securities-(1.1)Minority interest, after tax-3,938.8 Non-recourse, secured borrowings – ed lending
(112.8)(113.0)Provision for income taxes21,715.1 22,457.4 Fixed-rate senior unsecured notes289.4 334.8 Income before provision for income taxes11,545.0 13,556.0 Variable-rate senior unsecured notes
--Gain on redemption of debt$ 4,210.9 $ 3,253.4 Commercial paper-25.2 Provision for restructuringDebt:
252.4 271.8 Salaries and general operating expensesLIABILITIES AND STOCKHOLDERS' EQUITY541.8 631.8 Operating margin$ 51,111.3 $ 57,306.7 Total Assets
3.0 1.3 Gain on venture capital investments2,713.7 3,084.1 Other assets233.5 278.9 Other revenue596.5 903.1 Goodwill and intangible assets, net305.3 351.6 Net finance margin after provision1,228.2 1,122.0 Retained interests65.7 47.2 Provision for credit losses2,210.2 2,231.7 Cash and cash equivalents
371.0 398.8 Net finance margin1,640.8 1,435.9 Finance receivables held for sale237.9 241.2 Depreciation on operating lease equipment8,290.9 8,642.9 Operating lease equipment, net608.9 640.0 Net finance income34,431.0 39,887.0 Net finance receivables300.0 466.7 Interest expense(617.2)(622.3)Reserve for credit losses
$ 908.9 $ 1,106.7 Finance income$ 35,048.2 $ 40,509.3Finance receivablesFinancing and leasing assets:ASSETS
20042005June 30, June 30, 20042005
Quarters EndedDecember 31,June 30,
Balance Sheet Income Statement
42
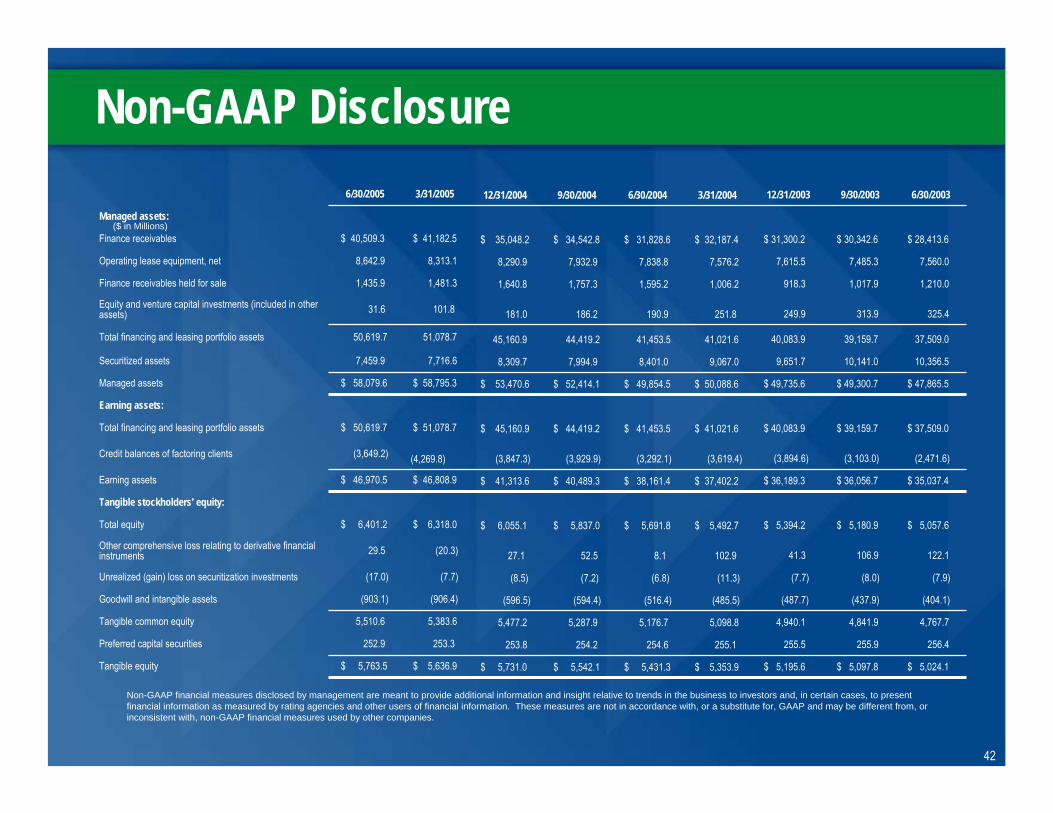
Non-GAAP Disclosure
Non-GAAP financial measures disclosed by management are meant to provide additional information and insight relative to trends in the business to investors and, in certain cases, to present financial information as measured by rating agencies and other users of financial information. These measures are not in accordance with, or a substitute for, GAAP and may be different from, or inconsistent with, non-GAAP financial measures used by other companies.
($ in Millions)
$ 5,024.1 $ 5,097.8 $ 5,195.6 $ 5,353.9 $ 5,431.3 $ 5,542.1 $ 5,731.0 $ 5,636.9 $ 5,763.5 Tangible equity
256.4 255.9 255.5 255.1 254.6 254.2 253.8 253.3 252.9 Preferred capital securities
4,767.7 4,841.9 4,940.1 5,098.8 5,176.7 5,287.9 5,477.2 5,383.6 5,510.6 Tangible common equity
(404.1)(437.9)(487.7)(485.5)(516.4)(594.4)(596.5)(906.4)(903.1)Goodwill and intangible assets
(7.9)(8.0)(7.7)(11.3)(6.8)(7.2)(8.5)(7.7)(17.0)Unrealized (gain) loss on securitization investments
122.1 106.9 41.3 102.9 8.1 52.5 27.1 (20.3)29.5 Other comprehensive loss relating to derivative financial instruments
$ 5,057.6 $ 5,180.9 $ 5,394.2 $ 5,492.7 $ 5,691.8 $ 5,837.0 $ 6,055.1 $ 6,318.0 $ 6,401.2 Total equity
Tangible stockholders' equity:
$ 35,037.4 $ 36,056.7 $ 36,189.3 $ 37,402.2 $ 38,161.4 $ 40,489.3 $ 41,313.6 $ 46,808.9 $ 46,970.5Earning assets
(2,471.6)(3,103.0)(3,894.6)(3,619.4)(3,292.1)(3,929.9)(3,847.3)(4,269.8)(3,649.2)Credit balances of factoring clients
$ 37,509.0 $ 39,159.7 $ 40,083.9 $ 41,021.6 $ 41,453.5 $ 44,419.2 $ 45,160.9 $ 51,078.7 $ 50,619.7Total financing and leasing portfolio assets
Earning assets:
$ 47,865.5 $ 49,300.7 $ 49,735.6 $ 50,088.6 $ 49,854.5 $ 52,414.1 $ 53,470.6 $ 58,795.3 $ 58,079.6 Managed assets
10,356.5 10,141.0 9,651.7 9,067.0 8,401.0 7,994.9 8,309.7 7,716.6 7,459.9Securitized assets
37,509.0 39,159.7 40,083.9 41,021.6 41,453.5 44,419.2 45,160.9 51,078.7 50,619.7 Total financing and leasing portfolio assets
325.4 313.9 249.9 251.8 190.9 186.2 181.0 101.8 31.6 Equity and venture capital investments (included in other assets)
1,210.0 1,017.9 918.3 1,006.2 1,595.2 1,757.3 1,640.8 1,481.3 1,435.9 Finance receivables held for sale
7,560.0 7,485.3 7,615.5 7,576.2 7,838.8 7,932.9 8,290.9 8,313.1 8,642.9Operating lease equipment, net
$ 28,413.6 $ 30,342.6 $ 31,300.2 $ 32,187.4 $ 31,828.6 $ 34,542.8 $ 35,048.2 $ 41,182.5 $ 40,509.3 Finance receivables
Managed assets:
6/30/20039/30/200312/31/20033/31/20046/30/20049/30/200412/31/20043/31/20056/30/2005