jari kuusisto jeroen p.j. de jong fred gault … · jeroen p.j. de jong fred gault christina raasch...
TRANSCRIPT

Consumer Innovation in Finland
JARI KUUSISTOJEROEN P.J. DE JONGFRED GAULTCHRISTINA RAASCHERIC VON HIPPEL
PROCEEDINGS OF THE UNIVERSITY OF VAASAREPORTS 189
Incidence, Diffusion and Policy Implications

Vaasan yliopisto – University of Vaasa
PL 700 – P.O. Box 700 (Wolffintie 34) FI–65101 VAASA Finland
www.uva.fi ISBN 978–952–476–496–4 (print) ISBN 978–952–476–497–1 (online)
ISSN–L 1238–7118 ISSN 1238–7118 (print) ISSN 2323–6833 (online)
© Vaasan yliopisto

Consumer Innovation in Finland
Incidence, diffusion and policy implications
September 2013
Jari Kuusisto University of Vaasa
Vaasa, Finland
Jeroen P.J. de Jong RSM Erasmus University
Rotterdam, the Netherlands
Fred Gault UNU Merit
Maastricht, the Netherlands
Christina Raasch TU Munich School of Management
München, Germany
Eric von Hippel MIT Sloan School of Management
Cambridge, MA, USA This report incorporates all findings of the InFi (Development of Statistical Indi-cators of User Innovation in Finland) project, which aimed to measure innovation development and diffusion by individual consumers in Finland, and to identify policy implications. The project was funded by the Ministry of Employment and the Economy and Tekes – The Finnish Funding Agency for Technology and In-novation. The findings and recommendations in this report are on behalf of the authors and do not necessarily represent those of the Ministry or Tekes.


V
EXECUTIVE SUMMARY
The InFi-project at hand is covering important new ground by analyzing innova-tion behavior among individual consumers. The objectives of the project were to:
1. Measure the intensity and diffusion of consumer innovations in Finland
2. Develop indicators that enable monitoring of consumer innovation
3. Inform policy makers and businesses on the implications of consumer in-novation
The first survey data collection cycle (2010–2011) and analysis was aimed to im-prove the consumer innovation measurement tool. The second cycle (2011–2013) consists of three surveys that obtained responses from 3,167 Finnish citizens. The three samples are: a) a representative sample of 993 Finnish consumers aged 18 to 65, b) 1,055 Finnish consumers who were likely to be innovative, and c) 1,119 medical sector respondents (patients and caregivers, nurses and doctors).
The results show that consumer innovation is a significant phenomenon in Fin-land. In the population of 18 to 65 years Finns, 5.4 percent has engaged in inno-vation for personal need during in the past three years time. More precisely, these citizens have created at least one new item for personal use to fix an everyday problem. Following the consumer innovation definition, innovations that were job related, already available on the market, or developed for commercial reasons, were excluded from the data. Based on the analysis we can estimate that there are 172,640 consumer innovators among the 3,197,037 Finnish citizens aged 18 to 65. Earlier results from the United Kingdom, Netherlands, the U.S.A., and Japan provide an international benchmark. In this comparison, Finnish consumers are as active innovators as consumers in the other countries. Their innovations cover a broad range from software to tools, equipment, household fixtures and many oth-er kinds.
In the medical sector sample 41 percent out of 1,119 respondents reported a spe-cific problem. More than 8 percent (out of the analyzed 310 cases) also identified at least one specific solution to the encountered problem within the last 3 years time. Reported problems and solutions cover the health care process from making appointment to referral, diagnosis, therapy, and from medical institute related issues to home care. However, only 1.7 percent of the identified innovative solu-tions were realized, mainly due to complex decision-making processes and lack of resources. This highlights a substantial share of lost healthcare innovation oppor-tunities, particularly in the patient innovation domain.

VI
Diffusion of consumer innovations is a critical factor because lack of it implies a loss in terms of general welfare. In the case of consumer innovation there are three diffusion channels, peer-to-peer, new venture creation and adoption by ex-isting producers. When comparing the consumer innovation diffusion rate with other countries, Finland is doing relatively well. In terms of peer diffusion and producer adoption, the Finnish diffusion rate of 18.8 percent is similar to the United Kingdom (17.1%), and clearly higher than in the U.S.A. (6.1%) and in Japan (5.0%). Nevertheless, around 80 percent of all consumer innovations do not become available for the wider society, indicating a potential welfare loss. The implications for innovation policy and options for potential interventions are dis-cussed in the final parts of the report.

VII
Contents
EXECUTIVE SUMMARY ................................................................................... V
1 INTRODUCTION ............................................................................................ 1
2 THEORETICAL BACKGROUND ............................................................... 10
3 FREQUENCY OF CONSUMER INNOVATION ........................................ 16 3.1 Consumer innovation incidence rate ................................................... 16 3.2 Demography ........................................................................................ 20 3.3 Motives and innovation process .......................................................... 21
4 DIFFUSION OF CONSUMER INNOVATION ........................................... 26 4.1 Frequency of diffusion ......................................................................... 27 4.2 Perceived value of innovations ............................................................ 29 4.3 Willingness to share ............................................................................. 30 4.4 Diffusion effort and intentions ............................................................. 33 4.5 Diffusion failure ................................................................................... 35
5 CASE STUDY: CONSUMER INNOVATION IN HEALTHCARE ............ 38 5.1 Incidence of innovative problem solving by patients, nurses and
doctors .................................................................................................. 39 5.2 Focal points .......................................................................................... 41 5.3 Who are the consumer innovators? ...................................................... 42 5.4 Innovation process ............................................................................... 43 5.5 Implementation .................................................................................... 46 5.6 Summary .............................................................................................. 47
6 NEW SURVEY METHODS AND INDICATORS ....................................... 49 6.1 Consumer samples ............................................................................... 49 6.2 Firm samples ........................................................................................ 53
7 POLICY IMPLICATIONS ............................................................................ 58 7.1 Recommended policy measures .......................................................... 62
8 CONCLUDING REMARKS ......................................................................... 76
REFERENCES ..................................................................................................... 78
APPENDICES ...................................................................................................... 84 A: Pilot studies .......................................................................................... 84 B: Main study ........................................................................................... 95 C: Survey script ...................................................................................... 102

VIII
Figures
Figure 1. Consumer innovation as a sub-category of user innovation – a conceptual hierarchy ....................................................................... 1
Figure 2. Consumer innovation and its potential diffusion routes .................... 2 Figure 3. User-centered model of innovation. ................................................. 14 Figure 4. Key antecedents of consumer innovation diffusion. ........................ 27 Figure 5. Overview of problems described by problem focus. ....................... 41 Figure 6. Potential areas for policy interventions promoting knowledge
transfer arising from consumer innovation. ..................................... 60 Figure 7. Sequence of high-threshold questions to identify consumer
innovation in software (example). ................................................... 86
Tables
Table 1. Frequency of user innovation in broad samples of consumers. . 17 Table 2. Potential broader value of user innovation by consumers in
Finland. ....................................................................................... 18 Table 3. Objects of consumer innovations in Finland, and examples of
possible general interest. ............................................................ 19 Table 4. Frequency of consumer innovation for selected demographic
groups, across countries. ............................................................ 20 Table 5. Frequency of consumer innovation in Finland across
demographic groups. .................................................................. 21 Table 6. Motives of Finnish consumers to innovate. ................................ 22 Table 7. Share of consumer innovations developed in collaboration with
other people. ............................................................................... 23 Table 8. Expenditures on most recent consumer innovations. ................. 24 Table 9. Share of consumer innovations protected with intellectual
property rights. ........................................................................... 25 Table 10. Diffusion of consumer innovations in Finland. .......................... 28 Table 11. Share of consumer innovations adopted by other users or firms
across countries. ......................................................................... 28 Table 12. Personal value of consumer innovations. ................................... 29 Table 13. Perceived general value of consumer innovations. .................... 30 Table 14. Willingness to share consumer innovations. .............................. 31 Table 15. Motives to share consumer innovations for free. ....................... 32 Table 16. Preferred types of compensation by innovators willing to share
for compensation. ....................................................................... 33 Table 17. Effort by innovators to diffuse consumer innovations. .............. 34 Table 18. Activities employed by consumer innovators to inform other
people. ........................................................................................ 35 Table 19. Intentions to diffuse consumer innovations. ............................... 35 Table 20. Diffusion of consumer innovations in various clusters of
perceived general value. ............................................................. 36

IX
Table 21. Frequency of problem identification and problem solving by users in the medical sector. ........................................................ 39
Table 22. Examples of problems and solutions in the healthcare sector (quotes). ..................................................................................... 40
Table 23. Consumer innovation by intensity of need. ............................... 43 Table 24. Motives to innovate of users in the Finnish medical sector. ...... 44 Table 25. Contributions by others. ............................................................. 44 Table 26. Resources used for innovation. .................................................. 45 Table 27. Frequency of implementation of solutions. ............................... 46 Table 28. Value of the solution to the innovator, and to others. ................ 47 Table 29. Indicators for the incidence and nature of user innovation by
consumers. ................................................................................. 52 Table 30. Diffusion of user innovation in official statistics. ...................... 56 Table 31. Consumer innovation promotion – a policy classification. ....... 62 Table 32. Recommended policies for consumer innovation. ..................... 63 Table 33. Characteristics of pilot surveys. ................................................. 86 Table 34. Examples of validated innovations and false positives. ............ 89 Table 35. Share of consumer innovators and validation innovations in
various pilot surveys. ................................................................. 90 Table 36. Share of consumer innovators when functional novelty
criterion is ignored. .................................................................... 91 Table 37. Validity of various procedures to identify consumer
innovators. .................................................................................. 92 Table 38. Demographics of respondents in broad consumer survey and
Finnish population. .................................................................... 96 Table 39. Demographics of respondents in the survey of likely
innovators. .................................................................................. 98


1 INTRODUCTION
Innovation by consumers represents a significant but almost unknown element of innovation activities that exist across the society. While goods and services relat-ed innovation by consumers has existed in various forms for very long time, new technologies such as the Internet have given a significant boost to consumer inno-vation and increased its diffusion potential. Consumer innovation is highly dis-tributed and democratic activity, closely linked to our everyday lives. Increasing innovation activity by consumers is changing the traditional view where only few genius individuals and firms innovate.
Due to the lack of research on the area, the scope and nature of consumer innova-tion has remained almost unknown territory. However, researchers and policy makers e.g. in the US, UK, Netherlands, Japan, and Denmark (see von Hippel, de Jong & Flowers 2010) have started to show increasing interest in the scope, inten-sity and diffusion of consumer innovation. In 2010, the Ministry of Employment and the Economy of Finland launched a specific policy programme to analyze and stimulate demand and user-driven innovation (Ministry of Employment and the Economy 2010). The research at hand contributes to this Finnish policy initiative by exploring the scope, intensity and diffusion of user innovation among Finnish consumers.
Consumer innovation as a phenomenon
Starting from the actors, the focus of this research is on consumer innovation by individual end-users and user communities.
Figure 1. Consumer innovation as a sub-category of user innovation – a con-ceptual hierarchy.
User%innova+on%
Innova+on%by%user%firms%Consumer%innova+on%

2 Proceedings of the University of Vaasa. Reports
In terms of motivation to innovate, consumer innovators (like innovating user firms) are innovating for themselves, driven by their own needs, rather than by the aim to sell novel items on the markets1. Consequently, consumer innovators are often motivated to innovate by everyday problems they face, or a need to im-prove existing products, services or processes. Importantly, when users can inno-vate for themselves, they can develop exactly what they want. Many products, (goods and services) and processes are actually developed or at least refined, by users, in the context of implementation and use. Commercial products are of-ten/mostly developed to achieve corporate objectives. In the case where individu-al users face problems that the majority of consumers do not, they may develop their own modifications to existing products, or entirely new products, to solve their issues.
Some of the solutions developed by consumers could benefit a substantial number of other users and their wide availability could enhance social welfare. In the case of free revealing, consumer innovators will share their ideas in hope of having the benefits shared within wider community. Commercialization is another route for diffusion of consumer innovations. It can be carried out by user entrepreneurs or by the established producer firms. Finally, consumer innovations may also diffuse informally from peer to peer. The pivotal question is, how large share of poten-tially useful consumer innovations do actually diffuse and benefit the wider socie-ty?
Figure 2. Consumer innovation and its potential diffusion routes.
1 In addition to consumers, also intermediate users, e.g. user firms can be called user innovators.
This is the case as long as these firms innovate for their own internal needs.
2.#Community#of#prac1ce#or#a#peer#group#
4.#Start6up#business#
3.#Producer#business#
1. Consumer#innova1on###intensity#
#

Proceedings of the University of Vaasa. Reports 3
Figure 2 illustrates the key elements of consumer innovation discussion in this paper. The first topic (1) concerns consumer innovation intensity in Finland. Oth-er three segments of the figure illustrate the potential diffusion options for con-sumer innovation from the individual consumer innovation can spread to wider community in three different ways, to producer business, community of practice or as a new business start-up that commercializes consumer innovation. Similarly, from the community of practice innovation may spread to producer firms or it may be commercialized by a new start-up business. Finally, producer firm may spin off consumer innovation commercialization for a new start-up firm.
Target audiences and value of the research
This report delivers value for several different stakeholder groups including poli-cy makers, businesses, consumers and the research community. Policy makers are under increasing pressure to deliver innovation policy that maximizes impacts on economic growth and sustainable development. While consumer innovation stands out as a major innovation activity, so far it has attracted very limited atten-tion from policy makers. InFi-project takes on an important task in measuring consumer innovation and bringing it closer to the core of the innovation policy debate.
In order to be mitigated by innovation policy, any barriers/hindrances to innova-tion activity (including innovation by consumers) should be identified, measured and specified (Edquist 2013). This is achieved by measuring the scope, intensity and diffusion of consumer innovation in Finland. In this context, key policy rele-vant problems include possible low innovation intensities (based on international comparison), or limited diffusion of consumer innovations (limiting the impact on wider society). Such problems have a negative influence on innovation system as well as the wider Finnish society.
For businesses that build their success and competitiveness on innovation, empir-ical research on consumer innovation provides valuable information. The im-portance of open innovation and user innovation activities is accentuated as the focus of innovation management in companies is radically shifting from the man-agement of internal R&D towards effective orchestration of open innovation and relevant parts of the ecosystems. This new reality signifies a major management challenge and has a profound impact on the competitiveness and growth of Finn-ish businesses.
4 Proceedings of the University of Vaasa. Reports
Citizens and societies are challenged by diminishing budgets that restrict the role of the public sector as societal problems solver. Here again user innovation can play a pivotal role. The results of this study can contribute to the general aware-ness of user innovation and its problem solving potential among citizens and the public sector. The key realization is that innovation is within the reach of many, not an exclusive activity for the selected professionals working within R&D la-boratories. Instead, even those who are not in innovative jobs or businesses may still take charge and proactively improve their everyday lives and contribute to wider society. This happens when citizens and public sector actors are innovating for themselves or when they adopt innovations that some of their peers are willing to share.
The innovation research community benefits from the InFi-project through new empirical knowledge as well as through the cost efficient tools and methods de-veloped in the project for measuring and monitoring consumer innovation. These new tools and methods can advance the production of user innovation statistics, not only in Finland but also in other countries that have interest in the topic.
The emerging role of user innovator
In the mainline thinking, innovation activities are seen to be the domain of com-mercial businesses and research organizations that design, develop and commer-cialize new technologies for users who are mainly seen as passive adopters. This producer-centered view, inspired by the pioneering work of Schumpeter (1934), has characterized innovation models generation after generation. The producer centred view has persisted from the first 1950’s linear innovation model all the way to recent System Integration and Networking models (Rothwell 1994; Edquist & Hommen 1999; Edquist 2011). Over the years, these models have had a tremendous impact on management and innovation policies which continue to target producers. Typically, policy interventions are based on three main types of instruments; regulations, economic transfers and soft instruments (Borrás & Edquist 2013). Specific instruments include intellectual property rights, R&D&I subsidies, tax credits, public-private partnerships, subsidies for producers of knowledge and voluntary standardization (Tsipouri, Reid & Miedzinski 2008).
However, an increasingly important innovation model revolves around users, consumers or firms, who in the first instance innovate to satisfy their own needs, rather than to sell a product on the market (von Hippel 2005). According to the user-centered model, many innovations are first being developed by communities of users who divide up the tasks and costs of innovation development, and then often freely reveal their results. In terms of motivation to innovate, successful
Proceedings of the University of Vaasa. Reports 5
innovators obtain direct use benefits from their efforts. Moreover, enjoyment, learning, reputation, or an increased demand for complementary goods and ser-vices provide further motivation for the user innovators.
Baldwin and von Hippel (2011) argue that user innovation is increasingly chal-lenging and even displacing producer innovation in many parts of modern econ-omies. Such a shift is driven by steadily improving design tools (including inno-vation toolkits) and recent advances in ICT. These are creating better collabora-tion opportunities with other users over the Internet. Hence, an increasing number of citizens are capable of solving their own problems.
The increasing importance of user innovation has implications for both innovation management and innovation policymaking. In the world of producer innovation, policy interventions are typically justified by systemic failures or market failures. Both of these types of failures can be argued to exist in the case of user innova-tion. Systemic failure includes weak links between innovation system actors (many of the actors hardly recognize user innovators), missing or inappropriate institutions (e.g. IPR system and regulation from the user innovators’ perspec-tive), and missing organizations (e.g. consumer innovator lobby) (Edquist 2001). According to the OECD (1998: 102), systemic failure consists of ‘mismatches between the components of innovation system’. Apparently, the described mis-matches hamper the optimal performance of the innovation system, leading to welfare losses that call for policy intervention.
Market failures include lack of appropriation, uncertainty and indivisibility of investments. These discourage producers from engaging in innovation (Arrow 1962). When innovations are developed for personal need, many of the market failure arguments no longer apply. However, there is a social welfare loss if the diffusion of user innovations is insufficient (Henkel & von Hippel 2005) justify-ing policy intervention. In the case of commercial businesses, the locus of innova-tion development is moving from strictly internal R&D towards more open inno-vation activities. Here, businesses need to become aware and learn new innova-tion practices in order to benefit from user innovation inputs and the solutions that some users have developed for themselves (von Hippel 1986).
Finland has gained a reputation as one of the leading countries in the field of in-novation policy. It was among the first countries to recognize users as a potential and alternative source of innovation (FORA 2009). Moreover, Finland has launched a systematic policy programme for promoting various forms of demand and user-driven innovation. Finland is pioneering with new policy instruments promoting user innovation, including direct innovation support for individual consumers and communities, innovation adoption and the interaction between

6 Proceedings of the University of Vaasa. Reports
users and commercial businesses and public research organizations, and initia-tives with the objective that incumbent producers may better account for this al-ternative source of innovation (TEM 2010; TEM 2011; Research and Innovation Council 2010). As part of this larger policy effort, the Finnish Ministry of Em-ployment and the Economy and Tekes have funded innovation research on this field.
Objectives of the InFi-project
This research focuses on the measurement of consumer innovation (rather than by innovating businesses), development of innovation indicators, diffusion of con-sumer innovation, user innovation in the medical field and identification of policy implications. Early studies of user innovation demonstrated its significance in many specific consumer and industrial areas (von Hippel 2005), while in later years, researchers have demonstrated the importance of user innovation of broad-er samples of firms, finding that firms regularly develop innovations for internal use or to satisfy specific process-related needs (e.g., de Jong & von Hippel 2009; Flowers et al. 2010).
The InFi-project is covering new ground by focusing on innovation by individual consumers. Thus far, the general assumption has been that they do not engage in it. This explains the absence of consumer innovation indicators from the official surveys.
The objectives of the project were threefold: A. To measure the intensity and diffusion of user innovations by consumers in
Finland, including the amount, cost and significance of innovation activities and conditions under which consumer innovations spread across the society.
B. To develop indicators that enable longer-term monitoring of innovation by consumers.
C. To inform policy makers and businesses on the consequences of innovation by citizens for innovation and related policy-making and strategy develop-ment.
The consumer surveys conducted within the project, builds on recent work done in the United Kingdom (von Hippel et al. 2012), the Netherlands (de Jong 2011a), as well as Japan and the US (Ogawa & Pongtalenert 2011). Beyond measuring the frequency of innovation by Finnish consumers, it was explored to what extent, and when, innovations diffuse. This is critical from the social welfare perspective. In the absence of diffusion, users with similar needs need to invest in similar in-novations – or even worse, they may not at all succeed in obtaining a similar solu-

Proceedings of the University of Vaasa. Reports 7
tion. Since a reliable measuring method for user innovation by consumers is still missing, pilot studies were conducted with the aim to improve the measurement of consumer innovation.
Medical sector survey represents a specific case focus in the study. Telephone survey targeted patients, caregivers (nurses) and doctors exploring how individual patients and professionals innovate and what types of diffusion mechanisms exist in this context. In addition to the specifics of healthcare related innovation, the results can be analyzed against the broader consumer innovation sample. Also, public sector innovation is important in Finland, and the case study is helpful to find out if and how user innovation principles can be helpful to stimulate innova-tion in the healthcare sector. Finally, the paper presents ideas on how policy mak-ers can develop more effective interventions to stimulate the development and diffusion of innovations by consumers.
Research methodology
The research included two cycles of data collection and reporting. The first cycle (December 2010–November 2011) was aimed to improve the measurement of consumer innovation. It builds on previous consumer surveys (UK, Netherlands, Japan, USA) in order to further develop indicators, and alternative scripts to iden-tify innovators in broad consumer samples. In the next phase, these scripts were tested in a range of telephone and Internet surveys amongst Finnish citizens with an education for a technical profession. Developed screening procedure is utilized in the second cycle and it can be applied in the future research that is tracing in-novating consumers. The procedure works best with telephone surveys, but may also be applied in an electronic format.
The second cycle (December 2011–March 2013) was the main phase of the pro-ject where three electronic surveys of Finnish citizens were conducted:
• Survey #1 was completed by a representative sample of 993 Finnish con-sumers aged 18 to 65. It applied the developed screening procedure to identify respondents had realized at least one user innovation within the past three years. Innovations which were not developed during the re-spondents leisure time, were excluded. Also homebuilt versions of exist-ing products, and innovations primarily motivated by commercial consid-erations were excluded. Finally, open-ended descriptions of what respond-ents did, were collected as a way to ensure that only validated innovation cases were analyzed. Survey #1 was used to report on the incidence (in-

8 Proceedings of the University of Vaasa. Reports
tensity) of user innovation by Finnish consumers, and the demographic profile of innovators.
• Survey #2 was targeting 1,055 Finnish consumers who were likely to be innovative. From past research it has been learned that consumer innova-tors are more likely to be highly-educated, with a technical background, and male. Open invitations were sent to the members of a range of rele-vant professional unions (engineers, architects, highly educated, manufac-turing/blue collar workers) to take part in the electronic survey. The sur-vey script was nearly identical with the first survey. In both surveys, the analysis focused on specific innovation cases that respondents had identi-fied and described. Combining the both surveys, complete responses were obtained for 176 validated innovations. Respondents’ motives to innovate, innovation collaboration, investments and protection of their innovations with intellectual property rights were measured. Moreover, patterns of dif-fusion were explored by asking for the perceived general value of the in-novation, respondents’ willingness to share, actual efforts done to inform others about the innovation, and last but not least, if the innovation had diffused to others. Three modes of innovation diffusion were distin-guished, including new venture creation, adoption by commercial produc-ers, and peer-to-peer sharing with other consumers.
• Survey #3 was for a case study in the medical sector in which we targeted patients, caregivers (nurses) and doctors. Data were obtained from 571 pa-tients and relatives, 248 nurses, 211 doctors, and 89 other medical profes-sionals. It was explored if those in professional roles develop different in-novations with different diffusion mechanisms – to see if the findings are robust in a context beyond individual consumers. Also, public sector in-novation is important in Finland, and the case study is helpful to find out if and how user innovation principles can be helpful to stimulate innova-tion in the public sector.
The structure of the report
The report starts with introduction and a brief exposition of user innovation theo-ry. Chapter 2 elaborates on the user-centered innovation model, and discusses key differences with the traditional, producer-centered model of innovation. Chapter 3 presents the empirical findings on the incidence / intensity) of user innovation among Finnish consumers.
The empirical findings in full can be found in Chapters 3 to 5. Chapter 3 gives details on the share of innovators in the population of 18–65 years old, their de-

Proceedings of the University of Vaasa. Reports 9
mographics features, their innovation process characteristics, and a benchmark with other countries. Chapter 4 then proceeds with the diffusion of consumer in-novations, including the extent to which innovations are adopted by other people or businesses. The report presents the general perceived usefulness of the innova-tions that consumers have developed, their willingness and motives to share inno-vations, and their actual efforts to inform others about their innovations. Three modes of diffusion: new venture creation, adoption by commercial producers, and peer-to-peer sharing are presented. Chapter 5 gives the details of our case study of patients, nurses and doctors in the medical sector. The analysis covers their inno-vation intensity, characteristics of innovations and the extent in which each of their innovations diffuse.
Chapter 6 provides a standardized survey procedure for consumer innovation measurement. Although not the central focus on the project, the report also picks up the issue of measuring user innovation in samples of firms, including recom-mendations on how to modify the community innovation survey (Gault 2013) so that user innovation by firms may be better captured in official statistics.
Chapter 7 focuses on potential policy interventions in terms of general design principles and a range of more specific recommendations. Finally, Chapter 8 pro-vides a brief outlook to the future. The appendices include findings from the pilot studies (Appendix A), details on the main surveys (Appendix B), and a recom-mended survey procedure for the future measurement of consumer innovation (Appendix C).

10 Proceedings of the University of Vaasa. Reports
2 THEORETICAL BACKGROUND
This chapter gives a brief introduction to user innovation theory. It highlights the key differences between user innovation and producer innovation, including an overview of the user-centered model that is marked by relative openness and dis-tribution of innovative behavior across many individuals. More detailed reviews of the state-of-the-art in user innovation theory can be found in von Hippel (2005; 2011).
Producer innovation
Today, the dominant view of how innovation ‘works’ revolves around producers, here defined as anyone who would benefit from an innovative effort only if others adopt their innovation. In his early work, Schumpeter (1934) suggested that the economically most important and disruptive innovations are initiated by entrepre-neurs, and accordingly introduced by small and start-up enterprises. In later work Schumpeter argues that innovation mainly takes place in the R&D laboratories of large firms benefiting from a lack of competition (Schumpeter 1942). In both cas-es, however, innovations originate from producers and are supplied to intermedi-ate users and/or consumers via products that are introduced to a market for sale.
After Schumpeter, a multitude of alternative models of innovation have been in-troduced. Thus, the linear model of innovation revolves around fundamental knowledge production and its valorization, postulating that innovation starts with basic research, with commercially promising research output moving to applied research, development and production, while market adoption eventually follows (Bush 1945). The demand-pull version of this model argues that innovation is driven by the perceived demand of potential users, and producers seek to develop products to respond to customer problems or suggestions, while the direct influ-ence of basic research is much less significant (Rothwell 1992). The chain-link model of innovation (and its predecessors) stresses that relationships between science, development, production and diffusion are complex and interrelated (e.g. Price 1965; Kline 1985). The doing, using and interacting (DUI) model empha-sizes that, beyond systematic or interrelated knowledge production, innovation in enterprises is more often concerned with informal processes of learning and expe-rience-based know-how (Jensen et al. 2007). What these models have in common is that producers are regarded as key actors in innovation. Typical producer inno-vators include commercial enterprises and individual inventors (who all primarily benefit from selling their innovations) and public research organizations and uni-versities (needing others to adopt their innovative output). Producer-centered in-

Proceedings of the University of Vaasa. Reports 11
novation is also still very much present in today’s official statistics and innovation policies.
User innovation
An alternative line of research which emerged in the past three decades, shows that innovation can also be done by firms and individual consumers who, at least initially, wish to use what they create rather than sell it (von Hippel 1976; 2005). User innovation differs from traditional, producer-centered innovation in three respects: (1) how to innovator benefits from innovation, (2) type of involved knowledge and resulting innovations, (3) diffusion mechanisms.
Ad (1) Benefit from innovation
The main distinction between user and producer-centered innovation is rooted in how innovators benefit from their innovation effort. User innovators can be either firms or individual consumers that expect to benefit from using an innovative product. In contrast, producer innovators expect to benefit from selling an innova-tive product. Firms or individuals can be either a producer or user innovator, de-pending on the specific situation. For example, Sony is a producer of electronic equipment, but it is also a user of machine tools. With respect to the innovations that it develops for its electronic products, it is a producer innovator, but if we would investigate innovations in its machinery or production processes, the com-pany could qualify as a user innovator. Users are unique in that they alone benefit directly from innovations. All others (here lumped under the term ‘producers’) must sell innovation-related products to users, indirectly or directly, in order to profit from innovations. Thus, in order to profit, producer inventors must sell or license knowledge related to innovations, and producer manufacturers must sell products or services incorporating innovations.
The way how producers and users benefit from innovation is the main and exclu-sive difference between both models. In line with this distinction, user-innovators are triggered by different motives than producers. They tend to innovate if they want something that is not available on the market, and are able and willing to invest in its development. Necessity is what primarily drives them. In practice, many users do not find precisely what they need on existing markets. Meta-analyses of market-segmentation studies suggest that user needs for products are highly heterogeneous in many fields (Franke & Reisinger 2003). In contradiction, producers tend to follow product development strategies to meet the needs of ho-mogenous market segments. They are motivated by perceived opportunities to

12 Proceedings of the University of Vaasa. Reports
serve sufficiently large numbers of customers (users) to justify their innovation investments. This strategy of ‘few sizes fit all’ leaves many users dissatisfied with commercial products on offer. As a consequence, some of them will modify their products or have a high willingness to spend time and money to develop a per-sonal version of a product that exactly satisfies their needs (von Hippel 2005).
Ad (2) Type of knowledge and innovations
Users and producers tend to know different things and accordingly employ differ-ent knowledge in the innovation process. Users have the advantage of knowing precisely what they want: they possess superior information regarding their own needs. Producers rely on market research and cooperation with users to get infor-mation on unsatisfied user needs. In practice this task is of the very difficult. Es-timates of failed product innovations range from 75 to 90 percent (Cooper 2003). User innovators possess ‘sticky information’ about their needs; information that is costly to transfer from one individual to another because of differences in back-ground knowledge, experience, and context of use information (von Hippel 1994). Transferring this information to producers is expensive and tends to make user innovation more efficient than attempting to teach producers on user needs.
A study of innovations in mountain biking equipment, for example, found that user innovations often depended on information that the inventors had obtained through their own cycling experience, reflecting their own unique circumstances and interests, such as a desire to bike in extreme weather conditions or to perform acrobatic stunts (von Hippel 2005). Producers, on the other hand, possess better capabilities to design and market innovations, i.e. they employ specialized engi-neers, have professional software and machines, and an infrastructure to develop and market innovations for larger numbers of users. In sum, producers are ad-vanced in terms of solution information, while users are advanced in terms of need information.
Users and producers possess different local knowledge, which has an impact on the types of innovations that they develop. Due to information stickiness, produc-er innovators tend to rely on information they already have in stock (von Hippel 1994). Users are more likely to come up with functionally novel innovations, re-quiring a great deal of user-need information and use-context information for their development. In contrast, producers tend to produce incremental innovations that are improvements on well-known needs and that require a rich understanding of solution information for their development, including design, reliability and technical quality. Their innovations are more likely to be dimension-of-merit im-provements, and not so much functionally novel innovations. In this context,

Proceedings of the University of Vaasa. Reports 13
Riggs and von Hippel (1994) studied the types of innovations made by users and producers that improved the functioning of two major types of scientific instru-ments. They found that users are significantly more likely than producers to de-velop innovations that enabled the instruments to do qualitatively new things for the first time. In contrast, producers developed innovations that enabled users to do the same things they had been doing, but to do them more conveniently or reli-ably.
Ad (3) Diffusion mechanisms
A third important distinction is how producer and user innovations generally dif-fuse to other economic actors. As indicated, producers expect to benefit from their innovations by selling them to users, or alternatively, by selling or licensing their innovative knowledge to other producers who may further commercialize it. Also, their knowledge will spill over to other innovating actors as a consequence of labor mobility, site visits of external actors, and other reasons (Griliches 1992). In sum, while many producer innovations fail (e.g., due to misperceived consumer needs), provided that true value is created they will diffuse by sales, licenses and spillovers.
User innovations are primarily developed for personal use, so broad diffusion is not an objective as such. In practice, many of these innovations will be applicable to only the user, while no or only few others experience similar problems – so that low diffusion rates are likely. Occasionally, however, users create fixes for prob-lems that many and/or a growing number of other users face. In fact, most of the major innovations in a range of fields were first piloted by users, and later com-mercialized as an improved version (von Hippel 2005). For users, however, sales, licenses and spillovers are less relevant diffusion mechanisms, are they are not (primarily) interested in commercial benefit. In case their innovations represent broad use value, the typical innovation pattern suggested by previous research is that users innovate at the leading edge of emerging needs for new products and services, where markets by definition are both small and uncertain. Von Hippel, Ogawa and de Jong (2011) summarized the pathway from an initial user innova-tion to commercialization by producers as follows (Figure 3).
User innovation begins when one or more users of some good recognizing a new set of needs and/or design possibilities and begin to design and build and use in-novations intended to better serve their own needs. If the innovation is of interest to additional users, one or more communities of user-innovators soon coalesce and begin to exchange information about their various designs, their experiences with them, and promising avenues for improvement. Users often achieve diffu-

14 Proceedings of the University of Vaasa. Reports
sion by just revealing what they have developed (Harhoff, Henkel & von Hippel 2003). This is often the best or the only practical option available to users, as hid-ing innovations with trade secrets is unlikely to be effective for long and user in-novators are not (primarily) motivated by direct economic benefits anyway. Thus, a first diffusion mechanism includes the peer-to-peer sharing of innovations.
Source: von Hippel, Ogawa & de Jong (2011).
Figure 3. User-centered model of innovation.
Next, for some time after user innovation begins, the first user-purchasers appear – these are users who want to buy the goods that embody the lead user innova-tions rather than building them for themselves. Some of the user innovators may decide to start their own businesses to satisfy other users’ similar needs. The first producers to enter the market are likely to be user-founded firms, i.e. user-innovators who draw on the same flexible, high-variable-cost, low-capital produc-tion technologies they use to build their own prototypes (Shah & Tripsas 2007). The second diffusion mechanism is new venture creation.
Once information about product designs becomes codified, and as market vol-umes grow, incumbent producers - both existing user-founded firms, established producers from other fields, and start-up producers who have identified the oppor-tunity - can justify investing in higher-volume production processes involving higher capital investments. In this phase, the third diffusion mechanism may ap-pear, which is adoption by commercial producers. The more the market matures, the more user-purchasers will have a choice between lower-cost standardized goods and higher-cost, more advanced models that user-innovators continue to develop. User innovators will be present throughout the emerging industry’s life cycle, because (established) producers tend to serve homogenous target markets, so that at least some users will not precisely get what they want. Throughout the life cycle however, the role of producers versus users as a source of innovation
number of users perceiving need
time
users innovate
singly or in communities
user-foundedfirms
incumbentproducers
target market

Proceedings of the University of Vaasa. Reports 15
will slightly change – user innovators will be most dominant in the nascent and early stages of industry emergence.
The user-centered model provides an alternative perspective to innovation pro-cess. Clearly, many innovations developed today are not developed in a research-development-production-diffusion model. InFi-project focuses on this area by analyzing innovation activity among individual end users, or consumers, to put it another way.

16 Proceedings of the University of Vaasa. Reports
3 FREQUENCY OF CONSUMER INNOVATION
This chapter presents the findings from the current and previous surveys of con-sumer innovation. Section 3.1 reports the share of consumer innovators in the population of Finnish citizens aged 18 to 65. It also addresses the question, what kind of innovations are developed, offers examples, and discusses to what extent these innovations are potentially generally useful. Next, demographic characteris-tics of consumer innovators are presented (Section 3.2), followed by an overview of people’s motives to innovate and how they develop their innovations (3.3). This includes collaboration, investments and the protection of innovations. Whenever possible, benchmark numbers with other countries are presented.
3.1 Consumer innovation incidence rate
In the population of Finnish consumers of 18 to 65 years, we found that 5.4 per-cent has engaged in innovation for personal need in the past three years. More precisely, these citizens have created at least one new item for personal use to fix an everyday problem. The estimate excludes innovations which consumers devel-op as part of their job – only leisure time innovations are included. Moreover, the estimate excludes homebuilt versions of products which are already available on the market, so all innovations include some kind of novelty. Finally, in line with user innovation theory our estimate excludes few innovations which consumers primarily developed for commercial reasons. These would fit in the producer-centered model, and will supposedly be included in the official statistics already (e.g., inventor surveys, CIS survey, patent statistics, etc.).
In Finland, given a population of 3,197,037 citizens aged 18 to 65 (source: Statis-tics Finland), the number of consumer innovators within this population is esti-mated to be 172,640 individuals. Arguably, this is a substantial number, given that innovation by individual consumers is not-at-all recorded in official surveys, and that the estimate does not include elderly citizens and very young ones. Until recently such consumer innovation could be considered dark matter, unmeasured and impossible to include in economic or policymaking analyses.
Benchmark
The evidence so far suggests that about 4 to 6 percent of all consumers created at least one user innovation in the past three years (Table 1). The share of Finnish consumers is also within this range, and not significantly different from the esti-mated incidence rate in other countries.

Proceedings of the University of Vaasa. Reports 17
Table 1. Frequency of user innovation in broad samples of consumers.
Source Country Year Sample Frequency von Hippel et al. (2012) United Kingdom 2009 1,173 consumers ≥ 18 years 6.1% de Jong (2011a) Netherlands 2010 533 consumers ≥ 18 years 6.2% Ogawa & Pongtanalert (2011) USA 2010 1,992 consumers ≥ 18 years 5.2% Ogawa & Pongtanalert (2011) Japan 2011 2,000 consumers ≥ 18 years 3.7% Kuusisto et al. (2013b) Finland 2012 993 consumers of 18-65 years 5.4%
Surveys of small firms generally find that 15 to 20 percent can be considered user innovators (de Jong & von Hippel 2008; Flowers et al. 2010; Kim & Kim 2011) while in more specific samples of manufacturers and high-tech small firms the share of user innovators is in the 40 to 60 percent range (Arundel & Sonntag 2001; Schaan & Uhrbach 2009; de Jong & von Hippel 2009). For consumers, the incidence rate is always lower, but still represents a significant innovative activi-ty.
In Finland, the share of consumer innovators is not significantly different from other countries – the 95% confidence interval ranges from 4.0% to 6.8% (repre-senting 127,900 to 217,800 individuals)2. Thus, like in other countries there exist fairly widespread design and development of applications by consumers them-selves, independent of producer involvement. This innovation activity is not the same as “co-creation” processes where consumers and producers work together to develop a product. It also is different from what are often called “user-driven” innovation methodologies where the responsibility for new product development stays with producers, but incorporating user feedback from very early in the de-sign process, often using ethnographical approaches. All together, consumer in-novation alone is a significant phenomenon in Finland, and even more so when all the above-mentioned forms of consumer involvement in innovation activities are accounted.
2 Remark that surveys in other countries also included individuals > 65 years. In Finland, we
only sampled 18 to 65 years old. If we re-estimate the share of consumer innovators in the UK and the Netherlands for the same group, the incidence rates become 6.3% and 6.8%, respec-tively. Again, these numbers are not significantly different from the Finnish estimate.

18 Proceedings of the University of Vaasa. Reports
Potential broader value of consumer innovations
In the case of the Finland survey, the research was also aimed at understanding the potential general value of personal fixes developed by consumers. Absent general use value, or a lack of diffusion would naturally limit the social welfare impacts of consumer innovations. In this light, respondents were asked how many others they thought could also find their developments to be of potential use. In Table 2, we see the proportions of the 5.4 percent total of consumer innovations broken out into categories based upon the level of interest the developers them-selves assigned.
Table 2. Potential broader value of user innovation by consumers in Fin-land.
Innovation perceived to be valuable to… Percentage …(basically) no others 2.1% …some others 2.4% …many others 0.9% Total frequency of consumer innovation 5.4%
Notes: Estimates based on survey data of 993 Finnish citizens aged 18 to 65.
As we anticipated, part of the reported innovations are considered useful to only the innovating consumer him/herself, while others have potential use value to many other consumers.
The main types of innovations consumers report in Finland
Finnish citizens report a broad range of innovations, ranging from ‘software to take screenshots simultaneously from several cameras’ to ‘a backpack with vinyl plates on the sides that opens up a new way’. Table 3 offers examples.

Proceedings of the University of Vaasa. Reports 19
Table 3. Objects of consumer innovations in Finland, and examples of possible general interest.
Object Freq. Examples tools & equipment
20% A tool that helps to change tyres with less back pain. There are no similar product on the market. This one is for personal use.
New method for spraying polyurethane foam. I needed to spray polyure-thane in a small space that was hard to reach.
household fixtures & furnishing
20% A foldaway bathtub. I am having a small bathroom and wanted to avoid big and expensive renovation work.
I created a snow barrier around the ventilation pipe. It is a quite good solu-tion which was not commercially available.
sports, hobby & entertain-ment
17% A bag to make the transport of a musical instrument easier. I added extra handles to make it easier to transport the backpack model of the instrument.
New device for bee keeping, helps lifting the compartments of the beehive. This is usually heavy lifting which needs to be done by two persons, but not anymore.
food and clothes
12% A new way to fasten a button, as I was annoyed by the effort it makes to sew one. I wanted a light and convenient way to do it.
A hamburger mold that I could not find in the shops. I wanted extra large hamburger buns but the tools were not available.
transport & vehicle
11% A steering and idle wheel solution for a two-wheel recumbent bicycle. It makes it easier to steer and more stable in slow speed.
I have made my own stunt bike foot rests. They are much stronger, lighter and safer than available commercial products
help, care & medical
7% Tools to help my brother who is disabled and who can only use one arm. He can now peel, dice and slice and work with anything from bread to fruit with one hand.
I made a tool that helps my mother to close the zipper on her shoes. She is old and finds it hard to bend.
computer software
6% A software that is able to take screenshots simultaneously from several cameras. I like to see what happens in my street.
A software application that allows choice of optimal location of living. I had to move and wanted to find out where I should best go given my work and hobbies. The software allowed me to see how long it takes to get to different places within the capital region.
children & education
4% A seat belt control that guides the belt to come down over the collar-bone/shoulder and not for example over the throat. My child does not get frustrated anymore when the seatbelt is in his face. He no longer wears partly, e.g. only on the hip, so it is safer.
A card game to learn to transpose. Cards have questions and tasks that can be solved by playing or by telling the answer.
other 3% A cylinder woven of acid-proof steel net to neutralize well water. The cyl-inder is filled with dolomite lime grains and lowered down to the well. The pH-value of the well water rises and therefore the life of the piping and plumbing fixtures will expand. Existing products did not match with my situation.
A backpack that has sides made of vinyl plates. The middle part and closing flap are made of garment. What is new is how the bag opens up.
total 100% Notes: Percentages based on 176 validated consumer innovations.
Most common innovation objects are related to household fixtures and furnishing, tools and equipment, and sports, hobby and entertainment. However, typical con-

20 Proceedings of the University of Vaasa. Reports
sumer innovations can also be related to providing help, care or medical activities, or children and education-related matters.
The table also clarifies that some innovations are only for personal use and prob-ably not suitable for broad audiences (e.g., ’a foldaway bathtub’), but in line with user innovation theory they can be considered innovations (from the perspective of the innovating consumer). In contradiction, other examples suggest great gen-eral use value (e.g., ‘new method for spraying polyurethane foam’).
3.2 Demography
A common finding in previous surveys was that the frequency of innovation by consumers is higher for males, for those with high educational attainment, and for those with a technical training or job (von Hippel, Ogawa & de Jong 2011). In Finland we found similar patterns in consumer innovation: see Table 4.
Table 4. Frequency of consumer innovation for selected demographic groups, across countries.
Incidence rate UK (n=1173)
USA (n=1992)
Japan (n=2000)
Finland (n=993)
General 6.1% 5.2% 3.7% 5.4% Highly educated (master of bachelor degree)
8.7% 8.9% 3.7% 7.7%
Technical job or business 12.0% 8.0% 4.2% 8.8% Male 8.6% 5.9% 4.9% 6.3%
Obviously, education and training reflect personal capabilities for innovation: highly educated are more likely capable of developing fixes for their personal problems. For the same reason, it is likely that technical training matters for peo-ple’s ability to develop solutions for the problems that they face. Such people probably have better access to solution information so that they can help them-selves.
Gender is unlikely to be a direct explanation for the empirical differences that were observed. The assumption is that being male may be a proxy for other fac-tors which enhance people’s inclination to innovate – for example, control beliefs or need for achievement. The underlying patterns may be in line with earlier re-search findings that males are more likely to become inventors and entrepreneurs. Yet another reason may be, however, that our survey methods can still be im-proved. (Current survey offers cues mainly related to physical products, while

Proceedings of the University of Vaasa. Reports 21
services are ignored. Services are separately addressed in the healthcare survey in Chapter 5).
Other demographic differences
A more detailed breakdown of the incidence rate across available demographic variables is presented in Table 5. Like in the United Kingdom, it seems that the frequency of consumer innovation rises slightly with age.
Table 5. Frequency of consumer innovation in Finland across demograph-ic groups.
Variable Group Frequency General All citizens aged 18 to 65 5.4% Age 18–24 years 3.6%
25–34 years 4.4%
35–44 years 6.5%
45–54 years 5.0%
55–64 years 7.3%
Education Primary or unknown 3.5%
Secondary 4.8%
Higher (bachelor or master degree) 7.7%
Gender Male 6.3%
Female 4.4%
Employment Employed/self-employed/entrepreneur 5.8%
Student/retired/disabled/housekeeper/unemployed 3.7%
Technical job or busi-ness
No 4.6%
Yes 8.8% Notes: Estimates based on survey data of 993 Finnish citizens aged 18 to 65.
Another finding is that those who are employed, including entrepreneurs and self-employed individuals, are more likely to have created an innovation for personal use in the past three years. These differences are however too small to be signifi-cant.
3.3 Motives and innovation process
This section further describes why and how individual Finnish consumers develop their innovations. Drawing on our database of 176 validated innovation cases, the following discussion focuses on consumer’s motives to innovate, and innovation process related variables including collaboration, investments and the protection of innovations.

22 Proceedings of the University of Vaasa. Reports
Motives
By definition, the primary motive to engage in user innovation is personal need. Beyond personal need, however, consumers may innovate for other reasons. While solving the problem that they face, opportunity to commercialize their in-novation may already quickly come to their mind – not as a primary driver, but rather as an additional spur (Shah & Tripsas 2007). Moreover, some consumers will start innovating partly because they want to learn or develop their skills, or to help other people who are facing similar problems (usually strong ties like rela-tives and friends), or just because they enjoy the process of tinkering and creation of new things (Lakhani & Wolf 2005; Raasch & von Hippel 2013).
In our surveys of Finnish consumers we asked respondents to indicate the im-portance of these innovation motives, related to their most recent innovation, by distributing 100 points (Table 6).
Table 6. Motives of Finnish consumers to innovate.
Motive Importance Personal need 51 Enjoyment 20 Helping other people 13 Learning/develop skills 12 Sell/make money 3 100 Notes: Numbers based on 176 validated consumer innovations.
Given that we focused on innovations which people develop for themselves, it was no surprise that personal need was most important. Fun, helping and learning were also significant motivators. Very few respondents reported an interest in commercializing their innovation at the time they developed it.
Collaboration
To develop an innovation, consumers may well need to collaborate with other people. This usually concerns people in their personal environment (relatives, friends), but they may also ask for help in their business network, or call upon members of a club or community they belong to. In Finland, the survey indicates that innovation collaboration is more common than in other countries (Table 7). Over one out of four validated innovation cases were developed with others, while in other countries this frequency was around 10 percent.

Proceedings of the University of Vaasa. Reports 23
Table 7. Share of consumer innovations developed in collaboration with other people.
Source Country Year Sample Frequency von Hippel et al. (2012) United Kingdom 2009 104 consumer innovations 10.3% Ogawa & Pongtanalert (2011) USA 2010 114 consumer innovations 11.0% Ogawa & Pongtanalert (2011) Japan 2011 83 consumer innovations 8.0% Kuusisto et al. (2013b) Finland 2013 176 consumer innovations 28.3%
In the follow-up question respondents were asked about the innovating process, how many other people had made a contribution, and what kind of people were involved? On average every consumer innovation is characterized by the in-volvement of 0.6 other persons. More specifically, in case the innovation was a collaborative effort, the average number of contributors (beyond the respondent him/herself) was 2.0. Overall, this number of collaborators ranged from 1 to 6.
Of all collaborators, 78 percent were personal friends and/or relatives of the re-spondent. In 16 percent of the cases, help was received from business contacts or commercial producers – note that this involves only innovations which consumers develop in their leisure time, showing that producer innovators can occasionally well do favors which effectively support the development of user innovations. Finally, another 16% of the external contributors were members of a club or web community that the respondent belonged to. In this case, the club/community is usually concerned with developing similar innovations as its main purpose (88%). Effectively, these are open collaborative forms of innovation, like open-source software projects, or open design initiatives. Examples include a ‘Mobile learning solution for self-administered studying of plants’, developed by the member of an online forum where such innovations were exchanged. Much less respondents receive contributions from a club that is not concerned with the innovation (12% of the relevant cases).
In summary, the findings suggest that in Finland collaboration is more common for consumer innovators. Also, the open collaborative mode of innovation is rela-tively important, compared to the more classic case of singleton user innovators (Baldwin & von Hippel 2011). At this stage we can only speculate why. For in-stance, the Finnish culture may be less individualistic compared to the other coun-tries. Alternatively, Finnish respondents may be more inclined to give credit of the innovation to other people. Alternatively, the Finnish population is relatively well-educated and may be more inclined to mobilize others.

24 Proceedings of the University of Vaasa. Reports
Investments
Finnish consumer innovators dedicate considerable amounts of (leisure) time and money in order to innovate. On average, they spent 21 person-hours to develop their most recent innovation, and 207 Euros out-of-pocket costs. The distribution of these time and money expenditures is widely dispersed, a result that was also found in other countries. For example, 80% of all consumers innovators spend 20 hours or less, while 20% invested more time than average. For out-of-pocket costs, 49% reported no expenses at all, while only 6% spent more than average. See Table 8.
Table 8. Expenditures on most recent consumer innovations.
Mean Minimum 1st quar-tile
Median 3rd quar-tile
Maxi-mum
Time spent on most recent innovation (in person-hours)
21 0.1 1 3 14 400
Money spent on most recent innovation (in Euros)
207 0 0 5 50 20,000
Notes: Based on 176 validated consumer innovations.
Comparing investment numbers across countries is difficult, as our estimates are highly sensitive to outliers and the selection of particular (most recent) cases upon which respondents report. Nevertheless, in our previous study in the United Kingdom, similar patterns were observed (average time spending on most recent innovation was 38.4 hours, average out-of-pocket costs 101 UK Pounds). Con-sumers typically spent a few hours to a couple of days innovating, and invested some dozens to hundreds (but not thousands) of Euros to fix their personal prob-lems.
Protection of consumer innovations related knowledge
Producer-innovators would generally protect their innovation-related knowledge with intellectual property rights (IPRs) to exclude others and/or to facilitate li-censing strategies. In contrast, user innovators are not triggered by direct econom-ic benefits, and accordingly less inclined to exclude others from adopting their knowledge. In this case, ‘Open innovation’ is defined as innovation without claiming IPRs. In previous consumer surveys, it has been repeatedly found that consumers do not worry about IPRs, and indeed, this was confirmed for individu-al consumers in Finland. See Table 9.

Proceedings of the University of Vaasa. Reports 25
Table 9. Share of consumer innovations protected with intellectual proper-ty rights.
Source Country Year Sample Frequency von Hippel et al. (2012) United Kingdom 2009 104 consumer innovations 1.9% Ogawa & Pongtanalert (2011) USA 2010 114 consumer innovations 8.8% Ogawa & Pongtanalert (2011) Japan 2011 83 consumer innovations 0.0% Kuusisto et al. (2013b) Finland 2012 176 consumer innovations 4.7%
Only 4.7% of the reported innovations were somehow protected with IPRs. When asked how exactly consumers had protected their innovation, patents and confi-dentiality agreements were favorite (each applied in 57% of the cases in which IPRs were used at all). Consumers occasionally also used trade marks (29%), copyrights (14%) and technical protections like encryptions (14%).
The finding in Table 9 is in line with previous surveys in which the share of pro-tected innovations is in the 0 to 10 percent range. For comparison, in samples of firms, using IPRs to appropriate any broader benefits from user innovation ranges from 10 to 50 percent, depending on the specific type of business involved (de Jong & von Hippel 2013). Consumer innovators are however less inclined to pro-tect their innovations with IPRs.

26 Proceedings of the University of Vaasa. Reports
4 DIFFUSION OF CONSUMER INNOVATION
Diffusion of innovations is a critical factor from a societal point of view. Concep-tually, diffusion is the process by which an innovation is communicated through certain channels over time among the members of a social system (Rogers 2003).
Provided that consumer innovations are generally valuable (beyond personal use value which primarily triggered the consumer to innovate), lack of diffusion im-plies an obvious loss in terms of general welfare. Imagine some of the well-known innovations which users developed initially for themselves, including con-trolled flight (Wright brothers), the world wide web (Tim Berners-Lee) and the stethoscope (Robert Laennec). The world would be different, if these innovations had not diffused. In the absence of diffusion, every user with similar needs must make a similar innovation effort; a poor use of resources. Moreover, only a frac-tion of users facing a particular need will be able to develop their own solution– recall from Chapter 3 that user innovators have specific demographics suggesting that technical and prototyping skills are important. Accordingly, low diffusion could be a reason for policy makers to intervene in order to ensure that consumer innovations spread effectively.
This chapter presents the survey results of the diffusion of consumer innovations in Finland. To start with, three modes of diffusion are distinguished: to peers, via new ventures, or to commercial producers adopting the innovation (Section 4.1). Obviously, before diffusion may happen, innovating consumers should perceive that their innovations are generally valuable (or at least this is expected to influ-ence diffusion). They should also be willing to reveal, take some effort to diffuse, and develop intentions to diffuse. Figure 4 shows the intermediary variables we will discuss in the Sections 4.2 to 4.4. Section 4.5 completes the chapter with an analysis of diffusion failure.

Proceedings of the University of Vaasa. Reports 27
Figure 4. Key antecedents of consumer innovation diffusion.
4.1 Frequency of diffusion
In Finland, 19 percent of the validated innovation cases did spread to other eco-nomic actors, whereas 81 percent did not diffuse at all. As discussed in Chapter 2, three mechanisms for the diffusion of consumer innovations include:
• To peers: Users may reveal their innovations to others for inspection, cop-ying and adoption without charge, so that innovations diffuse peer-to-peer.
• New venture creation: Innovating consumers may start a new business to introduce a commercial version of their innovation to the market.
• Producer adoption: Commercial producers may adopt users’ innovations to further improve and sell them as commercial products.
From a policy maker’s point of view, the first mode of diffusion is an interesting one. When innovations spread to peers, the market mechanism is basically side-lined. Nevertheless, a peer diffusion process is characteristic especially in the case of emerging industries, having substantial implications for economic growth and employment creation.
In Finland, peer-to-peer sharing happens in almost 16 percent of consumer inno-vations, typically with relatives and friends of the innovator. In addition, sharing may also take place between members of club or community in which the innova-tor belongs (Table 10).

28 Proceedings of the University of Vaasa. Reports
Table 10. Diffusion of consumer innovations in Finland.
Type of diffusion Percentage Of any kind 19.0%
Commercially 6.0% - New venture creation 1.8% - Adoption by commercial producers 5.5%
To peers 15.7% Notes: Percentages based on 176 validated consumer innovations. As different types of diffusion may apply simultaneously, percentages do not add up to the overall numbers.
Venture creation by user innovator and producer adoption both represent com-mercial modes of diffusion. These types of diffusion are relatively rare, but they do enable diffusion to broader society – as commercialization makes the innova-tion widely available on markets. In total, six percent of the investigated innova-tions diffused commercially. Usually commercial producers adopted the innova-tion, while new venture creation is rare, representing only 1.8 percent of the diffu-sion cases.
Compared to the diffusion rates in other countries, Finland is doing relatively well. Table 11 shows that when only peer diffusion and producer adoption are taken into account, the Finnish diffusion rate is similar to the United Kingdom, and clearly higher than in the US and Japan.
Table 11. Share of consumer innovations adopted by other users or firms across countries.
Source Country Year Sample Frequency von Hippel et al. (2012) United Kingdom 2009 104 consumer innovations 17.1% Ogawa & Pongtanalert (2011) USA 2010 114 consumer innovations 6.1% Ogawa & Pongtanalert (2011) Japan 2011 83 consumer innovations 5.0% Kuusisto et al. (2013b) Finland 2012 176 consumer innovations 18.8% Notes: Percentages indicate what fraction of innovations has been diffused to peers or commercial producers. New venture creation as a diffusion mechanism is not included as benchmark data for other countries are not available.
All in all, the results indicate that some consumer innovations have proven to be meaningful to other users, and some are even developed further into commercial products. As a rule-of-thumb, about one out of six innovations is adopted by peers, while one out of seventeen spreads via commercial pathways. Neverthe-less, about 80 percent of all consumer innovations do NOT become available for the wider society, indicating a potential welfare loss. This issue will be explored in the next section of this chapter.
Proceedings of the University of Vaasa. Reports 29
4.2 Perceived value of innovations
Personal value
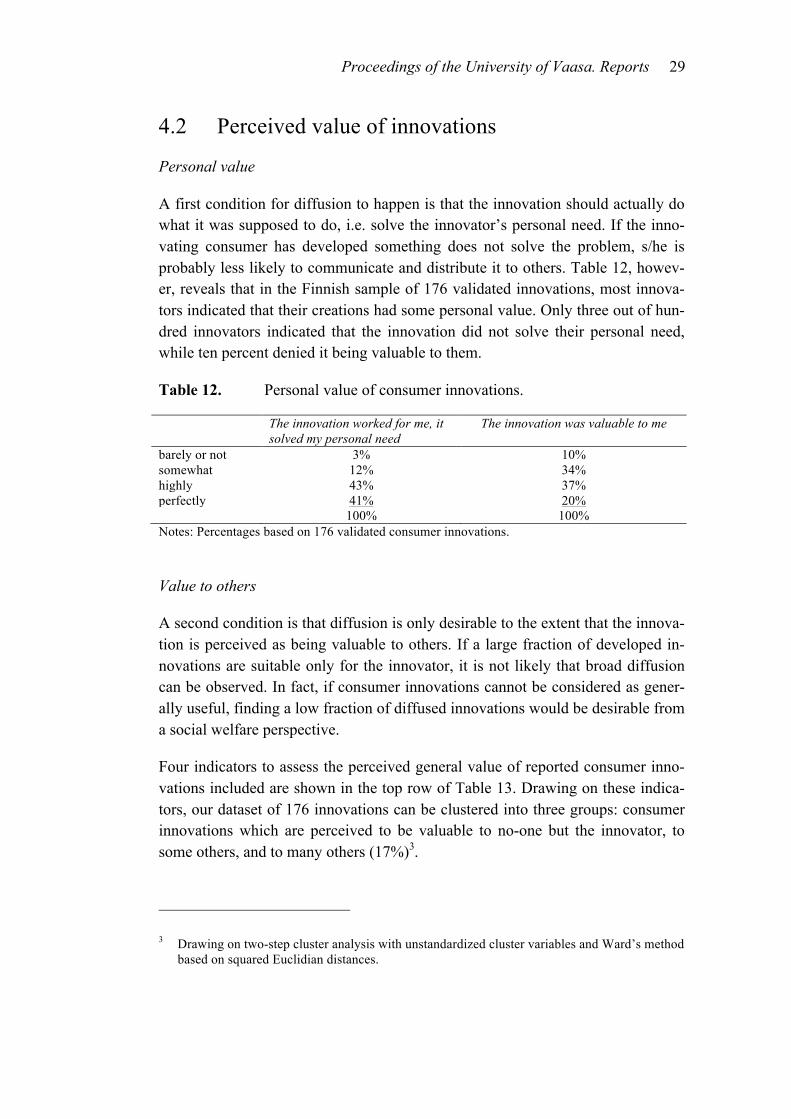
A first condition for diffusion to happen is that the innovation should actually do what it was supposed to do, i.e. solve the innovator’s personal need. If the inno-vating consumer has developed something does not solve the problem, s/he is probably less likely to communicate and distribute it to others. Table 12, howev-er, reveals that in the Finnish sample of 176 validated innovations, most innova-tors indicated that their creations had some personal value. Only three out of hun-dred innovators indicated that the innovation did not solve their personal need, while ten percent denied it being valuable to them.
Table 12. Personal value of consumer innovations.
The innovation worked for me, it solved my personal need
The innovation was valuable to me
barely or not 3% 10% somewhat 12% 34% highly 43% 37% perfectly 41% 20%
100% 100% Notes: Percentages based on 176 validated consumer innovations.
Value to others
A second condition is that diffusion is only desirable to the extent that the innova-tion is perceived as being valuable to others. If a large fraction of developed in-novations are suitable only for the innovator, it is not likely that broad diffusion can be observed. In fact, if consumer innovations cannot be considered as gener-ally useful, finding a low fraction of diffused innovations would be desirable from a social welfare perspective.
Four indicators to assess the perceived general value of reported consumer inno-vations included are shown in the top row of Table 13. Drawing on these indica-tors, our dataset of 176 innovations can be clustered into three groups: consumer innovations which are perceived to be valuable to no-one but the innovator, to some others, and to many others (17%)3. 3 Drawing on two-step cluster analysis with unstandardized cluster variables and Ward’s method
based on squared Euclidian distances.

30 Proceedings of the University of Vaasa. Reports
Table 13. Perceived general value of consumer innovations.
General value This innovation… ...helps
other peo-ple to save
money (yes)
...enables people to do new
things (yes)
...would be valuable to
others (many or nearly all)
...can become a valua-ble commercial product (to a reasonable/ sub-
stantial market)
Cluster I: to none (39%) 0% 0% 0% 3% Cluster II: to some (44%) 66% 68% 42% 0% Cluster III: to many (17%)
70% 67% 74% 92%
Notes: Percentages in cells based on 69, 77 and 30 validated consumer innovations for cluster I, II and III, respectively.
Thirty-nine percent of the reported innovations are only useful to the consumer him/herself. The remaining 61 percent has potentially some or great general use value. Forty-four percent is claimed to help other people save money, do new things, or just be valuable, indicated general value to some other people. Seven-teen percent is also perceived to be highly eligible for commercialization, indicat-ing general value to many others.
To put it differently, the numbers of Table 13 imply that the overall share of Finn-ish consumers engaging in innovation (5.4%) breaks down into 2.1% (consumers developing innovations which are likely to be valuable only to themselves), 2.4% (valuable to some others) and 0.9% (to many others) – as we reported already in Chapter 3. From the innovator’s point of view, developed personal fixes and solu-tions may be useful to some or even many others, but not necessarily so.
4.3 Willingness to share
Another criterion for diffusion to happen is that innovating consumers must be willing to reveal their innovation-related knowledge in order to increase the odds of diffusion. Innovators’ willingness to share their solutions were investigated in the cases of free sharing and sharing against compensation.
Willingness to share for free
It has been well-documented that user innovators often voluntarily reveal to oth-ers what they have developed to examine, imitate, or modify without any com-pensation to the innovator. Free revealing implies that user innovators voluntarily give up their potential intellectual property rights and share the details of their innovation with anyone interested, so that the information becomes a public good
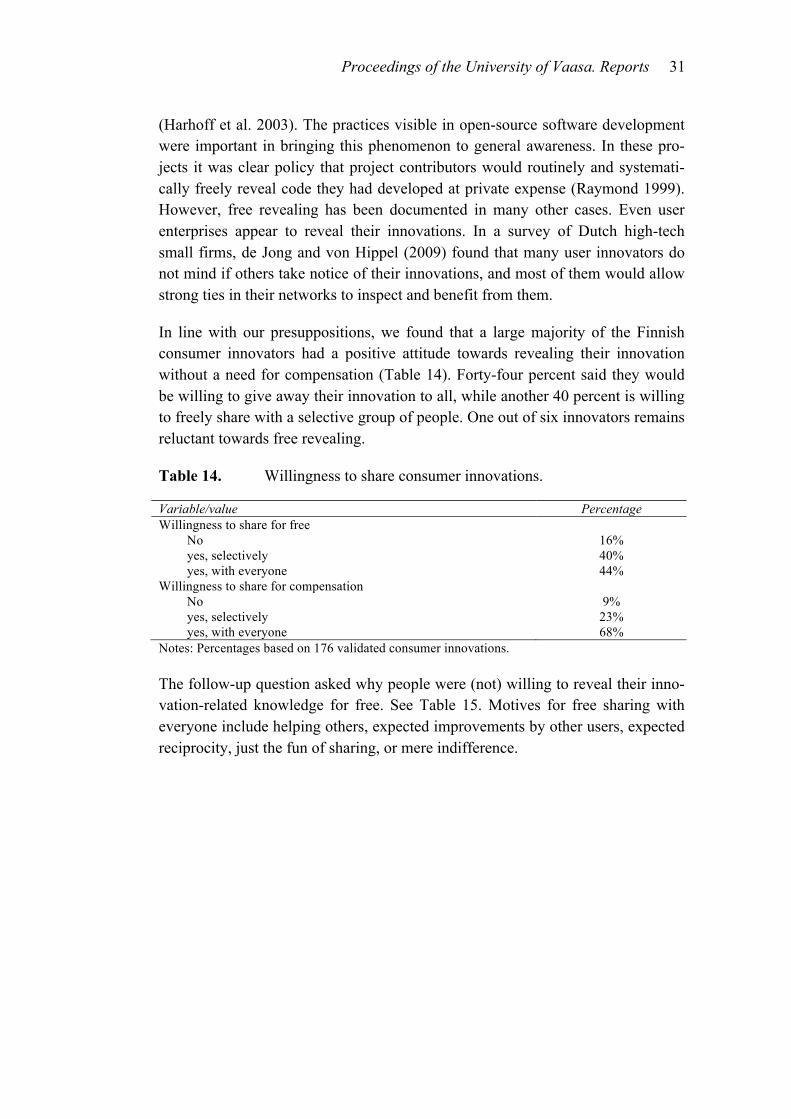
Proceedings of the University of Vaasa. Reports 31
(Harhoff et al. 2003). The practices visible in open-source software development were important in bringing this phenomenon to general awareness. In these pro-jects it was clear policy that project contributors would routinely and systemati-cally freely reveal code they had developed at private expense (Raymond 1999). However, free revealing has been documented in many other cases. Even user enterprises appear to reveal their innovations. In a survey of Dutch high-tech small firms, de Jong and von Hippel (2009) found that many user innovators do not mind if others take notice of their innovations, and most of them would allow strong ties in their networks to inspect and benefit from them.
In line with our presuppositions, we found that a large majority of the Finnish consumer innovators had a positive attitude towards revealing their innovation without a need for compensation (Table 14). Forty-four percent said they would be willing to give away their innovation to all, while another 40 percent is willing to freely share with a selective group of people. One out of six innovators remains reluctant towards free revealing.
Table 14. Willingness to share consumer innovations.
Variable/value Percentage Willingness to share for free
No 16% yes, selectively 40% yes, with everyone 44%
Willingness to share for compensation No 9% yes, selectively 23% yes, with everyone 68%
Notes: Percentages based on 176 validated consumer innovations.
The follow-up question asked why people were (not) willing to reveal their inno-vation-related knowledge for free. See Table 15. Motives for free sharing with everyone include helping others, expected improvements by other users, expected reciprocity, just the fun of sharing, or mere indifference.

32 Proceedings of the University of Vaasa. Reports
Table 15. Motives to share consumer innovations for free.
…with everyone I …selectively II …not at all III Helping 54% Liking 35% Intends to commercial-
ize 31%
Others may im-prove it
17% Sharing with every-one takes too much time
28% Wants innovation to be unique to him/her
19%
Expected reciproci-ty
10% Only if others im-prove or produce it
16% Legal issues 18%
Other reason (fun, indifference)
10% Only those who helped me before
14% Would take too much time/money
18%
Network externality 7% Other reason (no need to share gener-ally)
7% Competing with others, want to keep it to myself
13%
Reputation 2% Other reason 2% 100
% 100% 100%
Notes: Percentages based on 78, 70 and 28 validated consumer innovations for columns I, II and III, respectively.
These motives are comparable with the ones which are usually found in open-source projects, where contributors freely reveal so that others can improve or suggest improvements to the innovation, or they would benefit from enhancement of reputation or positive network effects due to increased diffusion of their inno-vation (Lakhani & Wolf 2005). Compared to open-source, however, in the case of individual consumer innovators pure altruistic motives (i.e. helping others) seem to be more important, while reputation issues are reported less often.
Another substantial share of the innovating consumers indicates that they are will-ing to freely reveal, but only selectively. Their mentioned most often that they are only willing to give favors to people they know and like – mostly relatives and friends. Other influential motives are the expected hassle of communicating and demonstrating their innovation, i.e. diffusion-related costs, or they may be willing to share only with the people they owe something.
Those who are not willing to freely reveal most often indicate that they intend to commercialize their innovation by themselves. From the perspective of social welfare this is not problematic, as the innovation still becomes available to others. Some others again point to diffusion-related costs (‘It would take too much time/money’) or legal issues (‘I infringed on a patent to fix my personal prob-lem’). Finally, some consumer innovators just prefer to keep the innovation to themselves.

Proceedings of the University of Vaasa. Reports 33
Willingness to share for compensation
Innovating Finnish citizens also reported their willingness to reveal innovation should they receive compensation on it. In such cases their attitude towards re-vealing was even better. When offered compensation, 68 percent indicated that they were willing to reveal their innovation to everyone, while only 9 percent is reluctant to do it at all (Table 14). When asked for preferred types of compensa-tion, the pattern was similar as in the previous studies (e.g., de Jong & von Hippel 2009). Money was a preferred type of compensation, but consumer innovators may also be compensated with informal favors, barter trade, and other options shown in Table 16.
Table 16. Preferred types of compensation by innovators willing to share for compensation.
Type of compensation Percentage Money or direct payment 43% Favors (e.g., information, personal help, future discounts) 43% Barter (free products or services) 39% Royalties/license 33% Help with the costs or effort to share 18% Other 8% Notes: Percentages based on responses of 160 innovators willing to share for compensation.
To summarize, it was found that 84 to 91 percent of the Finnish consumer innova-tors are willing to share their innovation to at least a selective group of others pending on the compensation. Even without compensation unwillingness to reveal is marginal, and unlikely to prevent diffusion.
4.4 Diffusion effort and intentions
Diffusion effort
Given general value and willingness to reveal, diffusion will happen only if inno-vating consumers are actually taking an effort to inform others about their innova-tion. In Finland, the percentage of innovations which are communicated or demonstrated to wider audience (including peers, businesses, web exposure, etc.) is relatively low, only one out of four validated innovations (Table 17).

34 Proceedings of the University of Vaasa. Reports
Table 17. Effort by innovators to diffuse consumer innovations.
Source Country Year Sample Frequency von Hippel et al. (2012) United Kingdom 2009 104 consumer innovations 28.9% Ogawa & Pongtanalert (2011) USA 2010 114 consumer innovations 18.4% Ogawa & Pongtanalert (2011) Japan 2011 83 consumer innovations 10.8% Kuusisto et al. (2013b) Finland 2012 176 consumer innovations 26.7% Notes: Percentages indicate what fraction of innovators has done any effort to inform others about their innovation.
In comparison to other countries, Finland is in line with the United Kingdom, and actually doing better than in the US and Japan. Nevertheless, only a minority of validated innovation cases were reported as being revealed to others. Thus, de-spite that a majority of the innovations has value to (at least) some others, and that attitudes towards revealing are positive, only few innovating consumers actually did something to initiate the diffusion process. From the innovation policy per-spective this represents a problem in terms of insufficient diffusion of innova-tions. It is in line with the discussion in Chapter 2, reflecting the argument that user innovators primarily innovate to satisfy their personal needs. Producer inno-vator’s motivation to diffuse innovations is based on earning potential through selling or licensing. The motivation to diffuse innovation is not so clear in the case of user innovators. Once the innovation has solved their own problems all benefits from diffusion-related activities tend be an externality, and – from their perspective – not worth spending any time or efforts. As a result, many innova-tions with potential broad use value remain available only to those developing it themselves.
Diffusion activities
The survey included precise questions for consumer innovators on what they had done to inform others on their novel solution (Table 18). The most common case is that they show the innovation to relatives or friends. According to survey, some innovators go beyond this, taking efforts to enable broader diffusion. They mostly published their design on the Internet, or demonstrated its benefits to a commer-cial supplier hoping that s/he would take it up for further improvements and available for wider markets. Hardly any of the surveyed consumer innovators invested money in the diffusion process, or took any efforts to ease diffusion, for instance by writing a user manual.
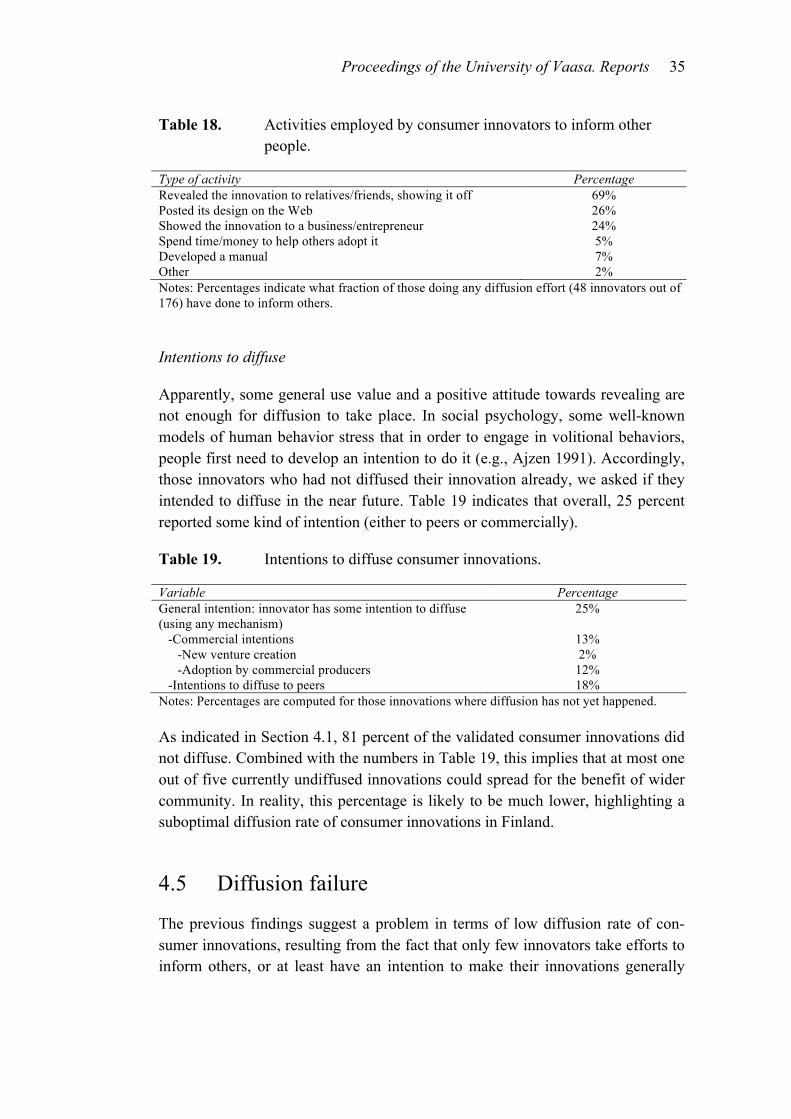
Proceedings of the University of Vaasa. Reports 35
Table 18. Activities employed by consumer innovators to inform other people.
Type of activity Percentage Revealed the innovation to relatives/friends, showing it off 69% Posted its design on the Web 26% Showed the innovation to a business/entrepreneur 24% Spend time/money to help others adopt it 5% Developed a manual 7% Other 2% Notes: Percentages indicate what fraction of those doing any diffusion effort (48 innovators out of 176) have done to inform others.
Intentions to diffuse
Apparently, some general use value and a positive attitude towards revealing are not enough for diffusion to take place. In social psychology, some well-known models of human behavior stress that in order to engage in volitional behaviors, people first need to develop an intention to do it (e.g., Ajzen 1991). Accordingly, those innovators who had not diffused their innovation already, we asked if they intended to diffuse in the near future. Table 19 indicates that overall, 25 percent reported some kind of intention (either to peers or commercially).
Table 19. Intentions to diffuse consumer innovations.
Variable Percentage General intention: innovator has some intention to diffuse (using any mechanism)
25%
-Commercial intentions 13% -New venture creation 2% -Adoption by commercial producers 12%
-Intentions to diffuse to peers 18% Notes: Percentages are computed for those innovations where diffusion has not yet happened.
As indicated in Section 4.1, 81 percent of the validated consumer innovations did not diffuse. Combined with the numbers in Table 19, this implies that at most one out of five currently undiffused innovations could spread for the benefit of wider community. In reality, this percentage is likely to be much lower, highlighting a suboptimal diffusion rate of consumer innovations in Finland.
4.5 Diffusion failure
The previous findings suggest a problem in terms of low diffusion rate of con-sumer innovations, resulting from the fact that only few innovators take efforts to inform others, or at least have an intention to make their innovations generally

36 Proceedings of the University of Vaasa. Reports
available. However, even a low diffusion level (19%) could be optimal in the case the most valuable innovations do spread across the wider community. In other words, from the perspective of social welfare valuable innovations should diffuse, while less valuable ones should not. Accordingly, in case that peer diffusion, ven-ture creation and producer adoption are positively related with perceived general value, low diffusion rates are a less serious issue. Vice versa, if such a relation-ship is lacking, valuable and less valuable innovation diffuse at the same rate. Such situation is not ideal from a social welfare perspective. To explore the corre-lation between general value and diffusion, Table 20 breaks down the clusters of general value (reported earlier in Table 13) across the three diffusion mecha-nisms.
Table 20. Diffusion of consumer innovations in various clusters of per-ceived general value.
General value Diffusion… …new venture creation …producer adoption …to peers
Cluster I: valuable to none 0% 0% 15% Cluster II: valuable to some 1% 7% 19% Cluster III: valuable to many 7% 15% 12% Total 2% 6% 16% Notes: Percentages in cells based on 69, 77 and 30 validated consumer innovations for cluster I, II and III, respectively.
As for the commercial diffusion, there seems to be a positive and significant rela-tionship between general value and both venture creation and producer adoption. The more valuable innovations are perceived to wider community, the more likely they are to diffuse through commercial operation. Moreover, in an absolute sense only a fraction of valuable innovations does diffuse commercially. Although the more generally valuable innovations are more likely to diffuse, this represents some evidence for failure in terms of commercial diffusion.
For peer diffusion the findings are different. Regardless the perceived level of general value, the level of peer diffusion does not go up. There appears to be no significant relationship between the perceived general value and peer diffusion. In this case less valuable innovations are as likely to spread at the same rate as the ones perceived more valuable. This implies that with respect to peer diffusion, the diffusion related problem is more serious4.
4 We followed up doing more robust analyses to investigate the relationship between general
value and the three diffusion mechanisms. In various probit regression models, we controlled for respondents’ educational attainment, motives to innovate, types of innovation collabora-tion, willingness to reveal, effort done to inform others, and perceived adoption costs related to

Proceedings of the University of Vaasa. Reports 37
To conclude, it was found out that consumer innovations in Finland are perceived to be valuable to some others in 44 percent, and to many others in 17 percent of the cases. Furthermore, a majority of the innovators have a positive attitude to-wards free revealing of their innovation (84% to 91%). However, relatively few consumer innovators take an actual effort to inform others about their innovation (27%). As a result, only 19 percent of the consumer innovations diffused to the wider society. Moreover, relatively few consumer innovators have any intention to take efforts in terms of spreading their innovation to wider audience (25%). Finally, beyond that innovation diffusion is rare (no matter if peer diffusion, ven-ture creation or producer adoption is considered), it is not the generally valuable innovations which become broadly available when peer diffusion is focal. These findings suggest that there are problems in the diffusion of consumer innovations. In terms of consumer innovation, there are lots of ‘low hanging fruits’ that could benefit many people beyond the innovating consumer. Yet, the benefits do not materialize due to insufficient spreading of these ideas. What hampers diffusion is that any effort to diffuse is often not in the direct interest of the consumer innova-tor. While the costs accrue directly to the innovator, the benefits of diffusion to society are largely or entirely an externality. Potential innovation policy interven-tions to turn around this problem are discussed in Chapter 7.
learning and time/money investments. All of these variables provide alternative explanations why diffusion may happen or not. Nevertheless, after entering perceived general value, we still found a significant result for commercial diffusion, but not for peer diffusion. These analyses are available on request.

38 Proceedings of the University of Vaasa. Reports
5 CASE STUDY: CONSUMER INNOVATION IN HEALTHCARE
This chapter presents survey findings on user innovation activities by patients, nurses and doctors within the Finnish healthcare sector. Healthcare represents one of the key service sectors and a cornerstone of welfare in the Nordic countries. At the same time the public sector healthcare is facing increasing budget pressure and is in need of novel ideas and problem solutions.
To put innovation by consumers (specifically patients) into perspective, this chap-ter will present findings on consumer innovation in comparison to innovation by individual professional service providers, specifically doctors and nurses. The analysis will illustrate that, in many respects, patients can be considered just as capable of identifying potential improvements as these medical experts. At the same time, it seems that the potential of user innovations is hampered by provider organizations lacking capability to take up innovations that originate from con-sumers. From the user perspective there seems to be a lack of transparent, fair and "inviting" processes for soliciting and integrating user ideas into public sector services (Kuusisto et al. 2013a).
The following analysis will demonstrate that patient innovators are likely to focus their innovation efforts on different areas than professionals, thus complementing innovation by medical staff. It will also break down innovation activities into the three steps of problem identification, problem solving, and solution implementa-tion. In this way it is possible to trace how many potential innovators drop out at each stage and to consider some of the reasons. While more in-depth study is re-quired, the analysis seeks to provide valuable policy relevant information on how it is possible to support user innovation in the healthcare sector.
Section 5.1 describes the incidence of problem identification and problem solving by consumers, compared to medical staff. Section 5.2 describes and compares focal areas of problem identification and innovative problem solving for these groups. Section 5.3 gives background information of consumer innovators, in particular. Section 5.4 provides additional information about the innovation pro-cess. Findings about solution implementation are presented in Section 5.5, fol-lowed by a summary in Section 5.6.

Proceedings of the University of Vaasa. Reports 39
5.1 Incidence of innovative problem solving by patients, nurses and doctors
Overview
As a first step, the respondents were asked about a specific problem, or opportuni-ty for improvement, that they might have encountered with existing medical equipment, procedures, techniques or applications. Out of 1,119 respondents, 461 reported having had a specific problem. Of these, 310 described their specific problems in some detail. The remainder offered no description and was therefore excluded from further analysis. (Further details about sampling and sample com-position can be found in Appendix B.)
Next, respondents were asked whether they had found a specific solution to their problem. If so, they were asked to provide a short description of the solution. Two of the authors screened the entries to decide which ones qualified as innovative solutions – containing (a) some new idea or observation and (b) specific sugges-tions how the problem could be solved. (Additional criteria are explained in Ap-pendix B.) Innovations conducted during both work and leisure time were both qualified, since doctors and nurses often made use of both while working on a specific solution. All in all 92 specific innovative solutions were identified.
Table 21. Frequency of problem identification and problem solving by us-ers in the medical sector.
Group Number of respondents
… identified at least one specific problem in
the last 3 years
… identified at least one specific solution in the last
3 years Patients & relatives 571 111 (19.4%) 31 (5.4%) Nurses 248 107 (43.1%) 38 (15.3%) Doctors 211 68 (32.2%) 12 (5.7%) Other medical professionals
89
24 (27.0%) 11 (12.4%)
Total 1,119 310 (27.7%) 92 (8.2%)
In the sample, some 19.4 percent of patients and their relatives encountered at least one specific problem in the functioning of the medical sector in the previous three years; and 5.4 percent identified at least one specific solution that would solve this problem.
Over the entire sample, the share of problem solving is somewhat higher at 8.2 percent, largely due to nurses who appear significantly more likely than the other groups to identify and solve product and service related problems in the healthcare sector.

40 Proceedings of the University of Vaasa. Reports
Table 22 shows some examples of problems and solutions identified by respond-ents. Not all of these solutions were implemented, as will be explained in detail in Section 5.4.
Table 22. Examples of problems and solutions in the healthcare sector (quotes).
Object Freq. Examples of problems Examples of solutions Device 4.5% Mobility of elderly dementia patients is lim-
ited because of the use of geriatric chairs where they are bound with a belt. Lifting up of the elderly from the chair is extremely heavy once you need to do it several times during the work shift. Chairs are far too high and lack capability for adjustments. They are also extremely heavy to move around. On top of all this they are difficult to clean up with many small lockers etc. Often they are cov-ered with similar cloth as the bus benches are.
The height of chairs needs to be adjustable so that there would not be a need to lift patients to the chairs but they could sit down like on a regular chair and then the height could be adjusted if necessary. Materials need to be designed to be more easily clean-able and covers should be re-movable and washable. In addi-tion, they should be designed to look like a regular piece of furni-ture, not a bus seat.
Eye diagnosis and video documentation Fiber optic lens attached to a tonometer to be used in fundus documentation.
Process/ service
54.2%
There should be a care unit for elderly kidney patients. Care at the elderly care unit could prevent a lot of unnecessary travelling for 3 times a week to get the needed treatment such as hemodialysis, and peritoneal dialysis
It would be a good idea to establish a nursing home where elderly people who need hemodialysis or peritoneal dialysis and cannot do it at home any-more would be treated.
Coupled – device plus pro-cess
32.3%
(Patients) push the alarm button every time they need something, interrupting nurses on going work task and making them to walk tens of time every day to the calling patients, and then back to their other task.
Why couldn't patients also text their nurses from their rooms so that time and steps would be saved while the nurse can read what the patient needs and take it there right away?
Other 9.0% Doctor at the emergency clinic does not
check existing medication from the patient but prescribes a new one. Often existing medication is carefully considered by the primary care doctor. There are also cases when the information the patient gives is not correctly recorded. They just do not want to listen patients carefully.
No valid solution
Total 100%
(N=310)

Proceedings of the University of Vaasa. Reports 41
5.2 Focal points
Overview
The problems identified cover all steps of the treatment chain as well as support-ing aspects spanning the entire chain (Figure 5). Closer analysis of the problems reveals some interesting patterns.
Regarding diagnosis and treatment, respondents who named specific medical in-dications mostly focused on depression, pain, substance abuse and cancer. Con-cerns about professional behavior towards patients were raised with surprising frequency. Not listening to patients/downplaying diseases, privacy issues, and particularly a lack of professional behavior towards the elderly were the issues mentioned most frequently.
Further on, concerns about administration and coordination within and between medical institutions are also quite prominent. Among them, a majority relate to information and communication technology such as lack of access to patient data, insufficient information flows, lack of user friendliness of tools, lack of supported analytical functions, leading to waste of time of medical staff.
(N=310)
Figure 5. Overview of problems described by problem focus.
Access, making appoint-ments
Referral to appropriate care-giver
Diagnosis Therapy Care at medical institute
Home care (by patient,
relative)
Professional behavior of care-givers towards patient
Patient-facing and relative-facing administration and coordination
Administration and coordination within medical institution
Administration and coordination between institutions
Reimbursement
Other
13% 13% 17% 19% 8% 5%
15%
10%
14%
12%
4%
More resources overall 16%
2%

42 Proceedings of the University of Vaasa. Reports
Similarities and differences between doctors, nurses and patients
In terms of problems, patients, nurses and doctors are likely to focus on different areas. Patients, in particular, are the most likely to identify problems related to access to care; making appointments, finding the right expert, etc. At the same time, doctors are the least likely to point out such problems. In the case of care-related problems (all aspects of patient care and rehabilitation as well as staff be-havior towards patients) nurses were the most likely, and doctors again the least likely to point out problems. Finally, doctors were the most likely group, and pa-tients the least likely, to raise administrative issues, particularly those relating to information and communication technology and coordination between medical institutions (all differences significant at the 5% level).
All this implies that a comprehensive assessment of problems in the medical sec-tor requires the combination of insights from all groups, each with its own areas of deep insight and expertise. Patients in particular, being the consumers of medi-cal services, are directly in the system and they can serve a diagnosing function from within the system.
As further support for this view, it was found that patients are able to describe both health-care sector problems and solutions just as specifically as doctors and nurses; there is no significant difference (5% level of significance). While nurses and doctors tend to focus on more general problems patients tend to be more fo-cused on their own situation (0.1% level of significance).
5.3 Who are the consumer innovators?
Table 23 shows which consumer groups feature the highest share of innovators in the Finnish healthcare context. The analysis at hand seeks to understand the inten-sity of their need for a solution.
It turns out that innovation is more likely among both patients and their relatives, if the illness is perceived to be severe or very severe. However, patients suffering from very severe illnesses are less likely to innovate than patients who regard their medical problem as being of intermediate severity - possibly because some of the former are too unwell to undertake additional projects. This decrease is not observed when the innovator is a relative of the patient suffering from a very se-vere disease, as such an intuitive finding.
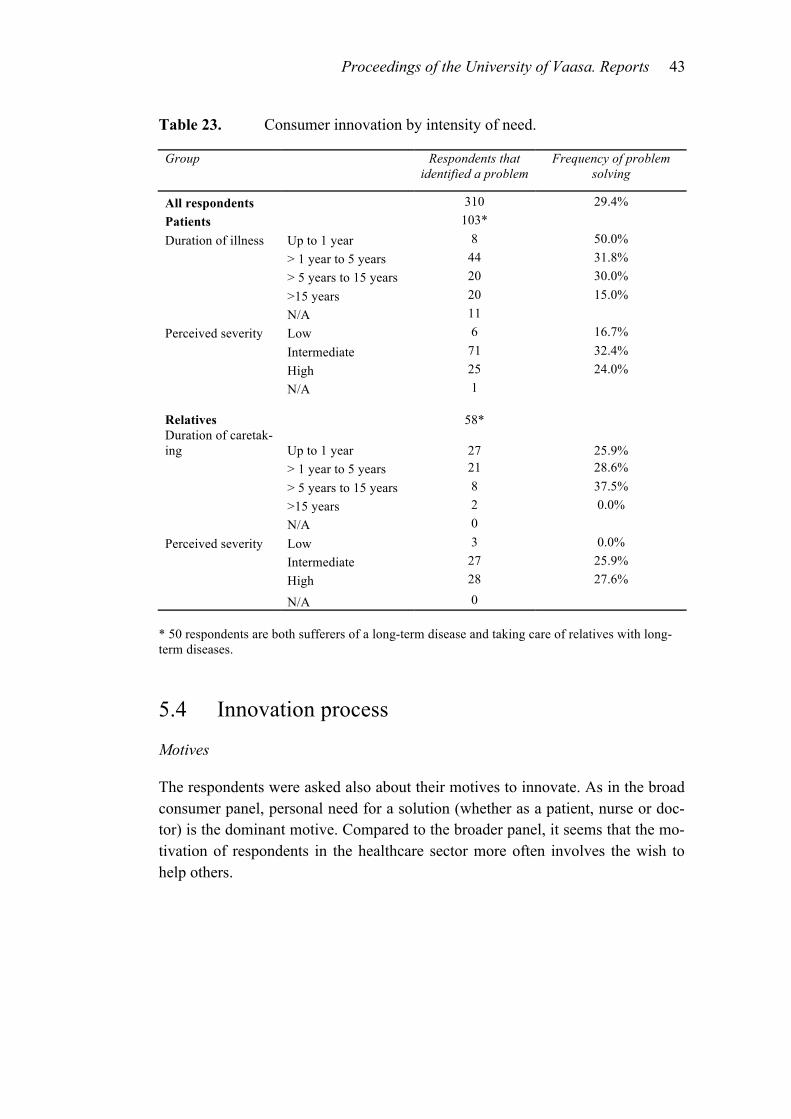
Proceedings of the University of Vaasa. Reports 43
Table 23. Consumer innovation by intensity of need.
Group Respondents that identified a problem
Frequency of problem solving
All respondents
310 29.4% Patients
Up to 1 year 103*
Duration of illness 8 50.0%
> 1 year to 5 years 44 31.8%
> 5 years to 15 years 20 30.0%
>15 years 20 15.0% N/A 11
Perceived severity Low 6 16.7%
Intermediate 71 32.4%
High 25 24.0% N/A 1
Relatives
Up to 1 year
58* Duration of caretak-ing 27 25.9%
> 1 year to 5 years 21 28.6%
> 5 years to 15 years 8 37.5%
>15 years 2 0.0% N/A 0
Perceived severity Low 3 0.0%
Intermediate 27 25.9%
High 28 27.6%
N/A 0 * 50 respondents are both sufferers of a long-term disease and taking care of relatives with long-term diseases.
5.4 Innovation process
Motives
The respondents were asked also about their motives to innovate. As in the broad consumer panel, personal need for a solution (whether as a patient, nurse or doc-tor) is the dominant motive. Compared to the broader panel, it seems that the mo-tivation of respondents in the healthcare sector more often involves the wish to help others.

44 Proceedings of the University of Vaasa. Reports
Table 24. Motives to innovate of users in the Finnish medical sector.
Motive Importance Personal need 45.5 Enjoyment 5.9 Helping other people 38.1 Learning/develop skills 7.9 Sell/make money 1.0 Profile/reputation/status 1.7% 100 (N=128 respondents completed this section.)
Collaboration
In the next question respondents were asked whether other people contributed to the process of developing a novel solution. More than 41% of solutions have ben-efited from contributions by others. However, the collaboration rate is significant-ly lower among consumers than among medical staff (26.6% compared to 57.5%). Thus, the collaboration rate among consumers exactly matches and in its part confirms the results presented in Section 3.3 for the broad consumer panel.
Table 25. Contributions by others.
Did others contribute? (N=181 respondents who
identified a problem)
Did others contribute? (N=60 innovators)
yes 75 (41.4%) 25 (41.7%) no 106 (58.6%) 35 (58.3%)
Investment of time and money
Respondents mostly invest time, only a minority expends money. If they do, it tends to be institutional money for doctors and nurses and personal money for consumers and other medical professionals. Doctors appear to have greater oppor-tunities to spend work time in the pursuit of innovation, whereas nurses are most-ly leisure-time innovators, as are consumers.

Proceedings of the University of Vaasa. Reports 45
Table 26. Resources used for innovation.
Group % spending work time (N=158)
% spending institutional
money (N=152)
% spending leisure time
(N=152)
% spending personal money
(N=154) Patients and rela-tives Doctors
7.9%
52.4%
2.3%
21.1%
40.5%
47.6%
10.5%
15.0% Nurses 26.3% 5.4% 48.8% 2.6% Other medical pro-fessionals
10.0%
0.0%
40.0%
20.0%
Note: Figures include all respondents who at least identified a valid problem (and potentially solved it too) and answered this set of questions.
It should also be noted that many respondents spent neither time nor money. This is due, for some respondents, to a lack of actual implementation, while for others it is due to unintended, accidental discoveries that “just happened”, without time and money being devoted specifically to the purpose.
The importance of being a user for problem solving
As explained in Section 2, users often innovate: They have local knowledge about their needs and the ways in which current product and services fall short of meet-ing them. This knowledge may be sticky, i.e. costly to transfer to others. If this is the case, the user him-/herself may be the most efficient innovator – provided that she has access to required solution knowledge. The findings in the Finnish medi-cal sector closely match this theory. Note that doctors and nurses can be users as well as patients. While patients use medical products and services, doctors and nurses use medical care equipment, tools and processes during the pursuit of their jobs.
The analysis indicates that need-related expertise and solution expertise both strongly increase the probability that someone will be able to solve a problem in the Finnish healthcare sector. Local solution knowledge, i.e. knowledge directly at hand, is particularly important. Stickiness of both need and solution knowledge reduces the chances of finding a solution to a problem. In the healthcare sector, many problems involve several actors or groups; and a problem that is difficult to explain to all parties involved will be harder to solve effectively.
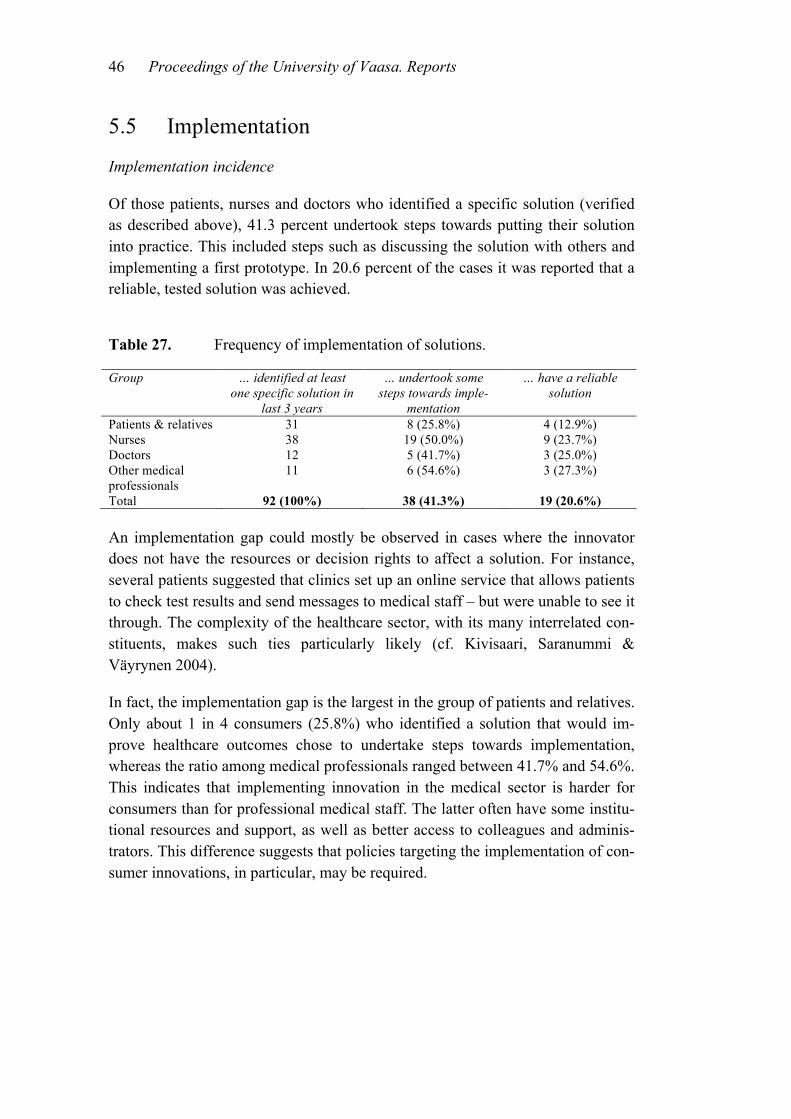
46 Proceedings of the University of Vaasa. Reports
5.5 Implementation
Implementation incidence
Of those patients, nurses and doctors who identified a specific solution (verified as described above), 41.3 percent undertook steps towards putting their solution into practice. This included steps such as discussing the solution with others and implementing a first prototype. In 20.6 percent of the cases it was reported that a reliable, tested solution was achieved.
Table 27. Frequency of implementation of solutions.
Group … identified at least one specific solution in
last 3 years
… undertook some steps towards imple-
mentation
… have a reliable solution
Patients & relatives 31 8 (25.8%) 4 (12.9%) Nurses 38 19 (50.0%) 9 (23.7%) Doctors 12 5 (41.7%) 3 (25.0%) Other medical professionals
11 6 (54.6%) 3 (27.3%)
Total 92 (100%) 38 (41.3%) 19 (20.6%)
An implementation gap could mostly be observed in cases where the innovator does not have the resources or decision rights to affect a solution. For instance, several patients suggested that clinics set up an online service that allows patients to check test results and send messages to medical staff – but were unable to see it through. The complexity of the healthcare sector, with its many interrelated con-stituents, makes such ties particularly likely (cf. Kivisaari, Saranummi & Väyrynen 2004).
In fact, the implementation gap is the largest in the group of patients and relatives. Only about 1 in 4 consumers (25.8%) who identified a solution that would im-prove healthcare outcomes chose to undertake steps towards implementation, whereas the ratio among medical professionals ranged between 41.7% and 54.6%. This indicates that implementing innovation in the medical sector is harder for consumers than for professional medical staff. The latter often have some institu-tional resources and support, as well as better access to colleagues and adminis-trators. This difference suggests that policies targeting the implementation of con-sumer innovations, in particular, may be required.

Proceedings of the University of Vaasa. Reports 47
Value of the innovative solution
Following up on the implementation of solutions, respondents were asked several questions in order to assess the value of their innovation. The answers provide an indication that many solutions are not only valuable to the innovator, but would also be valuable more broadly.
Table 28. Value of the solution to the innovator, and to others.
Motive Agreement (1: do not agree at all, 4:
perfectly agree) The innovation did what I supposed it to do 2.84 The innovation was valuable to me 2.88 This innovation was valuable to other peo-ple
3.21
This innovation can become a valuable medical product or service
3.38
Note: Of those 92 respondents who implemented a solution, N=56 respondents completed this section of the questionnaire.
5.6 Summary
The survey results presented in this chapter provide a case study of user innova-tion in the Finnish healthcare sector. It targeted patients as consumer innovators and compared their innovation behavior to the behavior of medical professionals, specifically doctors and nurses. This allowed a comparison of consumer innova-tions and related to innovations from other sources of the economy.
The analysis shows that 5.4% of patients and their relatives encountered at least one specific problem in the functioning of the medical sector in the previous three years and identified at least one specific solution. This rate is similar to that rate among doctors (5.7%) and lower than the rate among nurses (15.3%).
Interestingly, patients are likely to focus their efforts on different areas than nurs-es and doctors do. They are the most likely to notice problems, and propose solu-tions, relating to access to care – an issue where they possess in-depth use experi-ence. By contrast, doctors are the most likely to identify and tackle administrative problems – being the users of administrative processes and tools and thus having deep need knowledge. Additional analyses confirm that, for innovation to happen, it is important to have local need knowledge and solution expertise, directly at hand. Together, these findings prompt the important conclusion that comprehen-

48 Proceedings of the University of Vaasa. Reports
sive improvement initiatives in the healthcare sector require the combination of insights from all groups, each with its own areas of deep insight and expertise.
A second contribution of this case study was its breakdown of innovation activi-ties into the three steps of problem identification, problem solving, and solution implementation. This analysis shows, for instance, that 19.4% of consumers de-scribed a specific problem they encountered in the healthcare sector and 5.4% identified a solution to this problem; but only 0.7% of consumers managed to implement a functional and reliable solution. Attrition rates are somewhat lower for medical professionals (particularly nurses). In total, 1.7% of the total sample (20.6% of those who identified a specific solution) achieved a functional, reliable new solution. Still, this highlights a substantial stock of opportunity foregone, particularly in the patient domain. An implementation gap could mostly be ob-served in cases where the innovator does not have the resources, decision rights or access to decision makers to effect a solution.
Innovation can be seen as a positive way renew public sector activities and espe-cially so in the healthcare sector which is struggling to cope with limited budgets and mounting demand for its services. This case study provides innovation in-sights from patients, doctors, nurses and other healthcare professionals. They rep-resent both new perspectives and innovation potential that can be useful for the renewal of healthcare services. Moreover, the results clearly suggest that user innovation principles as such represent a helpful bottom-up way to stimulate in-novation in the public sector.

Proceedings of the University of Vaasa. Reports 49
6 NEW SURVEY METHODS AND INDICATORS
One of the project objectives was to further develop the consumer innovation sur-vey methodology. The objective was to obtain a list of indicators which can be applied in future research. Thus, Section 6.1 discusses how consumer innovation has been measured so far, and what the InFi-project has contributed. An innova-tion screening procedure and a list of indicators for future application will be pre-sented. Section 6.2 will discuss how user innovation can be surveyed in the busi-ness context. Although not in the main focus of the project, this overview can be helpful to those who are concerned with collecting innovation data. The following sections will also elaborate on how the adoption of user innovations in the wider society can be captured in official statistics. Overall, the diffusion is a highly sig-nificant part of the process as it has a major influence on the societal value of consumer innovations.
6.1 Consumer samples
Early empirical user innovation studies were concerned with specific product types, including both industrial and consumer products. Von Hippel (1976) identi-fied a high ratio of user to producer innovation in a sample of the most important innovations in scientific instruments in the past 20-30 years. For consumer prod-ucts similar results have been found for sports equipment (Shah 2000). Alterna-tively, researchers have identified the proportion of user populations engaging in innovation affecting specific product categories. For individual end consumers examples are outdoor products (Lüthje 2004), extreme sporting equipment (Franke & Shah 2003), mountain biking equipment (Lüthje, Herstatt & von Hip-pel 2002) and banking services (Oliveira & von Hippel 2011). These studies gen-erally find that 10 to 40 percent of user populations are innovators (von Hippel 2005). Collecting user innovation data from broad samples of consumers is, how-ever, of recent date.
Previous survey methods
In the current project we aimed to expand a recent line of work in which surveys are done in broader consumer populations. The first attempt was done by Flowers and colleagues (2010) in the United Kingdom, based on computer-assisted tele-phone interviewing. Collecting data from 1,173 UK consumers aged 18 and over, they asked respondents whether they had created and/or modified software in the past three years, then ditto for the creation and/or modification of hardware. For

50 Proceedings of the University of Vaasa. Reports
each of these options open-ended questions were asked to exclude false positives (e.g., “I bought a piece of Ikea furniture and put it together myself.”) Additional false positives were eliminated via analysis of responses to two screening ques-tions. If respondents knew of equivalent products already available on the market, or if they had developed the innovation as part of their jobs, their claimed innova-tions were excluded. In effect, the survey was designed to identify only innova-tions with some kind of functional novelty that consumers had developed in their leisure time. After the United Kingdom, similar surveys were implemented in the Netherlands (de Jong 2011a), Japan and the USA (Ogawa & Pongtanalert 2011).
Piloting new screening questions
In the InFi-project we developed a range of pilot studies to develop and test a next generation of consumer survey indicators. A detailed overview of our approach and findings can be found in Appendix A. Here, we briefly summarize our find-ings.
The objectives of the InFi pilot were fourfold. First, it built on the previous stud-ies that many consumers are not aware of what innovation actually entails. As a consequence, more specific cues are needed to be provided to support adequate recall. Drawing on pilot surveys of 100 highly-educated Finnish consumers each, it became clear that offering and inquiring for eight specific cues (representing different types of consumer innovations) provides more reliable data. The investi-gated areas of innovation include: (1) computer software, (2) household fixtures and furnishing, (3) transport and vehicle-related, (4) tools and equipment, (5) sports, hobby and entertainment, (6) children and education-related, (7) help, care and medical, and (8) other (open-ended category).
Second, previous studies have indicated that by inquiring about modifications or significant improvements, beyond creating innovations from scratch, caused trou-ble, e.g., people reported innovations like ‘putting together Ikea furniture’. Thus, in Finland the survey experimented with a more restrictive definition that focused questions only on ‘creations’. It was found out that in consumer samples the dis-tinction between innovation modifications versus new creations was less im-portant. There is a grey area between the two, and asking respondents only for ‘creations’ diminished our screening effort, and provided nearly identical results.
Third, it was tested if few advance screening questions can be added to the survey procedure in order to diminish overall respondent burden. More specifically, be-fore asking for user innovations, it was checked if respondents were ever tinker-ing with machines, cars, computers or software in their leisure time, and if they

Proceedings of the University of Vaasa. Reports 51
ever spend their leisure time on inventions or developing new products, applica-tions or concepts. It was found out found that individuals who never tinker or engage in inventive activity were unlikely to be consumer innovators. As a result of these screening questions both interviewees and respondents burden was re-duced and the productivity of the interviewing improved.
Fourth, data have so far been collected by means of phone surveys. This was nec-essary because researchers needed detailed descriptions of reported innovations – to clean up the data for accurate population estimates. Obviously, web surveys would be more cost-effective, so it was tested if these would give similar esti-mates of the share of innovating consumers. The results indicated that telephone surveying remains the preferred option, but electronic surveys are a possibility and potential cost saver in future data collection efforts.
Recommended screening procedure
In order to identify consumer innovators, it is recommended to employ a survey procedure which includes at most six steps. For each of the aforementioned cues, respondents indicate if they have created it in the past three years (e.g., ‘Did you create any computer software for personal need?’). If yes, up to four additional questions are asked to screen out false positives:
• Respondents indicate if they created it (e.g., computer software) for their job or business – to screen out job-related innovations
• They then indicate if they could have bought a similar application on the market if they Thad wanted to – to screen out homebuilt versions of exist-ing products
• They indicate if their primary motive was commercial rather than personal need – commercially-driven innovations are discarded
• Finally, respondents may be asked to describe their innovation and its functional novelty (open-ended questions).
As a sixth step, before commencing with this screening procedure, two simple screening questions can be asked, i.e. if respondents ever tinker in their leisure time, and if they ever spend their time on inventions or developing new products, applications or concepts. If not, the respondent can be saved the extensive list of questions to find out if s/he is a consumer innovator. A ready-to-use survey script based on this procedure can be found in Appendix C.

52 Proceedings of the University of Vaasa. Reports
Indicators for consumer innovation
Table 29 gives an overview of the indicators which are available to date to meas-ure the incidence, nature and diffusion of user innovations developed by individu-al consumers.
Table 29. Indicators for the incidence and nature of user innovation by con-sumers.
Indicator Description Values (population level - indicators on the share of innovators in a broad population)
Innovator Respondent created a user innovation in past three years 0 (no); 1 (yes) Innovation object
Innovation was concerned with… …computer software 0 (no); 1 (yes)
…household fixtures or furnishing 0 (no); 1 (yes)
…transport or vehicles 0 (no); 1 (yes)
…tools or equipment 0 (no); 1 (yes)
…sports, hobby or entertainment 0 (no); 1 (yes)
…children or education 0 (no); 1 (yes)
…help, care or medical products 0 (no); 1 (yes)
…other products or applications 0 (no); 1 (yes) (innovation level - indicators related to specific reported innovations)
Motives Innovation was created for…
…personal need 0-100 points
…to sell or make money 0-100 points
…to learn or develop own skills 0-100 points
…to help other people 0-100 points
…the fun of doing it 0-100 points
Collabora-tion Innovation was developed in collaboration with others 0 (no); 1 (yes)
Average number of collaborators No. of collaborators
Investment Estimated time investment to develop the innovation No. of person-days
Estimated money investment to develop the innovation Amount of money
Protection Innovation was protected with any intellectual property right 0 (no); 1 (yes) Revealing Respondent willing to freely reveal the innovation…
…to all 0 (no); 1 (yes)
…selectively 0 (no); 1 (yes)
Respondent willing to reveal for compensation…
…to all 0 (no); 1 (yes)
…selectively 0 (no); 1 (yes)
Respondent employed activities to inform others about the innovation 0 (no); 1 (yes)
Diffusion Innovation commercialized via new venture creation 0 (no); 1 (yes)
Innovation transferred to commercial producer 0 (no); 1 (yes)
Innovation adopted by others via peer-to-peer sharing 0 (no); 1 (yes)
No diffusion of the innovation 0 (no); 1 (yes)
Diffusion intentions
Respondent has intentions to… …commercialize the innovation via new venture creation 0 (no); 1 (yes)
…transfer the innovation to a commercial producer 0 (no); 1 (yes)
…have others adopt the innovation via peer-to-peer sharing 0 (no); 1 (yes)
…not diffuse the innovation 0 (no); 1 (yes)

Proceedings of the University of Vaasa. Reports 53
This development work offers a well-developed script for future surveys that seek to utilize these indicators in consumer innovation measuring. The full script can be found in Appendix C. The survey script starts with the aforementioned screen-ing procedure to trace innovative respondents and the objects of their innovations. In the second part of the survey, innovation and diffusion-related questions are asked for specific innovations that respondents reported in the first part. Obvious-ly, additional questions can be added depending on the researcher’s specific inter-ests and purposes. For example, in Finland detailed questions on the perceived general usefulness of reported innovations, and on respondents’ willingness to share were included, in order to explore market failure in the diffusion of con-sumer innovation.
In conclusion, the InFi-project has been instrumental to advance the survey meth-ods for consumer samples and available indicators. This is evidenced in Portugal, Sweden and Canada, where local governments have initiated surveys applying the methods developed in Finland. However, it needs to be stressed that the meas-urement of consumer innovation is still evolving. State-of-the-art surveys tools are currently helpful for ad-hoc studies, but for continuous monitoring and official statistics they are probably still too elaborate. One challenge is to reduce the number of questions, which may be done by asking extra advance screening ques-tions like the ones suggested here.
6.2 Firm samples
In comparison to individual consumer surveys, the measurement of user innova-tion in business context is somewhat more advanced. There are currently three survey methods available, which will be summarized next (for a more elaborative treatment, see de Jong & von Hippel 2013).
Method 1: AMT survey and follow-up
An indication for the extent in which firms engage in user innovation can be de-rived from a survey of Advanced Manufacturing Technologies (AMT). Back in 1998, Statistics Canada sampled in their AMT survey thousands of Canadian manufacturing plants with at least 10 employees. The survey included questions on the adoption, modification and development of specific technologies. Re-spondents were offered a list of technologies, e.g., computer-aided design, to in-dicate if they currently used it in their plant. If yes, they were asked how the tech-nology had been introduced: by licensing it or buying it off-the-shelf, by modify-ing an existing technology, or by developing a new technology from scratch. It

54 Proceedings of the University of Vaasa. Reports
appeared that more than half of the surveyed plants were either technology modi-fiers or technology developers (Arundel and Sonntag 2001). In 2007, the AMT survey was updated by Schaan and Uhrbach (2009) who went on organizing a follow-up survey to collect data on the user innovation process, registering varia-bles like time and money expenditures, collaboration partners, and more.
All three methods discussed here have specific advantages and disadvantages. The AMT survey is an existing source of data, providing a quicker route to cap-ture user innovation in official statistics. The survey is based on very specific cues, so that it is less likely that respondents would misunderstand any questions or overlook relevant innovations. A drawback is that the AMT is not as wide-spread as the CIS (see later), that it only includes technological innovations, and leaves out organizational innovations. Finally, to collect detailed information on the innovation process, a follow-up survey is needed.
Method 2: Telephone survey
To more directly capture user innovation with specific indicators, de Jong and von Hippel (2009) piloted survey questions in a sample of high-tech small firms. They utilized two indicators of the presence or absence of user innovation: (1) had the firm developed new process equipment or software for its own use; (2) had the firm modified existing process equipment or software for its own use within the past three years. This study gave rise to a second type of indicators which are collected by computer-assisted telephone interviewing (CATI). Re-spondents first indicate whether they innovated in software or physical products, and if the created their innovation from scratch or by modifying an existing prod-uct. Next, the survey script follows up with open-ended questions to obtain a de-tailed description of what respondents have done, and why, in order to screen out false positives. Finally, more false positives are eliminated via additional ques-tions, i.e. if respondents know of equivalent products already available on the market, and if they developed their innovations for customers (which would make the example a product innovation). Later on this method was also applied on samples of Dutch and British SMEs (de Jong & von Hippel 2009; Flowers et al. 2010).

Proceedings of the University of Vaasa. Reports 55
Diffusion of user innovations - sharing and adoption behavior
The latest development utilizing this approach is a telephone survey exploring user innovation intensity and diffusion among Finnish businesses. This analysis has two phases. First, the survey measures user innovation intensity among re-spondent firms and the diffusion rate of these innovations to other businesses. In the second phase, the analysis explores to what extent the same respondent firms themselves have adopted innovations developed by users (Kuusisto et al. 2013a).
This method includes a fully dedicated survey in which only user innovation data are collected, including process questions like collaboration, investments, applica-tion of intellectual property rights, free revealing of innovations, and diffusion patterns. There is no need for follow-up surveys. Moreover, the CATI technique enables a rigorous screening procedure so that falsely reported innovations can be removed, making this method very suitable for academic purposes. A disad-vantage is that a connection with official surveys (e.g., CIS) is missing, making it unsuitable to produce official statistics.
Method 3: CIS and follow-up
A third method is to use the CIS as a screening survey to trace potential user in-novations. The usual question on the presence of process innovation can be con-sidered a first indication. If the response is positive, then respondents are asked if their enterprise developed the process innovation (1) by itself, (2) together with other enterprises, (3) by adapting or modifying processes originally developed by other enterprises or institutions, or (4) entirely by other enterprises or institutions (Gault 2013). Gault (2012) explains that positive answers to options 1 and 3 sug-gest the presence of user innovation, while the second option might. To gain more information, a follow-up survey can be organized. The follow-up survey can also record innovation process variables like collaboration, intellectual property and investments.
This CIS-based method has been applied in South-Korea (Kim & Kim 2011) and Mozambique (Zita & Lopes 2011). Its main advantage is that the CIS is wide-spread, so that including it in the official statistics is not a leap. A drawback is that it is assumed that the first step (identifying potential user innovators with the CIS) captures all relevant user innovation activity, which still needs to be empiri-cally demonstrated. Simultaneously, the first step has been shown to provide many false positives (Kim & Kim 2011), so a follow-up is indispensable in order to provide precise data on the frequency of user innovation.

56 Proceedings of the University of Vaasa. Reports
CIS with separate user innovation module
Statistics Finland piloted a dedicated user innovation module in the Finnish 2010 CIS (Niemi & Kuusisto 2013). It probes the importance of users as sources of information and as active collaborators. It also examines the importance of prod-ucts made by users to the activity of innovation in the producing enterprise. A significant finding is that the use of the products originating with users is more likely to result in a ‘new to the market’ innovation. The importance of this finding is that new or significantly improved products taken from users result in new to the market innovations and therefore have a greater likelihood of generating reve-nue and market share than innovations that are just new to the firm.
Adoption of user innovations: producer perspective
Each of the aforementioned survey methods may include questions on if and how innovations spread across society – which can be done by new venture creation, adoption by (other) commercial businesses, and peer-to-peer sharing.
A different perspective to capture the diffusion of user innovations is to modify official firm surveys (like the CIS). In this vein, Gault (2012) has been concerned with commercial producers who may adopt users’ innovation to use themselves, and/or to develop further in commercial products. He explained to what extent user-driven innovation is already present in official statistics. Table 30 shows how the adoption of user innovations developed by either firms or consumers is re-flected in the CIS.
Table 30. Diffusion of user innovation in official statistics.
Type of user innovation Diffusion mechanism Firm modifies/develops a process
(a) Consumer modifies/develops prod-uct (b)
1. Producer adoption Product innovation (user firm is source of innovation)
Product innovation (consumer is source of innovation)
2. New venture crea-tion (or new product line)
Product innovation (user firm becomes producer)
Product innovation (consumer becomes an entrepre-neur)
3. Peer-to-peer shar-ing
Process innovation in adopting firms (developed entirely by other en-terprises or institutes)
Not yet visible
Source: Derived from Gault (2012: 122).

Proceedings of the University of Vaasa. Reports 57
The left-hand column provides the case of user innovation by firms. If innova-tions are transferred to a producer (1a), or brought to the market by the user firm itself (2a), diffusion would soon or later become visible in the frequency of prod-uct innovation as measured by the CIS. In the case of 2a, however, the source of innovation may be lost and additional questions and/or follow-up surveys would be needed to document if product innovations were first developed by users (Gault 2012). If user innovations are shared peer-to-peer (3a), adopting firms would report a process innovation which is entirely developed by another enter-prise or institute. In sum, user innovation by firms should be pretty well captured.
For consumer innovations, however, the situation is different (right-hand col-umn). In case of producer adoption (1b) and new venture creation (2b), statistics on product innovation should go up. But if consumers share their innovations peer-to-peer (3b), this is not considered innovation adoption according to the Oslo Manual (OECD/Eurostat 2005). What would be needed first is a modification of the definition of product innovation, in such a way that product innovation is not limited to market introductions, but also includes the situation when new products are made available to potential users - which does not necessarily happen via market mechanisms, but can also include sharing in a community of practice or peer group. An outcome of this project is a specific recommendation (Gault 2012) for a change in the definition of innovation for consideration when the Oslo Man-ual is next revised.

58 Proceedings of the University of Vaasa. Reports
7 POLICY IMPLICATIONS
The previous chapters indicate that the scope, nature and intensity of consumer innovation in Finland are comparable to other developed countries such as Japan, the U.S.A. and the UK. User innovations are often complementary to producer innovations, as we saw in the study of the Finnish healthcare sector. The value of consumer innovations is also clearly demonstrated. However, only a fraction of user-created innovative solutions are actually implemented, and an even smaller fraction of useful consumer innovations spreads to other economic actors. This is not ideal from the social welfare point of view and there is a need for policy in-terventions that are primarily concerned with promoting sharing and spreading the innovations. In addition, it is important to secure Finnish consumers access to world-class tools and infrastructure that enable effective implementation of user ideas. This chapter presents initial ideas on how innovation policy can be de-signed to promote consumer innovation5.
In order to account for consumer innovation, three general design principles merit attention: (1) avoid the dominant logic of the producer-centered innovation mod-el, (2) design innovation supports that are open also for individuals, not just for businesses and organizations and (3) use of pull- and push type policies as well measures that stimulate networking.
Design principle 1: Policy thinking addressing consumer innovation and diffusion thereof needs to break free from the dominant producer innovation logic
In comparison to the producer-centered view, the user-centered innovation model implies a need for a significant shift in policy-thinking. Typical initial reaction to user innovation is that it is an interesting and evolving area but only few policy makers do fully recognize its implications. While long-standing producer-centered model assumes that consumers just consume, it can be hard to accept that innovation policy should also directly target users.
However, Chapter 3 provides consistent empirical evidence of widespread inno-vation activity among Finnish consumers creating variety of novel goods and ser-vices. As described in the Finnish policy document (Ministry of Employment and the Economy 2010), innovation by consumers is not the same as ‘co-creation’ processes in which consumers and producers work together in product develop- 5 In the case of Finnish healthcare case innovation promotion covers patients, nurses, doctors
and other medical professionals.

Proceedings of the University of Vaasa. Reports 59
ment. Nor is it a form of ‘user-driven’ innovation in which producers pay close attention to user needs while developing new products for them. Instead, the key point is that consumers themselves create innovative goods, services and process-es.
The user-centered model of innovation is not yet very widely recognized and pol-icy makers face a steep learning curve in adopting it. For instance, Denmark start-ed pioneering with policies for user innovation in 2007 (Ogawa, Pongtanalert & Flowers 2011). Although initiated as a user-innovation policy, their grant scheme was open to research institutions, universities and companies to include users in product development to better target their R&D. Apparently the dominant logic of the producer-centered model took over when this grant scheme was designed and implemented. What remained was a producer-centered policy intervention to bet-ter account for the needs of users, rather than supporting the development and/or diffusion of innovations which users develop initially for personal need.
Design principle 2: Design innovation supports so that larger number of initia-tives becomes open also for individuals and can thus improve their chances of success in innovation creation and dissemination
A second restrictive element in incumbent policy-thinking is that most innovation supports are offered for organizations only. This view ignores the fact that many user innovators are individuals. Beyond entrepreneurs, managers and individual inventors, they can be employees in non-R&D functions and individual consum-ers. Hence, increasing number of user innovation supports should be made avail-able to consumers who may engage in open-source projects or individual innova-tive efforts at home. The healthcare case indicates that there can be a serious im-plementation gap in consumer innovation that constitutes a substantial loss of innovation potential and positive externalities for society. From this perspective, individual innovators access to innovation supports is important.
An innovative solution developed by a consumer but never shared with society will only create a benefit internal to the consumer, while any external benefit is lost due to lack of diffusion. In such case consumers that change goods or ser-vices for their benefit but do not transfer the knowledge are not innovators (Gault 2012).
Figure 6 highlights consumer innovation diffusion options and relevant policy needs. Starting from the segment 1 representing user innovation intensity. Low level of consumer innovation intensity can justify innovation policy interventions assuming that some of the consumer innovations can diffuse and hence represent

60 Proceedings of the University of Vaasa. Reports
value for the wider society. Typically the evaluation of consumer innovation in-tensity is based on international comparative analysis and development over time. The arrows in the Figure 6 present different diffusion routes for consumer innova-tions and point to opportunities for policy interventions. The arrow pointing from segment 1 to 2 represents a situation where the consumer innovator shares knowledge with a community of practice or user group. Start-up business in seg-ment 4 represents entrepreneurship driven commercialization of consumer inno-vation. Another option for ‘market based’ commercialization is that an existing producer firm6 adopts the consumer innovation. As the arrows indicate, there are several diffusion routes for the commercialization of user innovation. These op-tions are related to different types policies, including innovation-, social- and en-trepreneurship policies that can promote the diffusion of consumer innovation.
Figure 6. Potential areas for policy interventions promoting knowledge trans-fer arising from consumer innovation.
6 In the healthcare case consumer innovations are adopted by the public sector organizations that
are producing healthcare services.
2.#Community#of#prac1ce#or#a#peer#group#
4.#Start6up#business#
3.#Producer#business##
1. Consumer#innova1on###intensity#
#

Proceedings of the University of Vaasa. Reports 61
Design principle 3: Effective consumer innovation policy employs pull- and push type policy actions as well measures that stimulate networking.
Table 31 presents a grouping of consumer innovation and diffusion promotion policies that are either creating pull or push for innovations and diffusion. The third group of policy actions is targeting networks that can foster consumer inno-vation intensity and diffusion. Each of the presented policy actions are linked with policy needs areas 1-4 as presented in the Figure 6.
Push-type policy actions seek to stimulate creation of consumer innovations through positive publicity, capability building and by motivating consumers’ will-ingness to share their innovations. Capability building includes consumer innova-tion related knowledge development and publicity campaigns that can make the phenomena and its benefits more widely understood. Another important policy action is promoting consumer innovators’ willingness to share innovations with peer groups, communities of practice and businesses. Finally, push-type policies seek to build consumers capabilities, skills and positive attitudes towards entre-preneurship and business start-ups.
Pull-type policy actions seek to create more demand for consumer innovations and stimulate diffusion of such innovations. Policy actions include measures that can activate businesses and public sector organizations demand for consumer in-novations. Support for consumer innovation based entrepreneurship provides an-other way for commercial diffusion of consumer innovations. User innovation based start-up firms can be started by individual consumers, consumer communi-ties or by existing producer businesses.
Networking related policy actions promote consumer innovation intensity and diffusion by supporting network development between consumer innovation start-ups, consumer innovation communities, producer businesses and public sector organizations. Table 31 presents these options in detail.

62 Proceedings of the University of Vaasa. Reports
Table 31. Consumer innovation promotion – a policy classification.
The next sections will present a range of additional ideas that can be helpful in making the current innovation policy mix friendlier towards consumers. Howev-er, such attempts are most likely to be fruitless, unless the nature of the user inno-vation, and the necessity to account for individuals’ behavior, are understood and accepted.
7.1 Recommended policy measures
Governments in various countries have recently started to recognize users as a potential target for innovation policy. The United Kingdom was first to measure innovation in broad samples of firms and consumers (Flowers et al. 2010). A sim-ilar effort has been made in the InFi-project in order to improve the survey meth-ods and to develop a standardized list of indicators. More recently, similar sur-veys of consumer innovation have been started in Portugal, Sweden and Canada. Following the Finnish lead, also Germany and Switzerland are currently including new questions in their CIS surveys to better capture user innovation at the firm level (Niemi & Kuusisto 2013). While most countries are still in the phase of re-search and measurement, Finland has been pioneering with actual policy interven-tions. In their 2010 innovation policy programme, simultaneous attention was paid to user innovation (recognizing the role of users as a driving force of innova-
Reference'to'figure'7.1 Push type policy actions promoting consumer innovation intensity and diffusion
1Consumer innovation related knowledge development and publicity campaigns, making the phenomena and its benefits widely known in the society. For instance, by means of measuring, indicator development, and better statistics on consumer innovation intensity and diffusion.
1'=>'2 Encouraging consumers sharing of innovations with a Communities of Practice/Peer groups, so that unstructured activity transforms into more organised one.
1'=>'3 Encouraging sharing of consumer innovations with businesses that have capabilities to commercialise innovation effectively.
1'=>'4 Science, education and entrepreneurship policies building capabilities for consumer innovaton based business start-ups.
Pull type policy actions promoting consumer innovation intensity and diffusion
1'=>'3 Promotion of consumer innovation take-up by businesses and public sector organizations.
1'=>'4 Entrepreneurship support creating pull for consumer innovator start-ups.
2'=>'4 Entrepreneurship support creating pull for start-ups in user groups and communities of practice.
3'=>'4 Support for producer firm spin-offs, ’Intrapreneurship’ and user inovation based start-ups.
Networking related policy actions promoting consumer innovation intensity and diffusion
2'<=>'3 Networking supports for user groups / communities of practice and for producer businesses / public sector organizations.
4'<=>'3 Networking supports for consumer innovation start-ups and producer businesses, and for consumer innovation start-ups and public sector organizations.
Reference to figure 6

Proceedings of the University of Vaasa. Reports 63
tions for personal need) and user-driven innovation (Ministry of Employment and the Economy 2010).
Table 32 gives an overview of recommended directions for policy. Some direc-tions are general, while others are primarily concerned with the development and the diffusion of consumer innovations. Given that the social welfare benefits of consumer innovation are often limited by a lack of diffusion-related incentives, policy interventions promoting the spread of innovation are emphasized.
Table 32. Recommended policies for consumer innovation.
Recommendation Focus a Investment into research on and measurement methods
directed at user innovation Generic
b Promotion of supportive infrastructures and ecosystems for user innovation, e.g. fab labs, hacker spaces, maker fairs, open source societies, support for individual citi-zens, experiments, innovation offices, and -tool kits
Development and diffusion of innovations
c Focus on intelligent regulation as stimulus for consum-er innovation intensity and diffusion
Development and diffusion of innovations
d Development of consumers innovation capacity, e.g. science, technology, engineering, and mathematics (STEM), social science education and modular design skills
Development of innovations
e Up-dating of intellectual property regime and IP man-agement skills
Generic and diffusion
f Other incentives for consumer innovation intensity and diffusion e.g. support for consumer innovation commu-nities, and consumer innovation based entrepreneur-ship, and promotion of user innovation adoption in producer firms
Generic and diffusion
Ad (a) Investment into research on and measurement methods directed at user innovation
Despite the vast scope of user innovation phenomena research based knowledge on user innovation and its societal benefits remains limited. There is a clear need to invest in the development of internationally comparable statistics in this area. At present, the statistics are not measuring the intensity of consumer innovation activity nor the diffusion of such innovations. Until there is better understanding on user innovation and its societal benefits, it will be hard to develop evidence-based policies to support user innovation and its diffusion.
Especially consumer innovation is still dark mat-ter as far as official statistics are concerned. To date there seems to be no official survey which
Consumer innovation and its societal benefits are not fully understood. Better statistics and deeper understanding of con-sumer innovation and its diffusion create basis for effective policy actions.

64 Proceedings of the University of Vaasa. Reports
documents innovation by individual consumers. For this purpose the survey script offered in Chapter 6 will be useful, although this method need further refinement and simplification. A logical next step would be to test it in the context of national survey, for example, a survey of consumer time use.
AMT and CIS-based methods (Chapter 6) provide well-established international platforms for user innovation measuring in firms. However, these surveys need further development to provide in-depth information on how firms develop user innovations, and, to what extent and how these innovations diffuse (see Niemi & Kuusisto 2013). Cognitive testing of the current questions in official surveys (e.g., process innovation questions in the CIS) would be merited, so that these questions can more effectively serve as screening questions for detailed additional data col-lection, or may even be refined for this purpose.
Ad (b) Promotion of supportive infrastructures and ecosystems for user innova-tion
Innovation by users tends to be widely distribut-ed rather than concentrated among just a very few innovative users (von Hippel 2007). This thinly spread innovation activity is a challenging target for public innovation supports, currently organized to serve businesses and research organizations. However, it is im-portant that user-innovators can combine and leverage their efforts. Users achieve this by engaging in many forms of cooperation. Direct, informal user-to-user co-operation (assisting others to innovate, answering questions, and so on) is com-mon. More organized cooperation is also commonplace, with users joining to-gether in networks and communities that provide useful structures and tools for their interactions.
In practice consumer innovators and inventors are very much overlapping groups. However, organizations that support inventors have hardly recognized consumer innovators. This is a prom-ising new territory for ELY Centres and for the Foundation for Finnish Inventions that are renewing their activities. In fact, sup-port for consumer innovation fits very well into its service portfolio:
‘The foundations basic service portfolio includes providing advice, and evaluating and developing inventions and innovative ideas. Growth and international potential are emphasized in evaluating the
Existing inventor support instru-ments need to be up-graded to provide support for consumer innovators and user communi-ties.
Innovation supports for individu-als needs to be developed as a way to stimulate consumer inno-vators and their efforts to dis-seminate innovations.

Proceedings of the University of Vaasa. Reports 65
ideas. Promising ideas are developed into business proposals or li-censing projects together with experienced business advisors. The op-erations of the Foundation for Finnish Inventions are confidential and our services are free of charge.’
Innovation offices represent yet another way to organize support. They can be established within organizations to support user innovation and to integrate dif-ferent perspectives and knowledge sets to increase organizational performance. The analysis of healthcare sector demonstrated the complementarity of the inno-vation activities of users and medical professionals. In this context hospitals in the U.S.A. and Sweden, among other countries have created internal innovation of-fices where different parties can come together and innovate7. VINNOVA, (the Swedish innovation agency) gives grants to hospitals that wish to set up innova-tion offices and testbeds. These can support innovators in further developing, im-plementing and potentially also commercializing their ideas. The MakerNurse project in turn seeks to locate nurses that innovate and spread knowledge on this activity8.
From innovation policy point of view, low-cost Internet access also provides a core infrastructure for user innovation activities. Government actions to assist networking and collaboration include ensuring that widely-distributed potential innovation contributors have low-cost access to each other and to problems of interest to them being worked upon by others. Currently, the Internet already pro-vides an infrastructure for user innovator collaborations (Lakhani & Wolf 2005). Examples of this type of activities include open-source projects such as Apache9 and Finnish COSS association10. Moreover, support for open standards and open
7 http://ki.se/ki/jsp/polopoly.jsp?d=36166&dispd=38026&l=en http://www.vinnova.se/sv/Ansoka-och-rapportera/Utlysningar/Effekta/Testbaddar-inom-halso-
-och-sjukvard-och-aldreomsorg/ http://www.massgeneral.org/about/newsarticle.aspx?id=1606 8 MakerNurse project is collecting stories from inventive nurses across the nation to better un-
derstand what drives them to innovate and how best to nurture the creative potential of the American nurse. www.makernurse.org
9 Formerly known as the Apache Group, the ASF was incorporated in 1999 as a membership-based, not-for-profit corporation in order to ensure that the Apache projects continue to exist beyond the participation of individual volunteers. Individuals who have demonstrated a com-mitment to collaborative open-source software development, through sustained participation and contributions within the Foundation's projects, are eligible for membership in the ASF. An individual is awarded membership after nomination and approval by a majority of the existing ASF members. Thus, the ASF is governed by the community it most directly serves -- the peo-ple collaborating within its projects. http://www.apache.org/foundation/
10 COSS ry is non-profit association that promotes open source code development, open data, open interfaces and open standards development, more details from: http://coss.fi/coss-ry/

66 Proceedings of the University of Vaasa. Reports
interfaces is merited, so that participants in collaborative projects can innovate with the fullest information and the fewest interface constraints possible (von Hippel & Jin 2009).
In the case of physical products, online collaboration is not always sufficient. Alt-hough consumers can share and distribute product designs on the Web, joint prob-lem solving typically demands physical presence in order to share sticky solution information. To support geographically concentrated networks and collaborative activities, intermediary organizations and facilities are helpful.
Examples of such activities include Fab labs11 that provide widespread access to modern means for invention, and Hackerspaces12 that are com-munity-operated physical places, where people can meet and work on their projects. Especially in the U.S.A., rapidly evolving range of com-mercial organizations provides support at various stages of consumer innovation realization and diffusion. Growing list such businesses include; Maker Shed, Kickstarter, Dragon Innovation, MakerBot, Quirky, Adafruit, just to name some. Such evolving ecosystem can lower the cost of implementation for consumer in-novators, and also effective channel for diffusing innovations among makers. Such is the momentum of Maker Movement that it has attracted Presidential at-tention and recently the White House organized a Hangout focusing the topic13.
Still, there may be areas in which consumers have deep knowledge and insight, but lack critical resources for implementation. Those are particularly areas where the aggregation of demand is required to advance a systemic solution. Such areas could still benefit from user-created insights and solutions via the use of online suggestion and voting schemes. Online platforms can serve not only for the col-lection and sharing of ideas, but also for their filtering and selection via online social voting tools. For instance, patient organizations, hospitals and administra-tive bodies could establish by means of such tools which areas require the most attention, what the most promising solutions are, and which ones receive the most support from the population.
11 Fab labs have spread from inner-city Boston to rural India, from South Africa to the North of
Norway. Activities in fab labs range from technological empowerment to peer-to-peer project-based technical training to local problem-solving to small-scale high-tech business incubation to grass-roots research. http://fab.cba.mit.edu/about/faq/
12 For more information see; http://hackerspaces.org/wiki/ 13 http://www.whitehouse.gov/blog/2013/03/27/white-house-hangout-maker-movement
An ecosystem supporting con-sumer innovation realization and diffusion is evolving. These com-mercial and community activities, or lack of them, deserve innova-tion policy-makers attention.

Proceedings of the University of Vaasa. Reports 67
In broad terms, policy seeks to provide fertile framework conditions for innova-tions. Much of this has already been addressed in the previous sections and the following will focus on issues where a need for more specific policy interventions can be argued.
In the ideal world consumer innovation intensity is high across the society and consumers are also willing to inform others about their innovations, and to spend some time on diffusion. This may not always be the case and then policy interven-tions may be argued to provide the right incentives for consumer innovation and diffusion. Incentive schemes to diffuse consumer innovation are clearly different from the traditional innovation supports. Such policies should account for the fact that users may diffuse their innovations for multiple reasons, often other than fi-nancial rewards. In this context, incentives schemes should include recognition and fame, and not just financial advantages. Here relevant instruments include innovation prizes, contests and awards that can be effective ways to stimulate consumers’ innovation diffusion efforts. Such instruments form a major part of innovation policy in several countries UK and USA included.14
Larger financial incentives are seldom needed in order to trigger consumers to spread their inno-vations. One exception may be the situation in which consumers jointly contribute to solving social problems, such as innovative solutions related to sustainability, aging or public healthcare. In this particular case consumers are helping others, and not (solely) driven by personal need. In such instances bigger financial triggers may be needed to elicit citizens’ contributions. An open call, or vouchers, may then be suitable policy initiatives. In any case, financial triggers must be linked to free revealing of information sufficient to enable others to prac-tice the same innovation. This will effectively keep away producers-in-disguise from applying public funding aimed at user innovators. 14 The Obama Administration has taken important steps to make incentive prizes a standard tool
for open innovation in every Federal agency’s toolbox for addressing the nation’s most press-ing challenges. The Administration, in partnership with private-sector and philanthropic part-ners, is using prize competitions to spur innovation, solve complex problems, and address na-tional priorities. The use of prizes in the public sector has expanded under the America COM-PETES Reauthorization Act of 2010. Since then, more than 250 prizes have been offered by over 50 departments and agencies. See http://www.whitehouse.gov/administration/eop/ostp/ initiatives#Innovation.
Unlike traditional innovation sup-ports, consumer innovation pro-motion is more based on recogni-tion, fame, contest and prizes rather than financial incentives.
Innovation vouchers and open calls can mobilize consumer inno-vators to solving societal chal-lenges. This is also a way to stim-ulate diffusion and awareness building on consumer innovation.

68 Proceedings of the University of Vaasa. Reports
Beyond prizes, contests and awards, governments may encourage consumers to post their innovations by financing low-cost tools for public display (e.g., web-sites like Thingiverse.com). It is also important to create general awareness and easy access to Creative Commons licenses, a system for effective sharing knowledge and creativity with the world.15
Finally, governments can boost consumer innova-tion by promoting open data, data sharing tools and more open governance16. Such tools allow free access to public databases, e.g. data related to GPS, Geographic Information Systems, Weather, Environment, Education, Health and many more. Such free access and available tools offers consumer innovators almost endless opportunities in the area of data related innovation. Data sharing tools can also help consumers to feed in information to databases that pool together individual efforts. For instance, it can be a system that allows patients to upload blood pres-sure and other information from their devices into an electronic health record da-tabase for their doctors to consult in hopes of informing treatment decisions.
Ad (c) Intelligent regulation as stimulus for consumer innovation and its diffusion
Ideally, government regulation ought to stimulate innovation and be neutral towards all sources of innovation including consumers, user groups, in-termediate users, producers and research estab-lishments. In the complex world intelligent regula-tion requires policy analysis examining the intended and un-intended effects of new regulation (Stewart 2010). The impacts ought to be assessed towards innova-tion in general, not forgetting that innovations come from different sources. To date much of the regulation carries industrial era legacy that recognizes only pro-ducers’ innovation activities. Arguably, much of the regulation ignores individual consumer’s potential as an innovator, or even restricts their opportunities to inno-vate. Hence, it is important to assess the impacts of regulation on consumer inno-vation as part of the cost-benefit analyses of proposed regulations (Torrance &
15 Creative Commons develops, supports, and stewards legal and technical infrastructure that
maximizes digital creativity, sharing and innovation. See http://creativecommons.org/. 16 See e.g. Swedish Government strategy for digital services and public sector innovation, ‘Med
Medborgaren i Centrum – Regering strategi för en digitalt samverkande statsförvaltning’, Re-geringskansliet, 2012, Stockholm, Sweden.
It is important to assess regula-tion impacts from the consum-er- and distributed innovation perspectives.
Open public sector data can fuel consumer innovation and more open governance creates new channels for consumer innovation diffusion.

Proceedings of the University of Vaasa. Reports 69
von Hippel 2013). For example, disabled people need individually modified vehi-cles in order to cope with their limitations. Such modifications include hand-operated gear lever, breaks, clutch and other, often mobility related changes to standard vehicles. Regulation ought to allow these types of individual needs based modification as long as they have been accepted by local approved testing station.
Ad (d) Development of consumers’ innovation capacity. In addition to science, technology, engineering, and mathematics (STEM), social sciences, and modular design skills are essential enablers of consumer innovation.
The analysis demonstrates that education is an important enabler of consumer innovation. Section 3.2 illustrates that innovating consumers are often highly edu-cated and / or have technical background. In terms of policy this finding further highlights the importance of education as a provider of skills and problem solving capabilities essential for consumer innovation. At present the key role of educa-tion has been recognized in several countries. The education system should en-hance citizens’ basic analytical and problem-solving skills, creativity, imagina-tion, resourcefulness and flexibility. Good technical skills are very important be-cause they support citizens’ collective capability to initiate, absorb, support, or-ganize, manage and exploit innovation in its many forms. At present many con-sumers have unsatisfied needs but only a small minority is able and willing to develop novel solutions for these needs. Here also social science and business education have important role as enablers of consumer innovation.
User communities have an important role in in-novation ecosystems and they should be on the innovation policy radar. For instance, govern-ments may encourage emerging innovation and diffusion communities. Infrastructures which facilitate collaborative user innovation (as dis-cussed above) will also contribute to the diffusion of these innovations. As Chap-ter 4 demonstrates when innovations are developed in collaboration with others, it becomes more likely that innovations are adopted by others. Similar findings were obtained in a study of Japanese consumers (Ogawa & Pongtanalert 2012). Thus, interventions to facilitate user community building, including easy web access, open standards and open interfaces, geographically concentrated net-works, and low-cost innovation tools, will benefit citizens across the society. Governments may even go beyond by directly stimulating community emergence. Most countries today subsidize innovation matchmaking services, and these in-
User communities play an im-portant role in the innovation ecosystems and they could have more prominent role on the innovation policy agenda.

70 Proceedings of the University of Vaasa. Reports
termediaries may pick up the role of bringing together previously unconnected groups of users.
Beside Internet, modular design skills and tools constitute an important part of infrastructure that enables user innovation and distributed innovation activities. This is an area where innovation policy can make an impact by promoting modular design skills, capabilities, take-up and dissemination within the public sector and be-yond. Education, innovation supports and government procurement can all pro-mote modular design. An additional benefit is that modular design can also im-prove the quality of solutions as Linux and APS projects have widely demonstrat-ed. An innovation is said to have a modular design if its parts can be developed independently but will work together to support the whole. Modules are distinct parts of the larger system, which can be designed and implemented independently as long as they obey the design rules. Thus, modules are units in an overall system design that are ‘powerfully connected within themselves and relatively weakly connected to other units’ (Baldwin & Clark 2006). Recent research by Baldwin and von Hippel (2011) demonstrated how collab-orative open innovation projects – for instance in the case of open-source software – have major advantages over projects carried out by producers, or single user innovators. In modular design each participant can contribute a small part, the design costs of each contributor can be relatively low. In principle, given that the overall design tasks can be subdivided into small modules, and given enough interested participants, a design project of any size can be undertaken, even far beyond the kind of innovations that individual produc-ers can handle
Ad (e) Up-dating of intellectual property regime and IP management skills
Innovation activities are evolving constantly and the rise of open innovation, user innovation and innovation ecosystem orchestration bring up new demands to-wards the IPR regime. In order to create societal benefits IPR system ought to recognize various types of innovations, and protect also users and consumers right to innovate (Torrance & von Hippel 2013). Consumers deserve wider recognition as a significant source of innovations as the study at hand demonstrates. Such recognition is important among businesses, IP-professionals, in research and edu-cation contexts.
Intellectual property rights have a significant in-fluence on both the development and diffusion of consumer innovations. Most advanced producers are not only protecting their IP but increasingly harnessing distributed innovation activity by con-sumers. Such advanced IP management practices and supportive tools can stimu-late and diffuse consumer innovation, as the case of Ford Motor corporation
Changing innovation landscape and effective innovation eco-systems set new demands for IP management and regulation.
Modular design skills and tools provide an important part of infrastructure for user innova-tion and distributed innovation.

Proceedings of the University of Vaasa. Reports 71
OpenXC17 in the next section illustrates. As for the public sector, it would make very good sense to invest in the education of advanced IP management as a part of innovation curricula.
Under the current system large firms are able to protect their inventions effective-ly. They can create ‘patent thickets’ – dense networks of patent claims that give them plausible grounds for threatening to sue at the expense of weaker competi-tors (Shapiro 2001; Bessen 2003). When it comes to developing innovations, con-sumers tend to build prototypes economically by modifying products already available on the market to serve a new purpose. In doing so, they may infringe upon others´ intellectual property. Moreover, they may be discouraged to spread their innovations due to intellectual property issues.
Governments have an important role in shaping an IP regulation that provides a fertile ground for consumer innovation. First, they may target con-sumers themselves by stimulating the use of Cre-ative Commons licenses. If many consumers submit their intellectual property to a commons, the publicly available knowledge may become a reasonable substitute for much of the proprietary intellectual property relevant to the field. As a result, the relative advantage accruing to large holders of this information diminishes. By fostering the use of Creative Commons a part of the national IP strategy, policy makers can effectively promote user innovation by consumers. Related to this, existing intel-lectual property offices should add open licensing infrastructures to the their mandate (Gault & von Hippel 2009). High-level recognitions for Creative Com-mons as part of the IPR system can effectively highlight its benefits as well as further development needs. More effective use of Creative Commons can also have a significant positive impact on the diffusion of consumer innovations and wider spread of its social benefits.
A more complicated direction would be to evalu-ate and redesign the current intellectual property regimes. Rather than continuously extending pa-
17 FORD OpenXC API hardware module allows consumers read and translate metrics from a
car's internal network, the data becomes accessible from most Android applications using the OpenXC library. Consumers can start making vehicle-aware applications that have better inter-faces based on context, can minimize distraction while driving, are integrated with other con-nected services, and can offer you more insight into your car's operation. http://openxcplatform.com/
By making Creative Commons a part of the national IP strategy policy makers can effectively promote user innovation by consumers.
Exemption from infringement liability can boost non-commercial consumer innova-tions and research deterred by IPR regime.

72 Proceedings of the University of Vaasa. Reports
tent systems in terms of strength and enforcement, the user-centered model would benefit from a less stringent system. Strandburg (2008) for example pleas for a blanket exemption from infringement liability for research use. This would allow consumers to modify patented products more freely, also in ways not anticipated by their patent holder. Another source of inspiration for a ‘balanced’ patent doc-trine can be derived from the current regimes of plant breeder’s rights18. These systems are marked by exemptions for research purposes, so that breeders can develop new varieties starting from existing (protected) varieties, but they cannot commercialize their new varieties without the consent of the plant variety rights owner (van Overwalle 1999). Such an exemption would enable users to build on and modify incumbent technologies, as long as they do not commercialize their findings (at least, not without asking permission and negotiating an agreement first).
Ad (f) Other incentives that can support consumer innovation intensity and diffu-sion
It is not self-evident that producers are able to identify and adopt consumers´ in-novations. They have generally been taught to find an unsatisfied need and devel-op their own solution, rather than commercialize a prototype that lead users have already developed for themselves. Accordingly, producers have set up market-research departments to explore user needs, and NPD teams to think up suitable products to address those needs. In this type of innovation environment, the needs and prototype solutions of lead users may be rejected as outliers of no interest (von Hippel 2005).
At present, much of the consumer innovation potential is missed because of the lack of knowledge and limited capability to utilize them. Hence, building up of awareness, knowledge and capabilities within the business community is highly important. In addition to economic gains, effective commercialization of innova-tions can motivate consumer innovators who can see the wider benefits of their work. For the producers consumer innovations offer a wide range of opportunities 18 Breeders' exemption (research exemption in the 1991 Act) allows breeders to use protected
varieties as sources of initial variation to create new varieties of plants (1978 Act), or for other experimental purposes (1991 Act). There is also a provision for compulsory licensing to assure public access to protected varieties if the national interest requires it and the breeder is unable to meet the demand. "International Convention For The Protection Of New Varieties Of Plants of December 2, 1961, as Revised at Geneva on November 10, 1972, on October 23, 1978, and on March 19, 1991, UPOV Convention"
Industry confederations have key role in promoting consum-er innovation and diffusion as a driver of competitiveness.

Proceedings of the University of Vaasa. Reports 73
ranging from commercialization of innovations by consumers to utilizing con-sumers desire for individual tailoring of products and services.
Toolkits development and promotion are im-portant aspect of consumer innovation promotion. They can greatly assist businesses in tapping into users innovation potential (von Hippel & Katz 2002). For example:
Ford’s OpenXC™ Platform19 is a combination of open source hardware and software that lets er developers extend vehicle with custom applications and pluggable modules. It uses standard, well-known low cost tools to open up a wealth of data from the vehicle to developers. Ford is also actively promoting user’s development and dissemination efforts by or-ganizing hackathons, OpenXC workshops and supporting APPS dis-semination.
Businesses can be stimulated and educated to benefit from lead user consumers. In the area of business management, new product development and innovation management curricula ought to teach how to identify and utilize user innovations. Also other measures that effectively increase knowledge on the potential value of user innovation are important. Publishing of successfully commercialized user innovations is also important on the area which is still earning its place in the minds of business executives.
Among the most convincing examples are ‘flagship’ business cases where busi-ness executives explain ‘how we did it’. In order to make a real impact, evidence-based communications and the use of professional public relations and communi-cations firm is highly recommended. In Finland, UDI.fi Internet site, is making an effort in publishing user innovation related material including informative busi-ness cases. In order to draw further attention to this area, Tekes can add the topic of user innovation and its management regularly in its calls. For instance, produc-ers can be informed on how to track lead users in their fields of interest. VINNO-
19 FORD OpenXC API hardware module allows consumers read and translate metrics from a
car's internal network, the data becomes accessible from most Android applications using the OpenXC library. Consumers can start making vehicle-aware applications that have better inter-faces based on context, can minimize distraction while driving, are integrated with other con-nected services, and can offer you more insight into your car's operation. http://openxcplatform.com/
Publicity and flagship business examples – e.g. Ford Motor Company – are important in making consumer innovation and its value known among businesses.

74 Proceedings of the University of Vaasa. Reports
VA in Sweden is piloting in this area by offering lead user grants and training to firms.
Transfer of consumer innovations to commercial producers capable to market them effectively on the markets, represents an important diffusion mecha-nism. Especially in the case of physical products, scale economies give producers an advantage over ‘do-it-yourself’ users in production and distribution (von Hippel 2007). Such commercialization of user innovation has also been recognized in the Finnish pol-icy framework for demand and user-driven innovation (Ministry of Employment and the Economy 2010). The key question is how to ensure that producer firms recognize consumer innovations as an important source of innovations, make them part of their product portfolio and commercialize them on the market? Busines education and training are important and commercialization of user innovatons is another topic that innovation project funding ought to pick up.
Empirical evidence suggests that businesses can benefit from users’ willingness to pay for self-designed products (Franke & Piller 2004). This is clearly an area which is not fully utilized by producers even if it is easy and cost effective way to benefit from consumers desire to modify products. For instance, a sports shoe manufacturer that allowed consumers to configure their shoe colour and decora-tion pattern, was able to charge higher price on such tailored shoes. This despite the fact that the same types of shoes could also be bought off-the-shelf.
Innovations developed by consumers can also achieve widespread diffusion when the inventors start a firm to produce their innovative products for sale. As we discussed in Chapter 4, user entre-preneurship is relatively rare, but present in the Finnish economy. However, consumers’ innova-tors are not necessarily equipped with great entrepreneurial capabilities, and poli-cy interventions in support of user entrepreneurs are merited. Users tend to enter into entrepreneur accidentally (Shah & Tripsas 2007).
Unlike opportunity-driven entrepreneurs, many consumer innovators are less fa-miliar with an entrepreneurial lifestyle, nor will they have prepared a sound busi-ness plan or develop any special skills (e.g., sales, administration). Hence, coach-ing and advisory services on how to develop strategies, to bootstrap for external finance, to write a business plan, and more, would be helpful. At the same time, consumer innovators are better than ever equipped to start born global high growth enterprises. Especially on the digital markets Google Play and Apple
Innovation toolkits can greatly assist individuals and busi-nesses in tapping into con-sumers’ innovation potential.
Consumer innovator entrepre-neurship needs to be recog-nized in existing entrepreneur-ship support programmes and – education.

Proceedings of the University of Vaasa. Reports 75
Store provide platforms that can effectively help consumer innovators in com-mercializing their apps on the global markets20.
20 http://www.intomobile.com/2013/07/17/infographic-fresh-look-apples-app-store-vs-googles-
play-store/
76 Proceedings of the University of Vaasa. Reports
8 CONCLUDING REMARKS
Finland is currently one of the most active countries and pioneering the measure-ment of user innovation by consumers, and the piloting and introduction of poli-cies for user innovation.
A research commissioned by Tekes and the Ministry of Employment and the Economy, found that 5.4% of all Finnish citizens aged 18 to 65 has engaged in user innovation in the past three years. This incidence rate is well in line with findings from other countries, including United Kingdom, Netherlands, Japan and the US, where the share of consumers innovators is typically in the 4–6 percent range. The research also confirmed earlier findings indicating that typical con-sumer innovator is a highly-educated male who has a technical background.
Beyond replicating the results of previous surveys, the empirical evidence shows that less than 20 percent of consumer innovations spreads across the society, and up to 80 percent of this potential is not brought for the benefit of wider society. Such unutilized potential is confirmed by innovating consumers themselves, whose perception is that 85 percent of their innovations has some general use val-ue. Moreover, 84% is willing to share their innovation-related knowledge at least selectively with others, and without any compensation (in case some compensa-tion would be offered, the share becomes 91%). Even if great majority of con-sumers are willing to share their innovations, only 27 percent of them has taken any action to inform others about their innovations and eventually, only 19 per-cent gets adopted by others. More specifically, 16 percent of consumer innova-tions spreads from peer-to-peer, 6 percent is transferred to a commercial produc-er, and 2 percent is commercialized in a new venture.
These findings suggest a substantial social welfare loss, and call for policy inter-ventions to stimulate the diffusion of consumer innovations. In the traditional, producer-centered model policy interventions are warranted to ensure that eco-nomic actors invest in the development of innovations - due to systemic- and market failures like lack of appropriation and uncertainty about revenues. In the case of user-centered innovation policies are needed to ensure the diffusion of consumer innovations.
In the policy design user-centered innovation should not be confused with user-driven innovation; policies should go beyond helping commercial producers to better account for users in their R&D&I processes. Moreover, user-centered poli-cies should seek to influence individuals as well as commercial enterprises and public research organizations. Useful policy interventions include development of indicators and official statistics, supportive infrastructures, removing of unneces-

Proceedings of the University of Vaasa. Reports 77
sary obstructing regulations, stimulus for modular design, enhancing of citizens’ technical and business skills, incentives for diffusion, encouraging communities, stimulating producer adoption, support for user entrepreneurship, and balancing intellectual property rights. We also offer a survey script and list of indicators that will be helpful to systematically monitor consumer innovation.
Arguably there is an on-going major shift taking place in the way innovation gets done in advanced market economies. Innovation by users, including consumers and businesses, is recognized as increasingly important. Such change is empow-ered by the Internet, open-source projects and other distributed forms of innova-tion. Further on, an increasing share of world citizens will be able to innovate as education levels improve and as a result of widely available software design tools and 3D printers (Baldwin & von Hippel 2011).
Following this suit, governments need to consider a more balanced policy mix that can better accommodate the needs of user-centered innovation. This can be a challenging step and it requires modification of existing policies as well as new policy initiatives. Time window for the policy changes is now as ongoing shift in innovation activities can potentially wipe out incumbent businesses. While user-centered innovation signifies a major change on the social division of labor, many firms and industries need to make fundamental changes to business models in order to survive. In this context Finland provides an example by developing user innovation measurement and policies to support user-centered innovation.
78 Proceedings of the University of Vaasa. Reports
REFERENCES
Ajzen, I. (1991). The theory of planned behavior. Organizational Behavior and Human Decision Processes 50: 2, 179–211.
Arrow, K. J. (1962). Economic welfare and the allocation of resources for inven-tion. In R. R. Nelson (Ed.). The Rate and Direction of Inventive Activity: Econom-ic and Social Factors. Princeton: Princeton University Press. 609–625.
Arundel, A. & Sonntag, V. (2001). Patterns of Advanced Manufacturing Tech-nology (AMT) Use in Canadian Manufacturing: 1998 AMT Survey Results. Re-search Paper No. 12. Science, Innovation and Electronic Information Division, Ottawa: Statistics Canada.
Baldwin, C. Y. & Clark, K. B. (2006). The architecture of participation: Does code architecture mitigate free riding in the open source development model? Management Science 52: 7, 1116–1127.
Baldwin, C. & von Hippel, E. (2011). Modeling a paradigm shift: From producer innovation to user and open collaborative innovation. Organization Science 22: 6, 1399–1417.
Bessen, J. (2003). Patent thickets: Strategic patenting of complex technologies. Working paper. Research on Innovation and Boston University School of Law.
Borrás, S. & Edquist, C. (2013). The choice of innovation policy instruments. Technological Forecasting and Social Change 80: 8, 1513–1522.
Bush, V. (1945). Science: The Endless Frontier. Washington: U.S. Government Printing Office.
Cooper, R. G. (2003). Profitable product innovation: the critical success factors. In L. V. Shavinina (Ed.). The International Handbook on Innovation. Amsterdam, Boston: Elsevier Science. 139–157.
de Jong, J. P. J. & von Hippel, E. (2008). User Innovation in SMEs: Incidence and Transfer to Producers. SCALES Working Paper H200814. Zoetermeer: EIM.
de Jong, J. P. J. & von Hippel E. (2009). Transfers of user process innovations to producers: A study of Dutch high tech firms. Research Policy 38: 7, 1181–1191.
de Jong, J. P. J. (2011a). Uitvinders in Nederland (Inventors in the Netherlands). Research Report A201105. Zoetermeer: EIM.
de Jong, J. P. J. (2011b). Identifying Consumer Innovators: A Five-step Survey Procedure. Working Paper. Rotterdam: RSM Erasmus University.

Proceedings of the University of Vaasa. Reports 79
de Jong, J. P. J. & von Hippel, E. (2013). User innovation: business and consum-ers. In F. Gault (Ed.). Handbook of Innovation Indicators and Measurement. Cheltenham, UK and Northampton, MA, USA: Edward Elgar. 109–132.
Edquist, C. & Hommen, L. (1999). Systems of innovation: Theory and policy for the demand side. Technology in Society 21: 1, 63–79.
Edquist, C. (2001). Innovation policy – A systemic approach. In D. Archibugi & B.-Å. Lundvall (Eds). The Globalizing Learning Economy: Major Socio-Economic Trends and European Innovation Policy. Oxford: Oxford University Press. 219–238.
Edquist, C. (2011). Design of innovation policy through diagnostic analysis: iden-tification of systemic problems (or failures). Industrial and Corporate Change 20: 6, 1725–1753.
Flowers, S., von Hippel, E., de Jong, J. & Sinozic, T. (2010). Measuring User Innovation in the UK: The Importance of Product Creation by Users. London: NESTA.
FORA (2009). New Nature of Innovation [Web document]. Available at: http://www.udi.fi/sites/default/files/pdf/FORA%20New%20nature%20of%20innovation_0809.pdf.
Franke, N. & Piller, F. (2004). Value creation by toolkits for user innovation and design: The case of the watch market. Journal of Product Innovation Manage-ment 21: 6, 401–415.
Franke, N. & Reisinger, H. (2003). Remaining Within Cluster Variance: A Meta Analysis of the Dark Side of Cluster Analysis. Working Paper. Vienna: Vienna Business University.
Franke, N. & Shah, S. (2003). How communities support innovative activities: An exploration of assistance and sharing among end-users. Research Policy 32: 1, 157–178.
Gault, F. & von Hippel, E. (2009). The Prevalence of User Innovation and Free Innovation Transfers: Implications for Statistical Indicators and Innovation Poli-cy. MIT Sloan School of Management Working Paper No. 4722–09.
Gault, F. (2012). User innovation and the market. Science and Public Policy 39: 1, 118–128.
Gault, F. (Ed.) (2013). Handbook of Innovation Indicators and Measurement. Cheltenham, UK and Northampton, MA, USA: Edward Elgar.
Griliches, Z. (1992). The search for R&D spillovers. Scandinavian Journal of Economics 94, Supplement, 29–47.
80 Proceedings of the University of Vaasa. Reports
Harhoff, D., Henkel, J. & von Hippel, E. (2003). Profiting from voluntary infor-mation spillovers: How users benefit by freely revealing their innovations. Re-search Policy 32: 10, 1753–1769.
Henkel, J. & von Hippel, E. (2005). Welfare implications of user innovation. Journal of Technology Transfer 30: 1/2, 73–87.
Jensen, M. B., Johnson, B., Lorenz, E. & Lundvall, B. Å. (2007). Forms of knowledge and modes of innovation. Research Policy 36: 5, 680–693.
Kim, J. B. & Kim, H. H. (2011). User Innovation in Korean Manufacturing In-dustries: Incidence and Protection. KAIST Business School Working Paper Se-ries No. 2011–1. Seoul: KAIST Business School.
Kivisaari, S., Saranummi, N. & Väyrynen, E. (2004). Knowledge-intensive Ser-vice Activities in Health Care Innovation. Case Pirkanmaa. Espoo: VTT Re-search Notes 2267.
Kline, S. J. (1985). Innovation is not a linear process. Research Management 28: 2, 36–45.
Kuusisto, A., Kuusisto, J. & Liang, L. (2013a). Fostering User Innovation in Pub-lic Service Development – Opportunities and Bottlenecks in Finland (forthcom-ing).
Kuusisto, J., de Jong, J. P. J., Gault, F., Raasch, C. & von Hippel, E. (2013b). Consumer Innovation in Finland – Incidence, Diffusion and Policy Implications. Vaasa: University of Vaasa.
Lakhani, K. R. & Wolf, B. (2005). Why hackers do what they do: Understanding motivation and effort in free/open source software projects. In J. Feller, B. Fitz-gerald, S. Hissam & K. R. Lakhani (Eds). Perspectives on Free and Open Source Software. Cambridge: MIT Press. 3–22.
Lüthje, C., Herstatt, C. & von Hippel, E. (2002). The Dominant Role of Local Information in User Innovation: The Case of Mountain Biking. MIT Sloan School of Management Working Paper No. 4377–02.
Lüthje, C. (2004). Characteristics of innovating users in a consumer goods field: An empirical study of sport-related product consumers. Technovation 24: 9, 683–695.
Ministry of Employment and the Economy (2010). Demand and User-driven In-novation Policy – Framework (Part I) and Action Plan (Part II). Helsinki: Edita.
Niemi, M. & Kuusisto, J. H. (2013). The Role of the User in Innovation: Results from the Finnish Community Innovation Survey (CIS 2010) [Web document]. Available at: http://ssrn.com/abstract=2269388 or http://dx.doi.org/10.2139/ssrn. 2269388.
Proceedings of the University of Vaasa. Reports 81
OECD (1998). The OECD Jobs Strategy: Technology, Productivity and Job Creation. Best Policy Practices. Paris: OECD.
OECD/Eurostat (2005). Oslo Manual: Guidelines for Collecting and Interpreting Innovation Data. 3rd ed. [Web document]. Available at: http://epp.eurostat.ec.europa.eu/portal/page/portal/product_details/publication?p_product_code=OSLO.
Ogawa, S. (1998). Does sticky information affect the locus of innovation? Evi-dence from the Japanese convenience-store industry. Research Policy 26: 7–8, 777–790.
Ogawa, S. & Pongtanalert, K. (2011). Visualizing Invisible Innovation Content: Evidence from Global Consumer Innovation Surveys [Web document]. Available at: http://ssrn.com/abstract=1876186 or http://dx.doi.org/10.2139/ssrn.1876186.
Ogawa, S., Pongtanalert, K. & Flowers, S. H. (2011). Drawing Users into Innova-tion Policy: A Study of the Danish Policy on User-Driven Innovation [Web doc-ument]. Available at: http://ssrn.com/abstract=1920818 or http://dx.doi.org/ 10.2139/ssrn.1920818.
Ogawa, S. & Pongtanalert, K. (2012). Exploring Characteristics and Motives of Consumer Innovators: Community Innovators vs. Independent Innovators [Web document]. Available at: http://ssrn.com/abstract=2188928 or http://dx.doi.org/ 10.2139/ssrn.2188928.
Oliveira, P. & von Hippel, E. (2011). Users as service innovators: The case of banking services. Research Policy 40: 6, 806–818.
Price, D. J. D. (1965). Is technology historically independent of science? A study in historiography. Technology and Culture 6: 4, 553–568.
Raasch, C. & von Hippel, E. (2013). Innovation process benefits: The journey as reward. MIT Sloan Management Review 55: 1, 33–39.
Raymond, E. (1999). The Cathedral and the Bazaar: Musings on Linux and Open Source by an Accidental Revolutionary. Sebastopol: O'Reilly.
Research and Innovation Council (2010). Tutkimus- ja innovaatiopoliittinen lin-jaus 2011–2015. Helsinki: Finland.
Riggs, W. & von Hippel, E. (1994). The impact of scientific and commercial val-ues on the sources of scientific instrument innovation. Research Policy 23: 4, 459–469.
Rogers, E. M. (2003). Diffusion of Innovations. 5th ed. New York: Free Press.
Rothwell, R. (1992). Successful industrial innovation: Critical factors for the 1990s. R&D Management 22: 3, 221–239.

82 Proceedings of the University of Vaasa. Reports
Rothwell, R. (1994), Towards the fifth-generation innovation process. Interna-tional Marketing Review 11: 1, 7–31.
Schaan, S. & Uhrbach, M. (2009). Measuring User Innovation in Canadian Man-ufacturing 2007. Ottawa: Statistics Canada.
Schumpeter, J. A. (1934). The Theory of Economic Development. New York: Ox-ford University Press.
Schumpeter, J. A. (1942). Capitalism, Socialism and Democracy. New York: Harper & Row.
Shah, S. (2000). Sources and Patterns of Innovation in a Consumer Products Field: Innovations in Sporting Equipment. MIT Sloan School of Management Working Paper No. 4105.
Shah, S. K. & Tripsas, M. (2007). The accidental entrepreneur: the emergent and collective process of user entrepreneurship. Strategic Entrepreneurship Journal 1: 1–2, 123–140.
Shapiro, C. (2001). Navigating the patent thicket: Cross licenses, patent pools, and standard setting. In A. Jaffe, J. Lerner & S. Stern (Eds). Innovation Policy and the Economy, Vol. 1. Cambridge: MIT Press. 119–150.
Stewart, L. (2010). The Impact of Regulation on Innovation in the United States: A Cross-Industry Literature Review. Washington, DC: Information Technology & Innovation Foundation.
Strandburg, K. J. (2008). Users as innovators: Implications for patent doctrine. University of Colorado Law Review 79: 2, 467–544.
TEM (2010). Innovaatiopolitiikan linjaukset 2012–2015 ja painopisteet vuodelle 2011. Helsinki: Finland.
TEM (2011). Innovaatio-osaston tavoitteet vuosille 2012–2016. TEM Innovaatio-osasto. Helsinki: Finland.
Torrance, A. W. & von Hippel, E. A. (2013). Protecting the Right to Innovate: Our ‘Innovation Wetlands’ [Web document]. Available at: http://ssrn.com/ abstract=2339132.
Tsipouri, L., Reid, A. & Miedzinski, M. (2008). European Innovation Progress Report 2008. European Commission: DG Enterprise and Industry.
van Overwalle, G. (1999). Patent protection for plants: a comparison of American and European approaches. IDEA: The Journal of Law and Technology 39: 2, 143–194.

Proceedings of the University of Vaasa. Reports 83
von Hippel, E. (1976). The dominant role of users in the scientific instrument innovation process. Research Policy 5: 3, 212–239.
von Hippel, E. (1986). Lead users: A source of novel product concepts. Manage-ment Science 32: 7, 791–805.
von Hippel, E. (1994). Sticky information and the locus of problem solving: Im-plications for innovation. Management Science 40: 4, 429–439.
von Hippel, E. & Katz, R. (2002). Shifting innovation to users via toolkits. Man-agement Science 48: 7, 821–833.
von Hippel, E. (2005). Democratizing Innovation. Cambridge: MIT Press.
von Hippel, E. (2007). Horizontal innovation networks - by and for users. Indus-trial and Corporate Change 16: 2, 293–315.
von Hippel, E. & Jin, C. (2009). The major shift towards user-centered innova-tion: Implications for China's innovation policymaking. Journal of Knowledge-based Innovation in China 1: 1, 16–27.
von Hippel, E. (2011). Open user innovation. In B. H. Hall & B. Rosenberg (Eds). Handbooks in Economics: Economics of Innovation. Amsterdam: Elsevier. 411–427.
von Hippel, E., de Jong, J. P. J. & Flowers, S. (2010). Comparing Business and Household Sector Innovation in Consumer Products: Findings from a Repre-sentative Study in the UK [Web document]. Available at: http://ssrn.com/ abstract=1683503 or http://dx.doi.org/10.2139/ssrn.1683503.
von Hippel, E., Ogawa, S. & de Jong, J. P. J. (2011). The age of the consumer-innovator. MIT Sloan Management Review 53: 1, 27–35.
von Hippel, E., de Jong, J. P. J. & Flowers, S. (2012). Comparing business and household sector innovation in consumer products: Findings from a representative study in the United Kingdom. Management Science 58: 9, 1669–1681.
Zita, J. & Lopes, A. (2011). User Innovation in the Mozambican Business Enter-prise Sector for Maputo Province: Presence of User Innovation. Working Paper 2011–062. Maastricht: UNU-MERIT.

84 Proceedings of the University of Vaasa. Reports
APPENDICES
A: Pilot studies
The first survey of consumer innovation was done in 2009 in the United Kingdom (von Hippel et al. 2012). This research was financed by the National Endowment for Science, Technology and the Arts (NESTA) and done by computer-assisted telephone interviewing. We first asked respondents whether they had created and/or modified software in the past three years, then ditto for the creation and/or modification of hardware. For each of these options open-ended questions were asked to exclude invalid innovation cases (e.g., “I bought a piece of Ikea furniture and put it together myself.”) Additional cases were eliminated via analysis of responses to two screening questions. If respondents knew of equivalent products already available on the market, or if they had developed the innovation as part of their jobs, their claimed innovations were also excluded. This methodology was replicated in the Netherlands (de Jong 2011a) and – applying web surveying – and Japan and the USA (Ogawa & Pongtanalert 2011). All these surveys demon-strated that user innovations can be traced, but only with excessive screening. Moreover, we learned that most consumers, being unfamiliar with the concept, do not regard themselves as innovators even if they are. Therefore, in Finland we experimented with a next generation of indicators.
Pilot objectives
We started the InFi project with a range of pilot surveys in order to:
1 Test more specific cues to support adequate recall. In the UK, asking for ´hardware innovations´ appeared to be too broad, and many innovation ob-jects were lumped together. We here experimented with providing more de-tailed cues, including: computer software; household fixtures or furnishing; transport or vehicle-related; tools or equipment; sports-, hobby- or entertain-ment; children- or education-related; help-, care- or medical; food and clothes; and ‘other’.
2 Test higher thresholds. In the UK and the Netherlands we found that asking for modifications or significant improvements, beyond creating innovations from scratch, caused trouble, e.g., people reported innovations like ‘putting together Ikea furniture’. Thus, in Finland we piloted with medium- and high-threshold indicators by asking for ‘creation or significant improvement’ (me-
Proceedings of the University of Vaasa. Reports 85
dium threshold) and ‘creation only’ (high threshold) in relation to the nine cues. It was anticipated that this would reduce the number of invalid cases.
3 Test extra screening questions. In the Netherlands, de Jong (2011) identified two additional screening questions: tinkering and inventive activity. More specifically, he asked if respondents were ever tinkering with machines, cars, computers or software in their leisure time, and if they ever spend their lei-sure time on inventions or developing new products, applications or con-cepts. If both answers were negative, the chances of being a consumer inno-vator were smaller than 1%. In Finland we tested these same screening ques-tions to see if we could reduce respondent burden without compromising too much on the share of consumer innovators that is found.
4 Try web surveys (versus phone surveys). In the UK and the Netherlands data were collected by means of phone surveys. This was necessary because re-searchers needed detailed descriptions of reported innovations –to clean up the data for accurate population estimates. Obviously, web surveys would be more cost-effective, so we tested if these would give similar estimates of the share of innovating consumers.
Another objective of the pilot phase was to explore if we could expand the meas-urement of consumer innovation to also include services. This part of the pilot phase did not succeed, and is not reported here. For details we refer to our find-ings reported in de Jong (2011b).
Four pilot surveys
We here report on four pilot surveys with 100 respondents each. Respondents were all highly-educated Finnish citizens aged 18 and over, with a technical background (either technical education or profession). Previous work consistently shows that such consumers are more likely to be innovators (von Hippel et al. 2012; de Jong 2011a), so this provided a sound basis for comparing data between the various pilots. An overview of what each pilot aimed for is given in Table 33.

86 Proceedings of the University of Vaasa. Reports
Table 33. Characteristics of pilot surveys.
Pilot No. of cues
extra screening questions Threshold Method sample1
#1 Nine yes (tinkering; invention) high (creation only) phone 100 #2 Nine yes (tinkering; invention) high (creation only) web 102 #3 Nine yes (tinkering; invention) medium (include modification) phone 100 #4 Nine yes (tinkering; invention) medium (include modification) web 122 1 all highly-educated people with a technical background (education and/or profession).
Screening consumer innovators
Figure 7 provides an overview of how we identified consumer innovators. In all, six steps can be identified, and will be discussed hereafter starting with the second step – the first step is concerned with testing additional screening questions and discussed later.
Figure 7. Sequence of high-threshold questions to identify consumer innova-tion in software (example).
Steps II to VI are conducted for each cue, starting with computer software. We first asked respondents if they had created any software for personal use in the past three years (step II). If yes, they indicated if they had been doing this for their job or business (III). If not, they indicated if they could have bought a similar application on the market if they had wanted to – in order to screen out homebuilt versions of existing products (IV). If not, they indicate if their primary motive to create the software was selling rather than personal need (V). Finally, if all these
C reates oftware?
J ob orbus iness?
Availableon market?
S ellingmotive?
What?New?
yes
no
no
no
C onsumer innovator
No consumer innovator no
novelty
yes
yes
yes
functional novelty
no
High threshold = creation only
Ditto for 8more cues
no
T inkering?Invention?
yes
Extra screeningquestions
s tep I s tep II s tep III s tep IV s tep V s tep VI

Proceedings of the University of Vaasa. Reports 87
criteria were met, we asked respondents to describe their innovation and to indi-cate what was new about it (VI). We then analyzed their answers to assess if their innovation contained any functional novelty. If any criterion was not satisfied, the respondent was not considered a consumer innovator with respect to computer software. Next, the whole sequence was done again for the next cue, which was ‘household fixtures and furnishing’. A respondent is considered a consumer inno-vator if he/she reported at least one validated innovation which was created in the past three years.
As for step I, we asked two potential extra screening questions i.e. if respondents were ever tinkering with machines, cars, computers or software in their leisure time, and if they ever spend their leisure time on inventions or developing new products, applications or concepts. We used this information to test if adding ad-ditional questions would simplify the procedure without diminishing the share of consumer innovators.
The survey scripts were optimized for both telephone and web surveying. Figure 7 provides an example for the ‘high threshold’ pilots #1 and #2. In pilots #3 and #4 we asked for ‘creation or significant improvement’ rather than only creations. Cues and the sequence of questions were identical, as was the addition of the ex-tra screening questions.
Data collection
We recruited the services of IRO Research, a Helsinki based marketing research company. We used their panel of business owners and managers to identify an initial subset of highly-educated individuals with a technical background, then randomly assigned them to each of the pilots. Although all respondents were ac-tive in business, the survey scripts stressed that the questions were concerned with what people did in their leisure time. Data were collected in the fall of 2011. For the phone surveys, respondents were contacted at least five times before being marked as a non-respondent. For the web surveys, an initial invitation e-mail was sent out describing the purposes of the survey and confidentiality. At least two reminders were sent afterwards. Response rates were rather modest. For the tele-phone pilots #1 and #3 response rates were 15 and 13 percent, respectively. (Re-sembling earlier response rates in the UK, see von Hippel et al. 2012). For the web pilots #2 and #4 response rates were 3 and 4 percent, respectively. Although these responses were selective, any bias was likely to be similar for the various samples, and accordingly, the validity of the analyses was not compromised.
88 Proceedings of the University of Vaasa. Reports
Cleaning the data
We first established for every respondent if he/she was a consumer innovator, applying steps II–VI in Figure 7. Thus, we first assessed for every cue if he/she had created (or, in pilots #2 and #4, significantly improved) an innovation which was not job- or business-related, not a homebuilt or do-it-yourself version of a product already available on the market, primarily not developed for sales mo-tives (but rather for personal need), and with some kind of functional novelty (drawing on our assessment of the open-ended questions). We assessed this for all nine cues (ranging from ‘computer software’ to ‘food and clothes’ and ‘any other creations’). An individual was considered a consumer innovator if he/she has cre-ated at least one such validated innovation in the past three years. Table 34 offers validated and excluded examples of reported innovations across the four pilots.

Proceedings of the University of Vaasa. Reports 89
Table 34. Examples of validated innovations and false positives.
Validated consumer innovations False positives Diary software that would hide the contents. Commercial
products were too heavy or fail to produce the desired re-sult. (computer software)
How to get the Internet working in remote areas. 25 km radi-us from a 3G station. Internet access in places were it has-n't been accessible. (household fixtures and furnishing)
I modified our children's pedal car into an electric car with an old drill and UPS batteries. Runs longer and with less ef-fort. (transport and vehicle-related)
Making a forestry tool much better. Clearing tool. New transmission. (tools and equipment)
For boating and fishing. I've developed tools from the store even further. Usually the fishing line gets twisted. I've de-signed something to help that. (tools and equipment)
It's connected to sports. Jogging and sliding. I stretch and slide down a rope. The shoulder region gets better. Com-bined stretching and muscle development. (sports, hobby and entertainment)
A game that is played on the floor. A blanket with large squares that you move your pieces on. Simple to play. I have not seen anything similar. (children and education-related)
Keeping your mouth closed during sleep (apnea). I used a jaw guard from a hockey helmet and we made a working product. (help, care and medical)
It's about preparing food. It utilizes wasted heat. This is a new way to prepare food. (food and clothes) To make the air draught better over the fireplace. It works
without electricity.(other)
GPS tracking for televised sports, especially for orienta-tion. We made a product that is easy to use. It is also easy to sell. (computer software)
To get a broken door fixed. The door stayed closed and locked. A substitute for a lock plate. (household fixtures and fur-nishing)
A score board for children’s ac-tivities. It served the children's imagination, nothing more. (children and education-related)
Small insights for making eve-ryday life easier for elderly people. It was adopted because of personal needs. (help, care and medical)
My own diet. I left out carbohy-drates and lost 16 kg. I left out white flour. Can't explain it better. (food and clothes)
Own recipes. It's about adapting. Anyone can do this. (food and clothes)
Knitwear. I got the piece of clothing I wanted and in the colors I wanted. (other)
Descriptive statistics
Table 35 gives the share of consumer innovators that we found in each pilot, as well as for the overall dataset of four pilots combined. Overall, we found that within our samples of highly educated citizens with a technical background, 21 percent engaged in consumer innovation in the past three years. The table also shows the frequency of innovation for each cue.

90 Proceedings of the University of Vaasa. Reports
Table 35. Share of consumer innovators and validation innovations in vari-ous pilot surveys.
pilot #1
phone, high
threshold
#2 web, high
threshold
#3 phone, medium
threshold
#4 web, medi-um thresh-
old
all
(n=100) (n=102) (n=100) (n=122) (n=424) Share of consumer innovators 30% 18% 24% 14% 21% Validated innovations:
Computer software 2% 1% 1% 3% 2% Household fixtures and fur-nishing
12% 5% 12% 5% 8%
Transport and vehicle-related 0% 0% 1% 1% 1% Tools and equipment 8% 7% 5% 5% 6% Sports, hobby and entertain-ment
5% 4% 3% 2% 3%
Children and education-related 4% 0% 3% 1% 2% Help, care and medical 1% 1% 0% 1% 1% Food and clothes 5% 3% 1% 2% 3% Other 2% 1% 4% 1% 2%
We learned that in the web surveys the share of consumer innovators was lower than in the telephone surveys. Web respondents were reluctant to provide details of their innovations. We conservatively classified such cases as ‘not innovative’. In contradiction, due to the presence of the interviewer very few refused to report this information in the phone surveys. Thus, although web surveys provide a rea-sonable alternative, collecting data with phone surveys is preferred in future stud-ies of consumer innovation.
We also learned that offering high-threshold indicators (versus medium-thresholds) did not diminish the share of consumer innovators. In pilots #1 and #2 we found even higher shares, apparently because respondents consider a ‘signifi-cant improvement’ as nearly identical with a creation, and probably also because the initial screening question is more simple.
Validity of alternative procedures
We then explored if we could derive similar percentages of innovators after ap-plying various screening procedures. Likewise, while recoding our data we had noticed that some particular cues were more problematic, i.e. for ‘food and clothes’ and ‘other creations’ we found that most reported innovations were false positives – in these categories 50 to 80 percent of the examples were falsified,

Proceedings of the University of Vaasa. Reports 91
while for the other cues this share was only 0 to 30 percent. Thus, we analyzed to what extent the ‘real’ share of consumer innovators as reported in Table 35 could be retrieved with alternative versions of our survey procedure. As an example Table 36 gives the share of consumer innovators when we ignored the open-ended descriptions of their innovations.
Table 36. Share of consumer innovators when functional novelty criterion is ignored.
Simplified indicator: consumer innovator without considering functional novelty
no yes Total Actual consumer innova-tion status
no 58 12 70 yes 0 30 30
total 58 42 100 Source: pilot survey #1.
In the telephone survey with high-threshold indicators (#1) we found that 30 per-cent of the respondents were consumer innovators (=30/100). If we would not have asked them to describe their innovations, functional could not have been assessed, and then 42 out of 100 respondents would have been considered innova-tors. These innovators would have created at least one innovation which was not job- or business-related, not a homebuilt of an existing product, and not primarily developed to sell – just the functional novelty criterion is ignored.
We then identified four criteria for validity assessment. First, we find that (58+30)/100=88% of the cases is correctly classified. Second, the share of false positives is 12/42=29%. Third, the share of false negatives, or innovators incor-rectly regarded as non-innovative, is 0/58=0%. Fourth, the correlation coefficient between the simplified indicator and actual innovation status is 0.77 and provides another criterion to assess validity. We computed these validity measures for var-ious screening procedures. See Table 37.

92 Proceedings of the University of Vaasa. Reports
Table 37. Validity of various procedures to identify consumer innovators.
Pilot (and survey procedure) Share of consum-er inno-vators
Correct-ly clas-sified cases
Share false
positives
Share false nega-tives
Correla-tion with best
estimate #1 phone survey; high thresholds
A. Best estimate 30% 100% 0% 0% 1.00 B. No open-ended questions 42% 88% 29% 0% 0.77 C. Like B, excluding 'food/clothes' category 32% 94% 13% 3% 0.86 D. Like C, including extra screening questions 31% 93% 13% 4% 0.84 E. Like B, excluding 'food/clothes' and 'other' 29% 93% 10% 6% 0.83 F. Like E., including extra screening questions 29% 93% 10% 6% 0.83
#2 web survey; high thresholds A. Best estimate 18% 100% 0% 0% 1,00 B. No open-ended questions 28% 90% 36% 0% 0.75 C. Like B, excluding 'food/clothes' category 24% 92% 29% 1% 0.77 D. Like C, including extra screening questions 22% 92% 27% 3% 0.76 E. Like B, excluding 'food/clothes' and 'other' 22% 94% 23% 1% 0.82 F. Like E., including extra screening questions 21% 93% 24% 3% 0.78
#3 phone survey; medium thresholds A. Best estimate 24% 100% 0% 0% 1,00 B. No open-ended questions 34% 90% 29% 0% 0.78 C. Like B, excluding 'food/clothes' category 31% 91% 26% 1% 0.79 D. Like C, including extra screening questions 29% 89% 28% 4% 0.72 E. Like B, excluding 'food/clothes' and 'other' 29% 91% 24% 3% 0.78 F. Like E., including extra screening questions 27% 89% 26% 6% 0.71
#4 web survey; medium thresholds A. Best estimate 14% 100% 0% 0% 1,00 B. No open-ended questions 27% 87% 49% 0% 0.66 C. Like B, excluding 'food/clothes' category 22% 92% 37% 0% 0.76 D. Like C, including extra screening questions 22% 92% 37% 0% 0.76 E. Like B, excluding 'food/clothes' and 'other' 21% 91% 39% 1% 0.71 F. Like E., including extra screening questions 21% 91% 39% 1% 0.71
Procedure A resembles with steps II to VI. Procedures B, C and E correspond with steps II to V. Procedures D and F follow steps I to V in Figure 7.
In pilot #1, procedures A and B correspond with the ‘royal standard’ of open-ended questions and full screening, and the already discussed alternative in which functional novelty is not assessed, respectively. Procedure C is an alternative in which the ‘food and clothes’ category is not considered, and as this was the most confusing and polluting one. All validity measures then became much better. We found that the share of consumer innovators is 32%. Ninety-four percent of the respondents were correctly classified, while the share of false positives was con-siderably reduced. The share of false negatives (consumers with validated exam-ples in food/clothes only) was acceptable, and the correlation with consumers’ actual innovation status seemed good (r = 0.86). Procedure D resembles with C, but now included the additional screening questions of tinkering and inventive activity. We found that in terms of validity, this survey procedure was nearly identical with the previous procedure C. Procedures E and F are identical with C and D, now also excluding the ‘other’ category.

Proceedings of the University of Vaasa. Reports 93
We went on doing these analyses also for pilots #2 to #4 (Table 37). In general, we found confirmation that discarding the open-ended questions reduces validity. The problem diminishes when the ‘food and clothes’ cue is dropped. We also learned that including the extra screening questions then does not substantially compromise the percentage of correctly classified cases, and ditto for the other criteria. With an eye on minimizing respondent burden, these additional screeners may be well included in future surveys. Excluding the ‘other’ category, however, does not contribute much after food and clothes are excluded. For reasons of con-tent validity we concluded that ‘other creations’ should be kept as a cue in future surveys. Finally, we learned that in web surveys the share of false positives is higher (see Table 37). Especially in web surveys it is important to apply an elabo-rative screening process including open-ended questions.
Conclusions
Regarding our pilot objectives, the following conclusions can be drawn:
1 Test specific cues to support ade-quate recall
We found eight specific cues, including: computer soft-ware; household fixtures or furnishing; transport or vehi-cle-related; tools or equipment; sports-, hobby- or enter-tainment; children- or education-related; help-, care- or medical; and ‘other’.
´Food and clothes´ does not work well.
2 Test higher thresholds
High thresholds, i.e. asking for only ‘a creation’ rather than ‘a creation or significant improvement’, did not result in lower shares of consumer innovators
3 Test extra screen-ing questions
Individuals who never tinker with cars, machines or any other devices, and who never engage in inventive activi-ty, product or concept development, were unlikely to be consumer innovators. Respondent burden is reduced if these screening questions are asked first.
4 Try web surveys Telephone surveys remain a ‘golden standard’ due to better opportunities to obtain open-ended descriptions. Web surveys have acceptable accuracy and may be a suitable alternative for researchers low on resources.
In summary, any procedure to identify innovating consumers can be done with eight cues and high thresholds. From a scientific point of view it is preferred to

94 Proceedings of the University of Vaasa. Reports
apply the most elaborative procedure (i.e. steps II-VI in Figure 7). Whenever re-sources are limited, researchers may engage in simplified procedure including extra screenings questions and web surveys. (For a suggested survey procedure, see Appendix C.)

Proceedings of the University of Vaasa. Reports 95
B: Main study
We applied our refined survey methodology (as described in appendix A) to col-lect data from a broader and representative sample of consumers in Finland. Moreover, we conducted additional surveys to collect data on the diffusion of consumer innovations, and the nature innovation of the medical sector. To assist us in the data collection process, we employed the services of Innolink, a Helsinki based market research and IT company. What follows is an elaboration on how we conducted three surveys in the main phase of the InFi-project:
1. Broad survey of Finnish consumers
2. Survey of likely innovators
3. Survey of patients, caregivers and doctors in the medical sector.
Survey #1: Broad survey of Finnish consumers
The first survey targeted a broad and representative sample of Finnish citizens, in order to obtain estimates of the share of user innovators amongst individual con-sumers. The data were collected with a phone recruited electronic survey. In-nolink first contacted 10,000 individual citizens aged 18 to 65 years by telephone. This sample was randomly drawn from Finland’s Population Register Centre. Phone recruitments were conducted from August 2012 to January 2013.
On the phone, 2,407 citizens indicated that they were willing to participate. We recorded their mail addresses, then sent them an e-mail with a link to enter the web survey. In case of non-responses, additional phone calls were done to remind and motivate them to fill out the questions. Eventually, completed answers were obtained from 993 Finnish citizens (response rate 10%). The demographic profile of these respondents is shown in Table 38, along with corresponding population numbers.

96 Proceedings of the University of Vaasa. Reports
Table 38. Demographics of respondents in broad consumer survey and Finnish population.
Variable Population Respondents (N=3,197,037) (n=993)
Age 18 – 24 years 14% 8% 25 – 34 years 20% 18% 35 – 44 years 19% 17% 45 – 54 years 23% 24% 55 – 64 years 24% 32%
Education Primary or unknown 19% 12% Secondary 48% 49% Higher 33% 39% Gender Male 50% 45% Female 50% 55%
Employment Employed n.a. 68% Entrepreneur/self-employed n.a. 2% Student n.a. 8% Retired/disabled n.a. 1% Fulltime housekeeper n.a. 1% Unemployed n.a. 0% Unknown n.a. 20%
Technical job or business No n.a. 62% Yes n.a. 18% Unknown n.a. 20%
Participants were not entirely representative, as younger citizens (18-24 years) were underrepresented, as were those with a primary education, and males. To obtain representative estimates for the whole population of Finnish citizens aged 18 to 65, we weighted our data drawing on population statistics obtained from Statistics Finland. In our weighting scheme we accounted for respondents’ age, educational attainment and gender (details available on request). Thus, when we discuss population estimates in Chapter 3 of this report, weighted results are pre-sented.
The survey consisted of two parts. A shortened version of the questionnaire, eli-gible for future applications, can be found in appendix C of this report. The full survey instrument is available on request.
In the first part of the survey we applied steps II to VI of the screening procedure that outlined in appendix A. Thus, we first offered specific cues, ranging from ‘computer software’ to ‘other products or applications’, asking the respondent if s/he had created it during their leisure time (step II). We then screened out crea-

Proceedings of the University of Vaasa. Reports 97
tions which respondents had created for their jobs (step III), which were home-builts of products already available on the market (IV), and which they had de-veloped primarily for commercial purposes (V). Finally, more their most recent creation respondents described what they had innovated, and why. After applying the screening procedure outlined in appendix A, we identified that 59 out of 993 respondents were user innovators, i.e. having at least one validated innovation example. These responses have been used to analyze the incidence of innovation by Finnish consumers, as reported in Chapter 3.
In the second part of the survey, we followed up on these specific innovation cas-es. Data were collected on a range of innovation and diffusion-related matters, including: motives to innovate, innovation collaboration, investments, protection, perceived general value of the innovation, willingness to share, efforts to inform other people or businesses, and diffusion mechanism. In line with incumbent the-ory, three diffusion mechanisms were distinguished (de Jong & von Hippel 2013): by creating a new venture i.e. entrepreneurship, by transferring the innovation to a commercial producer for general sale, and by peer-to-peer sharing of the innova-tion with other consumers. Our findings regarding these questions are reported in Chapter 4.
Survey #2: Survey of likely innovators
From past surveys we had learned that the share of innovators in broader consum-er samples is usually low, that is, 4 to 6 percent (de Jong & von Hippel 2013). As one of our main objectives was to analyze the diffusion of consumer innovations, the second survey focused only on respondents who were likely to be innovators. Past research has shown that the probability of finding innovators is much higher in samples of highly educated, technical workers, and males (von Hippel, Ogawa & de Jong 2011). In other words, the second survey was not meant to be repre-sentative, but only to find a bigger set of innovating consumers on which we could follow up with diffusion-related questions.
The data were collected with an electronic survey, which was offered to a range of Finnish citizens who were more likely to be innovators. More specifically, In-nolink employed an open invitation strategy by inviting the members of a range of technical and professional unions in the country. Survey invitations were dis-tributed in three different ways depending on the possibilities allowed by the spe-cific union: 1. In their paperback membership publication (Union of Professional Engineers in Finland), 2. In their electronic membership publication (Finnish In-ventors National Federation, Academic Engineers and Architects in Finland,

98 Proceedings of the University of Vaasa. Reports
Trade Union of Education, AKAVA, SEFE, and more), and 3. As an invitation directly to members’ email addresses (The Finnish Metalworkers’ Union). These invitations were sent out or posted from August 2012 to February 2013.
Eventually, completed answers were obtained from 1,055 Finnish citizens. Table 39 provides their demographic profile. As we did aim for a representative survey, we did not include population characteristics.
Table 39. Demographics of respondents in the survey of likely innovators.
Variable Descriptive statistics Age 18–24 years (2%); 25–34 years (20%); 35–44 years (24%); 45–54
years (26%); 55–64 years (18%); Unknown (10%) Education Primary or unknown (14%); Secondary (43%); Higher (43%) Gender Male (67%); Female (28%); Unknown (6%) Employment Employed (77%); Entrepreneur/self-employed (3%); Student (2%);
Retired/ disabled (6%); Fulltime housekeeper (1%); Unemployed (6%); Unknown (5%)
Technical job/business No (31%); Yes (61%); Unknown (8%)
These respondents are not representative for the population of Finnish consumers, so we did NOT use them to report on the frequency of innovation (Chapter 3). Rather, we selected only innovating consumers to expand our subsample for ana-lyzing the diffusion of their innovations.
The second survey closely resembled with survey #1, consisting of two parts. In the first part we applied our full screening procedure to identify innovating con-sumers. Here, we also included step I (screening out respondents who neither tinker in their leisure time, nor consider themselves inventors) to diminish re-spondent burden. In the second part, we followed up with the same innovation and diffusion-related questions as in survey #1. (For the main questions see ap-pendix C. The full survey instrument is available on request.)
We found that 117 out of 1,055 respondents were user innovators, i.e. having at least one validated innovation example. We merged this subsample with the 59 innovators identified in survey #1, resulting in a sample of 176 validated innova-tion cases. Our findings regarding innovation diffusion are reported in Chapter 4.

Proceedings of the University of Vaasa. Reports 99
Survey #3: Healthcare sector
Data collection
In survey #3 we targeted patients and their caregiving relatives, nurses, and doc-tors to investigate and compare their innovation behaviors. The survey was con-ducted electronically, supported by phone interviews to doctors.
For the sub-sample of patients and caregivers, consumers from the Innolink con-sumer panel were randomly selected and asked during an initial phone contact whether they were suffering, now or in the past, from a long-term illness (defined as being in effect for at least 6 months); alternatively, whether they were taking care of someone (e.g. a friend or relative) suffering from such a long-term illness. Consumers who gave negative replies to both screening questions were not invit-ed to participate in the survey. 1,721 respondents who passed the screening ques-tions were randomly drawn to be invited by email to complete a web survey. Of these 1,721 invited, we obtained 630 responses; 1,091 invitations went unan-swered. Of the 630 responses, after quality controls and controls for sufficient completeness of answers, 571 responses were found to be valid.
For the doctor sub-sample, we initially contacted heads of businesses providing doctor services via the mailing list of Lääkäripalveluyritykset ry, requesting them to distribute the survey invitation among the doctors in their respective compa-nies. The network thus potentially covered includes approx. 5,000 doctors. We do not know how many heads of businesses actually forwarded our invitation, but suspect the number to be small. Following a low number of responses from that source (31 valid responses), we decided to additionally contact doctors by phone. The sample was randomly drawn from the Population Register Centre, with the occupation description containing the Finnish word “doctor” and being limited to those treating human patients. We thus built a contact register of 1,500 doctors, from which 175 answers were targeted and successfully obtained. Finally, 5 valid responses from doctors were obtained “accidentally” from the consumer/patient panel. The total number of responses in the doctor sub-sample is thus 211. Over-all, doctors were the hardest group to collect data from, due to their busy sched-ules, shift work, and a perceived overload of “paperwork”.
For the sub-sample of nurses, our questionnaire was distributed electronically via a mailing list of the Finnish Nurses Association to all their listed members. The member count of the Association stands at over 51,000 healthcare sector profes-sionals, of which ca. 30,000 are listed on the mailing list. The typical number of members who open membership emails is ca. 7,000 members. From these, 332 responses were collected, 318 of which were of sufficient quality and complete-

100 Proceedings of the University of Vaasa. Reports
ness. Of these, 229 respondents described their job as being in nursing (nurse, head nurse or paramedic), whereas 89 responded that they were nursing students, retired, unemployed or “other”. We put the former in the “nurse” category and the latter in “Other nursing professionals”. Finally, valid responses from 19 nurses were collected “accidentally” via the consumer panel. Thus the total size of the nurse sub-sample is 229+19=248.
Questionnaire
The questionnaire contained five sections.
In the first section, questions addressed the respondents’ background and history, as a medical professional and/or as a patient and/or as a relative of a patient. Again, the threshold of a longer-term illness of at least 6 months’ duration was applied.
In the second section, respondents were first asked: “In the past three years, have you encountered a specific problem or opportunity for improvement regarding…” (a) a tool or piece of equipment, (b) a procedure or technique, of (c) any other kind of specific problem in medical care? If they replied in the negative, the sur-vey ended. If they replied “yes”, they were asked about the details of what they considered to be the most important problem they identified. Specifically, they were asked to describe the problem and any solution they may have found, and also the level of implementation and application they achieved with this idea.
In the third section, we asked about important characteristics of the respondent as an innovator and of the innovation. This included the respondent’s lead userness, technical expertise and motives, for instance, as well as the value of the innova-tion.
The fourth section dealt with the innovation process, particularly the issues of collaboration, time and money expenditure, and perceived obstacles during the process.
The fifth section focused on the sharing, diffusion and adoption of the innovations described. A final open question completed the questionnaire.
Proceedings of the University of Vaasa. Reports 101
Cleaning the data
We first established for each of the 1,119 respondents if he/she had identified a specific problem related to the Finnish healthcare sector. Out of 1,119 respond-ents, 461 confirmed having encountered a specific problem. Of these, 310 de-scribed the problem in some detail. The remainder offered no description and was therefore excluded from further analysis.
Next, we determined whether they had identified a specific solution to the prob-lem they described. Two of the authors screened the entries to decide which ones qualified as innovative solutions – containing (a) some new idea or observation and (b) specific suggestions how the problem could be solved. (First-round inter-rater reliability was 81.5%.) Provided these conditions of novelty and specificity were met, we counted as valid any first-time or improved application of a tool, procedure or principle in the medical institution described by the respondent; we did not require solutions to be new to the world. We did not require solutions to be cost-neutral either; but we excluded solutions that simply recommended put-ting more money into existing systems.
In performing these steps, we corrected for the fact that some respondents de-scribed both a problem and its solution under the heading of “problem”, or other-wise misinterpreted the distinction between problems and solutions.

102 Proceedings of the University of Vaasa. Reports
C: Survey script
For future applications, we offer a survey script to collect the consumer innova-tion indicators presented in Section 6.1. It is optimized for computer assisted tele-phone surveying. A similar survey script is available for Internet surveying – which can be found in de Jong (2011b). The survey script includes two parts:
• Incidence questions to trace innovative respondents and the objects of their innovations. The questions employ the screening procedure with steps I to VI, as outlined in appendix A.
• Innovation and diffusion-related questions for specific innovations that re-spondents report. This part provides the other indicators mentioned in Sec-tion 6.1.
Incidence questions
Step I
A01a. In your leisure time, do you ever tinker with machines, cars, computers or any other devices, or do you ever program software? 1: yes, regularly 2: yes, oc-casionally 3: no, never
A01b. Do you ever spend your leisure time on inventions or developing new products, applications or concepts? 1: yes, regularly 2: yes, occasionally 3: no, never
If A01a > 2 and A01b > 2 Go to End
Steps II-VI (for cue 1 = computer software)
My next questions relate to any creative activities in your leisure time. You may have created any products or applications for personal use, to help other people, to learn or just for fun. I will provide some examples.
A02. First, creating computer software by programming original code. In the past three years, did you ever use your leisure time to create your own computer soft-ware? 1: yes 2: no
if A02>1 Go to A12

Proceedings of the University of Vaasa. Reports 103
A03. Did you do this primarily for your employer or business? 1: yes 2: no
if A03=1 Go to A12
A04. At the time you developed it, could you have bought ready-made similar software on the market? 1: yes 2: no
if A04=1 Go to A12
A05. Did you primarily create it to sell, to use yourself, or for some other reason? 1: to sell 2: to use myself 3: other, please specify……..
If A05=1 Go to A12
A06a. What kind of software did you create? [open]
A06b. What was new about this software? [open]
Steps II-VI (for other cues)
A12. The second example is household fixtures and furnishing, such as kitchen- and cookware, cleaning devices, lighting, furniture, and more. In the past three years, did you ever use your leisure time to create your own household fixtures or furnishing? 1: yes 2: no
A22. Next, you may have developed transport or vehicle-related products, such as cars, bicycles, scooters or anything related. In the past three years, did you ever use your leisure time to create your own transport or vehicle-related products or parts? 1: yes 2: no
A32. Tools and equipment, such as utensils, molds, gardening tools, mechanical or electrical devices, and so on. In the past three years, did you ever use your lei-sure time to create your own tools or equipment? 1: yes 2: no
A42. Sports-, hobby- and entertainment products, such as sports devices or games. In the past three years, did you ever use your leisure time to create your own sports-, hobby- or entertainment products? 1: yes 2: no
A52. Children- and education-related products, such as toys and tutorials. In the past three years, did you ever use your leisure time to create your own children- or education-related products? 1: yes 2: no

104 Proceedings of the University of Vaasa. Reports
A62. Help-, care- or medical-related products. In the past three years, did you ever use your leisure time to create your own help-, care- or medical-related products? 1: yes 2: no
A72. Finally, in the past three years, did you ever use your leisure time to create any other products or applications? 1: yes 2: no
(follow-up questions and routing A13-A16b, A23-A26b, etc. see A03-A06b)
If number of valid innovations (A05, A15,…,A75 > 1) = 0 Go to End
If number of valid innovation = 1 Go to B01
A99. You just mentioned a number of creations. Which one do you consider most significant? 1: computer software 2: household of furnishing product 3: transport or vehicle-related product 4: tool or piece of equipment 5: sports-, hobby- or en-tertainment product 6: children- or education-related product 7: help-, care- or medical-related product 8: other product or application
Innovation and diffusion-related questions
My next questions are concerned with this specific … that you created. I will re-fer to it as the ‘innovation’.
B01. Why did you develop this innovation? I will give you a list of reasons. Please indicate their importance by assigning zero to 100 points. B01a: I person-ally needed it …points B01b: I wanted to sell it/make money …points B01c: I wanted to learn/develop my skills …points B01d: I was helping other people …points B01e: I did it for the fun of doing it …points
B02a. Did you work with other people to develop this innovation? 1: yes 2: no
If B02a = 2 Go to B03
B02b. How many others contributed to developing this innovation? ...persons
B03. Can you estimate how much time you invested developing this specific in-novation? ….hours/days/weeks during …days/weeks/months

Proceedings of the University of Vaasa. Reports 105
B04a. Did you spend any money on this innovation? 1: yes 2: no
If B04a=2 Go to B05
B04b. Can you estimate how much? ….Euros
B05. Did you use any methods to protect this innovation? (For example patents, trade marks, copyrights, confidentiality agreements) 1: yes 2: no
B06. Suppose that other people would be interested, would you be willing to FREELY share what you know about your innovation? 1: yes, with anyone 2: yes, but only selectively 3: no
B07. Suppose that other people would offer some kind of COMPENSATION, would you be willing to share your innovation? 1: yes, with anyone 2: yes, but only selectively 3: no
B08. Did you do anything to inform other people or businesses about your inno-vation? (For example: Showing it off, communicating about it, posting its design on the Web) 1: yes 2: no
B09a. To the best of your knowledge, have any other people adopted your inno-vation for personal use? 1: yes 2: no
If B09a=1 Go to B10a
B09b. Do you intend to contact other people who may adopt your innovation for personal use? 1: yes 2: no
B10a. Do you, alone or with others, currently own a business you help manage, or are you self-employed? 1: yes 2: no
If B10a=2 Go to B11a
B10b. Did you commercialize your innovation via your business? Or do you in-tend to do this? 1: yes, I commercialized it 2: yes, I intend to do so 3: no
Go to B12

106 Proceedings of the University of Vaasa. Reports
B11a. Are you currently, alone or with others, trying to start a new business? 1: yes 2: no
If B11a=2 Go to B12
B11b. Do you intend to commercialize your innovation with this start-up? 1: yes 2: no
B12a. Finally, commercial businesses like your employer or any other organiza-tion may be interested in your innovation. Did any commercial business adopt your innovation for general sale? 1: yes 2: no
If B12a=1 Go to End
B12b. Do you intend to contact commercial businesses to adopt your innovation for general sale? 1: yes 2: no