japan's pension reform - world...
TRANSCRIPT
NO. 0541S P D I S C U S S I O N P A P E R
Japan’s PensionReform
Junichi Sakamoto
December 2005

Japan’s Pension Reform
Junichi Sakamoto
December 2005
PENSION
REFORM
PRIMERrē-for´m
v.t. & i. 1. make (institution, procedure
etc.) better by removal or abandonment
of imperfections, faults or errors
prīmer n. 1. elementary book to
equip person with information
pe´nsio
n n. 1.
periodic p
ayment
made on ret
irement or
above
specified
age
2
Japan’s Pension Reform
December 2005
Junichi Sakamoto,1F.I.A.J.2
Chief Adviser to Nomura Pension Management Research Group
Nomura Research Institute
Tokyo, Japan
1 Former Director of the Actuarial Affairs Division, Pension Bureau, Ministry of Health, Labour and Welfare 2 Fellow of the Institute of Actuaries of Japan
3
Acknowledgement
The author would like to express his sincere gratitude to Ms. Yvonne Sin of World Bank,
who has given him the chance to write on Japan’s major pension reform in 2004. This provides an
invaluable opportunity to share the experience throughout the world. He would also like to express
his deep gratitude to Mr. Nobusuke Tamaki of Deposit Insurance Corporation of Japan and Mr.
Robert Palacios of World Bank who, in spite of their busy schedule, read through the draft and gave
the author precious comments. Without their arduous task and advice, this paper would not have
been born. He is also grateful to Mr. Masaki Fukui, Mr. Yasuki Okai, Mr. Sadayuki Horie and all the
colleagues of the Nomura Research Institute who helped him complete the paper. He especially
thanks Mr. Akinobu Miyata of the Nomura Research Institute who helped him make tables and
figures.

4
Executive Summary
Chapter 1. Introduction
In spite of the repeated efforts for the last two decades to restore financial equilibrium of
Japan’s social security pension schemes, the population projection published in January 2002 again
destroyed the equilibrium by further improvement of mortality and more decline of birth rate. The
government then started the reform discussion.
The most urgent and important issue to be addressed by the 2004 reform was, as a matter
of course, to restore the financial equilibrium, but this time it seemed almost impossible for the
government to follow the process that it went through in the past reforms, namely the process of
fixing the benefits first and then deciding the contribution schedule next. This was due to two
sources of anxiety among the population, especially among the younger generations; (i) that they
might not be able to receive the pension benefits when they retire and (ii) that an unsustainable level
of contribution would be imposed in the future.
Taking these anxieties into account, the government decided to propose fixing the
contribution schedules first to clearly show the future contribution level to the present active
generations as well as to the future generations and remove one of their anxieties, and of
automatically adjusting the benefit level to make both ends meet. This idea of an automatic
balancing mechanism was obtained by studying the Swedish reform in 1990’s. The final form was,
however, a bit different, mainly due to the fact that the population ageing is much faster in Japan
than in Sweden.
The automatic balancing mechanism of the 2004 reform works by modifying the
indexation in a way that limited the benefit increase. Before the reform, the amount of benefit was
indexed to the increase rate of disposable income of the active workers for beneficiaries aged less
than 65 and to the increase rate of the Consumer Price Index (CPI) for beneficiaries aged 65 and over.
The 2004 reform has changed the indexation and defined the modifier as follows:
(modifier) = (rate of decline of active participants of the social security pension schemes)
+ (yearly increase rate in life expectancy at age 65)
Then the indexation is modified by subtracting the modifier from the normal indexation until the
financial equilibrium is projected to be attained. When it is so projected, the indexation will return
to the normal indexation as that before the 2004 reform.

5
It was a great coincidence that this automatic balancing mechanism is almost the same as
the German reform in 2004.
Other than this automatic balancing mechanism, the 2004 reform addresses the following issues:
- adapting the social security pension schemes to the changing life style of the people,
especially that of women,
- improving the organizational structure of investing and managing the reserve fund of the
social security pension schemes,
- neutralizing the financial relationship between the Employees’ Pension Insurance (EPI)
scheme and the contracted out portion of the Employees’ Pension Funds, and increasing the
upper limit of contributions to the defined-contribution pension plans.
Chapter 1 also briefly describes the Japan’s social security pension schemes. The whole
nation is covered by the National Pension (NP) scheme that provides flat-rate basic pension benefits
and collects flat-rate contributions from the self-employed. The employees are further covered, in
addition to the NP scheme, by either the Employees’ Pension Insurance (EPI) scheme that is for
general employees in the private sector or the Mutual Aid Associations (MAA) that are for
employees in the public sector. The EPI scheme or the MAAs provide earnings-related benefits and
collect earnings-related contributions.
Chapter 2. Restoring the Financial Balance
The fixed contribution schedule of the EPI scheme is to raise the contribution rate from
13.58% to 13.934% in October 2004 and every year in September it is to be raised by 0.354% until
2017 and after 2017 it is to be fixed at 18.3%. The fixed contribution schedule of the NP scheme for
the self-employed is to raise the monthly contribution rate of JPY 13,300 to JPY 13,580 in April
2005 and every year in April it is to be raised by JPY 280 until 2017 and after 2017 it is to be fixed
at JPY 16,900. These flat-rate contributions are expressed in terms of FY 2004 value and they are
indexed to the increase rate of the per-capita gross earnings of active workers.
Under these contribution schedules, it is projected in the best estimate case that, in the case
of the EPI scheme, the duration of modified indexation lasts until 2023 and after 2023 the indexation
returns to the normal one. The modified indexation gradually lowers the benefit level. We express it
by the replacement ratio. By replacement ratio, we mean the ratio of the sum of the annual old-age
benefit amount a couple satisfying the following conditions receive at age 65 to the average annual

6
disposable income of the active workers at that time:
(a) The husband has been covered by the EPI scheme from the age 20 until the age 59 for 40 years,
and earned the average salary every year all the time.
(b) The wife is of the same age as her husband and has been dependent spouse from the age 20 until
the age 59.
The replacement ratio is projected to decrease from 59.3% in 2004 to 50.2% in 2023. After 2023, it
remains 50.2%.
When we consider the financial equilibrium of the social security pension schemes, we
have decided to do so for a finite period. For 2004, the period considered is from FY 2005-FY 2100.
The length of the finite period of financial equilibrium, 95 years in this case, should be maintained in
subsequent actuarial reviews. We have also decided that the reserve fund should be equivalent to
one-year of benefit expenditures. The above-mentioned discussion of financial equilibrium is always
done for this finite period of financial equilibrium.
To remove the anxiety that the benefit level might infinitely decrease by the modified
indexation, we have provided the minimum benefit level. It is 50% in terms of the replacement ratio.
If the replacement ratio threatens to fall below 50% within the next 5 years, we are to stop the
modified indexation and drastically review the scheme.
In addition to this automatic balancing mechanism, the national subsidy rate to the basic
pension benefit would be raised to 1/2 from 1/3. This also contributes to restoring financial
equilibrium. It should, however, be pointed that the financial resources for this raising are not yet
decided though the tax schedule published in December 2003 although the government parties
referred to several concrete measures. The tax law should be amended in due course.
Chapter 3. Adapting the Schemes to Changing Life Pattern
We are now experiencing a decline of the active population, an increase in the number of
working women, an increase of the number of part-timers and an increase of the number of younger
people not in full employment but in part-time employment. The 2004 reform has also addressed
the issues raised by these changes.
First, the unconditional reduction of 20% of the benefit level has been abolished when a
beneficiary continues to work in order to avoid hindering elderly people from working. Income

7
testing has been introduced for those working pensioners aged 70 and over in order to equalize the
treatment of the elderly.
Second, the law stipulates that the issue of extending of the coverage of the EPI scheme to
part-timer workers should be addressed in the next reform. Due to the long-lingering stagnant
economy, the number of the young people not in full employment but in part-time employment is
rapidly increasing and they are certainly the people who need benefits as employees in their
retirement. The government tried to extend the coverage of the EPI scheme to them, but it could not
obtain the agreement from the employers. So it has decided to continue the discussion.
Third, dependent spouses now have the right to claim half of the benefit corresponding to
the period of marriage as their own benefit upon divorce. This is a beginning towards clarifying
women’s rights to pensions. Also, upon divorce, a couple can share their benefits corresponding to
the period of marriage with the maximum being half of the sum of the pensions of the couple.
Chapter 4. Investment and Management of the Reserve Fund
Both the EPI scheme and the NP scheme have accumulated fairly large reserve funds
although the financing still relies heavily on intergenerational income transfers and the relative size
of the reserve funds is much smaller than those of the advance-funded corporate pension plans.
The accumulated reserve funds were compulsorily entrusted to the Trust Fund Bureau of
the Ministry of Finance until FY 2000. They became financial resources for the Fiscal Investment
and Loan Program (FILPs) with the entrusted money of the postal savings and postal insurance. The
FILPs greatly contributed to consolidating the economic infrastructure that was devastated during
the World War II and to realizing the rapid economic growth in 1960s.
The Ministry of Health and Welfare, on the other hand, had insisted since the inception of
the EPI scheme in 1942 that the reserve fund should be managed and invested by the entity
responsible for the social security pension schemes. This was partly done shortly after the 1985
reform. The public corporation called the Pension Welfare Corporation that was mainly lending
money to corporations planning to build welfare facilities for their employees or for the people in the
region, was allowed to borrow money from the Trust Fund Bureau and invest it in the market. If they
earned surplus over the borrowing interest rate, they transferred it to the Pension Sub-account of the
Social Insurance Special Account or to the National Pension Sub-account of the National Pension
8
Special Account. This took place at the time that the Trust Fund Bureau abolished the minimum
guaranteed interest rate of 6% due to the lingering low interest rate produced by the Plaza Agreement
in 1985. This framework started in 1987.
As the economy matured after several decades had passed since the end of the World War
II, the roles of the FILPs gradually receded. This provoked a restructuring of the FILPs. In the end,
it was decided that the public corporations discharging the duties imposed by the FILPs should
collect financial resources by issuing bonds or the Trust Fund Bureau should collect them by issuing
bonds for them. The bonds issued by the Trust Fund Bureau are called fiscal investment bonds. It
was also decided that the obligation to entrust the reserve funds of the social security pension
schemes to the Trust Fund Bureau should be abolished. It was abolished at the end of FY 2000.
Now that the obligation to entrust the reserve funds had been abolished, the Ministry of
Health, Labour and Welfare3 had to invest and manage them. The 2000 reform introduced the
framework for it. The Pension Welfare Corporation was abolished and the Government Pension
Investment Fund (GPIF) was introduced on 1 April 2001.
Under the new framework, the Minister of Health, Labour and Welfare is required to
publish the statement of investment principles and decide the principal portfolio based on the advice
of the Investment Subcommittee of the Social Security Council. The investment principles confirm
the following points:
(a) The investment should be made solely for the interest of the covered people.
(b) The asset allocation should be diversified in order to obtain the targeted rate of return at
minimized risk.
(c) The duty of care and duty of loyalty are imposed on every person concerned with the investment
and management of the reserve fund.
(d) The concrete plan of investment, the result of the investment and its effects on the financial
conditions of the social security pension schemes should be disclosed.
The principal portfolio is composed of 67% of domestic bonds, 11% of domestic stocks, 8% of the
foreign bonds, 9% of foreign stocks and 5% of short-term assets.
The GPIF should make and publish the plans to invest and manage the reserve fund in
accordance with the Minister’s investment principles and the principal portfolio.
3 The Ministry of Health and Welfare merged with the Ministry of Labour in January 2001 and became the Ministry of Health, Labour and Welfare.

9
Since the money in the reserve fund was entrusted to the Trust Fund Bureau mainly with
7-year maturity, it takes about 7 years for all of the entrusted money to be returned to the pension
sub-accounts. It is to end in FY 2008. At the same time, the money borrowed from the Trust Fund
Bureau by the Pension Welfare Corporation was with 10-year maturity. It is to be returned by FY
2010. Until then, what the GPIF invest and manage consists of the newly accumulated money, the
returned money and the borrowed money and excludes the money remaining in the Trust Fund
Bureau. So the guiding portfolio cannot be the principal portfolio for the time being. The guiding
portfolio in transition is decided on the basis of the advice of the Investment Subcommittee. It
consisted, in FY 2004, of 79% of domestic bonds including the entrusted money in the Trust Fund
Bureau, 7% of domestic stocks, 3% of foreign bonds, 5% of foreign stocks and 6% of short-term
assets. The guiding portfolio for the GPIF to invest in the market consisted, in FY 2004, of 56% of
domestic bonds, 20% of domestic stocks, 10% of foreign bonds, 14% of foreign stocks and 0% of
short-term assets. The current plan would lead to the principal portfolio in FY 2008.
The 2004 reform transforms the GPIF into an agency in order to emphasize its
independence and clarify the powers and duties of the agency. The reform has also required that the
members of the board of the agency, including the president. should be experts in finance and
economics.
Chapter 5. Complementary Schemes
The corporate pension plans in Japan mainly consist of Employees’ Pension Funds (EPFs),
Tax Qualified Pension Plans (TQPPs), defined-benefit corporate pension plans (DB plans) and the
defined-contribution pension plans (DC plans).
The EPFs have substitute for a portion of the old-age earnings-related pension benefits of
the EPI scheme. In return, the EPFs are exempted from paying a portion of the EPI contributions to
the government. Instead, the employees and employers pay the portion to the EPFs. This exempted
part of the EPI contributions is called the rebate for the EPF. Before the 2004 reform, the rebate was
calculated as the level contribution for the future period with the assumed interest rate being 5.5%
and the assumed mortality being the same as that of the latest actuarial valuation of the EPI scheme.
If the investment environment was bad and an EPF could not exceed the assumed interest rate of
5.5%, the deficits caused by it should be compensated by the employer or employers. If the mortality
improved, the deficits caused by it for the past period should be compensated by the employer or
employers. After having experienced a long period of low investment return in 1990s, the fixed

10
assumed interest rate of 5.5% came to be considered as too heavy a burden on the EPFs. With the
fixed interest rate, the EPFs benefit when the investment environment is favourable while the EPI
scheme suffers from the loss that it would be able to avoid without the EPF system. The EPFs suffer
when low rate of investment return continues while the EPI scheme is relieved by the existence of
the EPFs. They started to ask for a measure that was financially neutral to both the EPFs and the EPI
scheme. The 2004 reform has established a measure that will realize the financial neutrality. It is to
calculate the buy-back reserve on the basis of income and outgo of the EPFs for the substituted
portion. The income consists of the rebates, money transferred from the pension sub-account and
investment return. The outgo consists of the benefit payment of the substituted portion. Before the
2004 reform it used to be calculated as the present value of the substituted benefits that had accrued
up to the point of calculation with the assumed interest rate being 5.5%. When the new buy-back
reserve is too small for the present value of the benefits that have accrued so far, a rule to transfer a
certain amount of money from the pension sub-account to the EPFs was introduced in order to avoid
cash shortfalls in the EPFs.
Taking account of the reduced benefit level of the social security pension schemes, the
upper limit of the contributions to the DC plans has been raised in the 2004 reform. In the case of
DC plans of companies that have not introduced other types of corporate pension plans, the upper
limit of the monthly contributions has been raised from JPY 36,000 to JPY 46,000. All these
contributions are tax-deductible.
11
Chapter1. Introduction
1-1. Introduction
Like many other countries in the world, Japan has struggled with the problem of how to
restore and maintain the sustainability of the social security pension schemes for more than two
decades under the relentlessly continuing pressure of ever improving longevity and unceasing
decline of the birth rate. The premise has been that maintaining the purchasing power of the
benefits or keeping up with the general standard of living for the beneficiaries, which are the core
role of the social security pension schemes as income security in retirement, can only be realized
through intergenerational income transfer. This financing principle, however, is vulnerable to
population ageing. Actually, each new population projection assumes further improved mortality
and/or smaller birth rate than the previous one, as we review the population projection every five
years. Each time these population projections have been published, the government has had to restart
the pension reform discussion.
The 2004 reform took place in the same context. In spite of the major reform in 20004,
Japan’s social security pension schemes were forced to consider further reform when the National
Institute of Population and Social Security Research (NIPSSR) published the new population
projection in January 2002. It showed further graying of the Japanese population due to projected
declines in birth and mortality rates that surpassed those that were available at the time of the 2000
reform, destroying the long-term financial balance delicately achieved by that reform.
On the other hand, the politicians of both government parties and opposition parties were
becoming fed up with the political battle on social security pension matters that had been fought
throughout the last decade. Thus many politicians, scholars and other concerned people began to
search for a mechanism that would automatically restore the financial balance of the scheme even
when another decline of birth rate or another improvement of mortality occurs, enabling them to
avoid frequently repeating reforms.
This was just at the time when Sweden was about to finish a pension reform that fixed the
contribution rate and incorporated, under the fixed contribution rate, an automatic balancing
mechanism into the scheme framework. Those working on the reform were fascinated by the
Swedish reform and thoroughly studied it. In the end, obtaining a lot of hints from the Swedish
4 For the scheme as of the 2000 reform, please see Sakamoto (2000).

12
reform, a mechanism was worked out that modifies the indexation to be applied to the benefit
amount when the scheme is not financially balanced and is to be continued until financial
equilibrium is attained. After the equilibrium is attained, the scheme returns to the normal indexation
method. If the socio-economic environment worsens, the modified indexation is continued until
financial equilibrium is attained. On the other hand, if the socio-economic environment improves,
the modified indexation can be suspended earlier than projected, keeping the ultimate benefit level
higher. In this way, financial balance would be achieved automatically.
Although the mechanism has eventually become different from the one used in Sweden, it
was a great coincidence that Germany introduced a modified indexation quite similar to ours in their
2004 reform whose bill passed by the Congress in March 2004, three months earlier than our case.
This may suggest that there are not so many options for countries that must tackle the problems
raised by rapid population ageing over long periods of time.
The introduction of the automatic balancing mechanism is the core element of the 2004
reform and we will describe it in detail in the first part of this paper.
The 2004 reform has also introduced measures to adapt the schemes to the changing life
pattern of the people, especially that of women and younger generations. This is explained in the
second part.
The third part focuses on the management and investment of the reserve fund of the social
security pension schemes in Japan. The 2004 reform has also improved the framework following the
reform in 2000.
The reserve fund, whose size is currently five times as large as annual expenditures, used
to be compulsorily entrusted to the Fund Trust Bureau of the Ministry of Finance and be the
financial resources for the Fiscal Investment and Loan Program (FILPs) to reconstruct the
infrastructure such as harbours, bridges, houses etc. devastated during World War II. As the roles
of the FILPs receded after the great economic growth in 1960’s and 1970’s, the restructuring of the
FILPs was put on the political agenda. Finally the government decided to abolish the obligation of
entrusting the reserve fund to the Fund Trust Bureau and let the schemes autonomously invest and
manage it. This was done in the 2000 reform, and became effective in April 2001. It was a great
turning point in the history of the investment and management of the reserve fund of the social
security pension schemes.

13
The 2000 reform also abolished the Pension Welfare Corporation5 and replaced it with the
Government Pension Investment Fund (GPIF). Even before its abolition, the Pension Welfare
Corporation had started to invest some money borrowed from the Fund Trust Bureau in the capital
markets since 1986 and, if they earned profit over the borrowing interest, they would return it to the
social security pension schemes. This had been undertaken under the strong pressure from the
employees as well as the employers. The 2000 reform, in a sense, ordered the Pension Welfare
Corporation to concentrate on the investment and management of the reserve fund and withdraw
from the undertakings of other welfare schedules such as constructing and managing the welfare
facilities or lending money to corporations planning to install welfare facilities for their employees
or for the people in the region.
The 2004 reform consolidated the framework of the management and investment of the
reserve fund and decided to change the nature of the GPIF from a public corporation to an agency,
whereby the principal portfolio is to be decided not by the Minister of Health, Labour and Welfare
but by the agency. It will become effective from April 2006.
The fourth part of this paper describes the reform of the complementary pensions whose
roles are expected to be of greater importance when the roles of the social security pension schemes
become more limited.
This paper describes these four issues addressed to by the 2004 reform. But, before we
start, we will briefly outline the social security pension schemes in Japan to provide a proper
backdrop for the discussion.
1-2. Social security pension schemes in Japan
(1) Coverage
Every resident of Japan aged between 20 and 60 is compulsorily covered by the National
Pension (NP) scheme. If he/she is an employee in the private sector, he/she is covered by the
Employees’ Pension Insurance (EPI) scheme as well. This coverage is also compulsory. If he/she
is an employee in the public sector like the national government, the local governments, etc., he/she 5 The Pension Welfare Corporation was established in 1961 as one of the corporations to implement the FILPs. Its role was to construct and manage welfare facilities throughout the country or to lend money to corporations which planned to construct welfare facilities for their employees or for the people in the region. It was abolished in 2001 and was replaced by the Government Pension Investment Fund. The Pension Welfare Corporation was called Nenkin-fukushi-jigyodan in Japanese or Nenpuku in short.

14
is compulsorily covered by one of the mutual aid associations (MAA’s). There are three MAA’s:
MAA for government employees, MAA for local government employees, and MAA for private
school employees. Fig. 1-1 shows the structure of coverage of the social security pension schemes
in Japan.
(Fig. 1-1) Social Security Pension Schemes in Japan
The active people covered by the NP scheme are classified into three categories.
Self-employed people, farmers, fishermen, etc. belong to the first category. Their dependent
spouses are also included in this group. Those covered by the EPI or one of the MAA’s are
classified as in the second category. Their dependent spouses form the third category.
(2) Benefits
The NP scheme provides flat-rate basic pensions; the annual amount of benefit is
proportionate to the ratio of the number of covered months to 480 months (1 at the maximum),
irrespective of what his/her income has been. The current annual amount for a beneficiary of 480
months of contribution is JPY 780,900 as of 1 April 20056.
The EPI and MAA schemes provide earnings-related pensions; the annual amount of
benefit is 5.481‰ of the average of the pensionable remunerations during the covered period
multiplied by the number of covered months. The average of the pensionable remunerations is
defined to be the sum of the average of the monthly pensionable remunerations and the average of
6 Strictly speaking, it is provisionally JPY 794,500 because, for FY 1999, FY 2000 and FY 2001, the amount was not indexed in spite of the deflation of 1.7%, but this amount is not to be indexed until the CPI increases by more than 1.7% from the 2004 average level. (If deflation happens again, this amount is to be indexed downward.)
(EPI)
National Pension Schem e (Basic Pension Benefits)(NP)
of the em ployed
(occupational addition)
the self-em ployed em ployees in the private sector
Em ployees' Pension Insurance Schem e M utual Aid Associations(M AA's)
non-w orking spouses governm ent em ployees, etc.

15
pensionable bonuses. The average of the pensionable bonuses is the sum of the pensionable
bonuses divided by the number of the covered months. Fig. 1-2 shows the formula to calculate the
benefit amount of the old-age earnings-related pension benefit of the EPI scheme.
(Fig. 1-2) Benefit Formula for Earnings-related Part
The monthly pensionable remunerations and the pensionable bonuses are revalued
according to the increase of disposable income of the active workers so that the benefit is indexed to
the improvement of the active workers’ disposable income level up until the beneficiary reaches the
age of 65. After the age of 65, the benefit is indexed to the increase of the Consumer Price Index
(CPI).
The social security pension schemes in Japan are thus composed of two layers for
employees, providing flat-rate benefits and earnings-related benefits respectively. The
self-employed people are, on the other hand, provided only with flat-rate benefits.
The benefit level the social security pension schemes are providing now may be measured
in various ways. One measurement the MHLW has often utilized is a replacement rate7 for a
household where the husband has been covered by the EPI scheme from the age of 20 to the age of
59 and the wife is the same age as her husband and has been dependent the entire life. The
replacement rate is the ratio of the sum of the annual amount of the old-age benefits the couple is to
receive at the age of 65 to the amount of the career average disposable income8 of the husband.
For this calculation, it is assumed that the gross annual income is twelve times monthly pensionable
remunerations plus 3.6 times monthly pensionable remunerations (the latter is the average level of
bonuses) and that the annual disposable income is 84% of the gross annual income. For a
household where the husband has earned the average salary the entire life9, the current benefit
amount at age 65 is about JPY 233,000 per month and the replacing rate is 59.3%. For a household
where the husband’s career average of revalued monthly pensionable remunerations is JPY 200,000,
the benefit amount at age 65 is about JPY 188,000 per month and the replacing rate is 86.3%. For a 7 In section 2-6, we define a more specific replacement rate and we call it the replacement ratio in this paper. It is a replacement rate of a household where the husband has earned the average salary the entire life. Furthermore the denominator of the replacement ratio is the average annual disposable income of the active male workers. 8 The disposable income is the amount of the gross income minus tax and social security contributions. 9 In this case the career average of revalued monthly pensionable remunerations is about JPY 360,000.
The average of the pensionableremunerations (Revalued) ××
10005.481 The number of
covered monthsThe annual amount of benefit(Earnings-related pensions) =
16
household where the husband’s career average of revalued monthly pensionable remunerations is
JPY 600,000, the benefit amount at age 65 is about JPY 301,000 per month and the replacement rate
is 45.9%. The more you have earned, the less the replacement rate will be though the benefit
amount will be larger. It is due to the redistributive nature of the flat-rate basic pension benefits.
The pensionable age is now 60 for the earnings-related part whereas it is 65 for the old-age
basic pension benefit. It is, however, to be raised gradually to 65 for the earnings-related part by
the year of 2025 for men and 2030 for women.
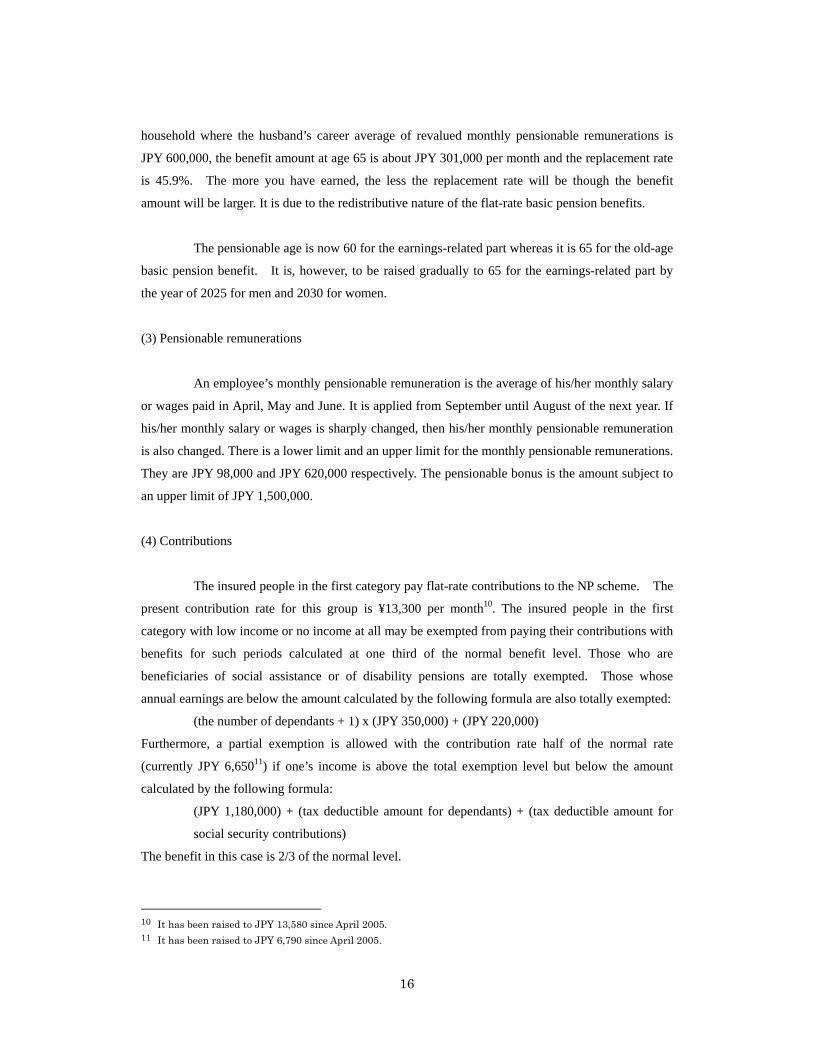
(3) Pensionable remunerations
An employee’s monthly pensionable remuneration is the average of his/her monthly salary
or wages paid in April, May and June. It is applied from September until August of the next year. If
his/her monthly salary or wages is sharply changed, then his/her monthly pensionable remuneration
is also changed. There is a lower limit and an upper limit for the monthly pensionable remunerations.
They are JPY 98,000 and JPY 620,000 respectively. The pensionable bonus is the amount subject to
an upper limit of JPY 1,500,000.
(4) Contributions
The insured people in the first category pay flat-rate contributions to the NP scheme. The
present contribution rate for this group is ¥13,300 per month10. The insured people in the first
category with low income or no income at all may be exempted from paying their contributions with
benefits for such periods calculated at one third of the normal benefit level. Those who are
beneficiaries of social assistance or of disability pensions are totally exempted. Those whose
annual earnings are below the amount calculated by the following formula are also totally exempted:
(the number of dependants + 1) x (JPY 350,000) + (JPY 220,000)
Furthermore, a partial exemption is allowed with the contribution rate half of the normal rate
(currently JPY 6,65011) if one’s income is above the total exemption level but below the amount
calculated by the following formula:
(JPY 1,180,000) + (tax deductible amount for dependants) + (tax deductible amount for
social security contributions)
The benefit in this case is 2/3 of the normal level.
10 It has been raised to JPY 13,580 since April 2005. 11 It has been raised to JPY 6,790 since April 2005.

17
The insured people of the second category pay contributions proportionate to their
pensionable remunerations to either the EPI scheme or one of the MAA’s. The present contribution
rate of the EPI scheme is 13.934% as of 1 April 200512.
The insured people of the third category, namely dependent spouses of employees, do not
have to pay contributions though each insured month as a category 3 person is considered to be a
month in which he/she has paid the contribution of the NP scheme. Accordingly, a person with 40
years covered by the NP scheme totally as category 3 can receive his/her old-age basic pension
benefit of full amount though he/she has never paid the contributions. As seen in the following
paragraph, the contributions are effectively made for them by the schemes which cover their
spouses.
(5) Financing the basic pension expenditure
The benefit expenditure of the basic pensions is managed by the Basic Pension
Sub-account of the National Pension Special Account. It is financed by transferring the designated
amount of money from each of the schemes to the Sub-account. Fig. 1-3 shows the flow of the
financial resources for the basic pension expenditure. The designated amount of money for a
scheme is the total amount of annual expenditure of the basic pensions multiplied by the ratio of the
number of the active people aged between 20 and 59 covered by the scheme plus the number of their
dependent spouses aged between 20 and 59 to the total number of active people aged between 20
and 59 throughout the schemes plus the number of their dependent spouses aged between 20 and 59.
In other words, the total amount of annual expenditure of basic pensions is shared by each of the
schemes proportionately to the number of active people aged between 20 and 59 covered by the
scheme and their dependent spouses aged between 20 and 59.
In calculating the designated amount of money, the insured people of the first category are
deemed to form one group and the National Pension Sub-account of the National Pension Special
Account transfers the designated amount of money to the Basic Pension Sub-account. The
National Pension Sub-account collects contributions from the insured people of the first category.
In this way, the financing of the basic pension benefits is immune to changes in the
industrial structure though it is still dependent on the demographic structure. When the designated
amount of money is transferred from each scheme to the basic pension account, one third of the
amount is subsidized from the general revenue for each scheme. This is shown in Fig. 1-3 as each
12 It was raised from 13.58% to this rate in October 2004.
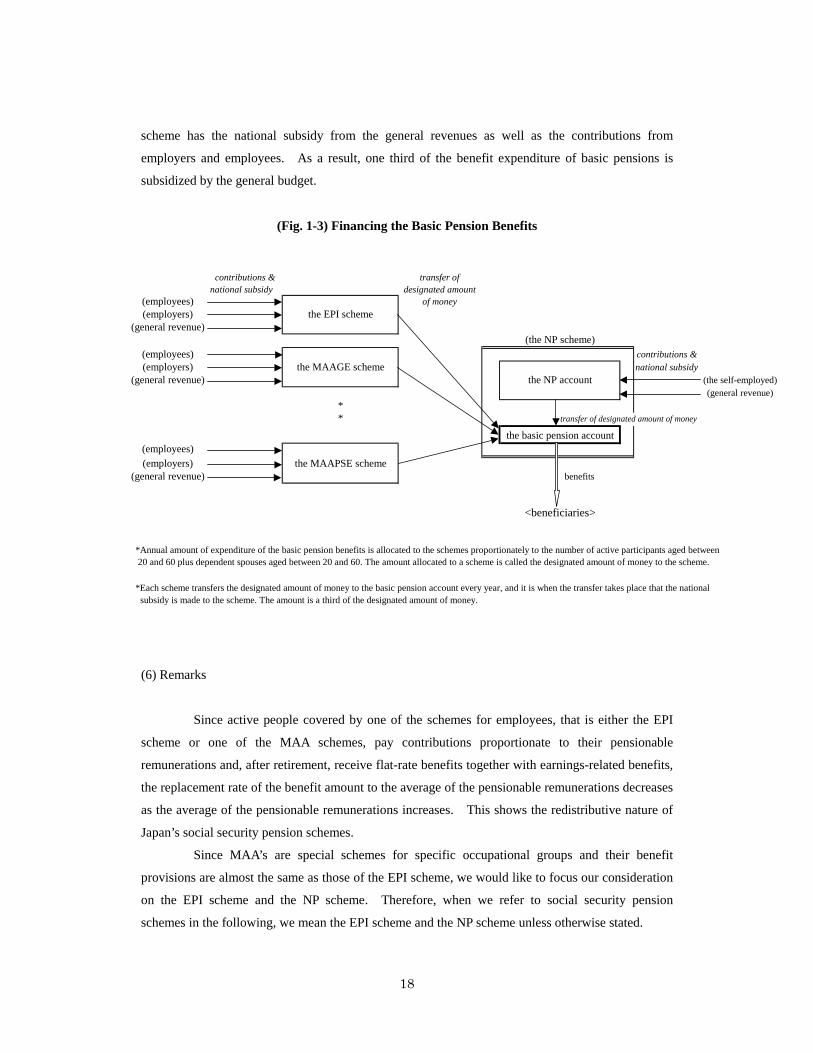
18
scheme has the national subsidy from the general revenues as well as the contributions from
employers and employees. As a result, one third of the benefit expenditure of basic pensions is
subsidized by the general budget.
(Fig. 1-3) Financing the Basic Pension Benefits
(6) Remarks
Since active people covered by one of the schemes for employees, that is either the EPI
scheme or one of the MAA schemes, pay contributions proportionate to their pensionable
remunerations and, after retirement, receive flat-rate benefits together with earnings-related benefits,
the replacement rate of the benefit amount to the average of the pensionable remunerations decreases
as the average of the pensionable remunerations increases. This shows the redistributive nature of
Japan’s social security pension schemes.
Since MAA’s are special schemes for specific occupational groups and their benefit
provisions are almost the same as those of the EPI scheme, we would like to focus our consideration
on the EPI scheme and the NP scheme. Therefore, when we refer to social security pension
schemes in the following, we mean the EPI scheme and the NP scheme unless otherwise stated.
contributions & transfer ofnational subsidy designated amount
(employees) of money(employers) the EPI scheme
(general revenue)(the NP scheme)
(employees) contributions &(employers) the MAAGE scheme national subsidy
(general revenue) the NP account (the self-employed)(general revenue)
** transfer of designated amount of money
the basic pension account(employees)(employers) the MAAPSE scheme
(general revenue) benefits
<beneficiaries>
*Annual amount of expenditure of the basic pension benefits is allocated to the schemes proportionately to the number of active participants aged between 20 and 60 plus dependent spouses aged between 20 and 60. The amount allocated to a scheme is called the designated amount of money to the scheme.
*Each scheme transfers the designated amount of money to the basic pension account every year, and it is when the transfer takes place that the national subsidy is made to the scheme. The amount is a third of the designated amount of money.

19
Table 1-1 shows the basic statistical data of the schemes for employees.
(Table. 1-1)
The number ofcovered people (①)
The number ofold-age
beneficiaries( ②)( ①/②)
The average monthlyamount of old-agepension benefits*
Reserve Fund Contribution Rate( FY2005)
As of March 2003 (in 10 thousand) (in 10 thousand) (JPY in 10 thousand) (JPY in trillion) %Employee's Pension Insurance 3214 1015 3.17 17.4 137.7 13.934MAA for government employees 110 61 1.81 22.8 8.7 14.509MAA for local government employees 318 147 2.16 23.6 37.5 13.384MAA for private school employees 43 8 5.57 22.0 3.1 10.814
Total 3686 1230 3.00 35.8 - -* Beneficiaries who started to receive old-age pension benefits earlier than the normal pensionable age with the amount reduced and those who delayed starting to receive them with the amount increased are excluded.Source: Ministry of Health, Labor and Welfare

20
Chapter 2. Restoring the Financial Balance
2-1. Population projection
The population projection forms the basis for projecting the future financial conditions of
the social security pension schemes. If the projection shows fewer births and lower mortality, it
affects the future financial conditions of the social security pension schemes. In this section, we get
a glimpse at population projections of the last two decades that motivated and directed the recent
reforms including the 2004 reform.
(1) Population projection and period total fertility rate
The NIPSSR reviews the population projection every five years on the basis of the results
of the National Census that is also undertaken every five years. It also takes account of various
statistics and surveys such as the vital statistics collected by the Ministry of Health, Labour and
Welfare (MHLW).
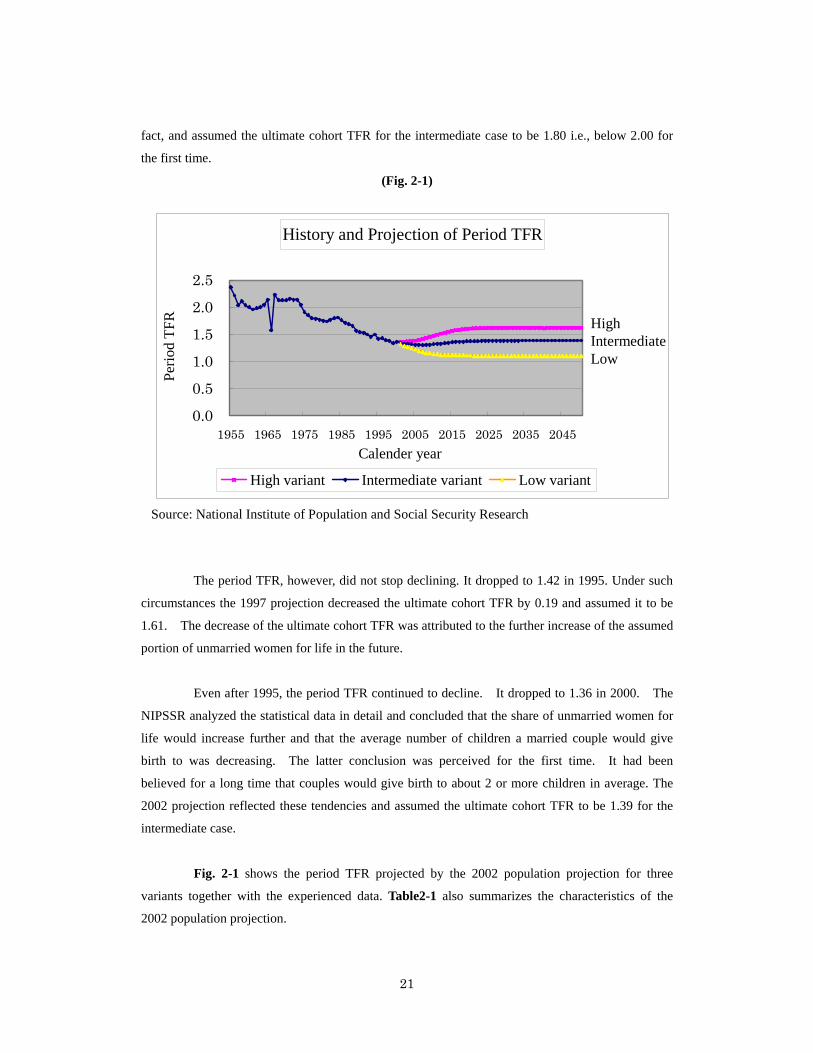
Apart from the population projection, the MHLW publishes the period TFR13 every year,
taking account of both the latest National Census and the vital statistics collected every year. As
Figure 1 shows, the period TFR seemed to stay around the level of 1.80 in early 1980’s.
Furthermore, because it had not been more than ten years since it had dropped below 2.00, very few
people then wondered whether the population projection that assumed that the ultimate cohort TFR14
return to 2.00 was too optimistic. Thus, until the 1986 projection, the ultimate cohort TFR was
assumed to be 2.00.
In the latter half of 1980’s, however, the declining tendency of the period TFR became
conspicuous. It never fluctuated but just decreased. The period TFR of 1.76 in 1985 dropped to
1.54 in 1990. The decline was attributed to the increase of the average age of initial marriage of
women15. At the same time, it was perceived that the number of women who would not get
married for life was threatening to increase. The 1992 projection naturally paid attention to this
13 TFR denotes the total fertility rate. The period TFR of the year is the sum of the birth rates of the females aged between 15 and 49 in the year. 14 The cohort TFR means how many children the females of the same birth year give birth to in average between the age of 15 and 49. 15 In Japan it is very rare for legally unmarried couples to have their children. It can, therefore, be said that, when the average age of initial marriage of females is rising, the period TFR goes down, and that the more there are females unmarried for life, the smaller the number of births will be.
21
fact, and assumed the ultimate cohort TFR for the intermediate case to be 1.80 i.e., below 2.00 for
the first time.
(Fig. 2-1)
The period TFR, however, did not stop declining. It dropped to 1.42 in 1995. Under such
circumstances the 1997 projection decreased the ultimate cohort TFR by 0.19 and assumed it to be
1.61. The decrease of the ultimate cohort TFR was attributed to the further increase of the assumed
portion of unmarried women for life in the future.
Even after 1995, the period TFR continued to decline. It dropped to 1.36 in 2000. The
NIPSSR analyzed the statistical data in detail and concluded that the share of unmarried women for
life would increase further and that the average number of children a married couple would give
birth to was decreasing. The latter conclusion was perceived for the first time. It had been
believed for a long time that couples would give birth to about 2 or more children in average. The
2002 projection reflected these tendencies and assumed the ultimate cohort TFR to be 1.39 for the
intermediate case.
Fig. 2-1 shows the period TFR projected by the 2002 population projection for three
variants together with the experienced data. Table2-1 also summarizes the characteristics of the
2002 population projection.
Source: National Institute of Population and Social Security Research
History and Projection of Period TFR
0.0
0.5
1.0
1.5
2.0
2.5
1955 1965 1975 1985 1995 2005 2015 2025 2035 2045Calender year
Perio
d TF
R
High variant Intermediate variant Low variant
HighIntermediateLow

22
(Table. 2-1)
Comparison of the 2002 population projection with the 1997 projection
(intermediate case)
2002 projection 1997 projection
average age of 24.4 (cohort born in 1950) 24.2 (cohort born in 1945)women's first marriage >>> 27.8 (cohorts born in 1985 and later) >>> 27.4 (cohorts born in 1980 and later)
average number of births 2.14 (cohorts born in 1948-52) 2.18 (cohorts born in 1943-47)per married couple >>> 1.72 (cohorts born in 1985 and later) >>> 1.96 (cohorts born in 1980 and later)
ratio of the number of women unmarried for life 4.9% (cohort born in 1950) 4.6% (cohorts born in 1941-45)to the total number of women >>> 16.8% (cohorts born in 1985 and later) >>> 13.8% (cohorts born in 1980 and later)in the same cohort
total fertility rate 1.36 (2000) >>> 1.31 (2007) >>> 1.39 (2050) 1.42 (1995) >>> 1.38 (2000) >>> 1.61 (2050)
life expectancy male: 77.64 (2000) >>> 80.95 (2050) male: 76.36 (1995) >>> 79.43 (2050)female: 84.62 (2000) >>> 89.22 (2050) female: 82.84 (1995) >>> 86.47 (2050)
(Table. 2-1)
Comparison of the 2002 population projection with the 1997 projection (continued) (intermediate case)
year 2002 projection 1997 projectiontotal population 2000 126,926 thousand 126,892 thousand
2025 121,136 120,9132050 100,593 100,4962070 82,506 83,773
popuation aged 65 and over 2000 22,041 thousand 21,870 thousand2025 34,726 33,1162050 35,863 32,4542070 29,043 25,098
ratio of the population 2000 17.4% 17.2%aged 65 and over to 2025 28.7 27.4the total population 2050 35.7 32.3
2070 35.2 30.0ratio of the population 2000 27.9% 27.7%aged 65 and over to 2025 51.9 50.2the population aged 2050 71.9 64.6between 20 and 64 2070 71.1 57.8

23
(2) Population projection and mortality rate
Every year, based on the vital statistics, we can obtain the death rate for each age. The
NIPSSR compares it with the assumptions used for the latest population projection. Every time the
NIPSSR reviews the population projection, it finds that the experienced rate is, by and large, smaller
than the assumed rate. This has continued for a very long time. In other words, each projection
assumed the improved mortality rate in comparison with the previous one. In fact, as Table 2-1
shows, the ultimate life expectancy of the 2002 projection is 80.95 years for men which is 1.52 years
longer than the 1997 projection and is 89.22 years for women which is 2.75 years longer than the
1997 projection.
(3) Population projection and repeated reviews
Here, people may wonder why the NIPSSR has always been overly optimistic and has
repeatedly changed its population projection towards a less optimistic one than the previous one.
The author would argue, for such questions, that projecting the future trends is, in general, a tough
task, and even tougher when there is an accelerating tendency in the trends. The author does not
think that the methodology adopted by the NIPSSR was wrong. When we project the future trends,
we only depend on the current evidence and project it linearly to the future except when we have
obtained evidence that clearly shows non-linear tendency or when we have perceived new trends that
can be quantified. For example, the 1997 population projection did take account of the improving
tendency of mortality based on the experience up to then, but the degree of actual improvement
surpassed it. There also appeared a new tendency, after the publication of the 1997 population
projection, that the number of births a couple is expected to have started to decline.
Furthermore, in defined-benefit pension schemes, we have a periodical reviewing system
called the actuarial valuation. By periodically reviewing the assumptions of the projections by
comparing them with the actual experience, we periodically correct the projections and steer to keep
the schemes on the right track as much as possible. It candidly assumes that there is a limit to
projecting the future trends of social phenomena exactly and the actual experience may well diverge
from the projection. We correct it by periodical reviews. So, in a sense, we have taken it for granted
that periodical reviews would absorb all such past discrepancies, correcting the directions in the
future.
It should, however, be noted that repeated revisions of the population projections have
made people anxious about the future of their benefits. We should have endeavoured to give more

24
publicity to the meaning of the actuarial valuation. At the same time the government should have
been more careful enough on explaining the reforms to the nation. It often gave them the impression
that the reforms would permanently restore the financial balances of the schemes though it might
have been a matter of course in a political context16. Having heard such explanation, the nation
may well become impatient with the repeated revisions.
2-2. Reforms in the last decade
As noted above, the 1992 population projection assumed the ultimate cohort TFR to be
1.80 that was below 2.00 for the first time. Together with the mortality improvement, this
undermined the financial basis of the social security pension schemes. The 1994 pension reform
aimed at restoring their financial soundness. It raised the contribution rate and changed the
indexation basis from per-capita gross earnings to the per-capita net earnings. It also raised the
pensionable age of the flat-rate part of the Employees’ Pension Insurance (EPI) scheme benefit from
60 to 65. These changes were, in a sense, something that required sacrifice on the part of the active
participants as well as pensioners. In any case, most people that had studied the topic thought that
the schemes had attained financial sustainability and would not be changed for a fairly long time.
Contrary to their expectations, the 1997 population projection mercilessly worsened the
future financial conditions of the schemes. It lead to the 2000 reform in which the indexation basis
for pensioners aged 65 and over was changed from net earnings to the Consumer Price Index (CPI)
though there was no proposal to raise the contribution rate due to the lingering economic recession.
It also raised the pensionable age of the whole of the EPI scheme benefit from 60 to 65, lowered the
level of the earnings-related benefits by 5% and extended the coverage of the EPI scheme to
employees aged between 65 and 69. The reform law also stipulated an increase in the rate of
national subsidy to the basic pensions from 1/3 to 1/2 by the year 2004. These changes were
thought to have narrowly achieved financial sustainability if indeed the increase in the national
subsidy was implemented in 2004. However, securing the budget resources was a highly political
problem and appeared to be difficult to achieve.
In the 1994 reform, raising the pensionable age of the EPI scheme was a hotly debated
issue. The trade unions strongly opposed it and demanded the connection of employment with
pensions without break. In those days most of the companies set the mandatory retirement age at 16 In this sense, the 2004 reform can be said to have developed a framework for the nation to understand what is really the problem, as their attention will be paid more to the demographic and economic environments than to the pension schemes.

25
60. The government eventually gave up the idea of raising the pensionable age for both flat-rate
part and the earnings-related part, opting instead to raise it only for the flat-rate part. The trade
unions, however, never accepted the proposal. The bill passed the Diet by vote, but the conflict
between the trade unions and the government lingered on even after the passage of the reform bill.
In the 2000 reform, the trade unions declared that they would never accept changing the
benefit provisions nor raising the contribution rates. They insisted that, according to their
calculations, the same level of contribution rate would be applicable to the EPI scheme if the basic
pensions were to be converted into a non-contributory scheme. They did not, however, elaborate
the financial resources for the conversion. The government insisted that the benefit provisions
should be changed in order to keep the ultimate contribution rate within a sustainable level and also
warned them of the shortcomings of non-contributory schemes. The government was fiercely
confronted by the trade unions. Likewise, the government parties were also confronted with the
opposition parties backed by the trade unions. In the end, the government parties decided to put the
reform bill to a vote. The opposition parties resisted, but the bill passed the Diet.
2-3. 2002 population projection and need for reform
When the 2002 population projection was published, the Pension Bureau of the MHLW
evaluated its cost effects on the EPI scheme and the National Pension (NP) scheme17. The result
was that the EPI scheme would ultimately need to raise its contribution rate to as high as 25.9% and
the NP scheme to JPY 29,500 in FY 2004 value. These levels of contribution were judged to be far
from sustainable. Again the expectations that, through the 2000 reform, the schemes had
financially been stabilized were smashed.
Although measures were required to recover sustainability, it was strongly felt that it
would not be possible to repeat what had been done in previous reforms. Since we repeated
changes that would contain benefits, people’s distrust of the schemes had grown18. Some people
had come to feel anxiety about the future contribution level. Other people had started to have
obscure fears that they would not be able to receive their pensions when they retired. To simply
repeat raising the pensionable age or lowering the benefit level was bound to increase distrust.
Other measures that would remove people’s anxiety or fear and recover their trust were needed. In
17 Strictly speaking, it is the cost effect on the National Pension Sub-account to which the 1st-kind insured people of the NP scheme pay contributions that are flat-rate. 18 The is no survey for this, but this was felt mainly through the conversation with the legislators who told the government about what the constituents had told them.

26
other words, what was needed were reasonable measures that would gradually recover sustainability
without immediately imposing too much pain on particular generations, and, at the same time, would
make it unnecessary to repeat reforms every time the demographic conditions worsened.
It was just at that point that we obtained the details of Swedish reform.
2-4. Swedish reform
The Swedish reform undertaken in 1990’s consists of several elements. From the
financial and actuarial point of view, the introduction of automatic balancing mechanism with the
fixed contribution rate is most conspicuous.
First, it declares that the contribution rate for the state pension scheme is fixed at 18.5%,
which is supposed to eliminate the anxiety of younger generations that the contribution rate would
go up to an unsustainable level in the future. The contributions corresponding to 2.5% out of the
18.5% goes to the mandatory, privately-managed individual DC accounts, so the contributions
corresponding to 16% goes to the pay-as-you-go earnings-related part19.
Second, it has incorporated an automatic balancing mechanism into the earnings-related
part. It defines the concept of ‘turnover duration’ as being the difference between the average age
of pensioners and the average age of the active participants weighted respectively by the pension
amount and by the salary amount. At the end of each fiscal year, the scheme calculates the
turnover duration and compares the following two amounts:
(i) (the yearly contribution income) x (the turnover duration) + (the amount of the reserve fund)
(ii) the present value of the benefits corresponding to the period up to the end of the fiscal year
Fig. 2-2 illustrates what are compared. If the (i) is not less than (ii), the scheme is considered to be
financially balanced. If the (i) is less than (ii), the scheme is considered to be financially imbalanced,
and the amount of all of the benefits gained up to the end of the fiscal year is reduced by being
multiplied by the ratio of (i)/(ii). The reduction obviously renders the scheme balanced according to
the definition stated above. Thus this process automatically gives financial balance to the scheme,
and so it is called the automatic balancing mechanism.
For example, at the end of 2003, (i) was SEK 6,042,011 million and (ii) was 5,984,199
19 It is what they call the notional defined-contribution (NDC) part. It just provides old-age benefits, and does not provide disability benefits or survivors’ benefits.

27
million, so the scheme was considered to be financially balanced. In this case, the turnover duration
was calculated to be 32.39887 years, the yearly contribution income was SEK 168,681 and the
reserve fund was SEK 576,937.
The reason that the comparison of (i) with (ii) can be the indicator of the financial balance
is that, under a scheme that only provides old-age benefits in the same manner as the NDC does, the
present value of the benefits corresponding to the past period is equal to the yearly contribution
income multiplied by the turnover duration if the demographic structure of the scheme is
stationary20.
(Fig. 2-2)
Automatic balancing in the Swedish reform
(i) (ii)
(yearly contribution income)
X
(turnover duration)
(accumulated reserve fund)
2-5. Application of the Swedish automatic balancing mechanism to Japan’s case
Given that the objective was to find measures that would clearly fix the future contribution
level and, at the same time, automatically adjust the benefit level to the socio-economic environment
to keep financial balance, the Swedish automatic balancing mechanism was an extremely attractive
idea. In the end, however, the conclusion was that it was not applicable to the Japanese case for
two reasons: First, the EPI scheme provides not only old-age benefits but also disability and
survivors’ benefits. Furthermore, it transfers the designated amount of money to the basic pension
account that provides flat-rate basic pensions. This makes it very difficult to define the turnover
duration.
20 See Ole Settergren, Bogslaw D. Mikula (2001)
(present value of benefits
corresponding to
the past period)

28
The Swedish mechanism heavily depends on the fact that the present value of the benefits
earned up to now is equal to the yearly income of contributions multiplied by the turnover duration
under the NDC benefit design. This formula holds because the benefit design is the NDC in the
Swedish case. Under the Japanese benefit design, this formula does not hold. We are not sure that
it is in any way impossible to define, but could not work out the definition suitable to the rather
complicated benefit design in Japan. The other is that, even if we could work out the definition of
turnover duration, it would be too optimistic in our case to compare (i) with (ii). Comparing with
the Swedish case, the Japanese population is projected to age more rapidly, and it would be too
optimistic to consider the yearly contribution income multiplied by the turnover duration to be the
future income adequate to pay the benefits corresponding to the past period. Sometimes it would
be even misleading. We would not be able to anticipate future income during the turnover duration
because the active population will be decreasing more than in the case of Sweden.
Although it was decided not to apply the Swedish instrument, it did provide some ideas.
Especially, it suggested fixing the contribution rate first and automatically adjusting the benefit level
to keep financial equilibrium under the fixed contribution rate. The traditional way of thinking has
been that the benefit level should first be fixed and then the contribution rate can be calculated.
This necessitates changes of benefit design every time socio-economic conditions worsen. The
Swedish idea would eliminate the anxiety that the contribution rate would go up to an unsustainable
level and help avoid repeated reforms.
Thus we started to seek for an automatic balancing mechanism suitable to our case.
2-6. Fixed contribution schedule and modification of indexation (2002 Consultation)
Social security pension schemes provide benefits whose amount approximately keeps up
with per-capita salary increase or price increase in order to attain income security objectives. They,
therefore, depend on intergenerational income transfer that is almost equivalent to the pay-as-you-go
(PAYGO) financing method. The PAYGO financing method goes well when the ratio of the
number of the beneficiaries to that of the active participants is rather stable, but it bumps against a
problem when the ratio rises because the contribution rate goes up accordingly in such a case.
Until the last reform, on preparing the proposals, the assumption was that a set of changes
in the scheme design including benefit provisions would be made and then the ultimate contribution
rate would be calculated on the basis of the assumed changes to confirm if the changes would render

29
the ultimate contribution rate at a sustainable level. If they would not, the process continued until a
set of changes that seemed feasible and would cause the ultimate contribution rate to be at a
sustainable level was found. This was the process that led to the reform proposals. As stated in
the chapter 2-2., however, it was determined that it would be impossible to repeat the typical process
this time.
In this round, the contribution schedule was fixed initially because it was one of the most
important prerequisites for the reform to alleviate the anxiety that the contribution rate would go up
to an unsustainable level.
The next step was to find a mechanism that automatically restores financial balance of the
schemes when further ageing occurs. Attention was paid to the fact that the contribution rate level
can be maintained if the amount of benefits is indexed not to the increase of per-capita salary but to
the increase of the total of the salary bill as long as the life expectancy at age 65 remains the same
and the number of the newly awarded is constant. The total amount of the wage bill may, as it were,
being the sustaining power of the scheme. Furthermore, the growth of the wage bill is equal to the
increase rate of the per-capita salary minus the rate of decline of active contributors. Thus it became
clear that, if the benefits of the newly awarded person were indexed to the growth rate of the
per-capita salary minus the rate of decline in the number of active contributors or of the beneficiaries
aged 65 and over to the increase rate of the CPI minus the decrease rate of the active participants, we
will be able to restore the financial equilibrium in the end because the number of beneficiaries will
finally start to decrease by the same pace as the active participants. It is a method that modifies the
indexation until the financial equilibrium is attained. We made simulations for various cases and
proposed the modified indexation in the consultation document published on 5 December 2002.
The modified indexation incrementally reduces the level of benefits as expressed in terms
of a replacement rate. By replacement rate, we mean the ratio of the benefit amount that the
household of the following conditions receives, at age 65, as a couple to the average disposable
income of the active participants at the time:
- The husband has been covered by the EPI scheme for 40 years with the salary always equal
to the average salary of the active participants.
- The wife, whose age is the same as her husband’s, has always been a dependent,
non-working housewife.
The current replacement ratio is about 59%. The modified indexation will reduce it slowly until the
financial equilibrium is attained.
30
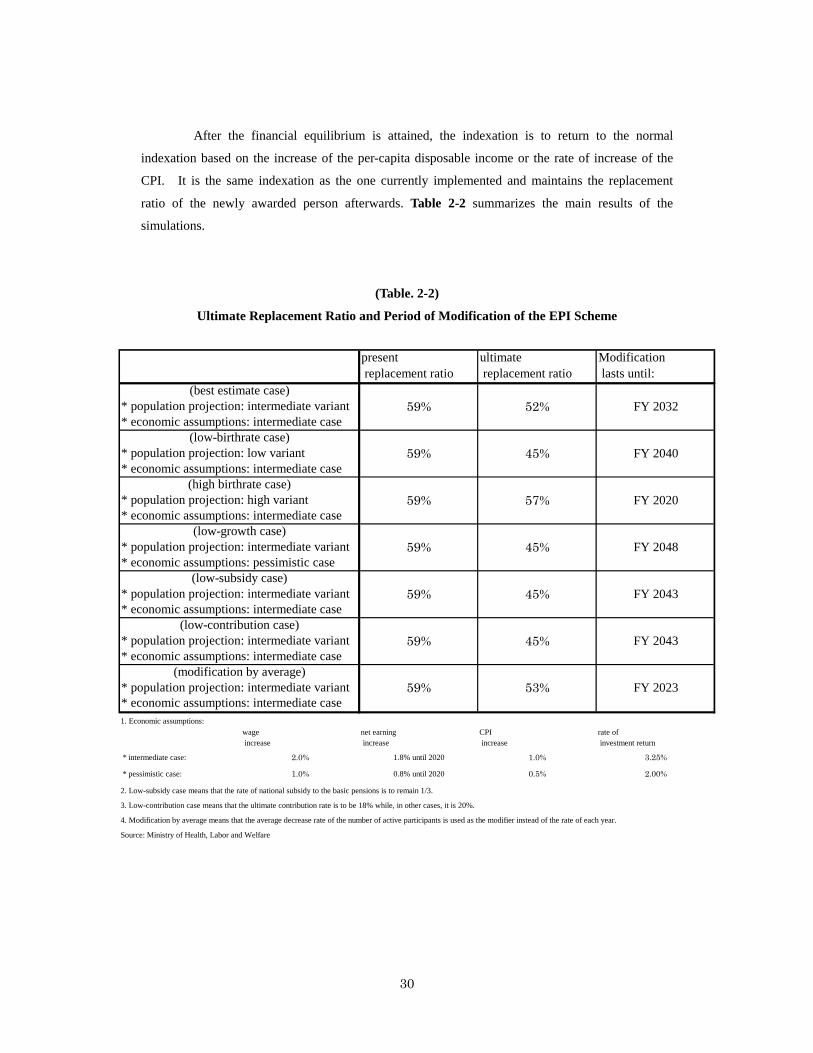
After the financial equilibrium is attained, the indexation is to return to the normal
indexation based on the increase of the per-capita disposable income or the rate of increase of the
CPI. It is the same indexation as the one currently implemented and maintains the replacement
ratio of the newly awarded person afterwards. Table 2-2 summarizes the main results of the
simulations.
(Table. 2-2)
Ultimate Replacement Ratio and Period of Modification of the EPI Scheme
1. Economic assumptions:wage increase
net earning increase
CPI increase
rate of investment return
* intermediate case: 2.0% 1.8% until 2020 1.0% 3.25%
* pessimistic case: 1.0% 0.8% until 2020 0.5% 2.00%
2. Low-subsidy case means that the rate of national subsidy to the basic pensions is to remain 1/3.
3. Low-contribution case means that the ultimate contribution rate is to be 18% while, in other cases, it is 20%.
Source: Ministry of Health, Labor and Welfare
4. Modification by average means that the average decrease rate of the number of active participants is used as the modifier instead of the rate of each year.
* population projection: high variant* economic assumptions: intermediate case
* population projection: intermediate variant
* population projection: intermediate variant
(low-subsidy case)
(low-contribution case)
(modification by average)* economic assumptions: intermediate case
* population projection: intermediate variant
(high birthrate case)
(low-growth case)
* population projection: intermediate variant* economic assumptions: intermediate case
* population projection: low variant* economic assumptions: intermediate case
* economic assumptions: intermediate case
59%
59%
59%
59%
* economic assumptions: pessimistic case
* population projection: intermediate variant* economic assumptions: intermediate case
(best estimate case)
(low-birthrate case)
52% FY 2032
59% 45% FY 2040
FY 2043
57% FY 2020
59% 45% FY 2048
53% FY 2023
present replacement ratio
ultimate replacement ratio
Modification lasts until:
45% FY 2043
59% 45%
31
The contribution schedule was fixed in such a way as to increase the rate by 0.354%21
every year from the current rate of 13.58% to 20% in 2022. It was also assumed that the rate of the
national subsidy to the basic pensions would be raised from 1/3 to 1/2 in 2004. In the best estimate
case, it was projected that it would take 27 years until the financial equilibrium is attained in 2032
and that the ultimate replacement ratio would be about 52%. This means that the modified
indexation would lower the benefit level by 12%.
In the case where the national subsidy rate could not be raised and would remain at the
current level of 1/3 all the time, it was projected that the modified indexation would last until 2043
and that the replacement ratio would go down to 45%.
If the contribution schedule was changed and the ultimate contribution rate was set at 18%
instead of 20%, it was projected that the modified indexation would last until 2043 and that the
replacement rate would fall to 45% just as in the case without the increase in the national subsidy.
In the case where the population projection was based on the pessimistic variant, the modified
indexation was projected to last until 2040 and the ultimate replacement ratio was projected to be
45%. In the case where the economic assumptions were worse than the best estimate, the modified
indexation was projected to last until 2048 and the ultimate replacement rate to be 45%.
2-7. National subsidy
(1) Discussion on the national subsidy rate
Raising the rate of the national subsidy to the basic pension benefits from the current 1/3 to
1/2 costs around JPY 2.5 trillion22 a year at present in addition to the cost of 1/3 subsidy. In the
future it will cost more. It has been a highly political issue and long been discussed. In the 2000
reform, it was stipulated in the law that the national subsidy rate should be raised to 1/2 by the year
2004 by securing the financial resources. The Japanese economy was, however, still stagnant in
2003, and the Prime Minister declared that the government would not raise the rate of consumption
tax as long as he remains in the post. The government parties discussed the issue very hard and, at
the end of the year of 2003, they decided to raise the rate gradually to 1/2 by the year of 2009 in
three steps.
21 On the 1999 actuarial valuation, it was proposed to raise the contribution rate by 1.77% every five years until it reaches the ultimate contribution rate. 0.354% is the one fifth of the step. 22 1 trillion = 1,000,000,000,000
32
The first step is to raise the rate in FY 2004. It designates the increase amount of the
FY2004 subsidy for each scheme. It is JPY 20.6 billion for the EPI scheme and JPY 5.8 billion for
the NP scheme in addition to the cost of 1/3 subsidy. It is determined to be the amount
corresponding to 11/1000 of the designated amount of money assigned to each scheme to be
transferred to the basic pension accounts, taking account of the effective date of the new law (1
October 2004). The financial resources for this increase are the reduction of the tax-deductible
amount of pension benefits for those with high income. For FY 2005 and 2006, the rate is likewise
to be 1/3+11/1000.
The second step is to raise the subsidy rate from 1/3+11/1000 to the rate as near as possible
to 1/2 by amending the taxation in two or three years’ time. In this case, the reduction of the
provisional tax relief treatment23 is the candidate for the new financial resources. In fact, the
government has submitted a bill to halve the relief rate from 1 January 2006.
The third step is to raise the subsidy rate to 1/2 in FY 2009. In this case, the raising of the
consumption tax rate is the most likely candidate for the new financial resources.
Although raising the national subsidy rate still requires further changes in taxation, the
distinct difference from the previous 2000 reform is that it concretely states the schedule of the
increase. The government parties published, in December 2003, the document that refers to the
planned amendment of taxation as well.
We have just digressed from the modified indexation, but the national subsidy rate affects
the results so much that we cannot avoid referring to it. Now we go back to the issue of modified
indexation.
(2) National subsidy and financial equilibrium
As we have seen above, the path to increasing the national subsidy rate to 1/2 from the
current 1/3 has been paved to a considerable extent. It would imply that the contribution level
would be sustainable. In fact, as we will see later, the contribution rates for the EPI scheme and the
NP scheme have been fixed within a sustainable level by the 2004 reform. It should, however, be
noted that this sustainability of the social security pension schemes assumes that the raising of the
national subsidy rate is also sustainable in the context of the national economy.
23 From FY1999, the income tax is provisionally reduced by 20% (JPY 250,000 at maximum) to boost consumption and vitalize the economy.

33
The financial resources for the raising of the national subsidy rate might be obtained by
raising the tax rate, by reducing the expenditure of other policy items, or by both combined. Whether
this means is practical or not heavily depends upon the national economy itself. Thus it should be
borne in mind that the financial equilibrium discussed in this paper is solely concerned with that of
the social security pension schemes and it does not necessarily imply that intergenerational income
transfer is optimal at the level of the national economy.
Having been directly involved in the process, the author must admit that there were very
few discussions on the impacts of the reform on the national economy as a whole24, including that of
the raising of the national subsidy rate. The reform should have had more inputs from such
viewpoints, though the theme might be too difficult to analyse scientifically.
2-8. Refining upon modified indexation
After the publication of the consultation document in December 2002, many people
expressed their views on the modified indexation. Most of them were affirmative on its
introduction, but stressed needs for improvement. Their comments were provided at the committee
meetings of the Pension Subcommittee of the Social Security Council25, in direct conversation with
the Director-General of the Pension Bureau, or in other ways. Summing up, the following two
opinions for improving the modified indexation were forwarded:
- In order to minimize the difference of benefits and contributions among generations, the
modifying should be accelerated as much as possible. The modification should also take
account of the improvement of life expectancy at age 65 because it increases the cost unless
adjusted. It helps hasten the modifying as well.
- The projected size of the accumulated reserve fund is too large. It should be reduced. The
government should not control such a huge amount of money because the government is apt
to make poor use of the funds.
Taking account of these opinions, the method for modifying indexation was changed.
(1) Finalized modified indexation
As we have seen, the 2002 consultation document proposed to modify the indexation by
24 For example, the impact on savings of the reform was hardly discussed during the reform process. 25 It is an advisory organ to the Minister of Health, Labour and Welfare.

34
deducting the rate of decline of the number of covered employees from the growth rate of per-capita
disposable income of the active covered employees until financial equilibrium is attained. It was,
however, pointed out that the number of employees will decrease more slowly than the number of
the labour force because there is still the tendency that the portion of employees in the labour force is
increasing. In other words, the adjustment process was slower than the case where the rate of
decline of the labour force was used for the calculation. The slower the adjustment, the lower the
benefit level of future pensioners will be. Furthermore, if the proposed modified indexation were
to be applied to the basic pensions, it would mean that it would be applied to a group of people who
were not employees. The usage of the number of employees would become baseless. It, therefore,
became clear that using the number of employees was a bit awkward.
Instead, it was determined that the adjustment factor would be as follows:
modifier = (the decrease rate of the number of the active participants covered by all of the
schemes26) + ( the increase rate of the life expectancy at age 65)
The modified index is obtained by subtracting the adjustment factor from the normal index based on
either the increase rate of per-capita disposable income for beneficiaries aged below 65 or the CPI
increase rate for beneficiaries aged 65 and over.
Table 2-3 shows the projected rate of decline of the number of active participants covered
by all of the schemes. The average projected decrease rate is about 0.6% for the period 2005-2025.
(Table. 2-3)
26 In this case, MAAs are included as well.
P rojected D ecrease R ate of the N um ber of A ctive P articipantsof A ll the Social Security P ension Schem es
Year A ctive participants (in m illion) D ecrease rate (%)2005 70.0 -0.42006 69.9 -0.32007 69.4 -0.22008 68.7 -0.22009 68.0 -0.52010 67.3 -0.82015 64.9 -0.82020 63.3 -0.52025 61.8 -0.52030 59.3 -0.82040 52.0 -1.32050 46.2 -1.1

35
The second term of the modifier has been added because many people insisted that the
increase of life expectancy at age 65 should be taken account of because the longer the life
expectancy is, the larger the total amount received will be if the amount remains unmodified. In the
law, it is fixed at 0.3% based on the average of the projected annual increase rate of life expectancy
at age 65 during the period 2000-2025 of the 2002 population projection. It is fixed in order to
avoid fluctuations due to epidemics, etc. Awareness of the necessity to speed up the modification
for the purpose of minimizing the intergenerational difference was also a motivation.
Whether the growth rate of the number of the newly awarded pensions should be taken
into account or not was not discussed. If it had been included, our modifier would have perfectly
coincided with the German case as will be explained in 2-12. As we have seen in 2-6. the approach
may well have considered the element of the number of the newly awarded, but somehow it was
neglected. Perhaps many people may have thought that it was obvious that if this had been
included the adjustment would have been very large, perhaps too large to be realistic given that the
baby boomers will soon retire.
We should here note that, even under the modified indexation, the nominal amount is
guaranteed. In other words, if the modifier is larger than the increase rate of per-capita disposable
income or of the CPI, then the modified index is considered to be zero. Moreover, if the increase
rate of per-capita disposable income or the CPI itself is negative in a particular year, then the
adjustment factor is not applied.
(2) Period of financial equilibrium
The other opinion was that the projected size of the accumulated reserve fund was too
large; it was several times as large as the annual expenditure. They said that the government should
not have such a huge fund because it was apt to misuse it through poor investment or through
political pressure.
We examined the reason why such a size of fund would accumulate and found that it was
attributable to the fact that, under the contribution schedule, the ultimate contribution rate was to be
reached long before the ratio of the number of beneficiaries to the number of active participants
became stable. The ultimate contribution rate was smaller than the future PAYGO rate because it
was fixed at an early stage of the ageing process of the scheme. To compensate the gap between
the ultimate contribution rate and the PAYGO rate in the future, the investment return was called
upon and the requirement for financial equilibrium gave birth to the accumulation of the reserve

36
fund under the fixed contribution schedule.
Furthermore, the reason why the PAYGO rate in the future was larger than the ultimate
contribution rate was that a more aged demography of the scheme was assumed in the far distant
future than the demography at around 2020 when the ultimate contribution rate was reached. The
2002 population projection of the NIPSSR extends to 2100, but, since it was taken for granted that
the financial equilibrium should be considered in perpetuity, we had to make assumptions for the
years after 2100. So it was assumed that the demography of the scheme in 2090’s would be repeated
after the year of 2100. The old-age dependency ratio27 of the 2002 population projection shows
that 2090 is more aged than 2020. So the assumption had the effect of placing more emphasis on
the aged stage of our country.
The method was reconsidered with the perspective that the government wanted to consider
the whole future period for the financial management of the schemes. It also had the merit that the
financial management would be stable if everything went in line with the assumptions. The
criticism that the government was apt to make bad use of the reserve fund was rather journalistically
exaggerated. If all or most of the reserve fund was used, it would simply lower the ultimate level
of benefits or augment the ultimate contribution rate.
At the same time, it was a reasonable criticism that the assumption that the demography of
the scheme in 2090’s would be repeated after 2100 was very rough and baseless. It was also
reasonable to add that it might mislead the judgment of the financial status when too much emphasis
was put on the period after 2100. The solution would be a method that reconciled the good points
of the current method with the criticisms, and, at this time, the US example provided hints.
Every year in the United States the Board of Trustees of the OASI Trust Fund and the DI
Trust Fund publishes its annual report and provides the basic information on the OASDI’s financial
status. Its financial projections cover the next 75 years, but not the longer period. To evaluate the
financial adequacy of the OASDI schedule, it essentially compares the adjusted summarized cost
rate and the adjusted summarized income rate for the next 75 years28. Here, the adjusted
summarized cost rate means the ratio of the present value of the cost of the schedule for the next 75
years plus the present value of the one-year cost of the last year of the 75-year period to the present
value of the taxable payroll for the next 75 years. The adjusted summarized income rate means the
27 It is the ratio of the population aged 65 and over to the population aged between 15 and 64. 28 Strictly speaking, it calculates several other measurements to test the long-range financial adequacy of the schedule.

37
ratio of the present value of the scheduled tax income (payroll tax revenue plus taxation of benefits)
for the next 75 years plus the amount of assets on hand at the beginning of the 75-year period to the
present value of the taxable payroll for the next 75 years. If the adjusted summarized cost rate is
larger than the adjusted summarized income rate (which is the usual case), the difference represents
the rate by which the current contribution rate should be raised to attain financial equilibrium for the
next 75 years.
Most relevant was the fact that the Board of Trustees, in principle, looks into the financial
status of the OASDI schedule not in perpetuity but for the period of the next 75 years. It was also
noted that the target trust fund level of one year’s cost at the end of the projection period. Applying
this method in the Japanese case was one way to defuse criticisms that the assumptions after 2100
were baseless and that the accumulated reserve fund would be too large.
Furthermore, as the length of period of financial equilibrium considered would be fixed,
this method would gradually take any year in the future into account, so the government’s sense of
responsibility that all the years in the future should be taken into account for the financial
management would be more or less maintained.
The only shortcoming of this method would be that the difference between the adjusted
summarized cost and the adjusted summarized income could be different, or, under the modified
indexation, the ultimate benefit level could be different on the next valuation even if the
socio-economic conditions remained the same. This is because the years left out of the period can
be of a nature different from the years coming into the period. The fluctuation can, however, be
smaller if we take into account a long enough period.
In the wake of these considerations, it was determined that a finite period of financial
equilibrium with target fund at the end of the period being one year’s cost would be adopted. The
period was to be 95 years, which is the length of time during which almost all of the people already
born at the beginning of the period will cease to receive benefits, and the current government can be
said to have taken financial responsibility to take account of these people if the financial equilibrium
is confirmed for the period.
Fig. 2-3 summarizes the discussion. When financial projections are reviewed every five
years, the 95-year period is analyzed to assess financial equilibrium. This period should not be
shorter.

38
(Fig. 2-3)
Period of Financial Equilibrium
2-9. Finalized contribution schedule
When the MHLW published its proposals for reform in November 2003, the ultimate rate
of the contribution schedule was set at 20%. It was projected that the ultimate benefit level expressed
as the replacement ratio under the contribution schedule with the 95-year period of financial
equilibrium would be 54.7% in the best estimate case.
The government parties, however, under pressure by employers, started to argue about the
ultimate contribution rate. The employers insisted that such a high rate as 20% would undermine
Japan’s economy and be, in the end, harmful to the nation’s life. After a long series of debates, the
government parties finally decided to set it at 18.3% in February 2004. It was the rate by which the
benefit level was narrowly kept above 50%. The contribution schedule came into the bill and has
become the law. So the finalized contribution schedule of the EPI scheme is (see Fig. 2-4):
- First, the current rate of 13.58% is to be raised to 13.934% in October 2004.
- Then it is to be raised by 0.354% in September every year.
- In September 2017 it is raised to the ultimate rate of 18.3% and the contribution rate is fixed
at 18.3% afterwards.
It should be noted here that the government parties have considered the contribution
schedule to be within a sustainable level, but, as we have seen in 2-7, it is only within the context of
the social security pension schemes. It also depends on the sustainability of the tax reform or the
reduction of the government spending on some policy items that is to become necessary to realize
the raising of the national subsidy rate. The impact on the national economy of the latter measure
have scarcely been discussed during the reform process.
2004Actuarial valuation
2009Actuarial valuation
2014Actuarial valuation
2019Actuarial valuation
Fiscal year2010 2015 2020
Period of financial equilibrium(B enefits and contributions are to be balanced for the years FY 2005 - FY 2100)
2115
Period of financial equilibrium(B enefits and contributions are to be balanced for the years FY 2010 - FY 2105)
Period of financial equilibrium(B enefits and contributions are to be balanced for the years FY 2015 - FY 2110)
Period of financial equilibrium(B enefits and contributions are to be balanced for the years FY 2020 - FY 2115)
2100 2105 21102005

39
(Fig. 2-4)
2-10. Simulations
Now that the contribution schedule has been fixed, modifying method of indexation has
been decided, and the period of financial equilibrium has been defined, we can make projections for
several cases. Table 2-4 summarizes the result of these simulations.
In the best estimate case, the ultimate benefit level is projected to be 50.2%. It is to be
reached in 2023. In other words, if the benefit level is lowered to 50.2% through the modified
indexation until 2023, the EPI scheme will be financially balanced for years until 2100 if the normal
indexation is restarted as of 2024.
In the case where the economic conditions are better and the decline of the ultimate cohort
TFR is milder to be 1.52, the ultimate benefit level is projected to be 52.4% and the period of
modified indexation to end in 2019.
In the case where the economic conditions are worse and the ultimate cohort TFR drops to
as low as 1.10, the modified indexation is projected to last until 2033 and the ultimate benefit level
will fall to 45.3%.
Contribution Rate of Employees' Pension Insurance
12.0%
14.0%
16.0%
18.0%
20.0%
2000 2005 2010 2015 2020 2025Fiscal year
(2017)(2004.10)
13.58%
18.3%
Raised by 0.354% every year

40
(Table. 2-4)
Ultimate Replacement Ratio and Period of Modification of the EPI Scheme
We have also made financial projections of the EPI scheme29 and the NP scheme for the
best estimate case. Table 2-5 and Table 2-6 show them, respectively. According to these results,
the EPI scheme is projected to be in deficits for the first several years and then turn into surplus until
around 2050. After that it is projected to be in deficit again, using the reserve fund to compensate for
the deficits, and at the end of the period of financial equilibrium, the size of the reserve fund is
almost equal to the size of the annual expenditure. The same tendency can be found in the
projection for the NP scheme though the size of the reserve fund is much smaller than that of the EPI
scheme.
29 It includes the portion of the old-age benefits substituted by the Employees’ Pension Funds. So the amount of the reserve fund is greater than the amount managed by the Pension Sub-account of the Social Insurance Special Account.
1. Economic assumptions:wage increase
net earning increase
CPI increase
rate of investment return
* intermediate case: 2.1% 19% until 2017 1.0% 3.2% * pessimistic case: 1.8% 1.6% until 2017 1.0% 3.1% * optimistic case: 2.5% 2.3% until 2017 1.0% 3.3%
that is situated halfway between the high variant and the intermediate variant. It just corresponds to the case where the average number of children married couples would give birth to is assumed to be the same as before.Source: Ministry of Health, Labor and Welfare
* population projection: 1.52 variant* economic assumptions: optimistic case
50.2%
FY 2033
(best estimate case)
2. The 1.52 variant means the population projection with the ultimate cohort TFR being 1.52
* population projection: intermediate variant* economic assumptions: intermediate case
* population projection: low variant(low-birthrate & low-growth case)
(high-birthrate & optimistic-growth case)* economic assumptions: pessimistic case
52.4% FY 2019
present replacement ratio
ultimate replacement ratio
Modification lasts until:
59.3% 45.3%
59.3%
59.3%
FY 2023
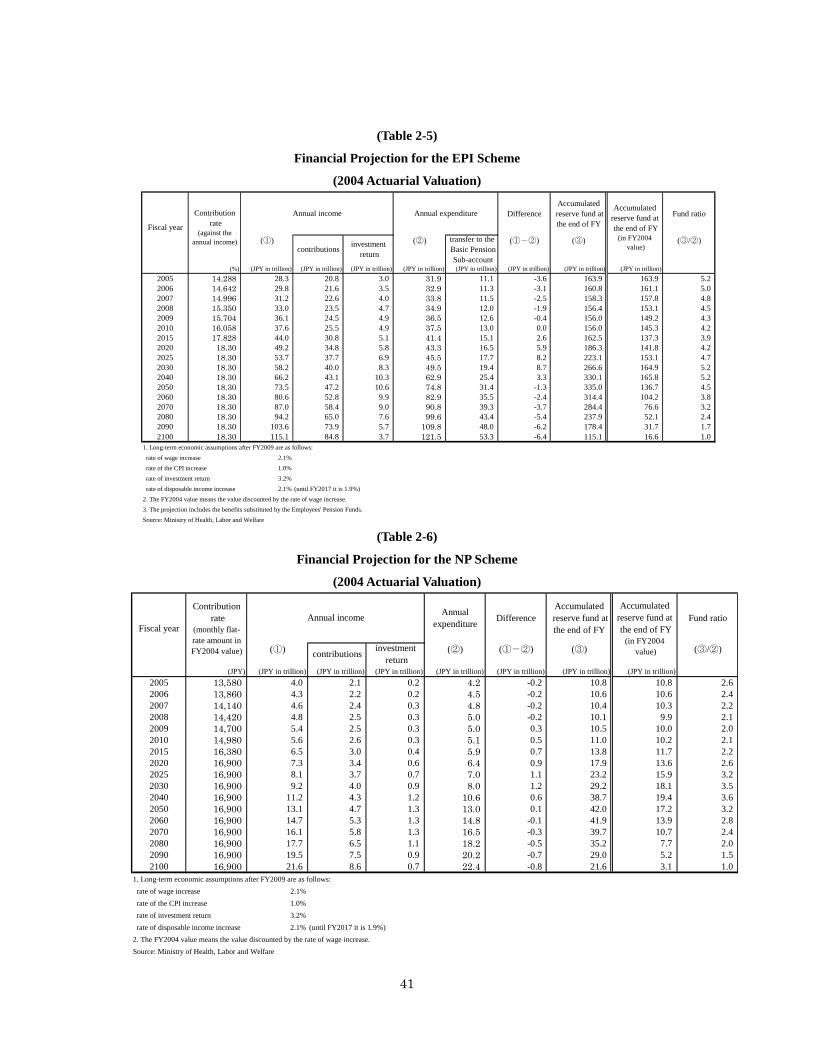
41
(Table 2-5)
Financial Projection for the EPI Scheme
(2004 Actuarial Valuation)
(Table 2-6)
Financial Projection for the NP Scheme
(2004 Actuarial Valuation)
DifferenceAccumulated
reserve fund atthe end of FY
Fund ratio
(①)contributions investment
return
(②) transfer to the Basic Pension
Sub-account
(①-②) (③) (③/②)
(%) (JPY in trillion) (JPY in trillion) (JPY in trillion) (JPY in trillion) (JPY in trillion) (JPY in trillion) (JPY in trillion) (JPY in trillion)2005 14.288 28.3 20.8 3.0 31.9 11.1 -3.6 163.9 163.9 5.22006 14.642 29.8 21.6 3.5 32.9 11.3 -3.1 160.8 161.1 5.02007 14.996 31.2 22.6 4.0 33.8 11.5 -2.5 158.3 157.8 4.82008 15.350 33.0 23.5 4.7 34.9 12.0 -1.9 156.4 153.1 4.52009 15.704 36.1 24.5 4.9 36.5 12.6 -0.4 156.0 149.2 4.32010 16.058 37.6 25.5 4.9 37.5 13.0 0.0 156.0 145.3 4.22015 17.828 44.0 30.8 5.1 41.4 15.1 2.6 162.5 137.3 3.92020 18.30 49.2 34.8 5.8 43.3 16.5 5.9 186.3 141.8 4.22025 18.30 53.7 37.7 6.9 45.5 17.7 8.2 223.1 153.1 4.72030 18.30 58.2 40.0 8.3 49.5 19.4 8.7 266.6 164.9 5.22040 18.30 66.2 43.1 10.3 62.9 25.4 3.3 330.1 165.8 5.22050 18.30 73.5 47.2 10.6 74.8 31.4 -1.3 335.0 136.7 4.52060 18.30 80.6 52.8 9.9 82.9 35.5 -2.4 314.4 104.2 3.82070 18.30 87.0 58.4 9.0 90.8 39.3 -3.7 284.4 76.6 3.22080 18.30 94.2 65.0 7.6 99.6 43.4 -5.4 237.9 52.1 2.42090 18.30 103.6 73.9 5.7 109.8 48.0 -6.2 178.4 31.7 1.72100 18.30 115.1 84.8 3.7 121.5 53.3 -6.4 115.1 16.6 1.0
1. Long-term economic assumptions after FY2009 are as follows: rate of wage increase 2.1% rate of the CPI increase 1.0% rate of investment return 3.2% rate of disposable income increase 2.1% (until FY2017 it is 1.9%)2. The FY2004 value means the value discounted by the rate of wage increase.3. The projection includes the benefits substituted by the Employees' Pension Funds.Source: Ministry of Health, Labor and Welfare
Accumulatedreserve fund at the end of FY
(in FY2004 value)
Contribution rate
(against theannual income)
Annual expenditure
Fiscal year
Annual income
Annualexpenditure Difference
Accumulated reserve fund atthe end of FY
Fund ratio
(①) contributions investmentreturn
(②) (①-②) (③) (③/②)
(JPY) (JPY in trillion) (JPY in trillion) (JPY in trillion) (JPY in trillion) (JPY in trillion) (JPY in trillion) (JPY in trillion)2005 13,580 4.0 2.1 0.2 4.2 -0.2 10.8 10.8 2.62006 13,860 4.3 2.2 0.2 4.5 -0.2 10.6 10.6 2.42007 14,140 4.6 2.4 0.3 4.8 -0.2 10.4 10.3 2.22008 14,420 4.8 2.5 0.3 5.0 -0.2 10.1 9.9 2.12009 14,700 5.4 2.5 0.3 5.0 0.3 10.5 10.0 2.02010 14,980 5.6 2.6 0.3 5.1 0.5 11.0 10.2 2.12015 16,380 6.5 3.0 0.4 5.9 0.7 13.8 11.7 2.22020 16,900 7.3 3.4 0.6 6.4 0.9 17.9 13.6 2.62025 16,900 8.1 3.7 0.7 7.0 1.1 23.2 15.9 3.22030 16,900 9.2 4.0 0.9 8.0 1.2 29.2 18.1 3.52040 16,900 11.2 4.3 1.2 10.6 0.6 38.7 19.4 3.62050 16,900 13.1 4.7 1.3 13.0 0.1 42.0 17.2 3.22060 16,900 14.7 5.3 1.3 14.8 -0.1 41.9 13.9 2.82070 16,900 16.1 5.8 1.3 16.5 -0.3 39.7 10.7 2.42080 16,900 17.7 6.5 1.1 18.2 -0.5 35.2 7.7 2.02090 16,900 19.5 7.5 0.9 20.2 -0.7 29.0 5.2 1.52100 16,900 21.6 8.6 0.7 22.4 -0.8 21.6 3.1 1.0
1. Long-term economic assumptions after FY2009 are as follows: rate of wage increase 2.1% rate of the CPI increase 1.0% rate of investment return 3.2% rate of disposable income increase 2.1% (until FY2017 it is 1.9%)2. The FY2004 value means the value discounted by the rate of wage increase.Source: Ministry of Health, Labor and Welfare
Accumulatedreserve fund at the end of FY
(in FY2004 value)
Contribution rate
(monthly flat-rate amount inFY2004 value)
Fiscal yearAnnual income

42
2-11. The minimum benefit level
As the modified indexation gave the impression that it would continually lower the benefit
level until the financial equilibrium was attained, the MHLW proposals in November 2003 included
the provision that the government should review the scheme urgently if the benefit level of the newly
awarded people threatened to drop below 50% by the next actuarial valuation30. This sort of
minimum benefit level should be added to the compulsory income security schedule. Otherwise
the scheme itself would lose its reason for existence. This was supported and has become a
provision in the law.
Since the actual effect of the decline of birth rate on the labour force starts in about 20
years’ time, a scenario in which the benefit level of the newly awarded pensions falls below 50% in a
few years’ time is not likely to happen for the next 10 to 15 years as long as unusual things like death
of a considerable portion of the labour force does not take place over several years. This means
that there is time to work out comprehensive measures to remove the causes of the low birth rate.
The rate of 50% itself has been set by taking account of the ratio of the average
consumption of the households of aged couples to the average amount of disposable income of the
active labour force. It may change as the socio-economic environment changes. We have to
continue to watch the environment carefully and to review the rate.
2-12. 2004 German Reform
In Germany the pension reform bill passed the Parliament in March 2004. It aims to
make the social security pension schemes sustainable by limiting the indexation of the benefit. The
method to realize it is surprisingly similar to our modified indexation. So it can be said that
Germany and Japan were simultaneously discussing the same sort of reform by chance. In the
following, we would like to compare the German method with our modified indexation.
The German indexation basis has been the average disposable income of the active
workers. The new law has added a factor called the sustainability factor to contain the normal
indexation. A beneficiary’s benefit amount for a year is obtained by multiplying the amount for the
30 The government parties’ discussion on the level of the ultimate contribution rate was also conscious of this proposal though the meaning of 50% was different from the minimum benefit level provision.

43
last year by the disposable-income-based indexation and by the sustainability factor31.
The sustainability factor is defined as follows:
(sustainability factor) = (1 – ID)α + 1
where ID = the ratio of the dependency ratio a year ago to the dependency ratio 2 years ago,
and (dependency ratio) = (the number of pensioners32) / (the number of contributors plus the
number of the unemployed33)
and α is a positive number not greater than 1 and is to play an adjusting role to what extent
the ageing degree is reflected in the modification of the indexation.
If we denote by b the growth rate of the number of pensioners from 2 years ago to a year ago and by
c the rate of decline of the total of the number of contributors and the number of the unemployed,
then we can rewrite the sustainability factor as follows:
(sustainability factor) = (1 – ID)α + 1
={1 –(1 + b)/(1-c)}α + 1
≒{1 – (1 + b + c)}α + 1
= 1- α(b + c)
If α = 1, then the sustainability factor is 1 – (b + c). When many years have already
passed since the social security pension schemes were introduced and the only factor that increases
the number of beneficiaries is the improvement of mortality, b represents the increase of life
expectancy at the pensionable age. The c is, roughly speaking, the decrease rate of the labour force.
It can, therefore, be said that b + c is almost equivalent to the modifier of the 2004 Japanese reform.
What an interesting coincidence! The modified indexation is not an innovation peculiar to Japan
but rather applicable throughout the world. As has been seen in 2-8 (1), if our case had taken
account of the increase rate of the number of newly awarded pensioners, our modified indexation
would have completely been identical with the German sustainability factor.
The 2004 German reform has another factor of α that can adjust the degree to which the
increase of life expectancy and the decrease of labour force are reflected in the modification of
indexation. The 2004 German reform law has set α = 1/4. With this sustainability factor it is
31 The amount of social security pensions in Germany is calculated by multiplying the unit amount by the points earned. So, actually, the sustainability factor is applied to the unit amount last year to obtain the unit amount this year. 32 It is adjusted for beneficiaries with low benefit. The number of contributors is also adjusted for low earners. 33 The reason why the number of the unemployed has been added is that it is to exclude cyclical effects on the dependency ratio.

44
projected that the contribution rate is a little bit lower than 23% in 2030.
The 2001 German reform law stipulates that the contribution rate must be below 20% until
2020 and be below 22% until 2030 while the net replacement rate must stay above 67% with the
Riester DC pension added. The 2004 reform has not attained this target. In the 2003 reform
proposals by the Rűrup Commission, there was a proposal to raise the pensionable age from 65 to 67,
but it has not been realized in the 2004 reform law. The German reform is still in progress as is true
in most countries.
2-13. The 2004 reform and the national economy
According to the projections issued by the MHLW in May 2004, the 2004 reform is likely
to have a significant effect in containing the social security expenditure in the national economy.
Table 2-7 shows how the cost of each social security branch will evolve during the next 20 years,
(Table 2-7)
Prospect of Cost of Social Security
(Table 2-8)
Cost of Social Security as Percentage of National Income (NI)
and Table 2-8 shows the share of these cost in the National Income (NI). From these we can see that
the cost of social security pensions remains constant as the share in the NI while those of medical
expenditure and social assistance grow fast. This may be considered to be the cost containing
effect of the 2004 reform of the social security pension schemes. After this, the MHLW reviewed
FY 2004 FY 2010 FY 2015 FY 2025(JPY trillion) (JPY trillion) (JPY trillion) (JPY trillion)
Pensions 46 53 58 64Medical Expenditure 26 34 41 59
Social Assistance, etc. 14 18 21 30(Long-term Care) <5> <9> <12> <19>
Total 86 105 121 152* 1 trillion = 1,000,000,000,000* The amount of benefits of long-term care is contained in that of social assistance.
FY 2004 FY 2010 FY 2015 FY 2025(%) (%) (%) (%)
Pensions 12 1/2 13 13 12Medical Expenditure 7 8 9 11
Social Assistance, etc. 3 1/2 4 1/2 5 6(Long-term Care) <1 1/2> <2> <2 1/2> <3 1/2>
Total 23 1/2 25 1/2 26 1/2 29* The % of long-term care is contained in the % of social assistance.

45
the long-term care schedule in 2005 and is planning to reform the medical insurance system in 2006.
When it is accomplished, it will publish the overall effects of these reforms.
2-14. Intergenerational equity discussion
It is often argued that the older generations paid contributions at lower rates as active
participants and are receiving adequate benefits while future generations will pay contributions at
higher rates and receive the benefits same as or even lower than the older generations’. In fact, the
MHLW shows the result of such calculations in the actuarial report34. According to it, the cohort
born in 1935 receives benefits 8.3 times as large as what they paid during their active period while
the cohort born in 2005 will receive benefits 2.3 times as large as they will pay as active participants.
Can we, however, say that it is inequitable? The author does not think it is inequitable.
The older generations certainly paid contributions at lower rates, but they generally had to support
their parents because their parents belonged to the cohorts that had not been covered by the social
security pension schemes. They had to put aside a portion of what they earned and gave it to their
parents. Furthermore, can we say that the burden they bore was definitely lighter than ours or that of
the future generation because of the lower rates of contributions? At least their disposable income
was much less than ours in its purchasing power.
Furthermore, why is the discussion limited to the transfer through social security pension
schemes? There are many other transfers in the same direction or in the opposite direction. For
example, there are rearing expense, education expense, bequests, socio-economic infra-structure left
to the future generations, medical expenditure, long-term care, etc. These should be included in the
account if we pay attention to intergenerational accounting. We cannot deduct any judgment of value
as long as we stick to the comparison in the social security pension schemes. It may be a political
debate, but not a scientific discussion.
The purpose of the social security pension benefits is to prevent people from being
impoverished due to the retirement, disability or death of the breadwinner. The benefits, therefore,
have to be adjusted to the socio-economic environment of each age. If it is during a period of high
inflation, the benefits have to be so adjusted. Otherwise there is no reason for existence of the social
security pension schemes themselves. By doing this we can correct the faulty results caused by the
incompleteness of the market economy. Benefit adjustment may cause what is called
intergenerational inequity but it is a much smaller problem if avoiding what is called
intergenerational inequity leads to many impoverished people. 34 See the Actuarial Affairs Division, Pension Bureau, Ministry of Health, Labour and Welfare “Report on the 2004 Actuarial Valuation of the Employees’ Pension Insurance Scheme and the National Pension” (2005) that is in Japanese and downloadable from the Ministry’s Home Page.

46
Chapter3. Adapting the Schemes to Changing Life Pattern
The 2004 reform also contains reform provisions to adapt the schemes to the changing life
pattern of the people. More women have come to continue to work after having children. More
mothers whose children have reached a certain age have re-entered the labour force, mostly as
part-timers. This is reflected in the increase of female labour force participation rates during the last
decade shown in Fig. 3-1. Many young people are being forced to earn their livelihood as
part-timers due to a long-lingering stagnant economy. As the number of working women grew,
they came to complain about the treatment of the 3rd-category of covered people who could receive
basic pensions without paying contributions. The government promised in the 2000 reform that it
would review them. The 2004 reform has partly addressed it.
(Fig. 3-1)
3-1. Working beneficiaries
As Japan’s active population is already decreasing, it is useful to allow the elderly to
continue to work and even to encourage them to stay on in the labour force. At the same time, as
long as they work with adequate salary, their need for the old-age benefit is not as great. From
these points of view, the 2004 reform has changed two provisions for working beneficiaries.
Source: Ministry of Internal Affairs and Communications "Labor force survey"
Historical Date of Female Labor Force Participation Rate By Age
16.2
39.553.9
65.571.769.3
62.6
51.761.4
75.1
17.8
14.4
39.5
58.768.271.869.6
61.4
57.1
69.9
72.7
16.6
01020304050607080
15~19 20~24 25~29 30~34 35~39 40~44 45~49 50~54 55~59 60~64 65~
Age
Labo
r For
ce P
artic
ipat
ion
Rat
e
FY 1990 FY 2000
(%)

47
The first is that the unconditional 20 per cent reduction of benefits has been abolished.
Before the reform, one’s old-age benefit was unconditionally reduced by 20% first and then it was
further reduced if one’s total income was above the designated level. This provision was a relic
of the time when the general revenue subsidized 20 per cent of the benefits of the EPI scheme
until FY 1985. Since it was the subsidized part, it was unconditionally removed when the
beneficiary worked. After the subsidy was abolished in FY 1985, there was no reason to
continue, but it remained nonetheless. Furthermore, such a reduction could discourage a
beneficiary from working and for this reason, it was abolished.
The second is that the benefits of working beneficiaries aged 70 and over are now treated
in the same way as those of working beneficiaries aged between 65 and 69. In the 2000 reform,
working beneficiaries aged between 65 and 69 came to be covered by the EPI scheme and started
paying contributions and having their benefits reduced according to their income. Roughly
speaking, the benefit amount is reduced by JPY 1 for excess income of JPY 2 if the sum of the
benefit amount of the earnings-related part and the salary exceeds the average pensionable
remunerations of the active workers35. Basic pensions are not subject to this reduction. This time it
was decided that those aged 70 and over would be treated the same way their benefits were reduced
in the same way. They, however, need not pay contributions because the life expectancy at age 70
or even 75 is so short that imposing contributions on them has been judged to be a bit hard on them.
Here it should be noted that the extension of income testing to beneficiaries aged 70 and
over may seem in the direction contrary to other measures to encourage the elderly to continue to
work. There are two reasons that this is not the case: First, their basic pensions are not
income-tested. Second, those beneficiaries whose benefits are reduced by this income-testing have
earnings well beyond the average pensionable remunerations of active workers. It is only when the
sum of the benefit amount of the earnings-related pension and the salary36 exceeds the average
pensionable remunerations of active workers that the amount of the earnings-related pension is
reduced. So their total income can be considered to be much greater than that of the average
workers. These beneficiaries are probably those with some expertise. Their decision as to
whether to continue to work or not is less likely to be affected by this income-testing.
3-2. Issue of covering part-timers
Partly reflecting the long stagnant economy, many companies are replacing normal
35 The current amount is JPY 480,000 per month with the 1/12 of the pensionable bonuses included. 36 The basic pension benefit is not included.

48
employment with part-time employment. As a result, the number of part-time workers is increasing
rapidly as shown in Fig. 3-2. It is also caused by the tendency for many young people to earn their
livelihood through part-time jobs because the opportunities of normal employment for them have
shrunk during the last decade.
These young people will, sooner or later, become employees and income security in
retirement is as necessary to them as to full time workers. The Ministry of Health, Labour and
Welfare took up this problem and included a provision to extend the coverage of the EPI scheme to
the part-timers when they issued the reform proposal in November 2003.
It was, however, strongly opposed by the employers and the government parties decided
not to include it in the reform bill in February 2004. Instead they included, in the bill, a provision
to continue to look into the possibilities of equalizing the treatment of the people in both full and
part-time employment and to make a decision in 5 years’ time to introduce necessary measures.
(Fig. 3-2 )
* Part-timers are those employees whose per-week working hours are less than 35. Source: Ministry of Internal Affairs and Communications "Labor force survey"
Historical Data of the Number of Part-timers (non-agricultural industry)
0
200
400
600
800
1000
1200
1400
1600
1960 1970 1980 1990 1996 2002Fiscal year
(in 10 thousand)
0.0%5.0%10.0%15.0%20.0%25.0%30.0%35.0%40.0%45.0%(%)
the number of part-timers (in 10 thousand) the number of female part-timers (in 10 thousand)
ratio of the number of female part-timers to the number of female employees (%) ratio of the number of part-timers to the number of employees (%)

49
3-3. Support for parents rearing their children
Measures to support parents rearing children have been extended by the 2004 reform.
The 1994 reform introduced a provision to exempt parents taking leave to look after children one
year old or younger from paying their contributions to the EPI scheme. The exempted periods are
included in calculating their pension benefits. The 2000 reform further exempted employers of
such parents from paying the employers’ share of the contributions. The 2004 reform has extended
the range of targeted parents to those taking leave to look after children aged below 3.
Furthermore, the 2004 reform has introduced a measure to replace the pensionable
remunerations by those prior to childbearing upon calculating the amount of pension benefits if the
parents continue to work after having children but come to be paid less due to fewer working hours
to secure time for looking after the children. This applies to working parents looking after children
below the age of three. For such a period the parents pay their contributions according to their
smaller remunerations, but their benefits are calculated based on the larger remunerations prior to
having children replacing the smaller ones.
3-4. The covered people in the 3rd category
The 1985 reform introduced the classification of the people covered under the NP scheme
into three categories, of which the third kind of covered people are dependent spouses of the people
covered under schemes for employees. They do not have to pay contributions to the NP scheme,
but they can receive their basic pension benefits. Since one of the purposes of the reform was to
establish the women’s right to pensions, it was quite natural, at that time, to divide the flat-rate part
of the EPI benefit between husband and wife. Before that, benefits had been provided mostly in the
name of the husbands for the households, but it had rendered the wives’ benefits to zero if divorced.
To improve such a situation, together with the fact that the flat-rate part of the EPI scheme was to be
absorbed in the NP scheme, the third category of covered people were introduced in the NP scheme
coverage.
From these origins, the third category may now receive basic pension benefits without
paying contributions, but, as the number of working women grew, some of them started complaining
about it. When the Pension Council37 discussed the 2000 reform, the issue delayed arriving at
37 The Pension Council was an advisory committee for the Minister of Health and Welfare then. The government councils were restructured and it became the Pension Subcommittee of the Social Security Council in 2001.

50
conclusion. The problem was very complicated and it was agreed that the issue would continue to
be reviewed in order to reach the conclusion before the first reform after the 2000 reform.
Thus the Minister of Health and Welfare set up a working committee to discuss the
women’s right to pensions in general in 2000. It intensively discussed the matter for one and a half
years, but could not find a solution. Instead, seven possible paths toward a solution were issued in
2001.
The Ministry of Health, Labour and Welfare38 studied the report published by the working
committee, and concluded in the Ministry’s proposal that the pensionable remunerations for periods
when a person was married and his/her spouse was dependent should be considered to be the
cooperative products of the couple. So the Ministry proposed to divide the pensionable
remunerations between the husband and the wife, and for such periods, the earnings-related part
would be halved for the person covered under the EPI and the same amount of earnings-related
benefit would be added to his/her spouse’ EPI benefit. In this way the Ministry would put the
dependent spouses on the footing as the working women, justifying the basic pension benefits
receivable by the dependent spouses without paying the actual contributions.
The government parties deliberated the Ministry’s proposal. They, however, decided they
would admit the division only in the case of divorce because, they said, otherwise, the measure
would appear to encourage divorce. Thus the final provision of dividing the pensionable
remunerations has taken the following form. When a couple is divorced, the dependent spouse may
demand the division of the benefit, and if he/she does, half of the earnings-related part corresponding
to the period of marriage automatically goes to the spouse.
Apart from this, a divorced couple has come to be allowed to divide the earnings-related
part corresponding to the period of marriage upon agreement. In this case, both of the husband and
the wife may have their periods covered under the EPI scheme during the period of marriage and one
of the two does not necessarily have to be dependent. It should also be noted that the upper limit of
the division for a month during the period of marriage is the average of the pensionable
remunerations of the couple.
38 The Ministry of Health and Welfare and the Ministry of Labour were unified into the Ministry of Health, Labour and welfare in January 2001 as a part of the government restructuring.
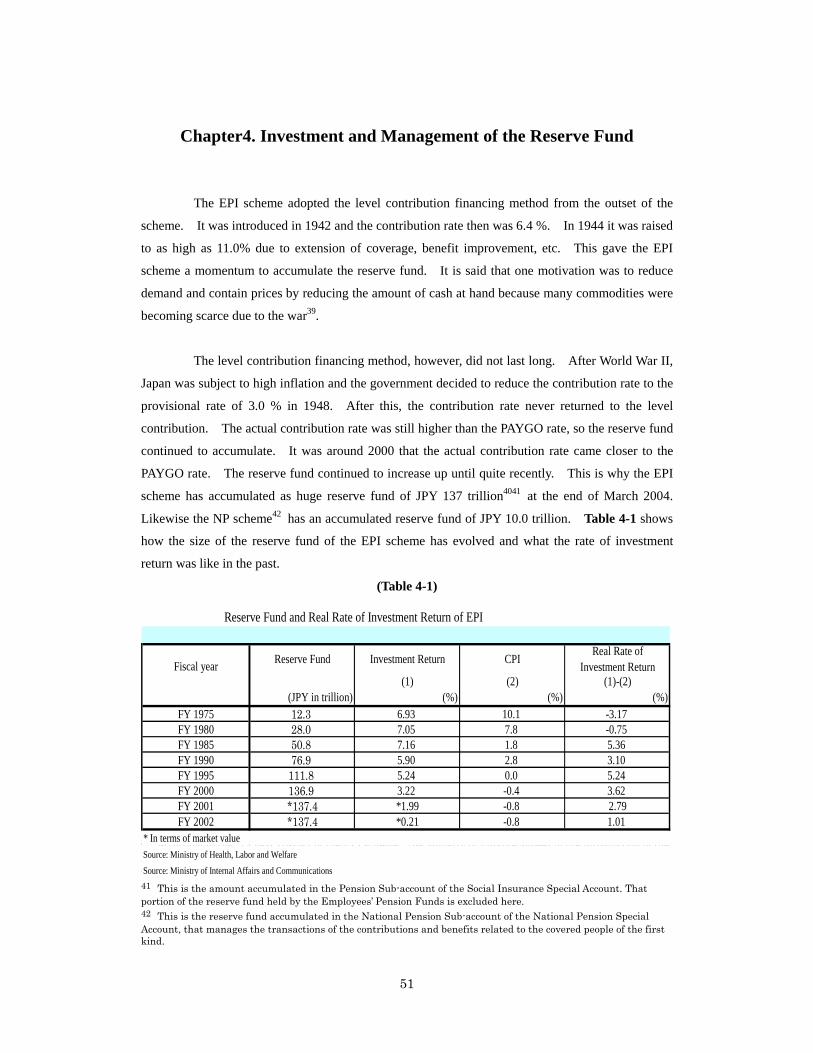
51
Chapter4. Investment and Management of the Reserve Fund
The EPI scheme adopted the level contribution financing method from the outset of the
scheme. It was introduced in 1942 and the contribution rate then was 6.4 %. In 1944 it was raised
to as high as 11.0% due to extension of coverage, benefit improvement, etc. This gave the EPI
scheme a momentum to accumulate the reserve fund. It is said that one motivation was to reduce
demand and contain prices by reducing the amount of cash at hand because many commodities were
becoming scarce due to the war39.
The level contribution financing method, however, did not last long. After World War II,
Japan was subject to high inflation and the government decided to reduce the contribution rate to the
provisional rate of 3.0 % in 1948. After this, the contribution rate never returned to the level
contribution. The actual contribution rate was still higher than the PAYGO rate, so the reserve fund
continued to accumulate. It was around 2000 that the actual contribution rate came closer to the
PAYGO rate. The reserve fund continued to increase up until quite recently. This is why the EPI
scheme has accumulated as huge reserve fund of JPY 137 trillion4041 at the end of March 2004.
Likewise the NP scheme42 has an accumulated reserve fund of JPY 10.0 trillion. Table 4-1 shows
how the size of the reserve fund of the EPI scheme has evolved and what the rate of investment
return was like in the past.
(Table 4-1)
39 According to the “15-year History of the EPI scheme”, the Ministry of Finance agreed to the introduction of the EPI scheme partly because they thought that it would contribute to containing prices. 40 1 trillion = 1,000,000,000,000 41 This is the amount accumulated in the Pension Sub-account of the Social Insurance Special Account. That portion of the reserve fund held by the Employees’ Pension Funds is excluded here. 42 This is the reserve fund accumulated in the National Pension Sub-account of the National Pension Special Account, that manages the transactions of the contributions and benefits related to the covered people of the first kind.
Reserve Fund Investment Return CPI Real Rate ofInvestment Return
(1) (2) (1)-(2)(JPY in trillion) (%) (%) (%)
FY 1975 12.3 6.93 10.1 -3.17FY 1980 28.0 7.05 7.8 -0.75FY 1985 50.8 7.16 1.8 5.36FY 1990 76.9 5.90 2.8 3.10FY 1995 111.8 5.24 0.0 5.24FY 2000 136.9 3.22 -0.4 3.62FY 2001 *137.4 *1.99 -0.8 2.79FY 2002 *137.4 *0.21 -0.8 1.01
* In terms of market valueSource: Ministry of Health, Labor and WelfareSource: Ministry of Internal Affairs and Communications
Reserve Fund and Real Rate of Investment Return of EPI
Fiscal year
52
4-1. Compulsory entrusting of the reserve fund
As stated above, the EPI scheme started to accumulate the reserve fund from the beginning
of the scheme in 1942. The issue of how to manage and invest the reserve fund, therefore, existed
from that time. The Ministry of Health and Welfare insisted that the reserve fund was the precious
accumulation of the contributions by the covered employees and the employers and that it should be
segregated from other money under control of the government and be managed and invested solely
in the interest of these people by the entity responsible for the scheme. The Ministry of Finance,
however, insisted that the money collected by the national schemes or flowing into the government
on the basis of the people’s trust in the government should uniformly be managed or invested in a
consistent manner.
Eventually, the view of the Ministry of Finance was supported and the obligation to entrust
the reserve fund to the Trust Fund Bureau of the Ministry of Finance was established. Together
with the money of postal savings and the reserve fund of the postal insurance, the EPI reserve fund
became the financial resources of the Fiscal Investment and Loan Schedules (FILPs). They
invested the money to construct bridges, harbours, motorways etc. or lent it to help people to own
houses through public corporations. It did help the country construct industrial infrastructure after
the World War II, and, by doing so it may have contributed to the great economic growth in 1960’s
and 1970’s43.
At the same time, as a sort of reconciliation between the assertion of the Ministry of
Finance and that of the Ministry of Health and Welfare, the amount corresponding to about 15% of
the reserve fund was to be lent to municipalities to help welfare facilities like hospitals and town
halls expand throughout the country. The first hospital was constructed in 1944 in Beppu City, Oita
Prefecture.
When the NP scheme was introduced in 1961, the debate over whether to segregate the
reserve fund or not came into the arena again. It was because the NP scheme started with the level
contribution financing method and the new reserve fund of the NP scheme was about to accumulate.
On this occasion, too, a compromise took place. While the obligation to entrust the reserve fund to
the Trust Fund Bureau continued to exist, it was decided that a public corporation was to be
introduced in 1961 that would discharge businesses to lend money to employers or associations of
employers who were planning to introduce welfare facilities for their employees. The public
corporation was called the Pension Welfare Corporation or Nenkin Fukushi Jigyodan (Nenpuku in
43 See Endo (1965)

53
short) in Japanese.
Later, the scope of activities of the Pension Welfare Corporation was extended to include:
- housing loans for the covered employees,
- construction and management of large scale welfare facilities.
When the coverage of the NP scheme was extended to the whole nation and basic pensions
were introduced in 1986, the same debate took place due to the low rates of the Trust Fund Bureau
caused by the rapid gains of JPY against dollars after the Plaza Agreement in 1985. This time, the
agreement favoured the position of the Ministry of Health and Welfare. The Pension Welfare
Corporation was allowed to borrow money from the Trust Fund Bureau and entrust it to trust banks44
for higher return in order to increase the money to lend.
4-2. Investment by the Pension Welfare Corporation
The 1986 reconciliation contained another important item. It was to let the Pension
Welfare Corporation, from FY 1987, borrow money from the Trust Fund Bureau and entrust it to
insurance companies or trust banks with a small portion in in-house investment and transfer the
surplus to the Pension Sub-account of the Social Insurance Special Account or to the National
Pension Sub-account of the National Pension Special Account to increase the reserve fund. In a
sense it could be said that this was a form of autonomous investment by the sub-accounts of the
pension special accounts. It differed in two points from the completely autonomous investment.
One was that the money invested was borrowed from the Trust Fund Bureau and the Pension
Welfare Corporation should pay interest on it. The Pension Welfare Corporation would have
difficult time when the interest rate was decreasing. In such a period, the Pension Welfare
Corporation could not obtain investment return that would exceed the amount of interest to be paid
to the Trust Fund Bureau. The other was that the in-house investment was admitted only partially
and most of the investment should be entrusted exclusively to insurance companies or trust banks.
In those days the investment of corporate pension reserve funds was not deregulated and the
autonomous investment more or less followed this example. Furthermore the vehicles for the
in-house investment were limited to bonds.
Although the 1986 reconciliation or agreement between the Ministry of Finance and the
Ministry of Health and Welfare was of a limited nature, the new framework had the potential to
44 From 1987, it was also admitted to entrust the borrowed money to insurance companies.

54
evolve into an investment fund adaptable to a more deregulated environment. In fact, deregulation
on investment and finance started to develop gradually in 1990’s. Following the opening-up of the
investment of the reserve funds of the Employees’ Pension Funds45 to discretionary investment by
qualified investment advisory firms in 1990, the investment by the Pension Welfare Corporation
became open to discretionary investment by qualified investment advisory firms in 1995. At the
same time, what used to be called the 5-3-3-2 rule was abolished. The 5-3-3-2 rule was an
investment regulation that prescribed that not less than 50% of the fund should be invested in assets
with the principal guaranteed such as bonds, that more than 30% of the fund should not be invested
in equities, that more than 30% of the fund should not be invested in foreign assets and that more
than 20% of the fund should not be invested in real estates.
As deregulation proceeded, the Pension Welfare Corporation came to assume not only duty
of care and duty of loyalty in the new context but also responsibilities for accountability and
transparency. How to construct the framework to discharge such duties and responsibilities was a
big issue to the Corporation. For example, it started to determine the targeted rate of return and
build the principal portfolio to realize it (with risks taken into account) in FY 1995. It also
reviewed the annual report and gradually increased the amount of disclosure. It was just when the
Corporation was repeating trial and error to construct such a framework that a move to drastically
review the FILPs was brought about. In the end, it led to abolition of the obligation to entrust the
reserve fund to the Trust Fund Bureau of the Ministry of Finance in the 2000 reform.
4-3. 2000 reform
As the economy matured, the fiscal investment and loan schedule needed to be reviewed.
Its necessity and efficiency started to be questioned. The review is still going on now in 2005, but,
in November 1997, the Fiscal Investment Council, an advisory body to the Minister of Finance and
the Minister of Post and Telecommunications, published a report which claimed that, as a part of the
review, the obligation to entrust the reserve fund of the social security pension schemes to the Trust
Fund Bureau should be abolished and that the Minister of Health and Welfare should be given
discretion to invest the reserve fund. At the same time, as people became more aware of the burden
of social security contributions, they came to pay more attention to the investment return of the
accumulated reserve fund.
Under such circumstances, the bill to introduce a new framework for investment of the
accumulated reserve fund was prepared and passed the Diet together with the pension reform bill in
45 They are a form of corporate pension plans. See Chapter 5.

55
2000. The law required the Minister of Health and Welfare to prepare a written statement of the
investment principles. It also required him to obtain the advice of the Investment Committee
consisting of representatives of employees and employers, experts of finance, economics, pensions,
etc. when he prepared the statement. The statement of the investment principles must cover:
the objectives of investment and the principal policy to achieve them,
the kinds of investments to be held and the balance between different kinds of investments (the
principal port-folio),
the matters the Government Pension Investment Fund (GPIF; explained below) must observe in
implementing investment and management of the accumulated reserve fund,
the criteria to assess the performance of the GPIF.
In preparing the statement, the Minister of Health and Welfare was legally required to take
note of the safety and surety of investment, the diversification of investments, the effects on the
capital markets and other activities in the private sector of the vast size of the accumulated reserve
fund which was of public nature, etc. He was also required, in making the principal port-folio, to
take account of the risks of the investment return, which could be simulated, for example through
Monte-Carlo method, making use of the financial projections set out at the latest actuarial valuation.
The statement should be reviewed at least once a year, obtaining the advice from the Investment
Subcommittee of the Social Security Council.
The law also stipulated that, as part of the review of the FILPs, the Pension Welfare
Corporation was to be abolished and the Government Pension Investment Fund (GPIF) was to be set
up on 1 April 2001.46 It was to cease constructing and managing welfare facilities or to transfer the
operations like lending money to corporations planning to construct hospitals or facilities for the
aged people to other public corporations. The GPIF has existed since then as a public corporation,
investing and managing the accumulated reserve fund, which the Minister of Health, Labour and
Welfare47 entrusts to it with the statement of investment principles. It has also engaged in the
businesses to terminate the management of the welfare facilities. The housing loans to the people
covered by the EPI scheme or the NP scheme have been taken over by the GPIF. The 2000 reform
also determined that housing loans were to be reviewed by the pension reform after the next and the
new entity that would take them over would be designated. Actually it was done by the 2004
reform though, that was earlier than scheduled as we will see below in 4-5.
The actual investment is entrusted by the GPIF to private financial institutions like trust 46 For a comparison with other recent OECD country initiatives in this area, see Palacios (2001). 47 The Ministry of Health and Welfare merged with the Ministry of Labour in January 2001 and became the Ministry of Health, Labour and Welfare (MHLW).

56
banks, insurance companies, investment advisory firms, etc. except for a portion invested in-house
by the GPIF. The in-house investment is only permissible in bonds. The GPIF must prepare a
written statement of investment and management policy for deciding the port-folio which must, of
course, be within the permissible range of the Minister’s statement of investment principles and for
making contracts with private financial institutions, evaluating their performances and changing the
contracts if necessary. The GPIF implements its duties according to the statement. Decisions of
the GPIF are made by the board that is composed of the president and two other members. The
GPIF also appoints several advisors on investment and management of the fund. They must
participate in the decision-making process of the board. This new scheme of the investment and
management of the reserve fund is summarized in Fig. 4-1.
(Fig. 4-1)
New Scheme for Investment and Management of the Reserve Fund
Duty of care and duty of loyalty solely for the interest of people covered by the social
security pension schemes are imposed on all the people concerned with the investment of the fund,
including the officials of the MHLW. If a person commits a breach of duties, he may be penalized
Bond marketStock market
Pension Subaccount of the Social Insurance Special Account
(The minister of Health, Labor and Welfare)
Entrust
運用委託
Paying coupons & returning the entrusted money
Fiscal Investment Bonds(FIBs)
Government Pension Investment Fund (GPIF)
Fund Trust Bureau(Money entrusted)
In-house investment
Private financial institutions
EntrustBuying the FIBs

57
or punished. These duties must also be provided in the contracts made by the GPIF with private
financial institutions. The Minister of Health and Welfare and the GPIF are not allowed to exercise
the shareholder’s right to vote. Only those private financial institutions to whom investment is
entrusted can do so.
Disclosure of information is also required. The Minister’s statement of investment
principles, the annual report and the GPIF’s business report must be submitted to the Investment
Subcommittee of the Social Security Council and published. The GPIF must prepare financial
statements every year. They must be audited internally by the auditor of the GPIF as well as
externally by public accountants or by auditing firms. The auditors’ report must be published.
The new framework of investment of the accumulated reserve fund of the social security
pension schemes became effective in FY 2001.
4-4. Statement of investment principles and principal portfolio
As stated above, under the 2000 reform law, the Minister of Health, Labour and Welfare
has the duty to prescribe the investment principles and determine the principal portfolio. The
following is its outline of the latest version published on 31 March 2004 by the Minister of Health,
Labour and Welfare.
(1) Basic principles
It recognizes that the reserves should be invested solely for the interest of the covered
people in an effective long term manner so that it contributes to the stable management of the social
security pension schemes in perpetuity.
Advocates diversification in asset allocation to obtain the targeted rate of return at
minimized risk. The principal portfolio to realize this, taking account of the risk character of each
asset class is determined.
In investing and managing the reserve fund, the fact that it is the differential between the
rate of return and the rate of increase of the disposable income that counts in securing the financial
equilibrium is taken into account. Attention is paid to the liquidity needs of the fund as benefits are
projected to exceed the inflow of the contributions and the national subsidy for the time being. It is
also important to bear in mind that care should be taken not to affect market prices or to distort the

58
investing behaviour of the general public.
The duty of care and duty of loyalty on every person concerned with the investment and
management of the reserve fund is imposed. At the same time adequate disclosure of the
concrete investment plan, the result of the investment, its effects on the financial conditions of the
social security pension schemes, etc. is required in order to obtain the understanding and cooperation
from the nation.
(2) Principal portfolio
The principal portfolio is constructed in order to invest the reserve fund in the most
efficient manner under various conditions and limitations. Once it is determined, the composition
of assets in line with the principal portfolio is selected as long as there is no perception of any
fundamental change in economic conditions. The principal portfolio is subject to an annual review
and when there is a periodic actuarial evaluation in order to ensure consistency with current realities.
Reviews can also be conducted on an as needed basis.
The current principal portfolio was fixed in FY 2005 based on the 2004 actuarial valuation.
It is shown in Table 4-2. The 2004 actuarial valuation assumed the investment rate of return to be
3.2% and the increase rate of disposable income to be 1.9% until FY 2017 and 2.1% after 2017.
Taking account of these assumptions, the targeted rate of investment return was fixed at 3.2%. The
objective was to find an asset mix whose expected rate of return was 3.37% with the least risk.
Simulations were produced in order to ascertain which asset-mix had the least possibility of
downside risk. This resulted in the principal portfolio shown below. It has a standard deviation of
5.55%48.
(Table. 4-2)
The Principal Portfolio (FY 2008) Domestic Bonds Domestic Stocks Foreign Bonds Foreign Stocks Short-term Assets
67% 11% 8% 9% 5%Source: Ministry of Health, Labor and Welfare
The portfolio limits have also been fixed by asset class.. The composition of assets is not
changed as long as the difference between the actual ratio of each asset class to the total fund and the
ratio of the asset class in the principal portfolio does not exceed the limit. This is done partly so as
to minimize transaction costs. It is 8% for domestic bonds, 6% for domestic stocks and 5% for
48 The basic historical data of risks and returns of each asset class is found in the reference materials submitted to the Investment Subcommittee of the Social Security Council on 12 February 2002. It is on the Ministry’s homepage.
59
both foreign bonds and foreign stocks.
It should be noted that, when the principal portfolio was decided, the Investment
Subcommittee of the Social Security Council imposed the following restrictions:
- (Foreign Bonds) < (Foreign Stocks) < (Domestic Stocks)
(3) Transition to the principal portfolio
When the obligation to entrust the reserve fund of the social security pension schemes was
abolished on 1 April 2001, there remained about JPY 147 trillion entrusted to the Trust Fund Bureau.
This amount of money was to be gradually paid back to the Pension Sub-account of the Social
Insurance Special Account and to the National Pension Sub-account of the National Pension Special
Account by FY 2008. When those sub-accounts entrusted the money to the Trust Fund Bureau, the
contract was usually due in 7 years. The money entrusted was decided to be paid back when the
contract matured. That is why it is not until FY 2008 that the money will have been completely paid
back to the sub-accounts.
The principal portfolio has been constructed under the assumption that the money has
already completely been paid back to the sub-accounts. However, it has not yet been at the moment.
Thus, until FY 2008, a provisional targeted portfolio is constructed every fiscal year so as to make
smoother the transition of the asset allocation toward the principal portfolio.
The provisional targeted portfolio is for the assets composed of the following parts:
- the money already paid back to the sub-accounts,
- the money taken over from the Pension Welfare Corporation and remaining in the GPIF that
was borrowed from the Trust Fund Bureau before FY 2001,
- the money remaining in the Trust Fund Bureau.
The provisional targeted portfolio is for all the money mentioned above where the money remaining
in the Trust Fund Bureau is classified as assets of domestic bonds. Fig 4-2 shows the provisional
targeted portfolio for each fiscal year until FY 2008. For the fiscal years 2006-07, it is just an
estimate and each year it is decided by the Investment Subcommittee of the Social Security Council,
taking account of the actual result of investment.
The allowance is also decided for the provisional targeted portfolio. For domestic bonds,
it was 2% in FY 2005. For each of the other asset classes, it was 2% if its portion decreased, and it
was without limit if its portion increased. The reason is that there is an intention to increase the

60
portion of these asset classes.
The assets the GPIF actually invests are those other than the money remaining in the Trust
Fund Bureau. So it is also necessary to indicate the provisional targeted portfolio for the GPIF.
For FY 2005, it was 52% for domestic bonds, 21% for domestic stocks, 12% for foreign bonds, 15%
for foreign stocks and no short-term assets. The allowance was 5% for domestic bonds. It was also
5% for each of the other asset classes if its portion decreased but no limit if its portion increased.
(Fig. 4-2)
The Transition to the Principal Portfolio
89% 87% 83% 79% 75% 74% 71% 68%
4% 5% 6% 7% 8% 10% 11% 12%
1% 2% 2% 3% 5% 5% 6% 7%
2% 3% 4% 5% 6% 7% 7% 8%4% 3% 5% 6% 6% 6% 5% 5%
0%
20%
40%
60%
80%
100%
2001 2002 2003 2004 2005 2006* 2007* 2008:The Principal
Portfolio
Domestic Bonds Domestic Stocks Foreign BondsForeign Stocks Short-term Assets
(4) Restrictions
Each of the financial institutions entrusted by the GPIF should not invest more than 5% of
the entrusted money in bonds or stocks of the same company. It should not possess more than 5% of
stocks issued by a company, either. Derivatives for speculative purposes are prohibited and
restricted to hedging purposes.
(5) Fiscal investment bonds
Although the obligation to entrust the reserve fund to the Trust Fund Bureau has been
abolished, the FILPs themselves continue to exist. They are going through restructuring, but they
require financial resources. The Trust Fund Bureau issues bonds called fiscal investment bonds
(FIBs) for them and raises the financial resources. Some are sold on the market, but the rest is, for
the time being, sold by agreement of the pension sub-accounts, the Postal Savings and the Postal
Insurance with the Trust Fund Bureau. The Trust Fund Bureau negotiates with these organs every

61
fiscal year to decide the amount bought by them. By doing so, the restructuring of the FILPs is
thought to be developing smoothly.
In FY 2004, the Trust Fund Bureau issued FIBs of JPY 41.3 trillion, out of which JPY 11.7
trillion was sold at the market, JPY 7.50 trillion was bought by the pension sub-accounts, JPY 19.70
trillion was bought by the Postal Savings and JPY 2.40 was bought by the Postal Insurance.
The total budget amount of the FILPs is rapidly decreasing. It was JPY 32.5 trillion in FY
2001, but JPY 20.5 trillion in FY 2004. Thus, together with the FIBs bought by the pension
sub-accounts, the Trust Fund Bureau has been able to gradually pay back the entrusted money to the
pension sub-accounts. For example, the budget for FY 2004 shows that:
- the amount of entrusted money paid back to the pension accounts: JPY 15.4 trillion
- the amount of FIBs reaching maturity: JPY 1.1 trillion
- the amount of FIBs bought by the pension sub-accounts: JPY 7.5 trillion
- the amount of money paid back to the Trust Fund Bureau that was formerly borrowed by the
Pension Welfare Corporation: JPY 3.2 trillion
Therefore, the amount of money newly flowing in for the management by the GPIF was JPY 4.7
trillion and the amount of money invested or reinvested in the market in FY 2004 was JPY 5.8
trillion.
4-5. 2004 reform
As we have seen above, the 2000 reform was a great turning point of the management and
investment of the reserve fund of social security pension schemes. In the 2004 reform, however,
politics have led to further changes to the framework. Motivated by the lingering opinions that the
welfare facilities constructed and managed by the Pension Welfare Corporation and taken over by
the GPIF, that had already been decided to be abolished in due course in the 2000 reform., were the
symbol of the government’s wasteful spending of the reserve fund, the government parties started to
discuss the further reform of the framework in 2003. They reached the conclusion that the GPIF
should concentrate on the management and investment of the reserve fund and yield the other
businesses like managing the welfare facilities to other relevant organs. They also claimed that the
GPIF should be changed into an agency to be given more expertise with clearer responsibilities.
They ordered that the board members of the new agency including the president should be chosen
from the experts on economics and finance principally from the private sector. These changes are
to come into effect as of 1 April 2006.

62
As Fig. 4-3 shows, the new framework transfers the duty to make the statement of
investment principles and decide the principal portfolio to the new agency from the Minister of
Health, Labour and Welfare. With the board members chosen from the experts on economics and
finance, the agency is expected to act with expert discretion and responsibilities.
(Fig. 4-3)
The 2004 reform of the investment and management of the reserve fund was led by
legislators. They paid attention to the staff composition including the President of the new agency
and ordered the government to recruit experts from the private sector for them. However, they
hardly discussed the nature of the new agency or analysed the macro-economic impacts of the
The minister of Health, Labor and Welfare
Government Pension Investment Fund(GPIF)
New Agency
The minister of Health, Labor Welfare
Scheme designActuarial valuation
Decision of Principal Portfolio
Scheme designActuarial valuation
Decision of Principal Portfolio
Advisory committee
Board
Agency EvaluationCommittee
Medium-termgoals
Investment Committee
Trust bankInvestment
advisory firms
Purposes of Reform
To be abolished
managementof debts
advice
experts on finance and economics
experts on finance and economics
○Management of private financialinstitutions entrusted
○In-house investment
○Management of private financialinstitutions entrusted
○In-house investment
oversight
Strengthening expertiseClarifying duties
management of welfarefacilities
housingloans
Welfare & Medical Service Agency is to take over the management from April 2006.
President
performanceevaluation
order of correctionorder of personnelrotation
deliberations
(Before 2004 Reform) (After 2004 Reform)
Trust bankInvestment
advisory firms(private financial institutions)

63
investments. These keyl issues should continue to be discussed, studying the foreign experiences and
discussions such as those of the US, Canada, Ireland, etc.49 that have accumulated fairly large
reserve funds in their social security pension schemes.
Chapter5. Complementary Schemes
As the ageing of population rapidly and steadily progresses in Japan, the social security
pension schemes have been forced to contract their roles of income security in retirement. Under
such circumstances, the roles of complementary pension schemes should be extended and employers
and individuals should be encouraged to introduce them or take them in order to achieve higher
living standards in retirement.
5-1. Complementary pension schemes in Japan
The framework of corporate pension plans were consolidated in 1960’s when the
tax-qualified pension plan (TQPP) system and the employees’ pension fund (EPF) system were
introduced. Before that, many of the companies provided lump-sum benefits but very few provided
pensions.
In the latter half of 1980’s the EPFs expanded greatly. Many companies partially or
totally converted their lump-sum provisions or TQPPs into EPFs. After the economic bubble burst
in early 1990’s, the investment environment worsened; stock prices plummeted and interest rate
declined to a very low level. Many of the corporate pension plans, including both TQPPs and EPFs,
became under-funded.
This environment led to the abolition of the 5-3-3-2 rule50 in 1995. Instead, plans were
required to be managed in a prudent manner. Still the environment did not improve. Under such
circumstances, the employers started to aspire for the possibility to buy-back the substituted part of
the EPFs. As explained below, the EPFs substitute a portion of the earnings-related old-age
pension benefits provided by the EPI scheme. They receive rebates from the EPI scheme as the
49 We should note that the investment institutions in Canada and Ireland are very independent of the governments and the governments have no say in their investment decisions. We should also note that the US has decided not to invest the reserve fund in the capital market after a long series of discussions in late 90’s. 50 See 4-2.
64
financial resources for paying the substituted portion by the EPFs. Since the rebates are determined
to be a level contribution rate for the substituted portion with the assumed interest rate 5.5%, the
reserve fund accumulates in each of the EPFs. The EPFs have to invest the fund and obtain the
investment return at 5.5%. If they fail, the sponsoring employers have to pay additional
contributions to compensate the difference. Under the long lingering adverse environment, the
employers were forced to do so for several years and finally began to look for measures that would
let them return the substituted portion to the EPI scheme and transfer the remaining benefits proper
to the EPFs to plans that they wished the measures would introduce. The sponsoring employers
wanted to halve their additional contributions by getting rid of the substituted portion.
The TQPPs were also suffering from the under-funding. Furthermore the TQPP system
was only a tax provision and did not stipulate anything about the members’ rights nor powers and
duties of the people concerned. Under the on-going deregulation the people concerned, especially
the professionals like consultants and fund managers, felt the needs for clarification of members’
rights, sponsoring employers’ powers and duties, decision-making process, who is responsible for
what, etc.
These circumstances led to the creation of new systems. Both the Defined-benefit
Corporate Pension Plans Law and the Defined-contribution Pension Plans Law were enacted in
2001and they were effective on 1 April 2002 and on 1 October 2001 respectively. Thus the EPFs
has been allowed to return their substituted portion to the EPI scheme and transfer the remaining
benefits proper to the EPFs to either the defined-benefit corporate pension plans or the
defined-contribution pension plans. Before then, their only option was to wind up the EPFs, buying
back the substituted portion by returning the buy-back reserve to the EPI scheme and distributing the
remaining assets among pensioners, members and vested former members.
As to the TQPP system, it was decided that it should be abolished in ten years’ time. By
FY 2010, the TQPPs should decide whether to be converted into defined-benefit corporate pension
plans or to defined-contribution pension plans. Otherwise they should wind up.
Individuals have also been given a new option of the defined-contribution pension plan
system. The self-employed people already had the option of the National Pension Fund system
whereby they could buy life annuities of various benefit levels. Now the employees working for
companies without any type of corporate pension plans can subscribe for the defined-contribution
pension plan run by the National Pension Fund.

65
Fig. 5-1 shows the three pillars of income security in retirement in Japan.
Employers’ contributions to the EPFs, the TQPPs, the DB plans and the DC are all tax deductible.
Employees’ contributions to the EPFs are also tax deductible though there is an upper limit for it.
Employees’ contributions to the TQPPs and DB plans are not tax deductible. Employees’
contributions to DC plans are not permitted except when an individual pays contributions to the
National Pension Fund Association because there is no corporate plan in his company. They are tax
deductible. The accumulated reserve funds are subject to taxation called special corporate tax51.
It is 1% of the amount of the reserve fund of the EPFs or DC plans or that corresponding to the
employers’ contributions in the case of the TQPPs or DB plans. There is an exemption for the EPFs,
whereby the accumulated reserve fund is exempted from the special corporate tax that corresponds
to 2.84 times the portion corresponding to the substituted part. Under the recent severe investment
environment, the special corporate tax has decided not to be imposed for the time being. Benefits
are subject to income tax except for the part of the TQPPs or DB plans that corresponds to
employees’ contributions.
(Fig. 5-1)
Three Pillars of the Old-age Income Security in Japan
51 The meaning of the special corporate tax is defined as an interest on the deferment of the income tax.
individual savings, personal pensions, etc.
lump-sum retirement benefit plans
DC plans DC plans
DB plans
Tax Qualified
National Employees' Pension Funds Pension Plans (occupational addition)Pension (substitutional part)
Funds
Mutual Aid Associations(EPI) (MAA's)
National Pension Scheme (Basic Pension Benefits)(NP)
the self-employed non-working spouses employees in the private sector government employees, etc. of the employed
New systems were introduced on 1 Oct. 2001 for DC plans and on 1 April 2002 for DB plans respectively.
to be abolished by the end of March 2012 (The bill has already passed the Diet.)
Mutual Aid Association for Agricultural, Fishery and Forertry Cooperative Employees was absorbed in the EPI on 1 April 2002.
Employees' Pension Insurance Scheme

66
5-2. Employees’ pension funds
The EPFs substitute a portion of the earnings-related old-age benefits of the EPI scheme
with benefits proper to them added on it (Fig. 5-2). In return, they are given rebates by the EPI
scheme. The rebates were formerly calculated so as to result in level contributions for the future
period with the assumed interest rate being 5.5%. They formed the reserve funds and the EPFs had
to invest them to secure the rate of investment return of 5.5%. Until around 1990, it usually
exceeded 5.5% and the surplus compensated for the increased cost given rise to by the improvement
of mortality. After the economic bubble burst around 1990, it dropped below 5.5% and the low
investment return lasted for more than a decade.
(Fig. 5-2)
As we have seen above, it led to the introduction of the defined-benefit corporate pension
plan system and the defined-contribution pension plan system.
The government has also introduced measures in the 2004 reform to alleviate the pains the
EPFs have suffered. It looked into the financial relationship between the EPI scheme and the
substituted portion of the EPFs. It concluded that too much burden on the EPFs meant a lighter
burden on the EPI scheme and vice versa, and that the financial relationship should be neutralized.
The neutralizing measure taken is to change the calculation of the buy-back reserve52 that
52 The buy-back reserve of an EPF is the amount of money that should be paid to the EPI scheme when the EPF winds up or returns the substituted portion to the EPI scheme.
substitutedpart
α+EPFprovides
<Before the introduction of the EPF> <After the introduction of the EPF>
Governmentprovides
earnings-relatedbenefits
old-age basicpension benefits
Governmentprovides
67
used to be calculated as the present value of the benefits that had accrued so far with the interest rate
being 5.5% and the mortality rate the same as that used in the latest actuarial valuation of the EPI
scheme. When the investment environment is favourable and both the EPI scheme and the EPFs
can obtain the rate of investment return higher than 5.5%, the former calculation of the buy-back
reserve would bring profits to the EPFs that just corresponds to the deficits of the EPI scheme. On
the other hand, when the investment environment is unfavourable and both the EPI scheme and the
EPFs can only obtain the rate of investment return lower than 5.5%, the former calculation of the
buy-back reserve would cause deficits to the EPFs that just corresponds to the surplus of the EPI
scheme. The same thing can be said of the mortality improvement. Since the rebates do not take
account of the mortality improvement for the past period, it would cause deficits on the EPFs that
just corresponds to the surplus of the EPI scheme. The newly introduced calculation of the
buy-back reserve is as follows:
(i) First, the buy-back reserve at the end of September 1999 is calculated in the old manner.
That is as the present value of the benefits that had accrued up to that time.
(ii) Then the new buy-back reserve at the end of each fiscal year is calculated. It is the sum of
the buy-back reserve at the end of the last fiscal year53 and the income of the rebates,
transfer of money from the Pension Sub-account of the Social Insurance Special Account
and the investment return during the fiscal year deducted by the payment of substituted
benefits.
(iii) The investment return is calculated at the same rate as the rate of investment return of the
reserve fund of the pension sub-account.
By doing so, there is no financial gain-and-loss relationship between the EPI scheme and the EPFs.
Thus it can be said that the financial relationship has been neutralized54.
The 2004 reform has also introduced a measure that is to back up the above-mentioned
neutralizing measure and to secure the cash inflow to the EPFs for paying the substituted benefits.
The neutralized buy-back reserve permits older EPFs to return relatively small amount of
reserve to the EPI scheme when they wind up or return the substituted portion to the EPI scheme.
This means that, in an extreme case, the reserve becomes zero and falls short of the payment of the
substituted benefits. In order to avoid such shortage, the following measure has been introduced:
(a) First, each EPF calculates the present value of the benefits that have accrued so far.
(b) Then, (a) is compared with the neutralized buy-back reserve.
53 In the case of the buy-back reserve at the end of FY 1999, it was the buy-back reserve at the end of September 1999. 54 When an EPF obtains higher rate of investment return than the EPI does, it is the surplus to the EPF, but it is not the deficit of the EPI scheme.

68
If the buy-back reserve is less than a half of the present value (a) but greater than a quarter of (a),
then one fifth of the difference between (a) and the buy-back reserve is paid into the EPF from the
EPI scheme55. If the buy-back reserve id less than a quarter of the present value (a), then the
difference between (a) and the buy-back reserve is paid into the EPF from the EPI scheme. If the
buy-back reserve is greater than the 150% of the present value (a), then the rebate for the EPF is
reviewed and the difference between the buy-back reserve and the 150% of (a) is taken account of to
reduce the rebate. This measure is summarized in Fig 5-3.
The neutralizing measure and its backing-up measure have certainly alleviated the pains
the EPFs have felt, but it was a bit late and many of the EPFs have decided to return the substituted
portion to the EPI scheme and change into defined-benefit corporate pension plans or the
defined-contribution pension plans or just to wind up. So the number of the EPFs has dramatically
decreased. It was 1,801 at the end of FY 2000, but 1,067 at the end of September 2004.
(Fig. 5-3)
55 When the EPF calculates the buy-back reserve at the end of the fiscal year, the money paid in from the EPI scheme is added to the buy-back reserve.
standardized present value of
benefits corresponding to the past periods
buy-backreserve
buy-backreserve
buy-backreserve
100%100%
50%(1/2)50%(1/2)
25%(1/4)25%(1/4)
150%150%
buy-backreserve
utilized to lower rebate
1/5 of the difference is paid in.
The differenceis filled up.
(case 1) (case 2) (case 3) (case 4)
money to be transferred from the Pension Sub-account of the Social Insurance Special Account to the EPFs

69
5-3. Defined-contribution pension plans
When the benefit level of social security pensions is reduced, the defined-contribution
plans may well play a greater role as other complementary schemes do. In the 2004 reform, taking
account of the automatic balancing mechanism that will gradually reduce the benefit level of the
social security pension schemes, the upper limit of the monthly contributions to the
defined-contribution plans made for individuals has been raised:
- For corporate type without other corporate pension plans: from JPY 36, 000 to JPY 46,000
- For corporate type with other corporate pension plans: from JPY 18,000 to JPY 23,000
- For individual type: from JPY15,000 to JPY 18,000
70
Concluding Remarks
Japan’s social security pension schemes have coped with the challenges of population
ageing for the last two decades. By modifying the indexation, Japan has obtained an automatic
balancing mechanism that would automatically restore the financial equilibrium even if the ageing of
the population continues. At the same time, a minimum for the benefit level has been introduced so
as to avoid letting the automatic balancing mechanism reduce the benefit level without limit. It
should, however, be pointed out that even the best estimate case of the financial projections threatens
to be lower than the lower limit of the benefit level in 20 years’ time if there are small adverse
changes. In this sense, we have to continue to look into the true implications of the lower limit.
Nevertheless, it can be said that further ageing does not lead to short term pension reforms.
This simply triggers further adjustment through indexation. It is not before 15 or 20 years’ time
that the benefit level will actually be lower than the lower limit. This allows for time to directly
tackle the problem of declining birth rate.
Changing life style is also requiring us to adapt the social security pension schemes to it.
It is just on the way and the 2004 reform is the starting point. We have to continue to observe the
change and look for the best solution.
The 2004 reform is expected to reduce the distrust in the social security pension schemes
among younger generations. Repeating reforms will be unnecessary and this will contribute to
reducing distrust. We should, however, make efforts to give publicity to the social security pension
schemes and perhaps include them in the curriculum of high school.
The long-lingering stagnant economy has caused the landscape of the complementary
schemes to change dramatically. It is still changing now. It may, however, be pointed out that the
measures taken so far are not sufficient for the complementary schemes to compensate the reduced
part of the social security pension schemes. Framework, regulation and tax treatment should
continue to be reviewed.
To end the paper, the author would like to summarize what was missing in the 2004 reform
discussion. As is referred to in 2-7 and 2-9, the macro-economic implications of the reform should
have been analysed, especially those of raising the national subsidy. The impact on savings of the
reform should also have been analysed. The issue of investment and management of the reserve

71
fund was rather left on the sideline, and whether the new agency should have complete independence
of the government or not, whether the new agency should be permitted to invest in the stock market
or not, what impacts the investment of the reserve fund would have on the national economy, etc.
should have intensively been discussed as well. These issues should be analysed and shown to the
nation in the next reform so that they will be able to better understand the meaning of the social
security pension schemes.

72
Bibliography
Börsch-Supan, Axel H., and Christina B. Wilke
“Reforming the German Public Pension System” (August 2004), paper prepared for the 2004
General Assembly of the Japan Pension Research Council
Palmer, Edward
“The Swedish Pension Reform Model: Framework and Issues” (June 2000) The World Bank
Sakamoto, Junichi
“Pension Reform and Funding Options” (October 2000) National Report to the ISSA Conference
for Social Security Actuaries and Statisticians
Settergren, Ole, and Boguslaw D. Mikula
“The Rate of Return of Pay-As-You-Go Pension Systems” (November 2001) The Swedish
National Social Insurance Board
The Board of Trustees, Federal Old-age and Survivors Insurance and Disability Insurance Trust
Funds
“The 2004 Annual Report of the Board of Trustees of the Federal Old-age and Survivors
Insurance and Disability Insurance Trust Funds” (March 2004) U.S. Government Printing
Office
[The followings are the Japanese references without English version.]
Endo, Shokichi
“The Fiscal Investment and Loan Schedule” (1965) Iwanami Shoten
Ministry of Health, Labour and Welfare
“Consultative Proposal and Issues for the Pension Reform (Consultation Document)” (December
2002) downloadable from the Ministry’s Home Page
Ministry of Health, Labour and Welfare
“Toward the Sustainable and Reliable Social Security Pension Schemes (The Ministry’s
Proposal)” (November 2003) downloadable from the Ministry’s Home Page
The Pension Bureau, Ministry of Health, Labour and Welfare
“Summary of the 2004 Pension Reform---in order to make the schemes sustainable and
73
reliable---” (2004) downloadable from the Ministry’s Home Page
The Actuarial Affairs Division, Pension Bureau, Ministry of Health, Labour and Welfare
“Report on the 2004 Actuarial Valuation of the Employees’ Pension Insurance Scheme and the
National Pension Scheme” (2005) downloadable from the Ministry’s Home Page
The Social Insurance Research Institute (Shakai-hoken Kenkyusho)
“Commentary on the 2004 Reform” (October 2004) The Social Insurance Research Institute
Sakamoto, Junichi
“2004 Pension Reform in Germany and the Modified Indexation in Japan” (November 2004)
Monthly Periodical “Nomura Pension Consulting” published by Nomura Pension Management
Research Group, Nomura Research Institute
-- “On Putting the Rebates on the Normal Track” (January, February 2005) Weekly
Commentary on Pensions published by Nomura Pension Management Research Group,
Nomura Research Institute
Working Group for the Minister of Health, Labour and Welfare on Adapting the Social Security
Pension Schemes to Changing Life Style of Women
“Report---toward the social security pension schemes that will reward to women’s contributions
to society” (December 2001) downloadable from the Ministry’s Home Page
The Pension Bureau, Ministry of Health, Labour and Welfare
“Investment Principles of the Social Security Pension Reserve Fund” downloadable from the
Ministry’s Home Page
The Pension Bureau, Ministry of Health and Welfare
“Constructing the Pensions in the 21st Century” (1999) The Social Insurance Research Institute
The Ministry of Health, Labour and Welfare
“Annual Report on the Investment Performance of the Reserve Funds of the EPI Scheme and
The NP Scheme” (October 2004) downloadable from the Ministry’s Home Page
Tamaki, Nobusuke
“Governance of Public Pension Reserve Fund” (August 2004) Nihon Keizai Shinbun

74
The Ministry of Health and Welfare
“15- Year History of the Employees’ Pension Insurance Scheme” (1958)
The Investment Subcommittee of the Social Security Council
“On the prerequisites for constructing the principal portfolio” (12 February 2002)
(It is on the homepage of MHLW.)

Rapid population ageing has led to repeated adjustments to the parameters ofJapan’s public pension scheme over the last decade all aimed at achievinglong run financial balance. The most recent attempt, describe in this paper,introduces an adjustment mechanism that links future benefit levels to theunderlying determinants of the scheme’s finances. This mechanism is similarto those recently introduced in Germany and, to a lesser extent, in Swedenand fundamentally alters the concept of the ‘defined benefit’. Changes to howpension reserves are invested are also described. Finally, the benefit reductionsin the public scheme and recent regulatory changes suggest an increasedfuture role for complementary private provision.
HUMAN DEVELOPMENT NETWORK
About this series...Social Protection Discussion Papers are published to communicate the results of The World Bank’swork to the development community with the least possible delay. The typescript manuscript of thispaper therefore has not been prepared in accordance with the procedures appropriate to formallyedited texts. The findings, interpretations, and conclusions expressed herein are those of the author(s),and do not necessarily reflect the views of the International Bank for Reconstruction and Development/ The World Bank and its affiliated organizations, or those of the Executive Directors of The World Bankor the governments they represent. The World Bank does not guarantee the accuracy of the dataincluded in this work. For free copies of this paper, please contact the Social Protection AdvisoryService, The World Bank, 1818 H Street, N.W., Room G7-703, Washington, D.C. 20433-0001.Telephone: (202) 458-5267, Fax: (202) 614-0471, E-mail: [email protected] or visit theSocial Protection website at www.worldbank.org/sp.