january – june 2013 number 53
TRANSCRIPT

January – June 2013 Number 53

Journal of the African Elephant, African Rhinoand Asian Rhino Specialist Groups
January – June 2013 No. 53
EditorsDali Mwagore and Helen van Houten
Section EditorsDeborah Gibson–African elephantsKees Rookmaaker–African and Asian rhinos
Editorial BoardJulian BlancHolly T DublinRichard EmslieMike KnightEsmond MartinBenson Okita-OumaRobert OlivierDiane SkinnerBibhab K TalukdarLucy Vigne
Design and layoutDali Mwagore
IllustrationsPhilip Miyare
Address all correspondence, including enquiries about subscription, toThe Editor, PachydermPO Box 68200 – 00200Nairobi, Kenyatel: +254 20 249 3561/65email: [email protected]: http://african-elephant.org http://pachydermjournal.org
Reproduction of this publication for educational or other non-commercial purposes is authorized without written permission from the copyright holder provided the source is fully acknowledged.
ISSN 1026 2881
1 Chair reports / Rapports des Présidents
1 African Elephant Specialist Group report/ Rapport du Groupe des Spécialistes des Eléphants d’Afrique
Holly T Dublin
7 African Rhino Specialist Group report/Rapport du Groupe des Spécialistes des Rhinocéros d’Afrique
Mike Knight
25 Asian Rhino Specialist Group report/Rapport du Groupe des Spécialistes des Rhinocéros d’Asie
Bibhab K Talukdar
28 Research
Elephant effect on forest physical structure and plant species composition in Salonga and Malebo (Lac Tumba landscape), Democratic Republic of Congo
Bila-Isia Inogwabini, Mafuta Ngama-Nkosi, Lisalama Wema-Wema and
Mbende Longwango
38 Status and trends of the elephant population in the Tsavo–Mkomazi ecosystem
Shadrack Ngene, Steve Njumbi, Martha Nzisa, Kenneth Kimitei, Joseph Mukeka, Shadrack Muya, Festus Ihwagi and Patrick Omondi
51 Increasing rhino awareness in Yemen and a decline in the rhino horn trade
Lucy Vigne and Esmond Martin
59 Landscape-level assessment of the distribution of the Sumatran rhinoceros in Bukit Barisan Selatan National Park, Sumatra
Wulan Pusparini and Hariyo T Wibisono
S p e c i e SS u r v i v a l
c o m m i S S i o n
Cover: African rhino in Kruger National Park, South Africa
Credit: ©Bibhab K Talukdar

January – June 2013 No. 53
Journal of the African Elephant,
African Rhino and
Asian Rhino Specialist Groups
66 Desert-dwelling African elephants (Loxodonta africana) in Namibia dig wells to purify drinking water
Eva M Ramey, Rob R Ramey, Laura M Brown and Scott T Kelley
73 Two-choice discrimination learning in African elephants (Loxodonta africana)
Charles W Hyatt
81 Elephant population trends and associated factors: a review of the situation in western Ghana
Emmanuel Danquah and Samuel K Oppong
91 Management
91 Systems approach towards surface water distribution in Kruger National Park, South Africa
Izak PJ Smit
99 Field note
99 Participatory survey of elephants (Loxodonta africana) in Kamuku National Park and its environs, northwestern Nigeria
TO Amusa, JA Ogunjobi, SK Halidu, IB Likita, AR Muraina, IJ Fxentirimam and AM Gunu
103 MIKE / ETIS updates/MIse à jour de MIKE/ ETIS
103 CITES-MIKE update Julian Blanc
111 Progress in implementing the Elephant Trade Information System (ETIS)/
Avancement dans la mise en œuvre du Système d’Information sur le Trafic des Eléphants (ETIS)
Tom Milliken
118 Guidelines for contributors
Views expressed in Pachyderm are those of the individual authors and do not necessarily reflect those of IUCN, the European Union, the Species Survival Commission or any of the three Specialist Groups responsible for producing Pachyderm (the African Elephant Specialist Group, the African Rhino Specialist Group and the Asian Rhino Specialist Group).

Acknowledgements
The production of this issue of Pachyderm was possible through contributions from a number of organizations and individuals. In particular, we would like to thank the following:
January – June 2013 No. 53
Journal of the African Elephant,
African Rhino and
Asian Rhino Specialist Groups
EUROPEAN COMMISSION


Pachyderm No. 53 January–June 2013 1
African Elephant Specialist Group report
As I reported at the close of 2012, the current pressures on elephants from poaching and illegal ivory trade continue to grow. Awareness of the problem and the magnitude of its scale are growing and various calls to action are being made, but truly game-changing measures have yet to be forthcoming. A number of new initiatives, broadly focused on wildlife crime, have been started; most agree that if we cannot solve the challenges facing the African elephant, the probability of helping other species will be far lower.
African Elephant SummitIn Pachyderm 52, I reported on Resolution WCC-2012-RES-025-EN, adopted at IUCN’s 5th World Conservation Congress, calling on IUCN to convene a high-level meeting on elephant poaching and the illegal ivory trade. High-level commitment to the urgent measures is required at all points in the illegal ivory value chain, including in African elephant range States, ivory transit States and in major consuming States, to remove the barriers to effectively protect elephants and lead to rapid and significant reduction in the amounts of illegal ivory in trade.
We have been working with the IUCN Secretariat to raise funds for this African Elephant Summit and to secure an appropriate venue and co-convening government host. We are now partnering with the government of Tanzania, a key elephant range State, to host the meeting. The meeting will likely be held in early November 2013. We have
African Elephant Specialist Group reportRapport du Groupe des Specialistes des Eléphants d’Afrique
Holly T Dublin, Chair/Président
IUCN/SSC African Elephant Specialist Group, PO Box 68200 – 00200, Nairobi, Kenya email: [email protected]
Comme je l’ai signalé à la fin de 2012, les pressions actuelles sur les éléphants à cause du braconnage et du commerce illégal de l’ivoire continuent à augmenter. La sensibilisation au problème et à son ampleur augmentent et divers appels à l’action sont lancés, mais des mesures vraiment décisives sont encore à venir. Un certain nombre de nouvelles initiatives largement axées sur les crimes de la faune, ont été lancés, la plupart des gens s’accordent à dire que si nous n’arrivons pas à résoudre les défis auxquels l’éléphant d’Afrique est confronté, la probabilité d’aider d’autres espèces sera beaucoup plus faible.
Sommet sur l’Eléphant d’AfriqueDans le numéro 52 de Pachyderm, j’ai signalé la Résolution WCC-2012-RES-025-FR, adoptée lors du 5ème Congrès Mondial de la Nature de l’UICN, appelant l’UICN à organiser une réunion de haut niveau sur le braconnage des éléphants et le commerce de l’ivoire. Il faut un engagement de haut niveau sur des mesures urgentes à tous les points de la chaîne de valeur de l’ivoire illégal, y compris dans les états de l’aire de répartition de l’éléphant d’Afrique, les états de transit de l’ivoire et les principaux pays consommateurs, pour éliminer les obstacles à la protection efficace des éléphants et mener à une réduction rapide et significative des quantités d’ivoire illégal dans le commerce.
Nous travaillons avec le Secrétariat de l’UICN pour collecter des fonds pour ce sommet de l’éléphant d’Afrique et obtenir un lieu approprié et un gouvernement coorganisateur. Nous sommes maintenant en partenariat avec le gouvernement de Tanzanie, un Etat clé de l’aire de répartition des éléphants, qui doit accueillir la réunion.
CHAIR REPORTS/RAPPORTS DES PRESIDENTS

2 Pachyderm No. 53 January–June 2013
Dublin
also been working closely with colleagues in a number of other institutions to ensure that there is synergy between the many different meetings and initiatives on wildlife crime that are currently in motion. Seed funding has now been secured, and a small team of consultants hired to help with preparing the meeting. Ali Kaka, regional director for IUCN in Eastern and Southern Africa, and I are serving as the summit co-leaders, while Diane Skinner has been tasked with coordinating IUCN’s effort. This will necessarily reduce the amount of time available from the AfESG Secretariat for the core work of the Group but should only be a temporary inconvenience, and will, hopefully, contribute to bringing crucial actors together to agree on actions and timeframes.
We will be maintaining a page on our website (http://iucn.org/african_elephant) to keep everyone updated on the summit.
The African and Asian Elephant DatabaseIn March we published a provisional 2012 update of the African Elephant Database (AAED). This included all new data available by the end of 2012. The update was reviewed by our Data Review Working Group and is available at: http://www.elephantdatabase.org/preview _report/2013_africa/Loxodonta_africana/2012/Africa. While the quality, frequency and coverage of population surveys have improved in recent years in Central Africa, this is not the case for some of Africa’s largest and most important individual elephant populations in southern and eastern Africa. This has resulted in a worrying decline in overall data quality in the database.
We are now bringing this ‘provisional’ version up to date to include all surveys that were conducted in 2012. Peter Mwangi, our database officer, has been in close contact with a number of data providers, who have been responsive in providing new information, as well as spatial data. This is a definite advantage of the new online system—there is no doubt that being able to see the information being used has increased the responsiveness of data providers. Since the provisional update was published in March, we have received and entered surveys for the W–Arly–Pendjari Ecosystem in West Africa, the
La réunion se tiendra probablement au début de novembre 2013. Nous travaillons également en étroite collaboration avec des collègues dans d’autres institutions pour assurer qu’il existe une synergie entre les différentes réunions et initiatives relatives au crime de la faune actuellement en cours. Le financement pour le démarrage a été promis, et une petite équipe de consultants recrutés pour aider à la préparation de la réunion. Ali Kaka, Directeur régional de l’UICN en Afrique orientale et australe, et moi nous sommes des co-leaders, tandis que Diane Skinner a été chargée de coordonner les efforts de l’UICN. Cela réduirait nécessairement son temps disponible auprès du Secrétariat du GSEAf pour les principales activités du groupe, mais cela ne devrait être qu’un inconvénient temporaire, et contribuera par contre au rapprochement avec les acteurs cruciaux afin qu’on se mette d’accord sur les actions et les délais à suivre.
Nous maintiendrons une page sur notre site (https://iucn.org/african_elephant) pour mettre tout le monde au courant sur le sommet.
La base de données de l’éléphant d’Afrique et d’AsieAu mois de mars, nous avons publié la mise à jour provisoire de 2012 de la Base de Données de l’Eléphant d’Afrique (BDEA) comprenant toutes les nouvelles données disponibles jusqu’à la fin de 2012. Cette mise à jour a été examinée par notre Groupe de travail sur la révision des données et elle est disponible à l’adresse: http://www.elephantdatabase.org/preview_report/2013_africa/Loxodonta_africana/2012/Africa
Alors que la qualité, la fréquence et la couverture des études de population se sont améliorées ces dernières années pour l’Afrique centrale, ce n’est pas le cas pour certaines des populations d’éléphants les plus importantes en Afrique australe et orientale. Il en a résulté une baisse inquiétante de la qualité globale des données dans la base de données.
Nous mettons maintenant à jour cette version «provisoire» afin d’inclure toutes les études qui ont été menées en 2012. Peter reste en contact étroit avec des fournisseurs de données qui veulent bien donner de nouvelles informations, ainsi que les données spatiales. C’est un avantage certain du nouveau système en ligne – il n’y a aucun doute que la possibilité de voir les informations utilisées encourage les gens à fournir des données. Depuis la publication de la mise à jour provisoire en mars, nous avons reçu et saisi les études pour l’écosystème W-Arly-Pendjari en Afrique de l’Ouest, l’écosystème
Pachyderm No. 53 January–June 2013 3
African Elephant Specialist Group report
Mapungubwe Ecosystem in southern Africa; Bayang-Mbo Wildlife Sanctuary in Cameroon; Conkouati–Douli National Park and the Batanga Ecosystem in Congo; Comoé Landscape in Côte d’Ivoire; Gambella National Park in Ethiopia; Mwea National Reserve, Shimba Hills, Laikipia–Samburu, and Amboseli Ecosystems in Kenya; Liwonde in Malawi; Gilé Landscape in Mozambique; and the Madi Landscape in Uganda. We are still following up on some key surveys conducted in 2011 and 2012 and hope to have as complete a picture as possible by the end of 2013 when we finalize data entry and analysis to derive the overall continental estimates.
Time lags between surveys and reporting, irregular intervals between surveys as well as various techniques and a lack of consistent sampling across the range have always made comparability between years at site, population or national level difficult to calculate in any meaningful way. Nonetheless, demand for trend data continues and we have long wanted to respond. As a first attempt to investigate what might be possible, we are exploring partnerships with academic institutions to work on initial population-trend modelling of the African Elephant Database.
Peter has a number of other tasks on his plate this year, including updating the range map and continuing to maintain and develop the database system that lies behind the public interface.
CITES CoP16The 16th meeting of the Conference of Parties (CoP) to CITES was held 3–15 March 2013 in Bangkok, Thailand. Diane Skinner and I attended CoP as well as the two Standing Committee meetings held directly before and after CoP. I have highlighted the major outcomes here. Many of the processes we have been following and assisting with since CoP15 in Doha were moved forward or finalized at CoP16, including the revision of Resolution Conf. 10.10.
I presented data from the provisional 2012 update of the African Elephant Database, which along with the latest analyses from MIKE and ETIS showed a worrying picture of the pressures on African elephants. A number of CITES provisions were strengthened, and a group of countries was requested to show further evidence of their
de Mapungubwe en Afrique du Sud, le Sanctuaire de la Faune de Bayang-Mbo au Cameroun, le parc national de Conkouati-Douli et l’écosystème de Batanga au Congo, le paysage de la Comoé en Côte d’Ivoire, le parc national de Gambella en Ethiopie, la Réserve nationale de Mwea, les écosystèmes de Shimba Hills, Laikipia-Samburu, et Amboseli au Kenya, Liwonde au Malawi, le paysage de Gilé au Mozambique et le paysage de Madi en Ouganda. Nous suivons toujours certaines études importantes menées en 2011 et 2012 et nous espérons avoir des renseignements aussi complets que possible jusqu’à la fin de l’année 2013 ; après quoi nous terminerons la saisie et l’analyse des données pour calculer les estimations globales du continent.
Le décalage entre les recensements et les rapports, les intervalles irréguliers entre les recensements ainsi que les diverses techniques et un manque de toute forme d’échantillonnage systématique à travers tout l’habitat font qu’il est difficile de calculer la comparabilité entre les années au niveau du site, au niveau de la population ou au niveau national de manière fiable. Néanmoins, l’on continue à demander des données de tendance et nous avons longtemps voulu répondre. Comme une première tentative pour savoir ce qui serait possible, nous explorons des partenariats avec des institutions universitaires en vue de travailler d’abord sur la modélisation des tendances de population de la base de données de l’éléphant d’Afrique.
Peter a de nombreuses autres tâches à faire cette année, y compris la mise à jour de la carte de l’habitat et il continue à maintenir et à développer le système de la base de données qui se trouve derrière l’interface publique.
La CdP 16 de la CITESLa 16ème réunion de la Conférence des Parties (CdP) à la CITES a eu lieu du 3 au 15 mars 2013 à Bangkok, en Thaïlande. Diane Skinner et moi avons participé à la CdP ainsi qu’aux deux réunions du Comité permanent tenues directement avant et après la CdP. Ici, j’ai mis en exergue les principaux résultats. Beaucoup de processus que nous avons suivis et auxquels nous avons participé depuis la CdP15 à Doha ont été avancés ou finalisés à la CdP16, y compris la révision de la Résolution Conf. 10.10.
J’ai présenté les données de la mise à jour provisoire de 2012 de la base de données de l’éléphant d’Afrique, qui, avec les dernières analyses de MIKE et ETIS, ont révélé des pressions inquiétantes sur les éléphants d’Afrique. Un certain nombre de dispositions de la CITES ont été renforcés, et un groupe de pays a été invité à présenter une nouvelle preuve d’engagement à appliquer la Convention,
4 Pachyderm No. 53 January–June 2013
Dublin
commitment to implementing the convention, including eight action plans from those countries most heavily implicated in the large-scale ivory trade: China, Kenya, Malaysia, the Philippines, Tanzania, Thailand, Uganda and Viet Nam. These action plans, all submitted by mid-May, outline measures to be undertaken by the 65th meeting of the Standing Committee in July 2014. Resolution Conf. 10.10, the Resolution outlining the CITES provisions for trade in elephant specimens, was updated and strengthened to include annual reporting on ivory stockpiles, a definition of large-scale ivory seizures (500 kg), text on the illegal trade in live elephants, recommendations for building awareness and reducing demand, and recommendations for forensic testing of ivory seizures.
Decision 14.78 was extended, continuing AfESG’s mandate to report with MIKE and ETIS to the Standing Committee on the status of elephant populations. Decision 14.77, outlining a process towards a decision-making mechanism for a process of trade in ivory, was extended to CoP17 in 2016. A working group of Parties will be formed under the auspices of the Standing Committee to continue work on this Decision. A new Resolution on the African Elephant Action Plan and the African Elephant Fund was adopted, including acknowledging AfESG’s role in its development. A new Decision was adopted outlining a process to review the Panel of Experts process for future proposals for downlisting African elephant populations. This work will be conducted by a working group operating under the auspices of the Standing Committee.
Finally, a number of new Decisions were adopted that should be of interest to our readership; these need to be completed before CoP17 and include—• formation of a CITES Ivory Enforcement Task
Force• examination of DNA-based and forensic
identification techniques for sourcing and ageing ivory, as well as the identification of relevant facilities
• a workshop for Parties on the use of controlled deliveries
• development of an anti-money-laundering and asset-recovery manual with a specific focus on wildlife crimes
y compris huit plans d’action par des pays les plus fortement impliqués dans le commerce de l’ivoire à grande échelle: la Chine, le Kenya, la Malaisie, les Philippines, la Tanzanie, la Thaïlande, l’Ouganda et le Viet Nam. Ces plans d’action, tous présentés par la mi-mai, définissent les mesures à entreprendre avant la 65ème réunion du Comité permanent en juillet 2014. La Résolution Conf. 10.10, qui définit les dispositions de la CITES sur le commerce des spécimens d’éléphants, a été mise à jour et renforcée pour inclure des rapports annuels sur les stocks d’ivoire, une définition de saisies d’ivoire à grande échelle (500 kg), un texte sur le commerce illégal des éléphants vivants, des recommandations sur la sensibilisation et la réduction de la demande, et des recommandations pour les tests criminalistiques des saisies d’ivoire.
La décision 14.78 a été prolongée, en continuant le mandat du GSEAf de faire rapport ensemble avec MIKE et la CITES au Comité permanent sur le statut des populations d’éléphants. La décision 14.77, définissant un processus vers un mécanisme de prise de décisions pour un processus de commerce de l’ivoire, a été prolongée jusqu’à la CdP17 en 2016. Un groupe de travail des Parties sera formé sous les auspices du Comité permanent pour poursuivre les travaux sur cette décision. Une nouvelle résolution sur le Plan d’action pour l’éléphant d’Afrique et le Fonds pour l’éléphant d’Afrique a été adoptée, en reconnaissant notamment le rôle du GSEAf dans son développement. Une nouvelle décision qui décrit un processus de révision du processus du Groupe d’experts a été adoptée pour les futures propositions de déclassement des populations des éléphants d’Afrique. Ce travail sera effectué par un groupe de travail opérant sous les auspices du Comité permanent. Enfin, plusieurs décisions qui ont été adoptées devraient intéresser nos lecteurs ; celles-ci doivent être achevées avant la CdP17 et comprennent:• Formation d’un groupe spécial de la CITES pour la
mise en vigueur sur l’ivoire• Examen des techniques d’identification basées sur
l’ADN et la criminalistique pour connaître la source et la date de l’ivoire, ainsi que l’identification des équipements concernés
• Un atelier pour les Parties sur l’utilisation des livraisons surveillées
• Elaboration d’un manuel d’anti-blanchiment d’argent et de récupération des biens avec un accent particulier sur les crimes de la faune
• Rapports par des pays identifiés comme de préoccupation « secondaire » et « tertiaire » par l’analyse ETIS sur leur mise en œuvre des dispositions de la CITES en matière de contrôle du commerce de
Pachyderm No. 53 January–June 2013 5
African Elephant Specialist Group report
• reporting by countries identified as ‘secondary’ and ‘tertiary’ concern by the ETIS analysis on their implementation of CITES provisions concerning control of trade in elephant ivory and ivory markets, and potential development of detailed action plans
• a requirement for the CITES Secretary General to cooperate with the United Nations Office on Drugs and Crime regarding the levels of illegal killing and the related illegal trade in elephant ivory, and the relationship of this trade to national security concerns
• a specific requirement for Parties, in future, to submit samples from large-scale seizures (500 kg or more) for forensic analysis, and where possible to submit samples from large seizures made over the past 24 months.
Update on the CITES MIKE and ETIS programmesAt CoP, we launched Elephants in the dust: the African elephant crisis, a joint report from CITES, IUCN, TRAFFIC and UNEP, which updated the joint reports from IUCN, MIKE and ETIS to the 61st and 62nd meetings of the Standing Committee and presented the results in a formal publication with high-resolution images and info-graphics.
We continue to work closely with both MIKE and ETIS on programme matters. We are providing technical support to the current Phase 3.0 of MIKE in Africa, which will run until the end of 2014. In addition to continuing our joint reporting to the Standing Committee under Decision 14.78 (Rev. CoP16) we will also be working with MIKE and ETIS to develop further analytical links along the entire value chain of illegal ivory. The MIKE-ETIS Subgroup was re-established at CITES CoP16 and we will continue to be designated observers on this important governance structure.
PachydermPachyderm 53 provides a number of interesting articles. In addition to our usual updates from MIKE and ETIS, we have three papers providing updates on the status of particular populations—in the Tsavo–Mkomazi ecosystem in Kenya
l’ivoire d’éléphant et des marchés d’ivoire ainsi que le développement potentiel des plans d’action détaillés
• Une obligation pour le Secrétaire général de la CITES de coopérer avec l’Office des Nations Unies contre la Drogue et le Crime (ONUDC) en ce qui concerne les niveaux de braconnage et le commerce illégal lié à l’ivoire d’éléphant et la relation de ce commerce avec les préoccupations de sécurité nationale
• Une obligation spéciale pour les Parties, à l’avenir, de présenter des échantillons de saisies à grande échelle (500 kg ou plus) pour l’analyse criminalistique, et si possible soumettre des échantillons à partir des saisies importantes effectuées au cours des 24 derniers mois.
Mise à jour sur les programmes ETIS et MIKE de la CITESA la CdP, nous avons lancé « Eléphants dans la poussière: la crise africaine de l’éléphant », un rapport conjoint de la CITES, de l’UICN, de TRAFFIC et du PNUE, qui actualise les rapports conjoints de l’UICN, MIKE et ETIS aux 61ème et 62ème sessions du Comité permanent et nous avons présenté les résultats dans une publication officielle contenant des images et des graphiques informatiques haute résolution.
Nous continuons à travailler en étroite collaboration avec MIKE et ETIS sur les questions du programme. Nous soutenons la 3ème phase en cours de MIKE en Afrique, qui continuera jusqu’à la fin de 2014. En plus de nos rapports conjoints devant le Comité permanent conformément à la décision 14.78 (Rev. CoP16), nous allons également travailler avec MIKE et ETIS pour développer des liens plus analytiques sur toute la chaîne de valeur de l’ivoire illégal. Le sous-groupe MIKE-ETIS a été rétabli à la CdP16 de la CITES, et nous continuerons à être désignés comme des observateurs au sein de cette structure importante de gouvernance.
PachydermLe numéro 53 de Pachyderm offre plusieurs articles intéressants. En plus de nos mises à jour habituelles de MIKE et d’ETIS, il y a trois documents comprenant des mises à jour sur l’état de certaines populations dans l’écosystème Tsavo-Mkomazi au Kenya et en Tanzanie, dans les zones d’Ankasa, de Bia et de Goaso au Ghana occidental, et dans la zone de Kamuku du nord-ouest du Nigeria. Inogwabini et al. nous donnent une étude intéressante sur l’impact des éléphants sur la structure
6 Pachyderm No. 53 January–June 2013
Dublin
and Tanzania, in western Ghana’s Ankasa, Bia and Goaso areas, and in the Kamuku area of northwestern Nigeria. Inogwabini et al. provide us with a useful study on the impact of elephants on the physical structure of the forest in Salonga and Lac Tumba areas of the Democratic Republic of Congo, while Smit gives insight into the SANParks strategy to modify water provision in Kruger National Park in South Africa to mitigate the impact of locally overabundant elephant populations. Finally, Ramey et al. provide observations on the water-seeking behaviour of desert elephants in Namibia.
We currently have over 20 African elephant manuscripts pending in the system, and they continue to flow in. Our readership levels are high—the majority of articles from the most recent issue were viewed over 100 times, with some being downloaded as many as 700 times. Funding for Pachyderm 53 and 54 is secured, but as ever we cannot promise anything beyond that.
ConclusionThe AfESG member appointments for 2013 to 2016 have been finalized. The full list is available online (http://www.iucn.org/about/work/programmes/species/who_we_are/ssc_specialist_groups_and_red_list_authorities_directory/mammals/african_elephant/members/member_list/). We have added a number of new members, and look forward to working with our newly reconstituted Group.
physique dans la forêt de Salonga et près du Lac Tumba de la République Démocratique du Congo, alors que Smit donne un aperçu de la stratégie des parcs nationaux d’Afrique du Sud pour modifier l’approvisionnement en eau dans le Parc national Kruger en Afrique du Sud afin d’atténuer l’impact des populations d’éléphants surabondantes localement. Enfin, Ramey et al. fournissent des observations sur le comportement des éléphants du désert en quête d’eau en Namibie.
Nous avons actuellement plus de 20 manuscrits sur les éléphants d’Afrique en attente dans le système, et ils continuent d’affluer. Nos niveaux de lectorat sont élevés - la majorité des articles dans notre dernier numéro ont été visionnés plus de 100 fois, et certains ont été téléchargés jusqu’à 700 fois. Nous avons obtenu le financement pour les numéros 53 et 54 de Pachyderme, mais comme toujours, nous ne pouvons rien promettre au-delà.
ConclusionLes nominations des membres du GSEAf pour 2013 à 2016 ont été finalisées. La liste complète est disponible en ligne (http://www.iucn.org/about/work/programmes/species/who_we_are/ssc_specialist_groups_and_red_list_authorities_directory/mammals/african_elephant/members/member_list/). Nous avons ajouté de nouveaux membres, et nous sommes impatients de travailler avec notre groupe nouvellement reconstitué.

Pachyderm No. 53 January–June 2013 7
African Rhino Specialist Group report
Eleventh meeting of AfRSG at Naro Moru, KenyaThe 11th meeting of AfRSG was held at Naro Moru River Lodge, Kenya, 17–22 February 2013. The meeting was officially opened by the Hon. Dr Noah Wekesa, minister for Forestry and Wildlife.
With its 62 delegates, this was the largest meeting to date for the group. The meeting largely followed previous formats and was divided into range State reports, rhino support programmes, CITES and IUCN, responses to poaching, rhino horn trade, demand reduction, rhino economics, security mechanisms and techniques, management techniques, focal rhino populations, workshops, and the members meeting. As a new approach, a day was also opened to Kenyan invitees associated with rhino conservation.
Rhino populationsThe collation of range State rhino population and poaching data revealed that rhino poaching, at a continental scale, had increased from 1.17 rhinos/day in 2010 to 2.04 rhinos/day in 2012, with a total of 745 rhinos lost in 2012 alone (see Table 2 in Emslie 2013). The total number of rhinos lost to poaching from 2006 to date is a staggering 2,387 animals! As will be discussed below in more detail, South Africa topped the actual losses (1,805 animals since 2006) with 3.19% of its population lost to poaching in 2012, en par with two of the other ‘Big 4’ rhino range States: Kenya (2.83%) and Zimbabwe (4.11%). Namibia remains encouragingly low, with a minute 0.04% lost in 2012. Malawi with its small black rhino Diceros bicornis population has lost two animals, while Mozambique was assessed to have lost effectively all its rhinos with the highest relative percentage
African Rhino Specialist Group reportRapport du Groupe des Spécialistes des Rhinocéros d’Afrique
Mike Knight, Chair/Président
Park Planning and Development, South African National Parks, PO Box 76693, and Centre for African Conservation Ecology, Nelson Mandela Metropolitan University, Port Elizabeth 6013, South Africaemail: [email protected]
Onzième réunion du GSRAf à Naro Moru, KenyaLa 11ème réunion du GSRAf a eu lieu à Naro Moru River Lodge au Kenya, du 17 au 22 février 2013. La réunion a été officiellement ouverte par l’honorable Dr. Noah Wekesa, Ministre des Forêts et de la Faune.
Avec ses 62 délégués, c’était la plus grande rencontre à ce jour pour le groupe. La réunion a largement suivi les formats antérieurs étant divisée en rapports sur des Etats de l’aire de répartition, programmes de soutien au rhinocéros, la CITES et l’UICN, réponses au braconnage, commerce de la corne de rhinocéros, réduction de la demande, économie relative aux rhinocéros, mécanismes et les techniques de sécurité, techniques de gestion, populations focales de rhinocéros, ateliers, et enfin, la réunion des membres. Comme une nouvelle approche, une journée a également été ouverte aux invités du Kenya associés à la conservation des rhinocéros.
Les populations de rhinocérosLa collation de la population de rhinocéros des Etats de l’aire de répartition et les données de braconnage ont révélé que le braconnage de rhinocéros avait augmenté de 1,17 rhinocéros/jour en 2010 à 2,04 rhinocéros/jour en 2012 à l’échelle continentale, avec un total de 745 rhinocéros perdus en 2012 seulement (voir tableau 2 dans Emslie 2013). Le nombre total de rhinocéros perdus au braconnage depuis 2006 à ce jour est un chiffre stupéfiant de 2.387 animaux! Comme on le verra plus loin en détail, l’Afrique du Sud a perdu le plus grand nombre (1.805 animaux depuis 2006) avec 3,19% de sa population perdue au braconnage en 2012, en égalité avec deux autres états de l’aire de répartition parmi les « 4 Grands »: le Kenya (2,83%) et le Zimbabwe (4,11%). Le niveau en Namibie reste de manière encourageante faible, avec une perde négligeable de 0,04% en 2012. Le Malawi avec sa petite population de rhinocéros noir Diceros bicornis a perdu
8 Pachyderm No. 53 January–June 2013
Knight
loss in 2012. This would make it the first former African rhino range State to have completely lost its rhinos for a second time. Any rhinos relocated into Mozambique from Kruger also appear to have a very limited life expectancy.
However, on a positive note and despite the increasing poaching, Africa’s rhino populations marginally increased (0.8% annual increase) with the continent’s population of black and white rhinos increasing to a total of 25,460, from 25,050 in 2010 (see Table 1 in Emslie 2013), which is down from the 4.8% annual increase between 2007 and 2010, and the 6.7% for the period prior to poaching. Maintaining this growing population is critical to providing the necessary buffer against poaching while alternative management options are explored and implemented. The Big 4 (South Africa, Namibia, Kenya and Zimbabwe) collectively control 98% of these rhinos. Black rhinos increased to 5,055 in 2012 from 4,880 in 2010 (1.7% annual increase), with the Big 4 range States accounting for 95.8% of the animals. South Africa and Namibia had the most black rhinos with 2,044 and 1,750, respectively. Kenya has the largest D.b. michaeli population with 630 animals. Only the Zimbabwe population decreased from the 2010 estimate. Numbers of the southern white rhinos (Ceratotherium simum simum) also witnessed a marginal annual increase of 0.5% from 20,165 in 2010 to 20,405 in 2012, with South Africa holding the most with 18,910 animals. Again, among the Big 4 range countries, only Zimbabwe showed a decline from the 2010 population estimate, but encouragingly the Zimbabwe lowveld populations continue to increase. If poaching and its organized criminal syndicates cannot be halted, at the current escalating poaching rate, it is expected that the continental rhino populations could decline as soon as 2015–16.
Rhino managementThe main points that emerged from the range State reports included the increased involvement of criminal syndicates in rhino poaching. Although poaching is dealt with in detail below, there was an identified need for more information on detection rates to better understand and assess counter-poaching efficiencies. In addition, the undesirably long times to approve rhino plans by
deux animaux, tandis qu’il paraît que le Mozambique a en réalité perdu tous ses rhinocéros avec le plus grand pourcentage de perte en 2012. Il serait ainsi le premier ancien état de l’aire de répartition du rhinocéros africain à avoir complètement perdu ses rhinocéros pour la deuxième fois. Tous les rhinocéros relocalisés au Mozambique à partir de Kruger semblent également avoir une espérance de vie très limitée.
Toutefois, sur une note positive et malgré le braconnage croissant, les populations de rhinocéros d’Afrique ont légèrement augmenté (0,8% d’augmentation annuelle) avec la population continentale des rhinocéros noirs et blancs augmentant jusqu’à un total de 25.460, de 25.050 en 2010 (voir tableau 1 dans Emslie 2013), moins que la hausse annuelle de 4,8% entre 2007 et 2010, et de 6,7% pour la période antérieure au braconnage. Il est essentiel de maintenir cette croissance pour contrer le braconnage pendant que d’autres options de gestion sont explorées et mises en œuvre. Les 4 Grands (l’Afrique du Sud, la Namibie, le Kenya et le Zimbabwe) contrôlent collectivement 98% de ces rhinocéros. Les rhinocéros noirs ont augmenté de 5.055 en 2012 à 4.880 en 2010 (1,7% d’augmentation annuelle), avec les 4 Grands totalisant 95,8% des animaux. L’Afrique du Sud et la Namibie avaient le plus grand nombre (2,044 et 1,750 respectivement). Le Kenya possède la plus grande population de D. b. michaeli avec 630 animaux. Seule la population du Zimbabwe a décru par rapport à l’estimation de 2010. Le nombre de rhinocéros blancs du sud (Ceratotherium simum simum) a également connu une légère augmentation annuelle de 0,5% à partir de 20.165 en 2010 à 20.405 en 2012, et l’Afrique du Sud avait le plus grand nombre - 18.910 animaux. Encore une fois, parmi les 4 Grands, seul le Zimbabwe a enregistré une baisse par rapport à l’estimation de la population en 2010, mais de manière encourageante, les populations du Lowveld au Zimbabwe continuent d’augmenter. Si le braconnage et ses syndicats du crime organisé ne peuvent pas être arrêtés, au rythme actuel du braconnage qui s’intensifie, il est prévu que les populations de rhinocéros continentales pourraient baisser dès 2015–16.
La gestion des RhinocérosLes principaux points qui ressortent des rapports des états de l’aire de distribution font preuve de la participation accrue des organisations criminelles dans le braconnage des rhinocéros. Bien que le braconnage soit traité en détail ci-dessous, il faut plus d’informations sur les taux de détection afin de mieux comprendre et évaluer l’efficacité

Pachyderm No. 53 January–June 2013 9
African Rhino Specialist Group report
national authorities such as in Zimbabwe (which has subsequently approved its plan), Botswana and Malawi was noted as an issue. National up-to-date databases on rhino populations, criminal information and convictions were identified as essential in combating the international criminal syndicates. In the case of South Africa an integrated national, electronic database to facilitate rhino management activities was recognized as a necessity. Every effort should be made to use intelligence-led law enforcement to stop poachers before they kill rhinos. Concerns were raised about the lack of security and management of State rhino horn stocks in Africa and Europe, as these remain a relatively easy source of horn for the criminal syndicates. Outdated or inappropriate wildlife legislation unsuitable for addressing the rhino crisis was also a common theme that emerged at the meeting, with Mozambique a particular case in point. The status of the Asian rhinos was also presented to the group.
The Rhino Support Programme session included presentations on the WWF-funded Black Rhino Range Expansion Project (BRREP) and from a range of donors: WWF ARP, WWF-South Africa, International Rhino Foundation, Save the Rhino International, African Wildlife Foundation, Save Australia and a number of South African initiatives such as Rhino Action Group Effort, Stop-Rhino-Poaching and the Endangered Wildlife Trust. The BRREP programme has been particularly successful in continuing to provide suitably large founder populations of black rhinos to new large areas in South Africa. However, they want to expand their source populations beyond the current Ezemvelo-KwaZulu Wildlife and Eastern Cape Parks & Tourism populations. Elise Daffue from Stop-Rhino-Poaching was particularly noted for her single-handed contribution to many counter-poaching rhino efforts.
A major focus of the session on CITES and IUCN issues, dealt with in more detail below, was the Kenyan proposal to CITES CoP16 and a proposed possible alteration to it. During the official opening of the meeting, the Kenyan minister for Forestry and Wildlife asked for advice from AfRSG on the proposal. This generated considerable discussion within the group, which largely was not in support of the proposal’s wording for a number of reasons. This was primarily because the proposal was
des efforts anti-braconnage. En outre, on a noté que certaines autorités nationales mettent trop longtemps pour approuver les plans de rhinocéros, ex. celles du Zimbabwe (qui a par la suite approuvé le plan), du Botswana et du Malawi. Les bases de données nationales actualisées sur les populations de rhinocéros, les informations sur les criminels et les condamnations pénales ont été identifiées comme étant essentielles dans la lutte contre les organisations criminelles internationales. Dans le cas de l’Afrique du Sud, une base de données électronique nationale intégrée pour faciliter les activités de gestion des rhinocéros a été reconnue comme une nécessité. Tous les efforts doivent être déployés pour appliquer la loi basée sur le renseignement afin d’arrêter les braconniers avant qu’ils ne tuent les rhinocéros. Des préoccupations ont été soulevées au sujet de l’absence de sécurité et de gestion des stocks de cornes de rhinocéros appartenant à l’état en Afrique et en Europe, car ils demeurent une source relativement facile de corne pour les organisations criminelles. Une législation sur la faune dépassée ou inappropriée qui est inadaptée face à la crise du rhinocéros était également un thème commun qui a émergé lors de la réunion, le Mozambique étant un parfait exemple. La situation des rhinocéros d’Asie a également été présentée au groupe.
La session du Programme de soutien au rhinocéros comprenait des présentations sur le Projet d’Expansion de l’Habitat du Rhinocéros Noir financé par WWF (PEHRN) et plusieurs donateurs: WWF ARP, WWF-Afrique du Sud, Fondation Internationale pour le Rhinocéros (IRF), Save the Rhino International (SRI), la Fondation Africaine pour la Faune Sauvage (AWF), Save Australia et plusieurs initiatives sud-africaines telles que l’Effort du Groupe d’Action pour le Rhinocéros (RAGE) et Arrêter le braconnage du Rhinocéros et le Fonds d’Aide aux Espèces en voie de disparition (EWT). Le programme PEHRN a particulièrement bien réussi à fournir de grandes populations fondatrices de rhinocéros noirs dans de nouvelles grandes zones en Afrique du Sud. L’on veut étendre ces populations sources au-delà des populations actuelles dans les parcs d’Ezemvelo Kwazulu et du Cap Oriental. Mme Elise Daffue d’« Arrêter le Braconnage de Rhinocéros » a été notée en particulier pour la contribution qu’elle a faite toute seule à de nombreux efforts contre le braconnage des rhinocéros.
Un thème majeur de la session sur les questions de la CITES et de l’UICN, traité plus en détail ci-dessous, a été la proposition du Kenya à la CdP16 de la CITES et des modifications qui pourraient y être apportées. Lors de l’ouverture officielle de la réunion, le Ministre kenyan des
10 Pachyderm No. 53 January–June 2013
Knight
attempting to address a problem that had been largely solved, there was no good reason for Swaziland’s inclusion, and it was reasoned that the proposals, if accepted, would have a major negative impact on the southern African rhino populations and the wildlife industry as a whole, at the very time when increased incentives and revenue are needed to encourage continued rhino range expansion and fund expanded anti-poaching efforts. The feeling was that it would be counter-productive to address key rhino issues at CITES.
The responses to the poaching session, with contributions by South Africa, Kenya and Zimbabwe, were informative on progress and initiatives made thus far. South Africa highlighted its legislative changes to close the pseudo-hunting loopholes and their use of multiple pieces of legislation in prosecutions; Zimbabwe’s use of civil courts to prosecute rhino poachers was introduced as a novel approach, while Kenya mentioned its new strategy and planned changes to its wildlife legislation.
Rhino horn tradeThe session on rhino horn trade set the current scene with a detailed summary of the report by Milliken and Shaw (2012) on the international trade in rhino horn and how Viet Nam has grown to be the major consumer state at the moment. The summary also highlighted how corruption in the state and private wildlife sectors (especially in South Africa) was exacerbating the situation. Dr Naomi Doak presented her preliminary assessment of rhino horn consumption in Viet Nam—an area of study on which we had limited information. She emphasized that the value of rhino horn had expanded as a symbol of success and wealth, especially among the nouveau riche, and how entrepreneurs were using it for other purposes. Dr Esmond Martin’s insights on the trade in Nepal in particular emphasized how poaching has declined rapidly as a result of political will, better enforcement, improved legislation and greater community involvement. He also summarized the situation in Yemen, where rhino horn jambiyas were being replaced with alternatives and noted that since the dramatic spike in rhino horn prices Yemen was no longer an important player in rhino horn trade.
Forêts et de la Faune a demandé des conseils au GSRAf sur la proposition. Cela a suscité un débat important au sein du groupe, qui en grande partie n’appuyait pas la formulation de la proposition pour un certain nombre de raisons. La proposition traitait principalement un problème qui avait été en grande partie résolu; aussi, il n’y avait aucune raison d’y inclure le Swaziland et surtout la proposition pourrait avoir un impact majeur négatif sur le rhinocéros d’Afrique australe juste au moment où toute industrie de la faune a besoin de motivations et des recettes accrues pour encourager l’expansion continue de l’habitat de rhinocéros et pour financer les efforts contre le braconnage. Le sentiment était que ce serait contre-productif par rapport aux questions de rhinocéros clés à la CITES.
Les réponses à la séance de braconnage, avec la contribution de l’Afrique du Sud, du Kenya et du Zimbabwe, étaient informatives sur les progrès et les initiatives prises jusqu’à présent. L’Afrique du Sud a mis en évidence ses modifications législatives visant à combler les lacunes de pseudo-chasse et d’utiliser plusieurs textes de loi en matière de poursuites; l’utilisation par le Zimbabwe des tribunaux civils pour poursuivre les braconniers de rhinocéros a été présentée comme une nouvelle approche, tandis que le Kenya a mentionné sa nouvelle stratégie et des modifications à sa législation sur la faune qui sont prévues.
Le commerce des cornes de RhinocérosLa session sur le commerce des cornes de rhinocéros portait sur la situation actuelle avec un résumé détaillé du rapport Milliken et Shaw (2012) sur le commerce international des cornes de rhinocéros et comment le Viet Nam est devenu un état de grande consommation à présent. Le résumé a également souligné comment la corruption dans les secteurs public et privé de la faune (en particulier en Afrique du Sud) aggravait la situation. Le Dr. Naomi Doak a présenté son évaluation préliminaire sur la consommation de la corne de rhinocéros au Viet Nam, un domaine d’étude sur lequel nous avions peu d’informations. Elle a souligné le fait que la valeur de la corne s‘était accrue comme un symbole de réussite et de richesse, surtout parmi les nouveaux riches, et comment les entrepreneurs l’utilisaient à d’autres fins. Les idées du Dr. Esmond Martin sur le commerce au Népal ont montré la façon dont le braconnage avait diminué rapidement grâce à la volonté politique, une meilleure application de la loi, une amélioration de la législation et une plus grande implication de la communauté. Il a également

Pachyderm No. 53 January–June 2013 11
African Rhino Specialist Group report
Demand reduction and rhino economicsThe above session led to two related topics for discussion—demand reduction and rhino horn economics—as these have been identified as potential strategies to address the rhino crisis. The former covered the history and success of previous demand-reduction strategies in reducing the illegal demand for rhino horn and the proposed new strategy. The basic principles of the new strategy include the need for an objective and science-based approach, targeted solutions focused on key user-groups, wide and comprehensive stakeholder involvement and drawing on diverse expertise. To give it legitimacy, the new strategy should be led by national governments.
In the rhino economics session, Keith Lockwood’s presentation focused on elucidating the dynamics of the market for rhino horn through an interactive economics spreadsheet model, using the best current information. Although the model was still being developed, one of the key points to emerge using current information was that reducing the trade in horn alone probably would not totally reduce the amount of poaching or the demand for horn and may have to be done in combination with demand-reduction strategies. Mike t’Sas Rolfes further expanded on the potential impact of different rhino horn trading regimes on free-ranging rhino populations. The Chair also briefly presented a spreadsheet consolidating the perceived pros and cons of alternative rhino management strategies.
Rhino securitySessions on rhino security mechanisms and management techniques expanded into the day opened to Kenyan invitees. This open day allowed AfRSG to directly engage with many of the Kenyan private landowners and managers and Kenya Wildlife Service officers involved in rhino conservation. Presentations included feedback from the US Fish and Wildlife Service rhino security meeting in Namibia in 2012, the SADC Rhino and Elephant Security Group/Interpol Environmental Crime Working Group, and the recent development of smart phone applications to facilitate scene of crime data collection. There was also feedback on rhino poaching in KZN wildlife reserves, Kruger National Park (the epicentre of
résumé la situation au Yémen, où les jambiyas de corne de rhinocéros étaient remplacés par des alternatives. Il a noté que depuis la flambée spectaculaire des prix de cornes de rhinocéros, le Yémen n’était plus un acteur important dans ce commerce.
Réduction de la demande et économie relative aux rhinocéros
Cette session portait sur deux sujets liés pour discussion – la réduction de la demande et l’économie de la corne de rhinocéros, identifiés comme des stratégies possibles pour résoudre la crise du rhinocéros. Le premier a couvert l’histoire et le succès des stratégies précédentes de demande-réduction en réduisant la demande illicite de corne de rhinocéros et la nouvelle stratégie proposée. Les principes de base de la nouvelle stratégie comprennent la nécessité d’une approche objective et scientifique, des solutions axées sur les groupes d’utilisateurs clés, une large et complète participation des parties prenantes et le recours à l’expertise diversifiée. Pour lui donner de la légitimité, la nouvelle stratégie devrait être dirigée par les gouvernements nationaux.
Lors de la session sur l’économie relative aux rhinocéros, la présentation de Keith Lockwood a porté sur l’élucidation de la dynamique du marché de la corne de rhinocéros grâce à un modèle de tableur interactif d’économie qui utilisait les données actuelles. Même si le modèle était encore en cours d’élaboration, l’un des points clés à émerger des informations était que la réduction du commerce de la corne seulement ne réduirait probablement pas totalement le niveau de braconnage ou la demande de corne mais devait se faire en combinaison avec les stratégies de demande-réduction. Mike t’Sas Rolfes a élaboré sur l’impact potentiel des différents régimes commerciaux de la corne de rhinocéros sur les populations en liberté. Le Président a également présenté brièvement les avantages et les inconvénients perçus des autres stratégies de gestion de rhinocéros.
Sécurité des RhinocérosLes sessions sur les mécanismes de sécurité de rhinocéros et les techniques de gestion se sont prolongées jusqu’à la journée ouverte aux invités du Kenya. Cela a permis au GSRAf de s’engager directement avec de nombreux propriétaires terriens et gestionnaires privés kenyans et les agents du Service kenyan de la faune impliqués dans la conservation des rhinocéros. Les exposés comprenaient des informations émanant de la réunion du Service de la

12 Pachyderm No. 53 January–June 2013
Knight
rhino poaching) and the private sector’s responses to the poaching threat.
Rhino conservationIn addition, there were presentations on rhino conservation on private land in Kenya. The Northern Rangelands Trust model of community–private landowner partnership elicited considerable interest, given its positive outcome for wildlife and community cattle programmes. The use of the RhODISTM DNA profiling in support of counter-poaching and criminal prosecutions was well received, as were the proposed use of a bioinformatic tool and Spatial Monitoring and Reporting Tool (SMART) for managing and protecting rhinos. The discussions on the use of sniffer, tracker and attack dogs in several presentations led to considerable discussion, with the recommendation to use them more frequently and in innovative ways in detecting horn, tracking poachers and protecting rhinos. Presentations on the link between plant nutrients and population performance in black rhinoceros, and on factors affecting white rhino performance were well received. Latest information on veterinary and capture technology—a cornerstone of rhino management—continued to be an important contribution to the AfRSG agenda. Discussions on creating incentives for community involvement in rhino conservation remained important, particularly if we are to expand rhino range and community benefts.
The session on focal rhino populations had important presentations on the 2007–2011 SADC black rhino status report and the long-awaited survey of white rhinos on private land in South Africa. Importantly, it appears that white rhino numbers on private land have continued to increase, reaching close to 5,000 animals in 2012. The discussions on the mortality of black rhinos in North Luangwa National Park provided important lessons in introducing animals into difficult habitat conditions and problems that can arise following the failure to take down temporary fences in nutrient-poor habitat. Examples of biological management and security from Ol Jogi in Kenya offered numerous insights to the members on successful rhino management with almost all their rhinos being detected every day,
Pêche et de la Faune des Etats-Unis sur la sécurité des rhinocéros en Namibie en 2012, du Groupe de Sécurité du Rhinocéros et de l’éléphant de la SADC et du groupe de travail d’Interpol sur les crimes de l’environnement, et aussi le développement récent des applications de l’ordiphone pour faciliter la collecte des données au lieu du crime. Il y avait également des informations sur le braconnage des rhinocéros dans les réserves de la faune du Kwazulu Natal, le Parc national Kruger (l’épicentre du braconnage de rhinocéros) et les réponses du secteur privé à la menace du braconnage.
La conservation des rhinocérosEn outre, il y a eu des présentations sur la conservation des rhinocéros sur des terres privées au Kenya. Le modèle du Fonds des Pâturages du Nord du partenariat des propriétaires fonciers communautaires et privés a suscité un intérêt considérable, compte tenu de son résultat positif pour la faune et les programmes communautaires pour le bétail. L’utilisation du profilage d’ADN de RhODISTM à l’appui de la lutte contre le braconnage et les poursuites pénales a été bien accueillie, de même que l’utilisation proposée d’un outil bioinformatique et de l’Instrument de Suivi et de Reportage Spatial (SMART) pour la gestion et la protection des rhinocéros. Les discussions sur l’utilisation des chiens renifleurs, traqueurs et d’attaque dans plusieurs présentations ont conduit à de longues discussions, avec la recommandation de les utiliser plus fréquemment de manière innovatrice pour détecter des cornes, poursuivre des braconniers et protéger les rhinocéros. Des présentations sur le lien entre les éléments nutritifs et les performances de la population des rhinocéros noirs et sur les facteurs affectant la performance des rhinocéros blancs ont été bien accueillies. Les dernières informations sur la technologie vétérinaire et de capture - une étape importante de la gestion de rhinocéros – était une contribution importante à l’ordre du jour du GSRAf. Les discussions sur comment l’on peut inciter les communautés à participer dans la conservation des rhinocéros sont toujours importantes, surtout si nous voulons élargir l’habitat du rhinocéros et les avantages communautaires.
Des présentations importantes sur le Rapport de la SADC relatif à la situation du rhinocéros noir de 2007 à 2011 et l’étude tant attendue sur les rhinocéros blancs sur les terres privées en Afrique du Sud figuraient dans la session sur les populations focales. Il apparaît surtout que le nombre de rhinocéros blancs sur les terres privées a continué à augmenter, atteignant près de 5000
Pachyderm No. 53 January–June 2013 13
African Rhino Specialist Group report
as well as the innovative use of community cattle to ease possible social tensions and use them as an environmental rehabilitation tool. The community conservation model of rhinos in Kunene, Namibia, continues successfully. The presentation of the latest approved Kenyan rhino strategy was a fitting introduction to the planned field trip to Ol Pejeta Conservancy.
Ol Pejeta ConservancyThe half-day excursion to Ol Pejeta Conservancy provided ideal exposure to the northern white rhino C.s. cottoni programme, given that most members had never seen this subspecies, and the fact that these are the last four confirmed specimens in Africa. The programme remains a last-ditch attempt to get purebred northern white rhino calves, failing which they will be cross-bred with southern white animals to save at least some of the northern white rhino genes. A presentation on the use of carbon credits as a means to increase habitat for rhino conservation was delivered, and there was a demonstration on collecting samples for RhODISTM DNA profiling. It is critical that these protocols are closely followed to maintain the chain of evidence of the samples and facilitate their use in forensic evidence.
Alternative rhino management strategiesThe last session, which spanned two days, entailed a workshop that attempted to explore the use of a risk-benefit assessment to objectively assess alternative rhino management strategies, especially the Kenyan proposal to CITES CoP16 and a suggested alternative. Kenya proposed placing a zero export quota, until at least CoP18, on the export of hunting trophies from South Africa and Swaziland. The suggested alternative was for a zero export quota on the re-export of these hunting trophies until at least CoP18. The assessment concluded that if adopted these proposals would be a disincentive to the hunting industry and would discourage general rhino conservation, especially of the privately owned southern African rhino populations. This would also negatively affect essential revenue generation by some of the state conservation authorities.
animaux en 2012. Les discussions sur la mortalité des rhinocéros noirs au Parc national de Luangwa Nord ont fourni d’importantes leçons concernant l’introduction des animaux dans des conditions d’habitat difficiles et des problèmes qui peuvent survenir si on ne démantèle pas les clôtures temporaires dans les habitats pauvres en éléments nutritifs. Des exemples de gestion biologique et de sécurité d’Ol Jogi au Kenya ont offert de nombreuses idées aux membres sur la gestion réussie des rhinocéros grâce à la détection de presque tous les rhinocéros chaque jour, ainsi que l’utilisation innovatrice du bétail communautaire afin d’apaiser les tensions sociales possibles et comme un outil environnemental de réadaptation. Le modèle communautaire de conservation des rhinocéros à Kunene, en Namibie se poursuit avec succès. La présentation de la dernière stratégie approuvée pour le rhinocéros au Kenya était une introduction appropriée pour l’excursion prévue à la Conservation d’Ol Pejeta.
Conservation d’Ol PejetaL’excursion d’une demi-journée à la Conservation d’Ol Pejeta a fourni une exposition idéale au programme du rhinocéros blanc du nord, C.S. cottoni, étant donné que la plupart des membres n’avaient jamais vu cette sous-espèce, et le fait que ce sont les quatre derniers spécimens confirmés en Afrique. Le programme reste une dernière tentative d’obtenir des bébés rhinocéros blancs du nord purs, faute de quoi ils seront croisés avec des animaux blancs du sud afin de sauver au moins une partie des gènes de rhinocéros blancs du nord. Une présentation sur l’utilisation des crédits de carbone comme un moyen d’accroître l’habitat pour conserver des rhinocéros a été faite, et il y avait une démonstration sur la collecte d’échantillons pour le profilage de l’ADN de RhODISTM. Il est essentiel que ces protocoles soient suivis de près afin de maintenir la chaîne des preuves des échantillons et faciliter leur utilisation en tant que preuves médico-légales.
D’autres stratégies de gestion des rhinocérosLa dernière session, qui a duré deux jours était un atelier qui a tenté d’explorer l’utilisation d’une évaluation des risques-avantages pour analyser objectivement les autres stratégies de gestion du rhinocéros, notamment la proposition du Kenya à la CdP16 de la CITES et une alternative suggérée. Le Kenya a proposé de placer un quota nul d’exportation au moins jusqu’à la CdP18, sur l’exportation des trophées de chasse de l’Afrique du Sud et du Swaziland. L’alternative proposée était d’un quota
14 Pachyderm No. 53 January–June 2013
Knight
A members meeting was also held. Given the poaching threat and the need to explore alternative management strategies for rhinos, the group membership has expanded to 50 members, broadening the diversity of expertise to include more NGO programme managers, resource economists and private rhino owners and managers. The need to further broaden the group to include consumer state representation was strongly encouraged.
Besides the breadth of issues discussed, members and invitees gained great value from the social engagement, developing a shared vision towards rhino conservation. Naro Moru provided a most suitable venue given its size, cost and proximity to important Kenyan rhino conservation areas.
CITES CoP16In my last report I mentioned the mandated joint IUCN SSC AfRSG, AsRSG and TRAFFIC report on rhinos, whose recommendations had been submitted to the CITES Secretariat (Emslie et al. 2012). This document formed Annex 2 to the Secretariat’s report to the Convention (http://www.cites.org/eng/cop/16/doc/E-CoP16-54-02.pdf).
The timing of the 2013 AfRSG meeting was also opportune, occurring shortly before CoP16. AfRSG was therefore able to provide Parties with an updated document summarizing the latest numbers and trends to come from the AfRSG meeting and this was published by the Secretariat at AfRSG’s request as Inf Doc 51 (Emslie 2013) http://www.cites.org/eng/cop/16/inf/E-CoP16i-51.pdf.
At the CoP in Bangkok, IUCN, AfRSG and AsRSG also held an informative side event where the authors of the reports—Richard Emslie, Tom Milliken and Bibhab Talukdar—presented the key findings and recommendations from the joint IUCN/TRAFFIC report as well as provided an update on the latest African rhino statistics and poaching trends to emerge following the recent AfRSG meeting. Mike t’Sas Rolfes also gave an overview of Resolution 138 on rhinos that was approved at IUCN’s World Conservation Congress in Jeju, South Korea, and which was referred to in the joint IUCN/TRAFFIC report. This side event was well attended. There were also a number of other rhino side events at the CoP.
Kenya’s white rhino proposal appeared to have
nul d’exportation sur la réexportation de ces trophées de chasse au moins jusqu’à la CdP18. L’évaluation a conclu que, si elles étaient adoptées, ces propositions auraient un effet dissuasif sur l’industrie de la chasse et decourageraient la conservation générale des rhinocéros, surtout des populations de rhinocéros d’Afrique australe privées. Cela réduirait aussi les revenus essentiels pour certaines autorités de conservation de l’état.
Une réunion des membres a également eu lieu. Compte tenu de la menace du braconnage et de la nécessité d’explorer d’autres stratégies de gestion pour les rhinocéros, l’on a augmenté le nombre de membres du groupe jusqu’à 50, élargissant ainsi la diversité d’expertise afin d’inclure plus de gestionnaires des ONG, des économistes de ressources et les propriétaires et les gestionnaires privés des rhinocéros. La nécessité d’élargir encore le groupe pour inclure des représentants des états-consommateurs a été vivement recommandée.
Outre l’ampleur des questions abordées, les membres et les invités ont acquis une grande valeur de l’engagement social, en élaborant une vision partagée en faveur de la conservation des rhinocéros. Naro Moru était un lieu très approprié compte tenu de sa taille, son coût et sa proximité à d’importantes aires de conservation des rhinocéros au Kenya.
La CdP 16 de la CITESDans mon dernier rapport, j’ai mentionné le mandat pour un rapport conjoint du GSRAf et du GSRAs de la CSE de l’UICN et de TRAFFIC sur les rhinocéros, dont les recommandations ont été soumises au Secrétariat de la CITES (Emslie et al. 2012). Ce document a servi d’annexe 2 au rapport du Secrétariat de la Convention (http://www.cites.org/eng/cop/16/doc/E-CoP16-54-02.pdf).
La date de la réunion de 2013 du GSRAf était également opportune, survenant peu de temps avant la CdP16. Le GSRAf était donc en mesure de fournir aux Parties un document actualisé récapitulant les chiffres les plus récents et les tendances provenant de la réunion du GSRAf et cela a été publié par le Secrétariat à la demande du GSRAf comme Inf Doc 51 (Emslie 2013) http://www.cites.org/eng/cop/16/inf/E-CoP16i-51.pdf.
A la CdP à Bangkok, l’UICN, le GSRAf et le GSRAs ont également organisé un évènement parallèle instructif où les auteurs du rapport - Richard Emslie, Tom Milliken et Bibhab Talukdar - ont présenté les principales conclusions et recommandations du rapport conjoint de l’UICN/TRAFFIC, et donné une mise à jour sur les dernières statistiques du rhinocéros d’Afrique et les tendances du

Pachyderm No. 53 January–June 2013 15
African Rhino Specialist Group report
limited support and was withdrawn from the floor before it was debated, allowing all range States to focus on appropriate decisions on rhinos to be made at the CoP.
In plenary, the new Chair of the CITES Rhino Working Group, Michael Sigsworth, reported back on activities and progress of the group and introduced the group’s report (http://www.cites.org/eng/cop/16/doc/E-CoP16-54-01.pdf). The mandate of the group was extended to continue their work.
The CITES Secretariat’s Ben Janse van Rensburg then introduced the Secretariat’s rhino report, and Richard Emslie and Tom Milliken also gave presentations in plenary, highlighting key findings and recommendations in the joint IUCN/TRAFFIC and AfRSG Inf Doc reports.
A working group under the chairmanship of the United Kingdom (Michael Sigsworth) assisted by the CITES Secretariat (Ben Janse van Rensburg) was formed to develop draft Decisions for the plenary to consider. The working group comprised China, Indonesia and Ireland, on behalf of the Member States of the European Union, and Croatia, Japan, Kenya, Malaysia, Mozambique, Namibia, South Africa, Swaziland, UK, USA, Viet Nam and Zimbabwe, with IUCN and TRAFFIC as technical advisers, and Safari Club International, SSN and WWF as observers. A number of AfRSG members from different countries participated in this group which held a number of meetings and commented on successive drafts before a final draft was presented to Parties to consider. With minor modifications these Decisions were approved by Parties and can be downloaded from the CITES website (http://www.cites.org/common/cop/16/com/E-CoP16-Com-II-24.pdf). Viet Nam and Mozambique were flagged for attention and both countries are now required to report back to the Secretariat on a number of issues by 31 Jan 2014, with progress by these countries being scrutinized at the next CITES Standing Committee Meeting. Finances permitting, the Decisions mandated the CITES Secretariat to visit Lao People’s Democratic Republic to also examine their implementation of Rhino Resolution 9.14(Rev). Rhino horn declared as a hunting trophy was also exempted from Personal Household Effects regulations, as provided for in Resolution Conf. 13.7 (Rev. CoP16) and CoP16 Doc. 46.
braconnage à émerger de la récente réunion du GSRAf. Mike t’Sas Rolfes a également donné un aperçu de la Resolution 138 sur les rhinocéros approuvée lors du Congrès mondial de la nature de l’UICN à Jeju, en Corée du Sud, et mentionnée dans le rapport conjoint de l’UICN/TRAFFIC. Cet événement parallèle a été bien suivi. Il y avait aussi plusieurs autres événements parallèles sur le rhinocéros à la CdP.
La proposition du Kenya sur le rhinocéros blanc a reçu un soutien limité. Elle a donc été retirée avant d’être débattue par la réunion, permettant à tous les Etats de l’aire de répartition de se concentrer sur les décisions appropriées sur les rhinocéros à prendre à la CdP.
En séance plénière, le nouveau président du Groupe de travail de la CITES sur le rhinocéros, Michael Sigsworth, a fait rapport sur les activités et les progrès du groupe et il a présenté le rapport du groupe (http://www.cites.org/eng/cop/16/doc/E-CoP16-54-01.pdf). Le mandat du groupe a été prolongé et il va continuer son travail.
Ben Janse van Rensburg du Secrétariat de la CITES a ensuite présenté le rapport du Secrétariat sur le rhinocéros, et Richard Emslie et Tom Milliken ont également donné leurs présentations en séance plénière, en soulignant les principales conclusions et recommandations dans les rapports conjoints de l’UICN/TRAFFIC et l’InfDoc du GSRAf.
Un groupe de travail sous la présidence du Royaume-Uni (Michael Sigsworth) aidé par le Secrétariat de la CITES (Ben van Rensburg), a été formé pour élaborer des projets de décisions à être examinés par la plénière. Le groupe de travail comprend la Chine, l’Indonésie et l’Irlande, les états membres de l’Union européenne et la Croatie, le Japon, le Kenya, la Malaisie, le Mozambique, la Namibie, l’Afrique du Sud, le Swaziland, le Royaume-Uni, les Etats-Unis, le Viet Nam et le Zimbabwe, avec l’UICN et TRAFFIC en tant que conseillers techniques et Safari Club International, le Réseau pour la Survie des Espèces (SSN) et WWF en tant qu’observateurs. Certains membres du GSRAf de différents pays ont participé à ce groupe qui a tenu une série de réunions et a fait des commentaires sur les versions successives avant qu’un projet final soit présenté pour examen par les Parties. Ces décisions ont été approuvées par les Parties avec des modifications mineures et peuvent être téléchargées à partir du site de la CITES (http://www.cites.org/common/cop/16/com/E-CoP16-Com-II-24.pdf). Le Viet Nam et le Mozambique ont été signalés pour attention et les deux pays doivent désormais faire rapport au Secrétariat sur un certain nombre de questions avant le 31 janvier 2014, et leurs progrès seront examinés minutieusement à la prochaine
16 Pachyderm No. 53 January–June 2013
Knight
réunion du Comité permanent de la CITES. Si les finances le permettent, les décisions ont mandaté le Secrétariat de la CITES de visiter la République Démocratique Populaire du Laos afin d’examiner également la mise en œuvre de la Résolution 9.14 (Rev.) sur le rhinocéros. La corne de rhinocéros déclarée comme un trophée de chasse a également été exemptée de la réglementation sur les effets personnels et mobiliers, comme prévu dans la Résolution Conf. 13.7 (Rev. CdP16) et CdP16 Doc. 46.
Dans une autre décision (CdP16 CommII.34), le Comité permanent a été chargé de revoir la définition du « trophée de chasse » prévue dans la Résolution Conf. 12.3 (Rev. CdP16), par rapport aux trophées de chasse en corne de rhinocéros et en considérant si une révision est nécessaire pour éliminer l’abus possible de la définition afin de faciliter le commerce illégal des cornes de rhinocéros.
Réunion sur la lutte contre la criminalité de la fauneUn colloque de trois jours sur la lutte contre la criminalité de la faune intitulé « Assurer l’application, assurer la justice et faire respecter l’état de droit » qui a été organisé par la Banque Asiatique de Développement s’est tenue à Bangkok en Thaïlande, du 10 au 12 mars 2013. L’objectif du colloque était d’attirer l’attention sur le niveau élevé du commerce illégal des espèces sauvages et l’importance de la criminalité de la faune et les nombreux problèmes écologiques, économiques, sociales et sécuritaires qu’il crée. Parmi les délégués il y avait des magistrats, des procureurs principaux, la police, les principaux décideurs et d’autres intervenants dans la chaîne d’application de la loi.
Le colloque devait également explorer des approches novatrices et des techniques utilisées pour lutter contre la grande criminalité – élémentaires et sophistiqués - dans d’autres domaines qui pourraient être appliquées pour combattre le commerce illégal des espèces sauvages et faire respecter l’état de droit. Le Chargé scientifique du GSRAf a fait une présentation lors du colloque au nom du Dr. Cindy Harper sur le système de la base de données d’ADN de RhODISTM et son utilisation dans les enquêtes et les tribunaux. La présentation s’est terminée par une discussion des techniques criminalistiques supplémentaires. Le Dr. Rob Ogden des réseaux TRACE était également sur le panel et il a ajouté de la valeur aux discussions.
Enfin, ce colloque visait à amorcer l’élaboration d’un projet de plan d’action régional asiatique intégré des institutions de justice et de police pour aider à façonner
In another Decision (CoP16 Comm II.34), the Standing Committee was tasked with reviewing the definition of ‘hunting trophy’ provided in Resolution Conf. 12.3 (Rev. CoP16), in relation to rhino horn hunting trophies, and considering whether any revision is needed to eliminate the possible abuse of the definition to facilitate the illegal trade in rhino horn.
Meeting on Combating Wildlife CrimeA separate three-day symposium on Combating Wildlife Crime: Securing Enforcement, Ensuring Justice and Upholding the Rule of Law was organized by the Asian Development Bank and held in Bangkok, Thailand, 10–12 March 2013. The aim of the symposium was to attract high-level attention to the illegal wildlife trade and the significance of wildlife crime and the wide range of ecological, economic, social and security challenges it creates. Delegates included senior judiciary, senior prosecutors, police, key decision-makers and other participants in the law-enforcement chain.
The symposium also sought to explore innovative approaches and techniques used to combat serious crime—both basic and sophisticated—in other fields that could be applied to combat the illegal wildlife trade and uphold the rule of law. The AfRSG scientific officer gave a presentation at the symposium on behalf of Dr Cindy Harper on the RhODISTM DNA database system and its use in investigations and court. The presentation finished with a discussion of additional forensic techniques. Dr Rob Ogden of TRACE networks was also on the panel and added value to the discussions.
Finally, the symposium sought to initiate the development of a proposed integrated regional Asian action plan by justice and law-enforcement agencies to help shape policy and the use of innovative strategies to combat illegal wildlife trade in Asia.
Poaching updatePoaching continues to escalate in South Africa. As of 28 May 2013 a total of 367 rhinos had been reported poached with two-thirds of these (247) in Kruger National Park. So far this translates to 2.48
Pachyderm No. 53 January–June 2013 17
African Rhino Specialist Group report
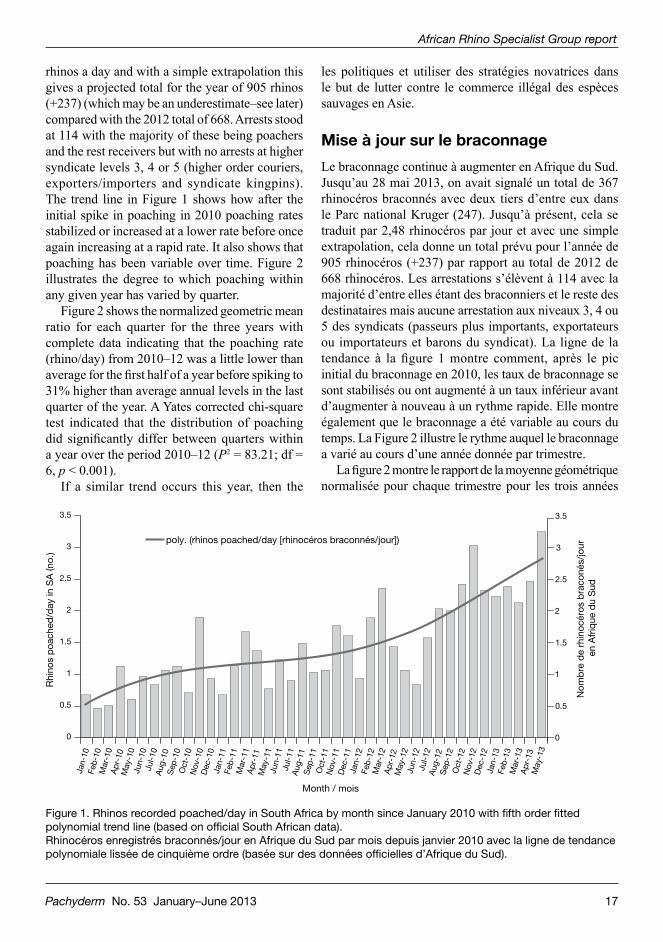
rhinos a day and with a simple extrapolation this gives a projected total for the year of 905 rhinos (+237) (which may be an underestimate–see later) compared with the 2012 total of 668. Arrests stood at 114 with the majority of these being poachers and the rest receivers but with no arrests at higher syndicate levels 3, 4 or 5 (higher order couriers, exporters/importers and syndicate kingpins). The trend line in Figure 1 shows how after the initial spike in poaching in 2010 poaching rates stabilized or increased at a lower rate before once again increasing at a rapid rate. It also shows that poaching has been variable over time. Figure 2 illustrates the degree to which poaching within any given year has varied by quarter.
Figure 2 shows the normalized geometric mean ratio for each quarter for the three years with complete data indicating that the poaching rate (rhino/day) from 2010–12 was a little lower than average for the first half of a year before spiking to 31% higher than average annual levels in the last quarter of the year. A Yates corrected chi-square test indicated that the distribution of poaching did significantly differ between quarters within a year over the period 2010–12 (P2 = 83.21; df = 6, p < 0.001).
If a similar trend occurs this year, then the
les politiques et utiliser des stratégies novatrices dans le but de lutter contre le commerce illégal des espèces sauvages en Asie.
Mise à jour sur le braconnageLe braconnage continue à augmenter en Afrique du Sud. Jusqu’au 28 mai 2013, on avait signalé un total de 367 rhinocéros braconnés avec deux tiers d’entre eux dans le Parc national Kruger (247). Jusqu’à présent, cela se traduit par 2,48 rhinocéros par jour et avec une simple extrapolation, cela donne un total prévu pour l’année de 905 rhinocéros (+237) par rapport au total de 2012 de 668 rhinocéros. Les arrestations s’élèvent à 114 avec la majorité d’entre elles étant des braconniers et le reste des destinataires mais aucune arrestation aux niveaux 3, 4 ou 5 des syndicats (passeurs plus importants, exportateurs ou importateurs et barons du syndicat). La ligne de la tendance à la figure 1 montre comment, après le pic initial du braconnage en 2010, les taux de braconnage se sont stabilisés ou ont augmenté à un taux inférieur avant d’augmenter à nouveau à un rythme rapide. Elle montre également que le braconnage a été variable au cours du temps. La Figure 2 illustre le rythme auquel le braconnage a varié au cours d’une année donnée par trimestre.
La figure 2 montre le rapport de la moyenne géométrique normalisée pour chaque trimestre pour les trois années
Jan-
10Fe
b-10
Mar
-10
Apr
-10
May
-10
Jun-
10Ju
l-10
Aug
-10
Sep
-10
Oct
-10
Nov
-10
Dec
-10
Jan-
11Fe
b-11
Mar
-11
Apr
-11
May
-11
Jun-
11Ju
l-11
Aug
-11
Sep
-11
Oct
-11
Nov
-11
Dec
-11
Jan-
12Fe
b-12
Mar
-12
Apr
-12
May
-12
Jun-
12Ju
l-12
Aug
-12
Sep
-12
Oct
-12
Nov
-12
Dec
-12
Jan-
13Fe
b-13
Mar
-13
Apr
-13
May
-13
Month / mois
Rhi
nos
poa
ched
/day
in S
A (n
o.)
0
0.5
1
1.5
2
2.5
3
3.5
0
0.5
1
1.5
2
2.5
3
3.5
Nom
bre
de
rhin
océr
os b
raco
nés/
jour
en
Afr
ique
du
Sud
poly. (rhinos poached/day [rhinocéros braconnés/jour])
Figure 1. Rhinos recorded poached/day in South Africa by month since January 2010 with fifth order fitted polynomial trend line (based on official South African data). Rhinocéros enregistrés braconnés/jour en Afrique du Sud par mois depuis janvier 2010 avec la ligne de tendance polynomiale lissée de cinquième ordre (basée sur des données officielles d’Afrique du Sud).

18 Pachyderm No. 53 January–June 2013
Knight
0
0.2
0.4
0.6
0.8
1
1.2
1.4
1.6
0
0.2
0.4
0.6
0.8
1
1.2
1.4
1.6
Jan–Mar Apr–June Jul–Aug Sept–Dec
Quarter/Trimestre
Rel
ativ
e q
uart
erly
poa
chin
g ra
tio fo
r ye
ar
Taux
moy
en d
e b
raco
nnag
e p
our
l’ann
ée
2010 2011 2012 2013
simple extrapolation of current 2013 average poaching rates to date for the rest of the year would underestimate the numbers likely to be poached in 2013. If the past trends of escalating poaching in the second part of the year shown in Figure 2 are repeated this year, using weighted normalized geometric means in Figure 2 it is estimated that poaching for 2013 could end up as high as 1,107 animals (more than simple extrapolated estimate mentioned earlier).
South Africa has not been alone in suffering continued increases in poaching. Rhino poaching has also escalated in Kenya with 24 rhinos recorded poached as of 28 May 2013. At this rate an extrapolated total poached for 2013 will be 54, which would be an 80% increase on the 30 in 2012. The 2013 poaching rates to date simply extrapolated for the year suggest the proportion of the Kenyan population that might be killed this year could rise to 5.3% with a projected estimate of 4.3% to 5.2% being poached in South Africa
ayant des données complètes indiquant que le taux de braconnage (Rhinocéros/jour) à partir de 2010-12 était un peu inférieur à la moyenne pour le premier semestre de l’année précédente et qu’il a atteint son pic à 31% au-dessus des niveaux annuels moyens dans le dernier trimestre de l’année. Un test khi-carré corrigé de Yates indique que la distribution du braconnage diffère significativement d’un trimestre à l’autre dans une année sur la période 2010-12 (P2 = 83,21, df = 6, p < 0,001).
Si une tendance similaire se produit cette année, alors la simple extrapolation des taux moyens de braconnage actuels de 2013 à ce jour pour le reste de l’année sous-estimerait les chiffres susceptibles d’être braconnés en 2013. Si les tendances passées de l’intensification du braconnage dans la deuxième partie de l’année comme indiquée dans la figure 2 étaient répétées cette année, en utilisant des moyens géométriques normalisées pondérées dans la figure 2, on estime que le braconnage pour 2013 pourrait s’élever à 1.107 animaux.
L’Afrique du Sud n’est pas la seule à subir des hausses continues du braconnage. Le braconnage des rhinocéros
Figure 2. Ratios of average quarterly rhinos poached/day compared to the average poaching rate for that year for each year since the start of 2010. The bold numbers above the histograms give the normalized geometric mean quarterly poaching rate for each quarter over the three-year period 2010–12. A ratio > 1 means there was relatively more poaching in that quarter than the average for that year. Similarly a ratio < 1 indicates a relatively lower poaching rate for that quarter. Taux de la moyenne trimestrielle de rhinocéros braconnés/jour par rapport au taux moyen de braconnage pour cette année, pour chaque année depuis le début de l’année 2010. Les chiffres en gras au-dessus des histogrammes donnent le taux de la moyenne géométrique trimestrielle normalisée du braconnage pour chaque trimestre au cours de la période de trois ans de 2010-12. Un taux >1 signifie qu’il y a eu relativement plus de braconnage dans ce trimestre que la moyenne pour cette année. De même, un rapport <1 indique un taux de braconnage relativement plus bas pour ce trimestre.

Pachyderm No. 53 January–June 2013 19
African Rhino Specialist Group report
(depending on whether poaching escalates in the second half of the year as it has done in previous years). The projected poaching figure for Kenya is not sustainable for its total rhino population of just over 1,000 animals and will result in a population decline by the end of 2013.
Penalties for rhino crimesFor some time there has been concern that inadequate and very low penalties for those convicted of rhino crimes in Kenya could be acting as an incentive for poachers. These concerns were also raised in the IUCN/TRAFFIC report to CITES CoP16 (Emslie et al. 2012). At CITES Kenya informed Parties that a draft proposal to increase penalties was with parliament. It is therefore encouraging to report that the Kenyan parliament on 22 May 2013 voted almost unanimously to raise penalties for wildlife poaching and trafficking of wildlife products. This vote cleared the way for an emergency amendment to the Wildlife Act that raises penalties for killing wildlife, and especially elephants and rhinos, to up to 15 years in jail and/or a fine of up to KES 10 million (about US$118,000). Previously, poachers and traffickers had been facing penalties amounting to less than US$500 in Kenya. These increased penalties mean that wildlife crimes now have the same status and punishments as the Economic Crimes Act, the Organized Crime Act and the Anti-Terrorism Crime Act.
The IUCN/TRAFFIC report to CITES CoP16 (Emslie et al. 2012) also drew attention to the fact that rhino crimes are only a misdemeanour in Mozambique and not criminal offences—highlighting the urgent need for Mozambique to introduce new laws criminalizing rhino crimes and providing deterrent sentences. Decisions taken at CITES CoP16 mandate Mozambique to report back by the end of January 2014 on steps taken to deal with rhino poaching and trafficking, including progress regarding new deterrent legislation.
Rhino and Elephant Security Group/Interpol Environmental Crime Working GroupThe Rhino Elephant Security Group/Interpol Environmental Crime Working Group held a
a également augmenté au Kenya avec 24 rhinocéros braconnés enregistrés jusqu’au 28 mai 2013 et à ce rythme, le total extrapolé de rhinocéros braconnés pour 2013 serait de 54, ce qui serait une hausse de 80% par rapport aux 30 rhinocéros en 2012. Le taux de braconnage de 2013 à ce jour simplement extrapolés pour l’année suggère que la proportion de la population kenyane qui pourrait être tuée cette année s’élèverait à 5,3% par rapport à une estimation projetée de 4,3 à 5,2% rhinocéros braconnés en Afrique du Sud (si le braconnage s’intensifie dans la seconde moitié de l’année comme cela s’est fait les années précédentes). Le chiffre projeté du braconnage au Kenya n’est pas viable pour la population totale de rhinocéros qui sont un peu plus de 1000 animaux et se traduira par une baisse de la population d’ici la fin de 2013.
Peines pour les crimes contre les rhinocérosDepuis quelque temps, on s’est inquiété que les sanctions très faibles et inadéquates pour les personnes reconnues coupables de crimes contre les rhinocéros au Kenya pourraient agir comme une motivation aux braconniers. Ces préoccupations ont également été soulevées dans le rapport de l’UICN/TRAFFIC à la CITES CdP16 (Emslie et al. 2012). A la CITES le Kenya a informé les Parties que le projet de loi visant à augmenter les peines était devant le Parlement. Il est donc encourageant de noter que mercredi le 22 mai 2013, le Parlement kenyan a voté presque à l’unanimité d’augmenter des sanctions pour le braconnage et le trafic de produits de la faune sauvage. Ce vote a ouvert la voie à une modification d’urgence de la Loi sur la Faune, qui augmenterait les sanctions pour tuer des animaux sauvages, et surtout les éléphants et les rhinocéros, jusqu’à 15 ans de prison et/ou une amende pouvant aller jusqu’à 10 millions de shillings kenyans (environ 118.000 dollars). Auparavant, les braconniers et les trafiquants avaient été confrontés à des pénalités s’élevant à moins de 500 $US au Kenya. Ces peines plus sévères signifieraient que les crimes de la faune ont désormais le même statut et les mêmes peines que la Loi sur les crimes économiques, la Loi sur le crime organisé et la Loi anti-terrorisme.
Le rapport de l’UICN/TRAFFIC à la CdP 16 de la CITES (Emslie et al. 2012) a également attiré l’attention sur le fait que le crime contre les rhinocéros est seulement un délit au Mozambique et non pas une infraction pénale ce qui montre qu’il faut que le Mozambique de façon urgente introduise de nouvelles lois criminalisant les crimes de rhinocéros et des peines dissuasives. Les décisions prises à la CdP16 de la CITES donnent mandat

20 Pachyderm No. 53 January–June 2013
Knight
meeting at Mlilwane, Swaziland, 15–19 April 2013. While most of what was discussed at the meeting is confidential, one encouraging development reported was the greatly increased case completion rate in Zimbabwe and the number of deterrent jail sentences being handed down by the courts. As a further deterrent in the fight against rhino horn traffickers and poachers some civil cases have also been instituted in Zimbabwe. The next meeting is planned for November 2013.
South African GEF project developmentA number of AfRSG members have continued to assist the project development team and South Africa’s Department of Environmental Affairs with the development of a project proposal, attending several meetings and helping with drafting background sections and providing information and comments on draft sections.
Other meetingsWith the growing rhino crisis, so has the demand to attend rhino meetings also increased. The Chair alone has attended 25 separate meetings the last year, with a few mentioned below.
The Chair and Deputy Chair, Dr Ben Okita-Ouma, were invited to present the rhino situation and opportunities, and feedback on Decisions from CITES, respectively, at a colloquium and debate entitled ‘Rhinos: What does the future hold?’, organized by Columba de la Panouse, deputy CEO of the Thoiry Group, France, in April 2013. It was designed to inform the French authorities and media of the seriousness and complexity of the international rhino crisis, and discuss how they could assist. It was attended by broad and senior representation from the French Ministry of Ecology, Sustainable Development and Energy; French Society for Study and Protection of Mammals; National Directorate of the Intelligence and Customs Investigations; National Office for Hunting and Wildlife; TRAFFIC; and Save the Rhino International.
The Chair presented the rhino situation at a roundtable debate on ‘International Collaboration to Fight Wildlife Trafficking’ organized by Dr
au Mozambique de faire rapport d’ici la fin de janvier 2014, sur les mesures prises pour faire face au braconnage et au trafic des rhinocéros y compris les progrès concernant la nouvelle législation dissuasive.
Groupe sur la Sécurité du Rhinocéros et de l’éléphant / Groupe de travail d’Interpol sur le Crime de l’environnementLe Groupe sur la Sécurité du Rhinocéros et de l’éléphant et le Groupe de travail d’Interpol sur le Crime de l’environnement ont tenu une réunion à Mlilwane au Swaziland, du 15 au 19 avril 2013. Alors que la plus grande partie de ce qui a été discuté lors de la réunion est confidentielle, une évolution encourageante rapportée était le taux de finalisation des procès qui avait considérablement augmenté au Zimbabwe et le nombre de peines d’emprisonnement dissuasives prononcées par les tribunaux. Des procès civils ont également été mis en place au Zimbabwe comme un autre moyen de dissuasion dans la lutte contre les trafiquants et des braconniers des cornes de rhinocéros. La prochaine réunion est prévue pour novembre 2013.
Elaboration du projet du FEM pour l’Afrique du SudCertains membres du GSRAf ont continué à aider l’équipe d’élaboration de ce projet et le Département des affaires environnementales de l’Afrique du Sud à élaborer une proposition de projet, en participant à des réunions à Pretoria, en aidant à la rédaction des articles de fond et en fournissant des informations et des commentaires sur les sections provisoires.
D’autres réunionsEtant donné la crise croissante de rhinocéros, les invitations aux réunions de rhinocéros ont également augmenté. Le Président lui-même a assisté à 25 réunions séparées l’année dernière, dont quelques-unes sont mentionnées ci-dessous.
Le Président et le Vice-président (le Dr. Ben Okita-Ouma) ont été invités à présenter la situation et les enjeux des rhinocéros, et des commentaires sur les décisions de la CITES, lors d’un colloque-débat intitulé « Les Rhinocéros: Que nous réserve l’avenir ? », organisé par Columba de la Panouse, Directeur général adjoint du Groupe Thoiry,
Pachyderm No. 53 January–June 2013 21
African Rhino Specialist Group report
Robert Hormats, Under-Secretary for Economic Growth, Energy, and the Environment, US Department of State and hosted by the University of Pretoria. Panellists also included Fundisile Mketeni, deputy director-general for Biodiversity and Conservation, South African Department of Environmental Affairs, and Dr Bandile Mkhize, CEO, Ezemvelo KZN Wildlife. Dr Hormats emphasized the US government’s seriousness about helping address the rhino-horn trafficking issue. Mozambique, through its inadequate legislation and law enforcement, was identified as a major regional player in the increase in rhino poaching and the illegal trafficking of rhino horn (and other natural resources), as was Viet Nam as the prime destination for this horn. Greater diplomatic pressure and involvement of the US government was called for.
Rhino conservation framework document and other plansI am pleased to learn that the Zimbabwe Rhino Conservation Framework document has been approved and signed by the minister and will soon be published.
It is planned to revise the Zambian Rhino Plan in the next reporting period.
The South African Black Rhino Biodiversity Management Plan (BMP) has been approved and signed off by the minister under the National Environmental Management and Biodiversity Act (Knight et al. 2012). A draft white rhino BMP has also been completed.
Unfortunately the Botswana plan still has to be completed and approved.
African contribution to Sumatran Rhino Crisis SummitThe Sumatran Rhino Crisis Summit was held in Singapore in April 2013. It had over 100 participants with most delegates from Sumatran rhino range areas in Sabah, Malaysia, as well as Indonesia (which is the stronghold for the species). In addition, a group of six African rhino conservation experts (Raoul du Toit, Richard Emslie, Brian Harris, Markus Hofmeyr, Ben Ouma-Okita and Mick Reilly—five AfRSG
en France en avril 2013. Il avait été conçu pour informer les autorités françaises et les médias de la gravité et de la complexité de la crise internationale de rhinocéros, et pour discuter de la façon dont ils pourraient aider. Ont assisté à la réunion des représentants de haut niveau du Ministère français de l’Ecologie, du Développement durable et de l’Energie, de la Société Française d’Etude et de Protection des Mammifères, de la Direction Nationale du Renseignement et des Enquêtes Douanières (DNRED); de l’Office National de la Chasse et de la Faune Sauvage (ONCFS), TRAFFIC et Save the Rhino International.
Le Président a présenté la situation des rhinocéros à une table ronde sur « la collaboration internationale pour lutter contre le trafic des espèces sauvages», organisée par le Dr. Robert Hormats, Sous-secrétaire pour la Croissance économique, l’Énergie et l’Environnement, Département d’Etat des Etats-Unis à l’Université de Pretoria. Les intervenants comprenaient également Mr. Fundisile Mketeni, Directeur général adjoint pour la biodiversité et la conservation, Département des affaires environnementales d’Afrique du Sud, et le Dr. Bandile Mkhize, Directeur général, de la Faune du Kwazulu Natal Ezemvelo. Le Dr. Hormats a souligné le sérieux du gouvernement américain à confronter le problème du trafic des cornes de rhinocéros. Le Mozambique, par sa législation et son application de la loi inadéquates, a été indiqué comme un acteur régional majeur dans le braconnage croissant des rhinocéros et le trafic illégal des cornes de rhinocéros (et d’autres ressources naturelles), tout comme le Viet Nam en tant que destination de choix pour la corne. Il faut plus de pression diplomatique et l’implication du gouvernement américain.
Document-cadre de la Conservation des Rhinocéros au Zimbabwe et d’autres plansJe suis heureux d’apprendre que le document cadre pour la conservation des rhinocéros au Zimbabwe a été approuvé et signé par le Ministre et sera bientôt publié. L’on prévoit de réviser le Plan zambien pour le Rhinocéros au cours de la prochaine période de référence.
Le Plan de Gestion de la biodiversité du rhinocéros noir sud-africain a été approuvé et signé par le Ministre en vertu de la Loi sur la Gestion nationale de l’environnement et de la biodiversité (Knight et al. 2012). Un projet de plan sur le rhinocéros blanc a également été réalisé. Malheureusement, le plan du Botswana doit encore être complété et approuvé.
22 Pachyderm No. 53 January–June 2013
Knight
members) from five African rhino range States were invited to attend. Other AfRSG members who attended included Cathy Dean, Susie Ellis and Bibhab Talukdar (also AsRSG Chair).
As part of background sessions to the summit, the African rhino conservationists made a joint presentation. This presentation provided a summary of the African rhino situation and insights into what has and has not worked. Without being prescriptive, the aim was to primarily share experiences to assist local Asian rhino conservationists on how best to conserve their rhinos and reverse the decline in rhino numbers. This presentation benefited enormously from a pre-meeting site visit (kindly sponsored by the IRF) to Way Kambas National Park in Sumatra. The group was exposed to the Sumatran rhino paddock-based captive breeding operation in the park (which recently celebrated the first Sumatran rhino calf born in captivity for 124 years), as well as direct engagement with the park’s Rhino Protection Unit (RPU). The field visit enabled the team to get a better understanding of park logistics, issues, challenges and habitat conditions as well as RPU activities and workforce densities.
The joint African presentation was well received by participants and provided a message of hope that all is not lost, given that in Africa (and indeed also in India and Nepal with the greater one-horned rhino) it has been possible to turn round the situation with white, black and greater one-horned rhinos. The presentation highlighted the top 13 lessons learned. These were the need for 1) effective concentrated rhino protection following a needs analysis, 2) maintenance of area integrity, 3) intelligence-led law enforcement, 4) being innovative through an adaptive learning process and being prepared to take risks (appreciating that not acting is a decision and sometimes the worst decision), 5) employing effective techniques for investigations, and prosecution with deterrent penalties, 6) biological management for growth, 7) essential routine monitoring, 8) a focus on extensive rhino conservation and not intensive wild rhino conservation, 9) regional cooperation and capacity building, 10) a system of effective coordination and planning (including mandated coordinator) with regular review with roles and responsibilities clearly defined, 11) increased community focus with incentives, 12) sufficient political will with
Contribution de l’Afrique au sommet sur la crise du Rhinocéros de SumatraLe Sommet sur la crise du rhinocéros de Sumatra a eu lieu à Singapour en avril 2013. Ont participé plus de 100 personnes, la plupart des délégués venant des aires de répartition des rhinocéros de Sumatra à Sabah, en Malaisie, ainsi que de l’Indonésie (qui est le bastion de l’espèce). En outre, un groupe de six experts de la conservation des rhinocéros d’Afrique (Raoul du Toit, Richard Emslie, Brian Harris, Markus Hofmeyr, Ben Okita et Mick Reilly -cinq membres du GSRAf) de cinq Etats africains de l’aire de répartition de rhinocéros ont été invités à y assister. Les autres membres du GSRAf qui ont assisté comprenaient Cathy Dean, Susie Ellis et Bibhab Talukdar (aussi le Président du GSRAs).
Dans le cadre des sessions préparatoires au Sommet de crise du rhinocéros de Sumatra, les défenseurs de l’environnement des rhinocéros d’Afrique ont fait une présentation conjointe. Cette présentation a fourni un résumé de la situation et des perspectives sur les rhinocéros d’Afrique concernant ce qui avait marché et ce qui ne l’avait pas. Sans être impérieux, l’objectif était de partager des expériences avec les défenseurs locaux des rhinocéros d’Asie sur la meilleure façon de conserver leurs rhinocéros et d’inverser le déclin du nombre de rhinocéros. Cette présentation a énormément profité d’une visite du site avant la réunion (aimablement sponsorisé par l’IRF) au Parc national de Way Kambas à Sumatra. Le groupe a été exposé à l’opération clôturée de reproduction du rhinocéros de Sumatra en captivité dans le parc (qui a récemment célébré le premier bébé rhinocéros de Sumatra né en captivité depuis 124 ans), ainsi qu’une prise de contact direct avec l’Unité de protection du Rhinocéros du parc. La visite de terrain a permis à l’équipe de mieux comprendre la logistique du parc, des enjeux, les défis et les conditions de l’habitat ainsi que les activités de l’Unité de Protection du Rhinocéros et les densités de la main-d’œuvre.
La présentation africaine commune a été bien accueillie par les participants ; elle a communiqué un message d’espoir que tout n’est pas perdu, étant donné qu’en Afrique (et d’ailleurs aussi en Inde et au Népal avec le grand rhinocéros unicorne), il a été possible de renverser la situation du grand rhinocéros unicorne et des rhinocéros blanc et noir. La présentation a souligné les 13 premières leçons apprises. Il s’agissait de la nécessité de 1) protection des rhinocéros concentrée et efficace suite à une analyse des besoins, 2) maintien de l’intégrité de la zone, 3) application de la loi suivant le renseignement, 4) être innovateur grâce à un processus d’apprentissage adaptatif et prêt à prendre
Pachyderm No. 53 January–June 2013 23
African Rhino Specialist Group report
substantial effort, workforce and resources above minimum threshold levels (noting that innovative funding such as co-management agreements have sometimes been required to fund effective field conservation), and finally 13) champions on the ground and leadership with accountability.
New evidence was presented at the summit that indicated Sumatran rhino numbers were almost certainly much lower than previously thought, especially in Sabah, Malaysia. The rest of the summit involved workshop issues and culminated in a ground-breaking agreement for Sabah, Malaysia and Indonesia to work together. In another key session, local Indonesian and Malaysian participants identified a number of key activities needed as part of an emergency plan over the next two years. This included improved individual-based monitoring (using either DNA or photo traps) to provide better information on numbers, distribution, and age and sex structure of populations, to better assess performance, workforce, infrastructure, equipment and training needs in remaining rhino areas in Sumatra.
AfRSG members actively participated in many sessions of the other working groups.
AcknowledgementsOnce again, I would like to acknowledge and thank our various sponsors: US Fish and Wildlife Services’ Rhino and Tiger Conservation Fund, WWF-SA Rhino Programme, WWF’s African Rhino Programme (with funding from WWF Netherlands), Save the Rhino International, International Rhino Foundation and the UK’s Department for the Environment, Food and Rural Affairs (DEFRA). Kenya Wildlife Service is thanked for hosting the 11th meeting of AfRSG. The assistance of SRI’s Cathy Dean and Susie Offord with fund raising, reporting and logistical support in organizing the AfRSG meeting and putting together the proceedings is most appreciated. Ol Pejeta Conservancy is thanked for hosting participants of the AfRSG meeting during the field excursion. I also thank Dr Richard Emslie, scientific officer, and Dr Ben Okita-Ouma, deputy chair, for their inputs, constant support and advice. Our condolences are also extended to the family and friends of Dr Anthony King of the Laikipia Wildlife Forum, who tragically died in a plane
des risques (en appréciant que l’inaction est une décision et parfois la pire décision), 5) employer des techniques efficaces pour les enquêtes et les poursuites judiciaires avec des sanctions dissuasives, 6) gestion biologique pour la croissance, 7) surveillance de routine indispensable, 8) accent mis sur la conservation extensive des rhinocéros et non la conservation intensive des rhinocéros sauvages, 9), coopération régionale et renforcement de capacité, 10) un système de coordination et de planification efficaces (y compris un coordinateur mandaté) et un suivi régulier avec des rôles et des responsabilités clairement définis, 11) une attention accrue sur la communauté avec des incitations, 12) une volonté politique suffisante, y compris un effort substantiel, la main-d’œuvre et les ressources au-dessus des seuils minimaux (en notant que le financement innovateur tel que les accords de cogestion sont parfois nécessaires pour financer la conservation effective sur le terrain), et enfin 13) des champions sur le terrain et un leadership qui rend des comptes.
Lors du sommet on a présenté de nouvelles preuves qui indiquent que le nombre de rhinocéros de Sumatra était presque certainement beaucoup plus faible qu’on le pensait, en particulier à Sabah, en Malaisie. Quant au reste du sommet, il portait sur des questions d’atelier aboutissant à un accord innovateur pour que Sabah, en Malaisie et l’Indonésie travaillent ensemble. Dans une autre session clé, les participants locaux indonésiens et malaisiens ont identifié un certain nombre d’activités clés nécessaires dans le cadre d’un plan d’urgence pour les deux ans à venir. Cela comprenait une amélioration du suivi individuel (en utilisant l’ADN ou des pièges photo) afin de fournir une meilleure information sur le nombre, la répartition et la structure par âge et par sexe des populations, afin de mieux évaluer les besoins de performance, de main-d’œuvre, les infrastructures, l’équipement et la formation dans les autres aires de rhinocéros à Sumatra.
Les membres du GSRAf ont participé activement à la plupart des autres groupes de travail.
RemerciementsEncore une fois, je tiens à remercier nos différents sponsors: Le Service de la Pêche et de la Faune des Etats-Unis, Conservation du Rhinocéros et du Tigre, WWF - Programme de Rhino de l’Afrique du Sud, le Programme de Rhinocéros d’Afrique de WWF (avec un financement de WWF Pays-Bas), Save the Rhino International (SRI), la Fondation Internationale pour le Rhinocéros et le Département Britannique pour l’Environnement, de l’Alimentation et des Affaires rurales (DEFRA). On

24 Pachyderm No. 53 January–June 2013
Knight
crash just after the AfRSG meeting, which he attended as one of the Kenyan invitees.
ReferencesEmslie RH. 2013. African rhinoceroses—latest
trends in rhino numbers and poaching: An update to Doc 54-2-Annexe 2 from the IUCN Species Survival Commission’s (IUCN/SSC) African Rhino Specialist Group to the CITES Secretariat pursuant to Resolution Conf. 9.14 (Rev. CoP15). CITES: CoP16 Doc. 54.2. http://www.cites.org/eng/cop/16/inf/E-CoP16i-51.pdf
Emslie RH, Milliken T, Talukdar B. 2012. African and Asian rhinoceroses—status, conservation and trade: A report from the IUCN Species Survival Commission (IUCN/SSC) African and Asian Rhino Specialist Groups and TRAFFIC to the CITES Secretariat pursuant to Resolution Conf. 9.14 (Rev. CoP15). CITES: CoP16 Doc. 54.2 (Rev. 1). http://www.cites.org/eng/cop/16/doc/E-CoP16-54-02.pdf.
Knight MH, Balfour D, Emslie R. 2012. Biodiversity Management Plan for the Black Rhinoceros (Diceros bicornis) in South Africa 2011–2020. Department of Environmental Affairs, Pretoria. Government Gazette, 25 January 2011, No. 6096. http://www.info.gov.za/view/DownloadFileAction?id=182611
Milliken T, Shaw J. 2012. The South Africa–Viet Nam rhino horn trade nexus: a deadly combination of institutional lapses, corrupt wildlife industry professionals and Asian crime syndicates. TRAFFIC, Johannesburg. 173 pp.
remercie le Service kenyan de la Faune d’avoir accueilli la 11ème réunion du GSRAf. L’aide de Cathy Dean et Susie Offord de SRI avec la collecte de fonds, le rapportage et le soutien logistique dans l’organisation de la réunion du GSRAf et la compilation des procès-verbaux est très appréciée. Nous remercions la Conservation d’Ol Pejeta pour d’accueilli les participants à la réunion du GSRAf pendant l’excursion. Je remercie également le Dr. Richard Emslie, responsable scientifique, et le Dr. Ben Okita-Ouma, Vice-président, pour leurs contributions, leur soutien constant et leurs conseils. Nos condoléances vont également à la famille et les amis de Dr. Anthony King du Forum de la Faune Sauvage de Laikipia, décédé tragiquement dans un accident d’avion juste après la réunion du GSRAf à laquelle il avait participé en tant qu’un des invités kenyans.
Asian Rhino Specialist Group report
Pachyderm No. 53 January–June 2013 25
AfRSG meeting in KenyaVery good and cordial ties are being maintained between AfRSG and AsRSG. The Chair of AsRSG is now a member of AfRSG; similarly, the scientific officer of AfRSG has been made a member of AsRSG to ensure stronger ties between the two rhino specialist groups and with IUCN/SSC. The Chair of AsRSG attended AfRSG’s meeting held at Naro Moru River Lodge, Kenya, 17–22 February 2013, and shared the status of Asian rhinos and key conservation measures. The close ties between AsRSG and AfRSG are further facilitating the sharing of expertise and knowledge to benefit the five species of rhinos currently found in the world. As a result of these close ties, a few members of AfRSG and rhino experts working in Africa were invited, through IUCN/SSC, to take part in the Sumatran Rhino Crisis Summit in Singapore, 1–4 April 2013.
Sumatran Rhino Crisis SummitThe Chair of AsRSG attended the Sumatran Rhino Crisis Summit convened by IUCN/SSC to assess the current state of the Sumatran rhinoceros, which is now confined to only Sumatra, Indonesia, and Sabah, Malaysia. Over 100 participants from various parts of the world attended this summit. The Indonesian and Malaysian delegates included high-level officials from ministries including the Sabah Wildlife Department of Malaysia. The meeting expressed its concern with the fast decline of the Sumatran rhinoceros population in range countries and emphasized time-bound strategies and actions to save the species from the possible verge of extinction. A group of African rhino experts from South Africa, Zimbabwe, Swaziland and Tanzania also attended this summit and shared the African experience with participants. IUCN/
Asian Rhino Specialist Group reportRapport du Groupe des Spécialistes des Rhinocéros d’Asie
Bibhab K Talukdar, Chair/Président
Aaranyak, 50 Samanwoy Path (Survey), PO Beltola, Guwahati – 781 028, Assam, Indiaemail: [email protected]
Réunion du GSRAf au KenyaLe GSRAf maintient de très bonnes relations cordiales avec le GSRAs. Le Président du GSRAs est maintenant membre du GSRAf, et de la même manière, le Chargé scientifique du GSRAf est devenu membre du GSRAs pour assurer des liens plus étroits entre les deux groupes de spécialistes des rhinocéros et avec la CSE/UICN. Le Président du GSRAs a participé à la réunion du GSRAf qui s’est tenue au Naro Moru River Lodge au Kenya, du 17 au 22 février 2013, et il a échangé des idées sur la situation des rhinocéros d’Asie et les mesures clés de conservation. Les liens étroits qui existent entre le GSRAs et le GSRAf facilitent en outre le partage d’expertise et de connaissances au profit des cinq espèces de rhinocéros qui se trouvent actuellement dans le monde. En raison de ces liens étroits, quelques membres du GSRAf et des experts du rhinocéros qui travaillent en Afrique ont été invités par la CSE/UICN, de prendre part au Sommet sur la crise du rhinocéros de Sumatra à Singapour du 1er au 4 avril 2013.
Sommet sur la crise du Rhinocéros de SumatraLe Président du GSRAs a participé au Sommet sur la crise du Rhinocéros de Sumatra organisée par la CSE/UICN pour évaluer l’état actuel du rhinocéros de Sumatra, qui est maintenant confiné seulement à Sumatra, en Indonésie, et à Sabah en Malaisie. Plus de 100 participants provenant de diverses régions du monde ont participé à ce sommet. Les délégués indonésiens et malaisiens comprenaient des représentants de haut niveau des ministères, y compris le Département de la Faune de Sabah de Malaisie. La réunion a exprimé sa préoccupation face au déclin rapide de la population de rhinocéros de Sumatra dans les pays de l’air de distribution et a insisté sur les stratégies et les actions limitées dans le temps pour sauver l’espèce d’une extinction possible. Un groupe d’experts du rhinocéros d’Afrique provenant d’Afrique du Sud, du Zimbabwe, du Swaziland et de Tanzanie a également participé à

Talukdar
26 Pachyderm No. 53 January–June 2013
SSC was represented by Mark Stanley Price and Rachel Roberts. An emergency plan is in preparation to usher in a new era of hope for the fast-dwindling and critically endangered Sumatran rhinoceros in Indonesia and Malaysia. Further, a rhino range State meeting for Asian rhinos is also on plan, which the government of Indonesia will hold in October 2013.
CITES CoP16The Chair of AsRSG attended the 16th CITES Conference of Parties meeting in Bangkok from 3 to 14 March 2013, along with the IUCN team. A side event on the status of Asian and African rhinos was organized at the CITES CoP16 on 4 March 2013 to highlight the challenges faced in conserving and protecting rhinos in rhino range countries in Asia and Africa. Dr Richard Emslie, scientific officer of AfRSG, and myself as Chair of AsRSG, Tom Milliken of TRAFFIC, and Michael ‘t Sas-Rolfes addressed the meeting. For more details on rhino issues discussed in CITES CoP16 please see http://www.cites.org/common/cop/16/sum/E-CoP16-Com-II-Rec-09.pdf and http://www.cites.org/common/cop/16/sum/E-CoP16-Com-II-Rec-13.pdf and http://www.cites.org/eng/cop/16/inf/E-CoP16i-24.pdf and http://www.cites.org/common/cop/16/sum/E-CoP16-Plen-06.pdf
Rise in poaching of the greater one-horned rhinoceros in Assam, IndiaPoaching of the greater one-horned rhino in Assam, especially in Kaziranga National Park (NP), is on the rise in the current year. In the first five months of 2013, 23 rhinos were killed by poachers in Assam, the majority in and around Kaziranga NP. If this trend continues Assam could lose about 50–60 rhinos to poaching by the end of this year. The government of Assam has brought in more personnel from the Assam Forest Protection Force to strengthen protection efforts in Kaziranga NP.
ce sommet et a partagé l’expérience africaine avec les participants. La CSE/UICN était représentée par Mark Stanley Price et Rachel Roberts. Un plan d’urgence est en préparation pour le début d’une nouvelle ère d’espoir pour le rhinocéros de Sumatra qui est en danger critique en Indonésie et en Malaisie. En outre, l’on prévoit aussi une réunion des Etats de l’air de distribution du rhinocéros d’Asie que le Gouvernement d’Indonésie organisera en octobre 2013.
La CdP 16 de la CITESLe Président du GSRAs a participé à la 16ème Conférence des Parties de la CITES réunie à Bangkok du 3 au 14 mars 2013, en compagnie de l’équipe de l’UICN. Un événement parallèle sur la situation des rhinocéros d’Asie et d’Afrique a été organisé à la CdP16 de la CITES, le 4 mars 2013 pour mettre en évidence les défis à relever pour la conservation et la protection des rhinocéros dans les pays de l’air de distribution du rhinocéros en Asie et en Afrique. Le Dr. Richard Emslie, chargé scientifique au GSRAf, le Dr. Bibhab Talukdar, Président du GSRAs, Mr. Tom Milliken de TRAFFIC, et Michael ‘t Sas-Rolfes ont pris la parole à cette réunion. Pour plus de détails sur les questions concernant le rhinocéros abordées à la CdP 16 de la CITES CdP16 veuillez consulter http://www.cites.org/common/cop/16/sum/E-CoP16-Com-II-Rec-09.pdf et http://www.cites.org/common/cop/16/sum/E-CoP16-Com-II-Rec-13.pdf et http://www.cites.org/eng/cop/16/inf/E-CoP16i-24.pdf et http://www.cites.org/common/cop/16/sum/E-CoP16-Plen-06.pdf
Augmentation du braconnage du grand rhinocéros unicorne dans l’Assam, en IndeLe braconnage du grand rhinocéros unicorne dans l’Assam, surtout dans le Parc national de Kaziranga, est à la hausse cette l’année. Au cours des cinq premiers mois de 2013, 23 rhinocéros ont été tués par des braconniers dans l’Assam, la majorité dans le Parc national de Kaziranga et ses alentours. Si cette tendance se poursuit, l’Assam pourrait perdre entre 50 et 60 rhinocéros au braconnage d’ici la fin de cette année. Le gouvernement d’Assam a fait venir du personnel supplémentaire venant de la Force de protection des forêts de l’Assam afin de renforcer les efforts de protection du Parc national Kaziranga.
Asian Rhino Specialist Group report
Pachyderm No. 53 January–June 2013 27
Greater one-horned rhino population on the rise in IndiaAn estimation was conducted in March 2013 of the greater one-horned rhinoceros in Kaziranga NP in Assam, India, and the rhino population was found to have increased to 2,329 from an earlier estimate of 2,290. The rhino population in Jaldapara NP in West Bengal, India, has also increased to 186 from 159. The rhinos translocated to Manas NP from Pabitora Wildlife Santuary and Kaziranga NP in Assam have also given birth to five calves, giving new hope towards a population build-up in areas with habitat suitable for rhinos.
Population du grand rhinocéros unicorne en hausse en IndeOn a réalisé une estimation des grands rhinocéros unicornes en mars 2013 au Parc national de Kaziranga dans l’Assam en Inde et la population des rhinocéros a augmenté jusqu’à 2.329 à partir de 2.290. La population des rhinocéros au Parc national de Jaldapara au Bengale occidental en Inde, a également augmenté jusqu’à 186 à partir de 159. Les rhinocéros transférés au Parc national de Manas venant du Sanctuaire de la Faune Sauvage de Pabitora et du Parc national de Kaziranga dans l’Assam ont également mis au monde cinq bébés rhinocéros, ce qui donne un nouvel espoir pour l’augmentation de la population dans les zones ayant un habitat convenable aux rhinocéros.
Inogwabini et al.
28 Pachyderm No. 53 January–June 2013
Elephant effect on forest physical structure and plant species composition in Salonga and Malebo (Lac Tumba landscape), Democratic Republic of Congo
Bila-Isia Inogwabini,1, 2,* Mafuta Ngama-Nkosi,3 Lisalama Wema-Wema3
and Mbende Longwango1
1 WWF DRC, Lac Tumba Program, BP 15.872 Kinshasa 1, Democratic Republic of Congo2 University of Kent, Canterbury, and Swedish University of Agriculutural Sciences, Uppsala3 Institut Congolais pour la Conservation de la Nature* corresponding author email: [email protected]
AbstractData on the ecology of forest elephants are difficult to find. Therefore studies of forest elephant ecology are needed to support the species’ management. With that perspective in mind, data on forest understorey types and key plant species that elephants feed on were collected in Salonga National Park (1996–2002) and Malebo (2006–2010), Democratic Republic of Congo. The objective of the study was to document the physical effects of elephants on understorey species and the relationship between elephant trails and elephant-dispersed plant species. About 94% of the openness of the understorey in Salonga National Park positively related with elephant abundance. Elephant trails influenced the distribution of plant species that elephants feed on at Malebo. Plant species whose fruits are eaten (and therefore dispersed) by elephants declined within 20 m of the trail centre while those on whose leaves elephants browsed increased, creating opposed gradients. Three optimum points were described, suggesting that trails move over time within a given width. Projecting the trends given by the gradient equations, a fourth optimum point would be reached at 76 m from the centre at which both types of plant species would be zero. We concluded that 150 + 2 m distance would define the minimum width of corridors connecting disconnected large elephant habitats.
Additional keywords: open understorey, elephant trails, fruit plant species
RésuméLes données sur l’écologie de l’éléphant de forêt sont difficiles à trouver. Ainsi, les études sur l’écologie de l’espèce sont nécessaires pour la gestion de l’espèce. Dans cette optique, les données ont été ainsi collectées sur les types de sous-bois et les espèces de plantes alimentaires clés pour les éléphants dans la Salonga (1996–2002) et Malebo (2006–2010), République Démocratique du Congo. L’objective de l’étude fut de documenter les effets physiques de la présence des éléphants sur les sous-bois et la relation entre les pistes des éléphants et les espèces de plantes qu’ils dispersent. Environ 94% de l’ouverture des sous-bois dans le Parc National de la Salonga fut positivement liée à l’abondance des éléphants. Les pistes d’éléphant influencent la distribution des plantes sur lesquelles se nourrissent les éléphants de Malebo. Les nombres de plantes dont les fruits sont
RESEARCH
Elephant effect on forest physical structure and plant species composition, DRC
Pachyderm No. 53 January–June 2013 29
IntroductionOne of the most important findings of the first round of activities implemented by the programme known as Monitoring of Illegal Killing of Elephants (MIKE) was that most of what was thought to be known about the African forest elephant was based, at best, on informed guesses (Blake and Hedges 2004). Even simple things such as population estimates have been drawn from non-standard methods, poor quality or incomplete datasets. That reality was even more sobering when detailed ecological knowledge of the species in Central African forests was brought into the balance (Guy 1976; Leuthold 1977; Ben-Shahar 1993, 1998, 1999; Prins et al. 1994; Dublin 1995; Bossen 1998; Gibson et al. 1998; Demeke and Bekele 2000; McKnight 2000; Moss 2001; Nyakaana et al. 2001; Shannon et al. 2011; Vanak et al. 2012). Ecological data (ranging ecology, feeding ecology, population ecology, etc.) on African forest elephants are scarcely available (Blake 2002). Current knowledge on the forest elephant is extrapolated from the regions of Dzanga Sangha and Nouabalé-Ndoki (e.g. Blake et al. 2001; Blake 2002; Blake and Inkamba-Nkulu 2004; Blake et al. 2009; Campos-Arceiz and Blake 2011).
Elephants are said to play key ecological roles and had been termed to be ecosystem engineers (Blake 2002). They shape the physical environments in which they occur (Laws 1970; Verschuren 1987; Dublin et al. 1990; Chapman et al. 1992; Höft and Höft 1995; Lindsay 1996; Blake 2002; Calenge et al. 2002; Guldemond and Van Aarde 2007; Pretorius et al. 2011; Shannon et al. 2011). Physically, where they occur in sizeable densities elephants induce the changes in habitat structures (Laws 1970; Dublin et al. 1990; Sam et al. 1998; Lombard et al. 2001); they open light gaps (Calenge et al. 2002) from which light-dependent tree species profit. They also shape the biological conditions in areas in which they reside: they disperse seeds throughout different habitats and
at great distances (Blake 2002), thereby increasing seed survival probabilities (Howe and Westley 1997). Available evidence abounds in the savannah ecosystems, with studies in areas such as Botswana (Ben-Shahar 1998, 1999), Shimba Hills and Tsavo National Parks, Kenya (Höft and Höft 1995) and Serengeti National Park, Tanzania (Lamprey et al. 1974). In the context of forest elephants, however, available evidence is limited to a few case studies in some sites. These cases include Kibale Forest in Uganda (Chapman et al. 1992) and Virunga National Park in the Democratic Republic of Congo (Verschuren 1987) where quantitative field data are available.
Therefore, we felt the need to undertake a study of the effects of elephants on physical structures (Lamprey et al. 1974; Lindsay 1996) of the understorey in Salonga National Park (NP), which is the first objective of this paper, and the effects of elephants on plant species they feed on along elephant trails in Malebo region (the second objective of this paper). The third objective was to define the minimum width strip of a corridor for elephants to connect two blocs of forest in an environment where human activities occupy a larger portion of the landscape.
Study sitesSalonga NP is a protected area of ~36,560 km2 (1°00′00″–3o30′00″S; 20°00′0″– 22°45′00″E). Gazetted in 1969, it is the largest forested national park in Africa. Salonga NP is located in the central Congo Basin in the Democratic Republic of Congo (DRC, Figure 1). Its habitats comprise three major forest types within which large areas of secondary forests are found: hydromorphous, semi-deciduous and islands of evergreen forests (Evrard 1958, 1987; Inogwabini 2006; Reinartz et al. 2006). The area is traversed by many rivers, including some major tributaries of the Tshuapa system such as Lomela, Salonga, Yenge, Luilaka and Lokolo. Areas along
consommés (donc dispersés) par les éléphants baissent dans une bande de 20 m du centre de la piste tandis que ceux des plantes dont les feuilles sont consommées par les éléphants croissent, créant ainsi deux gradients opposés. Trois points optimums ont été décrits, suggérant que les pistes d’éléphants fluctuent au cours du temps dans une bande donnée. En projetant les tendances issues des équations de ces deux gradients, un quatrième optimum est inféré à 76 m du centre des pistes auquel point les deux types de plantes seraient zéro. Sur base de cette donne, nous avions conclu que la bande minimale pour des corridors reliant les habitats fragmentés des éléphants serait autour de la distance de 150 + 2 m.
Mots clés supplémentaires : sous bois ouvert, pistes des éléphants, espèces des plantes fruitiers
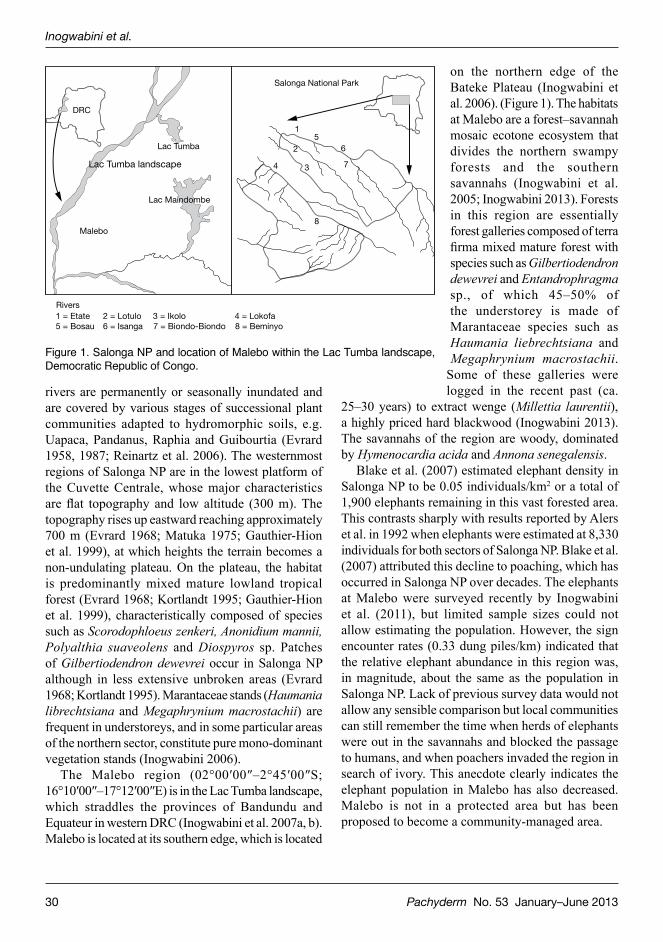
Inogwabini et al.
30 Pachyderm No. 53 January–June 2013
rivers are permanently or seasonally inundated and are covered by various stages of successional plant communities adapted to hydromorphic soils, e.g. Uapaca, Pandanus, Raphia and Guibourtia (Evrard 1958, 1987; Reinartz et al. 2006). The westernmost regions of Salonga NP are in the lowest platform of the Cuvette Centrale, whose major characteristics are flat topography and low altitude (300 m). The topography rises up eastward reaching approximately 700 m (Evrard 1968; Matuka 1975; Gauthier-Hion et al. 1999), at which heights the terrain becomes a non-undulating plateau. On the plateau, the habitat is predominantly mixed mature lowland tropical forest (Evrard 1968; Kortlandt 1995; Gauthier-Hion et al. 1999), characteristically composed of species such as Scorodophloeus zenkeri, Anonidium mannii, Polyalthia suaveolens and Diospyros sp. Patches of Gilbertiodendron dewevrei occur in Salonga NP although in less extensive unbroken areas (Evrard 1968; Kortlandt 1995). Marantaceae stands (Haumania librechtsiana and Megaphrynium macrostachii) are frequent in understoreys, and in some particular areas of the northern sector, constitute pure mono-dominant vegetation stands (Inogwabini 2006).
The Malebo region (02°00′00″–2°45′00″S; 16°10′00″–17°12′00″E) is in the Lac Tumba landscape, which straddles the provinces of Bandundu and Equateur in western DRC (Inogwabini et al. 2007a, b). Malebo is located at its southern edge, which is located
on the northern edge of the Bateke Plateau (Inogwabini et al. 2006). (Figure 1). The habitats at Malebo are a forest–savannah mosaic ecotone ecosystem that divides the northern swampy forests and the southern savannahs (Inogwabini et al. 2005; Inogwabini 2013). Forests in this region are essentially forest galleries composed of terra firma mixed mature forest with species such as Gilbertiodendron dewevrei and Entandrophragma sp., of which 45–50% of the understorey is made of Marantaceae species such as Haumania liebrechtsiana and Megaphrynium macrostachii.
Some of these galleries were logged in the recent past (ca.
25–30 years) to extract wenge (Millettia laurentii), a highly priced hard blackwood (Inogwabini 2013). The savannahs of the region are woody, dominated by Hymenocardia acida and Annona senegalensis.
Blake et al. (2007) estimated elephant density in Salonga NP to be 0.05 individuals/km2 or a total of 1,900 elephants remaining in this vast forested area. This contrasts sharply with results reported by Alers et al. in 1992 when elephants were estimated at 8,330 individuals for both sectors of Salonga NP. Blake et al. (2007) attributed this decline to poaching, which has occurred in Salonga NP over decades. The elephants at Malebo were surveyed recently by Inogwabini et al. (2011), but limited sample sizes could not allow estimating the population. However, the sign encounter rates (0.33 dung piles/km) indicated that the relative elephant abundance in this region was, in magnitude, about the same as the population in Salonga NP. Lack of previous survey data would not allow any sensible comparison but local communities can still remember the time when herds of elephants were out in the savannahs and blocked the passage to humans, and when poachers invaded the region in search of ivory. This anecdote clearly indicates the elephant population in Malebo has also decreased. Malebo is not in a protected area but has been proposed to become a community-managed area.
Lac Tumba
DRC
Salonga National Park
1
2
34
56
7
8
1 = EtateRivers
3 = Ikolo5 = Bosau 7 = Biondo-Biondo
2 = Lotulo 4 = Lokofa6 = Isanga 8 = Beminyo
Lac Maindombe
Malebo
Lac Tumba landscape
Figure 1. Salonga NP and location of Malebo within the Lac Tumba landscape, Democratic Republic of Congo.

Elephant effect on forest physical structure and plant species composition, DRC
Pachyderm No. 53 January–June 2013 31
Materials and methodsDuring a large mammal survey in Salonga NP from 1997 through 2005, data were collected from both forest reconnaissance and line transects from nine zones in the park (Reinartz et al. 2006). These data consisted of forest types, forest understoreys and estimated forest canopy covers. Transects of variable lengths were laid out in 11 field sites for a total effort of 100 km. In 7 of the 11 sites, transects were 1 km long; in the remaining zones they were 1.5 km long. Dung piles were counted along transects and habitat categories noted at each 100-m interval along transects and when each dung pile was encountered. Habitat categories included forest types, forest canopy cover and understorey. Forest categories were similar to those used by numerous other studies in Central Africa (e.g. Hall et al. 1997; White and Edwards 2000; Reinartz et al. 2006; Inogwabini et al. 2007a): mixed mature forest, old secondary forest and young secondary forest. Also following the Central African standards, these categories were associated with different types of canopy (open or closed) and different understoreys (open, woody, Marantaceae, lianas and mixed). Understoreys were defined as in White and Edwards (2000), Reinartz et al. (2006) and Inogwabini (2010) where open understorey meant few plant species and good visibility in the range of ≥ 50 m from where one stands; woody understorey was composed essentially of tree saplings; Marantaceae understorey was essentially composed of Marantaceae plants, either Haumania liebrechtsiana or Megaphrynium macrostachyum or both at the same location, characterized by dense ground vegetation made up of free-standing and liana-like species of herbaceous plants, mostly wild gingers and Marantaceae (Fay 1991). Liana understory was essentially composed of different species of lianas; mixed understorey was composed of plants of different life forms (saplings, lianas, Marantaceae, etc.). Understorey was defined, using Primack and Corlett (2009), as the vertical layer of forest between the ground and 8–10 m above the ground. Physical understorey structures are composed of terrestrial herbaceous vegetation, thickets and shrubs. By definition, these physical forest structures define the horizontal openness or visibility, which is defined as how far one can see while in a given forest type.
In the Malebo region (2007 through 2010), elephant trails were identified for the general elephant
monitoring programme. First, key plant species were defined as those plants on which elephants fed (Inogwabini et al. 2011). These plants were classified in two categories: category 1 was composed of species on whose fruits elephants fed and category 2 included species on which elephants browse leaves and young saplings. To detect seed deposition and seed survival probability gradients of key fruit species with distance from trails, 50-m long line transects were laid perpendicular to trails. Mean trail width was 30 cm (range 15–50); the 50-m transect length was used because it represented the mean deviation from the permanent elephant trails. When fresh elephant signs deviated from the permanent trail, we followed the new path until it was no longer clearly identifiable, at which point a GPS point was recorded. Mean distance between the end points of elephant deviation from the permanent trails were calculated post hoc to define how far away on either side of the permanent trail elephants would venture. The mean calculated deviation equalled 50 m (+ 5). On a strip of 1 m on both sides of these transects, key species trees were identified and counted. Their diameters at breast height (dbh) were also measured and their height estimated. Distance along transects was noted, and perpendicular distances to individual key species trees were measured.
Analytical frameworkBecause none of the 11 sites had sufficient elephant dung piles to allow calculation of elephant densities per site, we calculated the encounter rates that represent a relative abundance of elephant (Buckland et al. 1993; Hall et al. 1997; Strayer 1999; Walsh and White 1999). Encounter rates were calculated as the total numbers of dung piles found in each zone divided by the total length of transects in those zones (Buckland et al. 1993; Hall et al. 1997; Walsh and White 1999). Counts of forest types and understoreys were summed up and divided by the total of forest types in each site to give percentages of each forest understorey present in each of the 11 sites surveyed. To assess if there was a relationship between the openness of understorey categories and elephant relative abundance, we plotted percentages of open understorey for each site against the elephant dung pile encounter rate for each site. We then ran a linear regression to see if the openness of the understorey was explained by relative dung pile abundance.
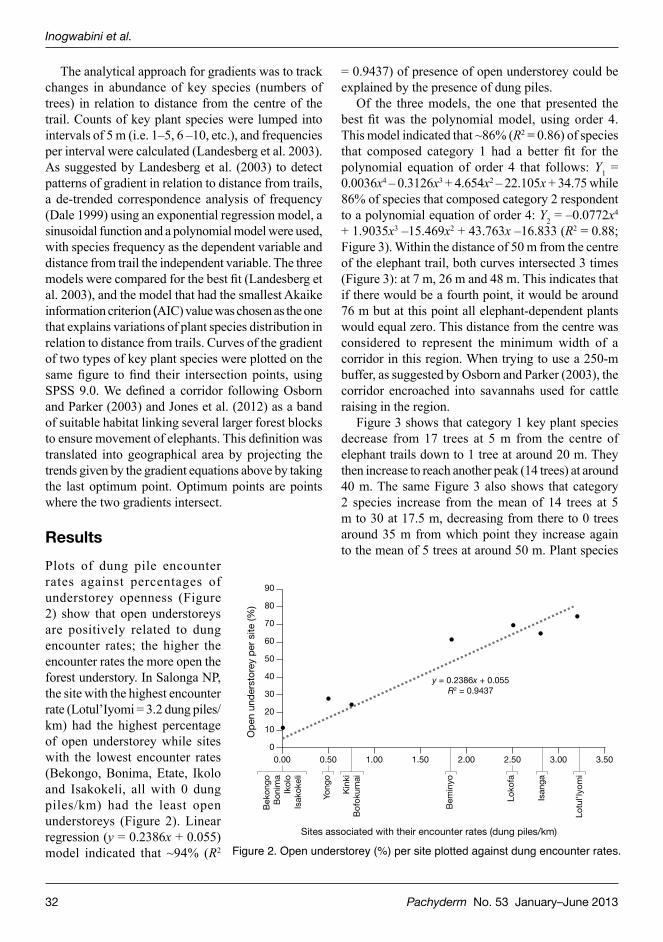
Inogwabini et al.
32 Pachyderm No. 53 January–June 2013
= 0.9437) of presence of open understorey could be explained by the presence of dung piles.
Of the three models, the one that presented the best fit was the polynomial model, using order 4. This model indicated that ~86% (R2 = 0.86) of species that composed category 1 had a better fit for the polynomial equation of order 4 that follows: Y1 = 0.0036x4 – 0.3126x3 + 4.654x2 – 22.105x + 34.75 while 86% of species that composed category 2 respondent to a polynomial equation of order 4: Y2 = –0.0772x4 + 1.9035x3 –15.469x2 + 43.763x –16.833 (R2 = 0.88; Figure 3). Within the distance of 50 m from the centre of the elephant trail, both curves intersected 3 times (Figure 3): at 7 m, 26 m and 48 m. This indicates that if there would be a fourth point, it would be around 76 m but at this point all elephant-dependent plants would equal zero. This distance from the centre was considered to represent the minimum width of a corridor in this region. When trying to use a 250-m buffer, as suggested by Osborn and Parker (2003), the corridor encroached into savannahs used for cattle raising in the region.
Figure 3 shows that category 1 key plant species decrease from 17 trees at 5 m from the centre of elephant trails down to 1 tree at around 20 m. They then increase to reach another peak (14 trees) at around 40 m. The same Figure 3 also shows that category 2 species increase from the mean of 14 trees at 5 m to 30 at 17.5 m, decreasing from there to 0 trees around 35 m from which point they increase again to the mean of 5 trees at around 50 m. Plant species
The analytical approach for gradients was to track changes in abundance of key species (numbers of trees) in relation to distance from the centre of the trail. Counts of key plant species were lumped into intervals of 5 m (i.e. 1–5, 6 –10, etc.), and frequencies per interval were calculated (Landesberg et al. 2003). As suggested by Landesberg et al. (2003) to detect patterns of gradient in relation to distance from trails, a de-trended correspondence analysis of frequency (Dale 1999) using an exponential regression model, a sinusoidal function and a polynomial model were used, with species frequency as the dependent variable and distance from trail the independent variable. The three models were compared for the best fit (Landesberg et al. 2003), and the model that had the smallest Akaike information criterion (AIC) value was chosen as the one that explains variations of plant species distribution in relation to distance from trails. Curves of the gradient of two types of key plant species were plotted on the same figure to find their intersection points, using SPSS 9.0. We defined a corridor following Osborn and Parker (2003) and Jones et al. (2012) as a band of suitable habitat linking several larger forest blocks to ensure movement of elephants. This definition was translated into geographical area by projecting the trends given by the gradient equations above by taking the last optimum point. Optimum points are points where the two gradients intersect.
ResultsPlots of dung pile encounter rates against percentages of understorey openness (Figure 2) show that open understoreys are positively related to dung encounter rates; the higher the encounter rates the more open the forest understory. In Salonga NP, the site with the highest encounter rate (Lotul’Iyomi = 3.2 dung piles/km) had the highest percentage of open understorey while sites with the lowest encounter rates (Bekongo, Bonima, Etate, Ikolo and Isakokeli, all with 0 dung piles/km) had the least open understoreys (Figure 2). Linear regression (y = 0.2386x + 0.055) model indicated that ~94% (R2 Figure 2. Open understorey (%) per site plotted against dung encounter rates.
Bek
ongo
Bon
ima
Ikol
oIs
akok
eli
Yong
o
0
10
20
30
40
50
Op
en u
nder
stor
ey p
er s
ite (%
)
y = 0.2386x + 0.055R2 = 0.9437
Sites associated with their encounter rates (dung piles/km)
0.00 0.50 1.00 1.50 2.00 2.50 3.00 3.50
60
70
80
90
Kin
kiB
ofok
umai
Bem
inyo
Loko
fa
Isan
ga
Lotu
l’Iyo
mi

Elephant effect on forest physical structure and plant species composition, DRC
Pachyderm No. 53 January–June 2013 33
0
0 5 10 15
Curve Y1
Curve Y2
species of category 1
species of category 2
20 25 30 35 40 45 50
5
10
15
20
25
30
Distance (m) from elephant trails
Tree
sp
ecie
s p
er c
ateg
ory
(no.
)
Figure 3. Plants eaten by elephants and their distribution near elephant trails in the Malebo region.
measured were those that were identified by Inogwabini et al. (2011) to constitute the major diet of elephants at Malebo. They included Plagiostyles africana, Entandrophragma sp., Irvingia sp., Anonidium mannii, Desplatia dewevrei and Musanga cecropioides. Tree dbh varied between the intervals, generally decreasing from the interval 0–5 m where the largest trees were found (mean dbh ~52 cm; range = 10–159 cm) whereas the small trees were those that were located at 21–25 cm from permanent elephant trails (Figure 4).
DiscussionEffects of elephants on ecosystems in which they dwell have been documented from different sites across Africa (Western 1989) and would seem self-evident. However, there is little documentation of such hardly surprising inferences. Evidence of seed dispersing and reports on elephants structuring physical habitat where they occurred abound in the savannah ecosystems (Lamprey et al. 1974; Ben-Shahar 1993, 1999) but is scanty in the context of tropical forests of Central Africa (Blake and Hedges 2004). Data on the ecology of the forest elephant are difficult to find. Under circumstances of high density and limited movement elephants may even destroy seeds they sow (Gauthier-Hion 2003) and damage their habitats (Ben-Shahar 1998). Figure 2 indicates that open forest understorey was related to relative abundance of elephants, which has been also documented in other forests of the Congo Basin (Vanleeuwe et al. 1998), albeit without quantitative measures. The same patterns emerged from other regions where elephants cleared the understorey vegetation (Mipro et al. 2000). In the Congo Basin, the same patterns were described by Blake (2002) in Nouabale-Ndoki, Republic of Congo, by Carroll (1988) in Dzanga-Sangha, Central African Republic, and by Stromayer and Ekobo (1992) and Ekobo (1995) in southeastern Cameroon.
These patterns can be explained by the fact that elephant movements are concentrated along well-defined trails and that they disperse seeds (Tchamba 1998; Blake 2002) along these trails. The seeds they disperse should be deposited at greater quantities on
and near elephant trails. This would imply that seed density of elephant-dispersed fruits (and therefore their trees) decreases with distance from permanent elephant trails. For this category of species, it is known that elephants browse both saplings and trees close by their trails and usually kill them. These species’ survival probability is likely to increase with distance from elephant trails, as a consequence of decreased elephant activity with distance from trail.
Hence, this study shows that two competing gradients emerge with respect to the distribution of key fruit plant species and key leaf plant species with distance from elephant trails. The first gradient may
0
10
20
30
40
50
60
0 0–5 6–10 11–15 16–20 21–25
Distance intervals (m) from elephant permanent trails
Mea
n tr
ees
db
h p
er in
terv
al
Figure 4. Mean tree diameter at breast height (dbh) per distance intervals from the centre of permanent elephant trails.
Inogwabini et al.
34 Pachyderm No. 53 January–June 2013
reflect seed deposition rate, which decreases with distance from trails, and the second is a mimic of tree survival probability, which increases with distance from trails. As suggested by Kent and Coker (1992), there are theoretical ecological optimum points (3 in 50 m from trails of Malebo; Figure 3) where these two gradients intersect. These points are where seed deposition (as depicted by the category 1 species), germination (depending on multiple factors not documented herein), and survival (as depicted by category 2 species) are maximized. Of course, the locations of these points depend on other factors, such as the effects of canopy, soil and water regimes.
The fact that there are three ecological optimum points indicates a swing in trail emplacements over time. This fact has been documented in earlier studies in Central Africa (Vanleeuwe and Gauthier-Hion 1998; Vanleeuwe et al. 1998) and does clearly demonstrate that trails are displaced over time to locations where optimal germination occurs and which subsequently produced greater concentrations of fruit trees. As time goes on, seed survival probability will increase in areas where trails were previously located as a consequence of a shift in elephant activity towards areas that previously had no fruiting trees. With the swing in trails emplacement over time, Figure 3 also shows that there is a positive feedback loop between elephants and the changes they induce in forest species composition. In this perspective, elephants and plants on which they feed may be thought of as a system of mutualistic exploitation through which elephants reintroduce key plant species and these species maintain elephant presence. In the absence of external disturbance by people, elephants and key plant species interaction is likely to be a self-maintaining mutualistic system (Kot 2001). However, as suggested by Crawley (1997), this self-maintaining mutualistic system is inherently related to elephant densities. Space plays a critical role in this system, as already indicated by Wilson (2000) and Jansen and De Roos (2001). With current trends in the conservation of forest elephants and given the mutualistic system of elephant–plant interactions, a potential consequence that might be expected at the landscape scale is that the fragmentation of habitat as a result of logging concessions, roads and increased human settlements will lead to a concentration of both elephants and mutualistic plant species in closed units (Kangwana 1995; Sam et al. 1998; Wasilwa 2003). This will result in elephants destroying the plant species on which they feed and physically destroying
other species within their ecosystems as was the case in other areas (Calenge et al. 2002), inevitably leading to heightened human–elephant conflicts (Tchamba 1995, 1996; Hoare 1999; Wasilwa 2003) and, in the long run, to the annihilation of elephants (Baxter 1996).
A more practical outcome of this study is learning that the two gradients meet again in 76 m from the centre of the elephant trails. This suggests that a 76-m width on each side of elephant trail (making a total of 152 m) would provide a minimum necessary strip to allow elephants to move freely from one point to other. Metrics defining ecological corridors are not easily available. Therefore, this result is critical, as the elephant population at Malebo is in a logging concession. Of course, this is just the minimum width on both sides of permanent trails and should not be taken as all that is needed for planning purposes, as there is need to account for other criteria that contribute to the definition of ecological corridors.
AcknowledgementsData from Salonga NP were collected while the first three authors worked for the Zoological Society of Milwaukee. The data from Malebo were collected by the WWF Lac Tumba Programme with funding received from the Central African Regional Programme for Environment (CARPE) of USAID. Views expressed in this paper are those of the authors and do not reflect the views of USAID or the American government. Comments from anonymous reviewers helped improved the quality of earlier drafts of this paper.
ReferencesAlers MPT, Blom A, Sikubwabo K, Masunda T, Barnes
RFW. 1992. Preliminary assessment of the status of forest elephants in Zaire. African Journal of Ecology 30:279–291.
Baxter PWJ. 1996. Modeling the impact of the African elephant, Loxodonta africana, on woody vegetation in semi-arid savannas. PhD thesis, University of California at Berkeley, USA.
Ben-Shahar R. 1993. Patterns of elephant damage to vegetation in northern Botswana. Biological Conservation 65:249–256.
Ben-Shahar R. 1998. Changes in structure of savanna woodlands in northern Botswana following the impacts of elephants and fire. Plant Ecology 136:189–194.
Elephant effect on forest physical structure and plant species composition, DRC
Pachyderm No. 53 January–June 2013 35
Ben-Shahar R. 1999. Elephants and their woodland habitats in northern Botswana. Pachyderm 27:101–104.
Blake S. 2002. The ecology of forest elephant distribution and its implications for conservation. PhD thesis. University of Edinburgh, Edinburgh, UK.
Blake S, Deem SL, Mossimbo E, Maisels F, Walsh PD. 2009. Forest elephants: tree planters of Congo. Biotropica 41:459–468.
Blake S, Douglas-Hamilton I, Karesh WB. 2001. GPS telemetry of forest elephants in Central Africa: results of preliminary study. African Journal of Ecology 39:178–186.
Blake S, Hedges S. 2004. Sinking flagships: the case of forest elephants in Asia and Africa. Conservation Biology 18:1191–1202.
Blake S, Inkamba-Nkulu C. 2004. Fruit, minerals, and forest elephant trails: do all roads lead to Rome? Biotropica 36:392–401.
Blake S, Strindberg S, Boudjan P, Makombo C, Inogwabini BI, Omari I, Grossmann F, Bene-Bene L, de Semboli B, Mbenzo V, S’hwa D, Bayogo R, Williamson EA, Fay M, Maisels F. 2007. Forest elephant crisis in the Congo Basin. PloS Biology 5(4):1–9.
Bossen B. 1998. Research on African elephant Loxodonta africana (Blumenbach 1797): a biography. African Journal of Ecology 36:371–376.
Buckland ST, Anderson DR, Burnham KP, Laake JL. 1993. Distance sampling: estimating abundance of biological populations. Chapman & Hall, London.
Calenge C, Maillard D, Gaillard JM, Merlot L, Peltier R. 2002. Elephant damage to trees of wooded savanna in Zakouma National Park, Chad. Journal of Tropical Ecology 18:599–614.
Campos-Arceiz A, Blake S. 2011. Megagarderners of forest—the role of elephants in seed dispersal. Acta Oecologica 37:542–553.
Carroll RW. 1988. Elephants of the Dzangha-Sangha dense forests of south-western Central African Republic. Pachyderm 10:12–15.
Chapman LJ, Chapman CA, Wrangham RW. 1992. Balanites wilsoniana: elephant-dependent dispersal? Journal of Tropical Ecology 8:275–283.
Crawley MJ. 1997. Plant–herbivore dynamics. In: Crawley MJ, editor, Plant ecology. 2nd ed. Blackwell Science, UK.
Dale MR. 1999. Spatial pattern analysis in plant ecology. Cambridge University Press. Cambridge, UK.
Demeke Y, A Bekele. 2000. Study on the elephants of Mago National Park, Ethiopia. Pachyderm 28:32–43.
Dublin HT. 1995. Vegetation dynamics in the Serengeti–Mara ecosystem: the role of elephants, fire, and other factors. In: Sinclair ARE, Arcese P, editors. Serengeti II: dynamics, management and conservation of an ecosystem. University of Chicago Press, Chicago. pp. 71–90.
Dublin HT, Sinclair ARE, McGlade J. 1990. Elephants and fires as causes of multiple stable states in the Serengeti–Mara woodlands. Journal of Animal Ecology 59:1147–1167.
Ekobo A. 1995. Conservation of the African forest elephant (Loxodonta africana) in Lobeke, southeast Cameroon. PhD thesis. Durrell Institute of Conser-vation and Ecology, University of Kent, Canterbury, UK.
Evrard C. 1968. Recherches écologiques sur le peuple-ment forestier de sol hydromorphe de la cuvette centrale congolaise. Office National de la Recherche pour le Développement/ L’Institut national pour L’Étude agronomique du Congo, Ministère Belge de l’Education et de la Culture, Bruxelles, Belgique.
Evrard C. 1987. Cadre biogéographique du Parc National de la Salonga. In: Département des affaires foncières, environnement et conservation de la nature, editor, Premier colloque international sur la gestion et l’avenir du Parc National de la Salonga. UNESCO. pp. 43–48.
Fay JM. 1991. An elephant (Loxodonta africana) survey using dung counts in the forests of the Central African Republic. Journal of Tropical Ecology 7:25–36.
Gauthier-Hion A. 2003. Les éléphants ne sont pas toujours de bons disperseurs de graines. Canopée 23:13–14.
Gauthier-Hion A, Colyn M, Gauthier JP. 1999. Histoire naturelle des primates d’Afrique Centrale. ECOFAC–UDEAC Multipress, Gabon.
Gibson DC, Craig GC, Masogo RM. 1998. Trends of the elephant population in northern Botswana from aerial survey data. Pachyderm 25:14–27.
Guldemond R, Van Aarde R. 2007. A meta-analysis of the impact of African elephants on savannah vegetation. Journal of Wildlife Management 72:892–897.
Guy PR. 1976. The feeding behaviour of elephant in the Sengwa area, Rhodesia. South African Journal of Wildlife Research 6:55–63.
Hall JS, Inogwabini BI, Williamson EA, Omari I, Sikubwabo C, White LJT. 1997. A survey of elephants (Loxodonta africana) in Kahuzi-Biega National Park lowland sector and adjacent forest in eastern Zaire. African Journal of Ecology 35:213–223.
Inogwabini et al.
36 Pachyderm No. 53 January–June 2013
Hoare RE. 1999. Determinants of human–elephant conflict in a land-use mosaic. Journal of Applied Ecology 36:689–700.
Höft R, Höft M. 1995. The differential effects of elephants on rain forest communities in the Shimba Hills, Kenya. Biological Conservation 73:67–79.
Howe HF, Westley LC. 1997. Ecology of pollination and seed dispersal. In: Crawley MJ, editor, Plant ecology, Blackwell Science, UK.
Inogwabini BI. 2006. A preliminary checklist of mammals and plants: conservation status of some species in Salonga National Park, Democratic Republic of Congo. Endangered Species Update 23:104–117.
Inogwabini BI. 2013. The Lake Télé–Lake Tumba Landscape. In: Howarth RW, editor, Biomes and ecosystems: an encyclopaedia. Salem Press and Golson Media.
Inogwabini BI, Bewa M, Longwango M, Abokome M, Vuvu M. 2007a. The bonobos of the Lake Tumba–Lake Maindombe hinterland: threats and opportunities for population conservation. In: Furuichi T, Thompson J, editors, The bonobos: behavior, ecology, and conservation. Springer, New York. pp. 273–290.
Inogwabini BI, Matungila B, Mbende L, Abokome M, Tshimanga WT. 2007b. Great apes in the Lake Tumba landscape, Democratic Republic of Congo: newly described populations. Oryx 41:1–7.
Inogwabini BI, Mbende L, Abokome M. 2011. The relic population of forest elephants near Lac Tumba, Democratic Republic of Congo: abundance, dung decay, food items and movements. Pachyderm 49:40–47.
Inogwabini BI, Omari I, Mbayma AG, Zasy NG. 2005. Protected areas of the Democratic Republic of Congo: a habitat gap analysis to guide the extension of the network. Endangered Species Update 22:71–82.
Inogwabini BI, Sandokan MB, Ndunda M. 2006. A dramatic decline in rainfall regime in the Congo Basin: evidence from a thirty-four year data set from the Mabali Scientific Research Centre, Democratic Republic of Congo. International Journal of Meteorology 31:278–285.
Jansen VAA, De Roos AM. 2001. The role of the space in reducing predator–prey cycles. In: Dieckmann U, Law R, Metz JAJ, editors, Geometry of ecological interactions: simplifying spatial complexity. Cambridge University Press, Cambridge, UK.
Jones T, Bamford AJ, Ferrol-Schulte D, Hieronimo P, McWilliam N, Rovero F. 2012. Vanishing wildlife corridors and options for restoration: a case study from Tanzania. Tropical Conservation Science 5:463–474.
Kangwana KF. 1995. Human–elephant conflict: the challenge ahead. Pachyderm 19:11–14.
Kent M, Coker P. 1992. Vegetation description and analysis: a practical approach. Wiley, New York.
Kortlandt A. 1995. A survey of the geographical range, habitat and conservation of the pygmy chimpanzee (Pan paniscus): an ecological perspective. Primate Conservation 16:21–36.
Kot M. 2001. Elements of mathematical ecology. Cambridge University Press, Cambridge, UK.
Lamprey HF, Halevy G, Makacha S. 1974. Interactions between acacia, bruchid seed beetles and large herbivores. East African Wildlife Journal 12:81–85.
Landesberg J, James CD, Morton SR, Müller W, Stol J. 2003. Abundance and composition of plant species along grazing gradients in Australian rangelands. Journal of Applied Ecology 40:1008–1024.
Laws RM. 1970. Elephants as agents of habitat and landscape change in East Africa. Oikos 21:1–15.
Leuthold W. 1977. Spatial organisation and strategy of habitat utilisation of elephants in Tsavo National Park, Kenya. Zeitschrift fur Saugetierkunde 42:358–379.
Lindsay K. 1996. Studying elephant–habitat interactions. In: Kangwana K, editor, Studying elephants. African Wildlife Foundation, Nairobi, Kenya.
Lombard AT, Johnson, CF, Cowling RM, Pressey RL. 2001. Protecting plants from elephants: botanical reserve scenarios within the Addo Elephant National Park, South Africa. Biological Conservation 102:191–203.
Matuka K. 1975. La conservation de la nature au Zaïre: aspects. Editions Lokole, Kinshasa, Zaïre.
McKnight B. 2000. Changes in elephant demography, reproduction and group structure in Tsavo East National Park (1966–1994). Pachyderm 29:15–24.
Mipro H, Boussim IJ, Sita G. 2000. Eléphants et dissémination des graines de quelques espèces végétales dans le Ranch de Gibier de Nazinga (sud du Burkina Faso). Pachyderm 29:29–38.
Moss CJ. 2001. The demography of an African elephant (Loxodonta africana) population in Amboseli, Kenya. Journal of Zoology 255:145–156.
Nyakaana S, Abe EL, Arctander P, Siegismund HR. 2001. DNA evidence for elephant social breakdown in Queen Elizabeth National Park, Uganda. Animal Conservation 4:231–237.
Osborn FV, Parker GE. 2003. Linking two elephant refuges with a corridor in the communal lands of Zimbabwe. African Journal of Ecology 41:68–74.
Elephant effect on forest physical structure and plant species composition, DRC
Pachyderm No. 53 January–June 2013 37
Pretorius Y, de Boer FW, van der Waal C. 2011. Soil nutrient status determines how elephants utilize trees and shape environments. Journal of Animal Ecology 80:875–883.
Primack RB, Corlett RT. 2009. Tropical rain forests: an ecological and biogeographical comparison. Wiley, London.
Prins HHT, Van Der Jeugd HP, Beekman JH. 1994. Elephant decline in Lake Manyara National Park, Tanzania. African Journal of Ecology 32:185–191.
Reinartz G, Inogwabini BI, Mafuta N, Lisalama WW. 2006. Effects of forest type and human presence on bonobo (Pan paniscus) density in the Salonga National Park. International Journal of Primatology 27:603–634.
Sam MK, Barnes RFW, Kotchikpa O. 1998. Elephants, human ecology and environmental degradation in northeastern Ghana and northern Togo. Pachyderm 26:61–68.
Shannon G, Thaker M, Vanak AT, Page BR, Grant RC, Slotow R. 2011. Relative impacts of elephants and fire on large trees in a savanna ecosystem. Ecosystems 5:1372–1381.
Strayer DL. 1999. Statistical power of presence–absence data to detect populations declines. Conservation Biology 13:1034–1038.
Stromayer KAK, Ekobo A. 1992. Distribution and number of forest-dwelling elephants in extreme south-eastern Cameroon. Pachyderm 15:9–14.
Tchamba MN. 1998. Habitudes migratoires des éléphants et interactions homme–éléphant dans la Région de Waza-Logone (Nord-Cameroun). Pachyderm 25:53–66.
Tchamba M. 1995. The problem elephants of Kaele: a challenge for elephant conservation in northern Cameroon. Pachyderm 19:23–27.
Tchamba MN. 1996. History and present status of the human–elephant conflict in the Waza-Logone Region, Cameroon. Biological Conservation 75:35–41.
Vanak AT, Shannon G, Thaker M, Page BR, Grant RC, Slotow R. 2012. Biocomplexity in large tree mortality: interactions between elephant, fire and landscape in an African savanna. Ecography 35:315–321.
Vanleeuwe H, Gauthier-Hion A. 1998. Forest elephant paths and movements at the Odzala National Park, Congo: the role of clearings and Marantaceae forests. African Journal of Ecology 36:174–182.
Vanleeuwe H, Gauthier-Hion A, Cajani S. 1998. Forest clearings and the conservation of elephants (Loxodonta africana cyclotis) in the north Congo Republic. Pachyderm 24:46–52.
Verschuren J. 1987. L’action des éléphants et des hippopotames sur l’habitat au parc national des Virunga, Zaïre : évolution chronologique de leurs populations. Bulletin de l’Institut Royal des Sciences Naturelles de Belgique 57:5–16.
Walsh PD, White LJT. 1999. What it will take to monitor forest elephant populations. African Journal of Ecology 13:1194–1202.
Wasilwa NS. 2003. Human–elephant conflict in the Masai Mara dispersal areas of Transmara District. PhD thesis. Durrell Institute for Conservation and Ecology, University of Kent, Canterbury, UK.
Western D. 1989. The ecological role of elephants in Africa. Pachyderm 12:42–45.
White LJT, Edwards A. 2000. Methods for assessing the status of animal populations. In: White LJT, Edwards A, editors, Conservation research in the African rain forests: a technical handbook. Wildlife Conservation Society. New York, USA.
Wilson W. 2000. Simulating ecological and evolutionary systems in C. Cambridge University Press, Cambridge, UK.
38 Pachyderm No. 53 January–June 2013
Ngene et al.
Status and trends of the elephant population in the Tsavo–Mkomazi ecosystem
Shadrack Ngene,1* Steve Njumbi,2 Martha Nzisa,1 Kenneth Kimitei,1 Joseph Mukeka,3 Shadrack Muya,4 Festus Ihwagi 5 and Patrick Omondi 6
1 Kenya Wildlife Service, Biodiversity Research and Monitoring, Tsavo Conservation Area, PO Box 14, Voi, Kenya2 International Fund for Animal Welfare, PO Box 25399 – 00603, Nairobi, Kenya3 Kenya Wildlife Service, Biodiversity Research and Monitoring, GIS Unit, PO Box 40241 – 00100, Nairobi, Kenya4 Jomo Kenyatta University of Agriculture and Technology, PO Box 62000 – 00200, Nairobi, Kenya5 Save the Elephants, PO Box 54667 – 00200, Nairobi, Kenya6 Kenya Wildlife Service, Biodiversity Research and Monitoring, Species Conservation and Management, PO Box 40241 – 00100, Nairobi, Kenya*Corresponding author email: [email protected] or [email protected]
AbstractThis paper updates the data on the population status of elephants in the Tsavo–Mkomazi ecosystem. Data were acquired through aerial census of elephants in the ecosystem, from 7 to 12 February 2011. The census covered an area approximately 48,319 km2, which was divided into 44 counting blocks. Each block was assigned to a specific aircraft; the crew consisted of a pilot, front-seat observer and two rear-seat observers for the four-seater light aircraft, and a pilot and an observer for a two-seater light aircraft. The census lasted five days and involved nine light aircraft and about 252 hours of actual counting time, representing a mean search rate of about 191 km2/hr. A total of 12,573 elephants were counted, indicating a modest increase of 2% after the 2008 census and a 96% increase after the 1988 census (n = 6,399). Most elephants (69%, n = 8,614 individuals) were counted inside the protected areas; about 31% (n = 3,859 individuals) were outside protected areas. About 50% of the elephants (n = 6,214) were in Tsavo East National Park, 22% (n = 2,751) in the Taita ranches and 17% (n = 2,142) in Tsavo West National Park. A programme of providing water to elephants in the northern parts of Tsavo is recommended as well as electric fencing and establishment of administration and security structures at South Kitui National Reserve. This will create more space for the increasing population of elephants as well as improve their security.
Additional key words: aerial census, carcass, drought
RésuméCe document met à jour les donnés sur la situation des populations d’éléphants dans l’écosystème de Tsavo-Mkomazi. Les données ont été acquises grâce à un recensement aérien des éléphants dans l’écosystème, du 7 au 12 février 2011. Ce recensement a couvert une superficie d’environ 48.319 km2, qui était divisée en 44 blocs de comptage. On avait assigné à chaque bloc un avion spécifique, l’équipage étant composé, pour l’avion léger à quatre places, d’un pilote, d’un observateur sur le siège avant et de deux observateurs sur le siège arrière, et pour un avion léger biplace, d’un pilote et d’un observateur. Le recensement, auquel ont participé neuf avions légers, a pris cinq jours et environ 252 heures de temps de comptage réel, ce qui représente un taux de recherche moyen d’environ 191 km2/heure. Un total de 12.573 éléphants ont été dénombrés, ce qui indique une légère augmentation de 2% après le recensement de 2008 et une augmentation de 96% après le recensement de1988 (n = 6.399). La majorité des éléphants (69%, n = 8.614 éléphants) ont été comptés à l’intérieur des aires protégées; environ 31% (n = 3.859 éléphants) étaient en dehors des aires protégées. Environ 50% des éléphants (n = 6,214) étaient dans le Parc national de Tsavo-Est, 22% (n = 2,751) dans les ranchs de Taita et 17% (n = 2,142) dans
Pachyderm No. 53 January–June 2013 39
Status and trends of the elephant population in the Tsavo–Mkomazi ecosystem
le Parc national de Tsavo Ouest. Un programme d’approvisionnement en eau pour les éléphants au nord de Tsavo est recommandé ainsi que les clôtures électriques et une mise en place des structures administratives et sécuritaires dans la Réserve nationale du sud-Kitui. Cela va créer plus d’espace pour l’augmentation de la population d’éléphants ainsi qu’améliorer leur sécurité.
Mots clés supplémentaires : recensement aérien, carcasse, sécheresse
parks. The proportion of ‘recent’ carcasses however did not change significantly, confirming illegal killing was still taking place through 1988 when the ‘recent’ carcass ratio peaked at 6.69%. Despite this, the 1989 count was the first authoritative confirmation that the elephant population was on a recovery course, a trend observed till 2008.
The 2002 wet season survey was undertaken as part of Kenya Wildlife Service (KWS) and Monitoring of Illegal Killing of Elephants (MIKE) joint initiatives to establish the status of Tsavo’s elephant population and provide baseline data on poaching. The count revealed that the Tsavo population had increased by 5% since 1999, from 8,068 to 9,284 (Kahumbu et al. 1999). Fifty percent (n = 10) of the recent carcasses were recorded in Galana, where poaching pressure was high in the 1970s and 1980s. The figure could have been an underestimate as the thick vegetation may have obscured some carcasses. The census noted a remarkable increase in livestock in the protected areas from about 820 animals in 1999 to about 5,190 animals in 2002 (Omondi et al. 2002).
It is important to caution against direct comparisons of results of past aerial counts due to different methodologies, counting effort and climatic conditions between the years (Douglas-Hamilton et al. 1994). For instance, this possibly explains the large discrepancies observed between sample and total counts in the 1970s. Over the years, elephant densities varied considerably both by blocks and through time, from as low as 0.002 elephants/km2 in Galana to as high as 0.921 elephants/km2 in Tsavo East south (Douglas-Hamilton et al. 1994; Kahumbu et al. 1999; Omondi et al. 2002; Omondi and Bitok 2005; Omondi et al. 2008). Surface water availability and security are believed to be the major factors influencing elephant distribution. In 2002, a dramatic shift in elephant distribution was observed between Tsavo East north and Tsavo East south, as the former had received more rainfall prior to the count (Omondi et al. 2002). Understanding these ecosystem-use dynamics by elephants and other large mammals is important in their management.
IntroductionThe Tsavo ecosystem is home to Kenya’s largest elephant population (Blanc et al. 2007). This popula-tion was over 35,000 animals by the end of 1974 (Cobb 1976) and about 11,733 in 2008 (Omondi et al. 2008). The February 2011 dry season census was conducted one year after the severe drought of 2009 to early 2010 when it was feared that many elephants (Loxodonta africana) had succumbed, as had happened during the unusually dry conditions of 1970 and 1971 that led to elephant mortality of unanticipated magnitude. Between 6,000 and 9,000 elephants died in the eastern sector of Tsavo National Park (Corfield 1973; Cobb 1976).
The ecosystem has been the subject of detailed sample and total aerial counts since the early 1960s. Recent total counts include Olindo et al. (1988), Douglas-Hamilton et al. (1994), Kahumbu et al. (1999), Omondi et al. (2002), Omondi and Bitok (2005) and Omondi et al. (2008). Past sample counts include those by Cobb (1976), Leuthold (1976), WCMD (1976), IUCN (1978) and Inamdar (1996). Both sample and total counts in the 1970s showed remarkably high numbers of elephants, though sample counts appear to have overestimated the numbers by a wide margin—almost twice the total count figures.
The 1988 counts showed a 75% decline in elephant numbers within the protected areas and a further 87% decline in the adjacent non-protected areas since the 1972 total counts (Olindo et al. 1988). Two major factors have contributed to the observed overall continental decline of elephant numbers: reduced carrying capacity of Africa for elephants due to habitat change, and hunting for ivory (Milner-Gulland and Beddington 1993a,b). Since 1988, there has been a steady increase in elephant numbers. The 1988 distribution of ‘recent’ carcasses confirmed heavy poaching was still rampant, especially on the periphery of the parks, and the older carcasses confirmed that poaching had taken place in the heart of the reserves in the early 1980s. The distribution of elephants in 1989 confirmed that elephants previously counted along the periphery had moved further inside the
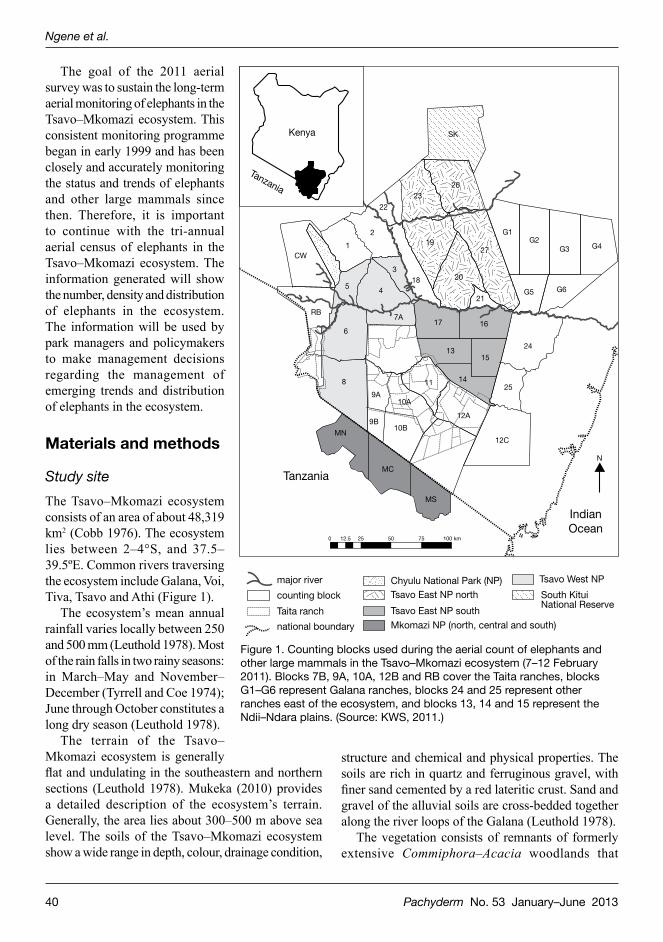
40 Pachyderm No. 53 January–June 2013
Ngene et al.
The goal of the 2011 aerial survey was to sustain the long-term aerial monitoring of elephants in the Tsavo–Mkomazi ecosystem. This consistent monitoring programme began in early 1999 and has been closely and accurately monitoring the status and trends of elephants and other large mammals since then. Therefore, it is important to continue with the tri-annual aerial census of elephants in the Tsavo–Mkomazi ecosystem. The information generated will show the number, density and distribution of elephants in the ecosystem. The information will be used by park managers and policymakers to make management decisions regarding the management of emerging trends and distribution of elephants in the ecosystem.
Materials and methods
Study siteThe Tsavo–Mkomazi ecosystem consists of an area of about 48,319 km2 (Cobb 1976). The ecosystem lies between 2–4°S, and 37.5–39.5ºE. Common rivers traversing the ecosystem include Galana, Voi, Tiva, Tsavo and Athi (Figure 1).
The ecosystem’s mean annual rainfall varies locally between 250 and 500 mm (Leuthold 1978). Most of the rain falls in two rainy seasons: in March–May and November–December (Tyrrell and Coe 1974); June through October constitutes a long dry season (Leuthold 1978).
The terrain of the Tsavo–Mkomazi ecosystem is generally flat and undulating in the southeastern and northern sections (Leuthold 1978). Mukeka (2010) provides a detailed description of the ecosystem’s terrain. Generally, the area lies about 300–500 m above sea level. The soils of the Tsavo–Mkomazi ecosystem show a wide range in depth, colour, drainage condition,
structure and chemical and physical properties. The soils are rich in quartz and ferruginous gravel, with finer sand cemented by a red lateritic crust. Sand and gravel of the alluvial soils are cross-bedded together along the river loops of the Galana (Leuthold 1978).
The vegetation consists of remnants of formerly extensive Commiphora–Acacia woodlands that
6
8
9A10A
10B9B
MN
MCTanzania
Kenya
Tanzania
IndianOcean
MS
major river
counting block
Taita ranch
national boundary
Tsavo East NP north
Tsavo East NP south
Tsavo West NPChyulu National Park (NP)
12A
12C
25
24
1513
14
17 16
11
7A
45
1CW
219
183
20
27
21
23
22
26
SK
G1G2
G3 G4
G5 G6
RB
0 12.5 25 50 75 100 km
N
Mkomazi NP (north, central and south)
South Kitui National Reserve
Figure 1. Counting blocks used during the aerial count of elephants and other large mammals in the Tsavo–Mkomazi ecosystem (7–12 February 2011). Blocks 7B, 9A, 10A, 12B and RB cover the Taita ranches, blocks G1–G6 represent Galana ranches, blocks 24 and 25 represent other ranches east of the ecosystem, and blocks 13, 14 and 15 represent the Ndii–Ndara plains. (Source: KWS, 2011.)
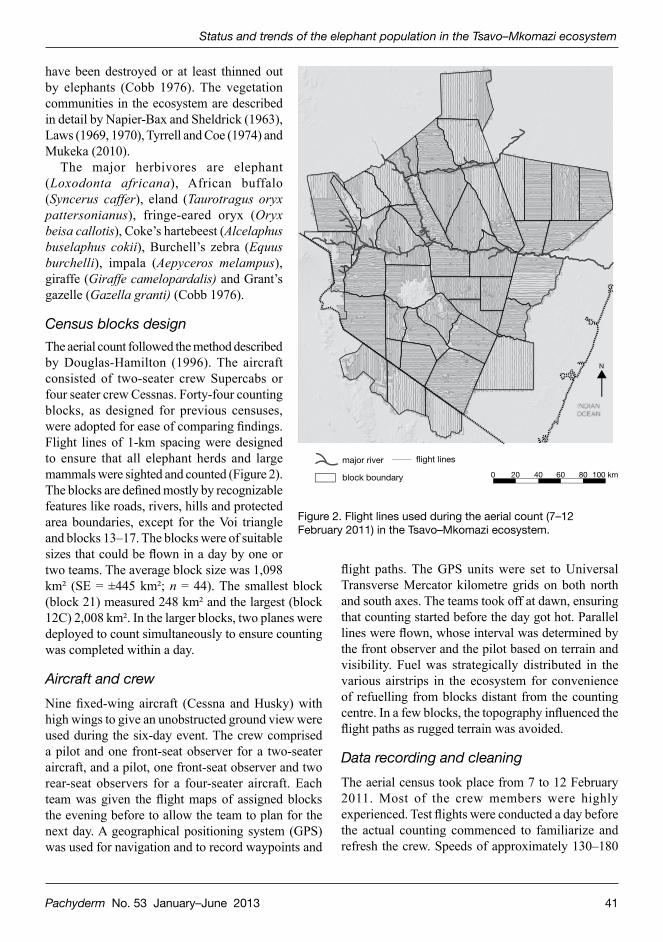
Pachyderm No. 53 January–June 2013 41
Status and trends of the elephant population in the Tsavo–Mkomazi ecosystem
flight paths. The GPS units were set to Universal Transverse Mercator kilometre grids on both north and south axes. The teams took off at dawn, ensuring that counting started before the day got hot. Parallel lines were flown, whose interval was determined by the front observer and the pilot based on terrain and visibility. Fuel was strategically distributed in the various airstrips in the ecosystem for convenience of refuelling from blocks distant from the counting centre. In a few blocks, the topography influenced the flight paths as rugged terrain was avoided.
Data recording and cleaningThe aerial census took place from 7 to 12 February 2011. Most of the crew members were highly experienced. Test flights were conducted a day before the actual counting commenced to familiarize and refresh the crew. Speeds of approximately 130–180
have been destroyed or at least thinned out by elephants (Cobb 1976). The vegetation communities in the ecosystem are described in detail by Napier-Bax and Sheldrick (1963), Laws (1969, 1970), Tyrrell and Coe (1974) and Mukeka (2010).
The major herbivores are elephant (Loxodonta africana), African buffalo (Syncerus caffer), eland (Taurotragus oryx pattersonianus), fringe-eared oryx (Oryx beisa callotis), Coke’s hartebeest (Alcelaphus buselaphus cokii), Burchell’s zebra (Equus burchelli), impala (Aepyceros melampus), giraffe (Giraffe camelopardalis) and Grant’s gazelle (Gazella granti) (Cobb 1976).
Census blocks designThe aerial count followed the method described by Douglas-Hamilton (1996). The aircraft consisted of two-seater crew Supercabs or four seater crew Cessnas. Forty-four counting blocks, as designed for previous censuses, were adopted for ease of comparing findings. Flight lines of 1-km spacing were designed to ensure that all elephant herds and large mammals were sighted and counted (Figure 2). The blocks are defined mostly by recognizable features like roads, rivers, hills and protected area boundaries, except for the Voi triangle and blocks 13–17. The blocks were of suitable sizes that could be flown in a day by one or two teams. The average block size was 1,098 km² (SE = ±445 km²; n = 44). The smallest block (block 21) measured 248 km² and the largest (block 12C) 2,008 km². In the larger blocks, two planes were deployed to count simultaneously to ensure counting was completed within a day.
Aircraft and crewNine fixed-wing aircraft (Cessna and Husky) with high wings to give an unobstructed ground view were used during the six-day event. The crew comprised a pilot and one front-seat observer for a two-seater aircraft, and a pilot, one front-seat observer and two rear-seat observers for a four-seater aircraft. Each team was given the flight maps of assigned blocks the evening before to allow the team to plan for the next day. A geographical positioning system (GPS) was used for navigation and to record waypoints and
major river
block boundary
�ight lines
400 60 80 100 km20
N
Figure 2. Flight lines used during the aerial count (7–12 February 2011) in the Tsavo–Mkomazi ecosystem.
42 Pachyderm No. 53 January–June 2013
Ngene et al.
km/hr and heights of about 200–400 ft (60–120 m) above ground level were maintained. Blocks separated by rivers were counted simultaneously to minimize double count or omission due to elephants crossing the river. Pilots flew overlaps of approximately 1–2 km into the adjacent blocks to ensure that herds moving into the block were not missed by either team. Both dead and live elephants were counted. Where large herds were encountered, the pilots circled to give observers ample time to count. Elephant carcasses were classified as ‘fresh’, ‘recent’, ‘old’ or ‘very old’, as described by Douglas-Hamilton and Hillman (1981). For analyses, the first and second categories were pooled as ‘recent’, and the third and fourth as ‘old’. Standard codes were used to denote elephants and the different categories of carcasses. Front-seat observers cleaned the data sheets when necessary before handing them over to the data entry team. Waypoints and tracks were downloaded onto ArcGIS 9.3. The tabulated species data were added onto the ArcGIS software and a spatial join was created based on the waypoint (Mitchell 2009). The file was converted into a shape file for each block. Duplicates in the zones of overlap of adjacent blocks were identified and corrected before merging all datasets into one for analysis and preparation of distribution maps.
Data analysisFor regression analysis, data were pooled for areas that were consistently surveyed from 1988 to 2011. These areas included Tsavo East (north), Tsavo East (south), Tsavo West, Mkomazi NP, and Galana and Taita ranches. The regression analysis followed the procedures described by Zar (1996). Fourth-order polynomial analysis was used to get the line of best fit during the regression analysis (Zar 1996).
The observed rate of population increase ( r̄ ) was calculated from the natural logarithms of the total number of elephants counted in 1988 and 2011 using the formula (Caughley 1977):
r̄ = logeNt – logeN0
where loge = natural logarithm; Nt = total number of elephants counted in 2011; N0 = total number of elephants counted in 1988.
The orientation of elephant distribution and the centre of their concentration were analysed using the standard deviational ellipse and mean centre (Esri
1997; Mitchell 2009). General distribution patterns (random, dispersed or clustered) and distribution of herd sizes were analysed for elephants. We tested for the general distribution patterns of the elephants using the Getis-Ord general G statistic as described by Mitchell (2009). The distribution of different herd sizes was mapped using the hot/cold-spot analysis; Getis-Ord Gitrations of large (hot spots) and small (cold sports) groups of elephants were sighed during the aerial survey (Esri 2007; Mitchell 2009). Z scores were used for interpretation of significance levels of statistical tests (Zar 1996). High positive Z score indicates a higher clustering for locations with large numbers of elephants while negative Z score indicates clustering of areas with small groups of elephants. The results were interpreted as described in detail by Mitchell (2009).
To analyse the relationship between elephant distribution and water pans (dry and wet) and rivers, a kernel density of the elephant was created as described by Mitchell (2009) using a search radius of 24 km (Mukeka 2010). A simple density surface for water pans (dry and wet) and distance surface for rivers was created as described by Mitchell (2009). Using spatial analyst tool in ArcGIS 9.3, the raster cell values of the respective surfaces were extracted onto the elephant count point shape-file (Esri 2007). Then the extracted values were exported into an MS Excel spreadsheet to obtain a set of elephant density data against distance to water pans and rivers. A simple correlation analysis was performed using this data as described by Zar (1996). The strength of the correlations was interpreted following guidelines described by Fowler et al. (1998).
The proportion of recent to old was calculated as an index of the previous year’s mortality (Douglas-Hamilton 1996), noting that 2009 to early 2010 was marked by a severe drought.
Results
Aerial census effortA total of about 252 hours of actual counting time was spent during the census. This represents a mean search rate of about 191 km2/hr or 5.2 hours for every 1,000 km2 in a counting area of about 48,319 km2. The search rate was more intense than the aerial counts in 1988, 1994 and other preceding counts (see Olindo et al. 1988; Douglas-Hamilton et al. 1994; Omondi et al. 2002; Omondi and Bitok 2005; Omondi et al.

Pachyderm No. 53 January–June 2013 43
Status and trends of the elephant population in the Tsavo–Mkomazi ecosystem
2008) although the difference in the number of hours spent per 1,000 km2 during this census and those of past aerial census (1988 to 2008) was not statistically significant.
Status and trends of elephantsThe estimate for the February 2011 aerial census was 12,573 elephants in the Tsavo–Mkomazi ecosystem, representing a modest increase of about 2% in the last three years (Table 1). Of these elephants 69% (n = 8,614) were counted inside the parks and 31% (n = 3,859) outside the parks. About 50% (n = 6,214) of the elephants were in Tsavo East NP, 22% (n = 2,751) in the Taita ranches and 17% (n = 2,142) in Tsavo West NP (Table 1). The number of elephants increased from about 6,399 in 1988 to about 12,573 in 2011, which represents a 96% increase in 23 years. From 1999 (n = 9,447), the population increased by 33%. A fourth-order polynomial regression analysis on trend of elephant numbers from 1988 to 2011 showed an increase in elephant population during the period (R2 = 0.99, n = 9, Figure 3). The estimated observed rate of population growth over the 23-year period was 0.68, representing an approximate annual growth rate of 0.03.
Distribution and density of elephantsFigure 4 shows the distribution of elephants in the ecosystem. Most of the herds were found in Tsavo East NP, within about 45 km north and south of the Galana River. High densities of about 1 elephant/km2 were recorded in Tsavo East NP, south of the Galana River (Figure 5).
The elephants exhibited a highly clustered distribution (Z score = 5.36, P = 0.01, critical value = 2.58). Taita ranches have the largest herds of elephant concentration while the smallest herds are found in Tsavo East north of the Galana River. The mean centre of the distribution was within the Ndara plains in Tsavo East NP, south of the Galana River (Figure 6). Elephants occurred as individuals (n = 213 Ta
ble
1. E
leph
ants
cou
nted
in th
e Ts
avo–
Mko
maz
i eco
syst
em fr
om 1
962
to 2
011
(no.
) Ar
ea20
1120
0820
0520
0219
9919
9419
9119
8919
8819
78*
1973
1972
1970
*19
69*
1965
*19
62Ts
avo
East
(N)
2,09
44,
118
2,49
94,
089
1337
399
450
134
770
220
9,01
16,
435
06,
619
8,05
64,
073
Tsav
o Ea
st (S
)4,
120
3,73
13,
896
2,08
732
212,
733
3,43
63,
020
2,28
32,
469
3,95
56,
633
6,00
85,
709
4,74
41,
358
Tsav
o W
est
2,14
22,
161
2,62
62,
168
2,11
93,
132
1,23
32,
106
1,27
41,
938
9,20
84,
328
6,59
28,
134
2,23
81,
394
Chy
ulu
NP
135
131
––
––
––
––
––
––
–So
uth
Kitu
i NR
00
00
––
––
––
––
––
––
Mko
maz
i NP
256
841
6377
302
131
1193
667
2,06
7–
––
–G
alan
a 39
830
811
1427
4650
7490
1,07
650
04,
379
–2,
964
–3,
540
Taita
2,
751
1,10
81,
292
828
1,24
528
71,
413
642
853
79–
1,23
5–
500
––
Rom
bo0
031
212
446
–19
3–
––
––
––
–O
ther
blo
cks
509
130
135
3026
5046
––
–30
010
0–
––
Out
side
16
838
1,37
61,
391
1,10
71,
644
966
1,03
6–
––
––
––
Tota
l (pa
rks)
8,61
410
,149
9,06
28,
344
6,75
46,
566
5,25
05,
271
4,42
05,
294
22,1
7419
,463
12,6
0020
,462
15,0
386,
825
Tota
l (no
n-pa
rks)
3,95
91,
584
2,68
094
02,
693
1,46
63,
157
1,72
81,
979
1,15
550
05,
914
100
3,46
4–
3,54
0To
tal
12,5
7311
,733
11,7
429,
284
9,44
78,
032
8,40
76,
999
6,39
96,
449
22,6
7425
,377
12,7
0023
,926
15,0
3810
,365
Sour
ce: L
euth
old
1973
; Olin
do e
t al.
1988
; Dou
glas
–Ham
ilton
et a
l. 19
94; K
ahum
bu e
t al.
1999
; Om
ondi
et a
l. 20
08* D
ata
in th
at y
ear w
ere
acqu
ired
usin
g th
e sa
mpl
e co
unts
met
hod;
in y
ears
with
out *
, dat
a w
ere
acqu
ired
usin
g th
e to
tal c
ount
met
hod.
Fro
m 1
999
to 2
011,
dat
a w
ere
colle
cted
in la
te
Janu
ary
or e
arly
Febr
uary
(dry
sea
son)
; fro
m19
62 to
199
4 da
ta w
ere
colle
cted
in J
une,
imm
edia
tely
afte
r the
Apr
il–M
ay w
et s
easo
n.N
= n
orth
, S =
sou
th, N
P =
natio
nal p
ark,
NR
= na
tiona
l res
erve
.–
Perio
ds w
hen
no a
eria
l cen
sus
took
pla
ce in
the
loca
tion.

44 Pachyderm No. 53 January–June 2013
Ngene et al.
herds) or in groups (n = 1,195 herds). The herd sizes ranged from 2 to 189 animals with ±95% confidence interval of herd sizes being 10–11 elephants. The observed and expected size of elephant herds was significantly different (Χ 2 = 1,725, df = 9, P < 0.05). Larger herds of elephants were found in the Taita ranches, southern parts of Tsavo West NP (Njukini and Jipe areas) and north Mkomazi NP (Figure 7). The smallest herds of elephants were counted north to northeast and south of the Galana River in Tsavo East NP (Figure 7). High densities of elephants occurred close to wet water pans and rivers; low densities were recorded near dry water pans (wet water pans: r = 0.90, n = 1,408, P < 0.05; dry water pans: r = 0.19, n = 1,408, P < 0.05). There was a weak negative relationship between elephant density and distance to water pans (r = 0.37; n =
1408; P < 0.05).
Number, density and distribution of elephant carcassesA total of 567 elephant carcasses were recorded during this census. Table 2 provides a summary of the number of carcasses counted during the aerial census, including the carcass ratio. In 2008 there were only 8 recent carcasses; in 2011, 48 recent carcasses were seen, which represents an increase of about 600%. The carcass ratio also increased from 0.6% in 2008 to 4.3% in 2011. High carcass density (about 0.031–0.037 km2) was recorded in Tsavo East NP south of the Galana River (Figure 8), and modest (about 0.02 km2) and lowest (0.001–0.008 km2) carcass densities were recorded in Tsavo East NP north of the Galana River and Tsavo West NP; and, the rest of the remaining areas (Figure 8). Figure 9 provides a summary of the general distribution of the elephant carcasses according to age class in the Tsavo–Mkomazi ecosystem.
6
8
9A10A
10B9B
MN
MC
91–18946–9020–458–191–7
Tanzania
IndianOceanMS
major river
protected area
Taita ranches
national boundary
12A
12C
25
24
1513
14
17 16
11
7A
7B
45
1CW
219
183
20
27
21
23
22
26
SK
G1G2
G3 G4
G5 G6
RB
counting block0 5 10 20 30 40 km
N
Elephantdistribution
Figure 4. Distribution of elephant herds in the Tsavo–Mkomazi ecosystem. No elephants were counted in South Kitui National Reserve (SK).
= –0.141x4 + 1,135.x3 – 3E + 06x2 + 5E + 09x – 2E + 12R2 = 0.999
yNum
ber
of e
lep
hant
s (’0
00s)
0
2
4
6
8
10
12
14
1985 1990 1995 2000 2005 2010 2015
Year
Figure 3. Total aerial count estimates of the Tsavo–Mkomazi ecosystem elephant population, 1988–2011.
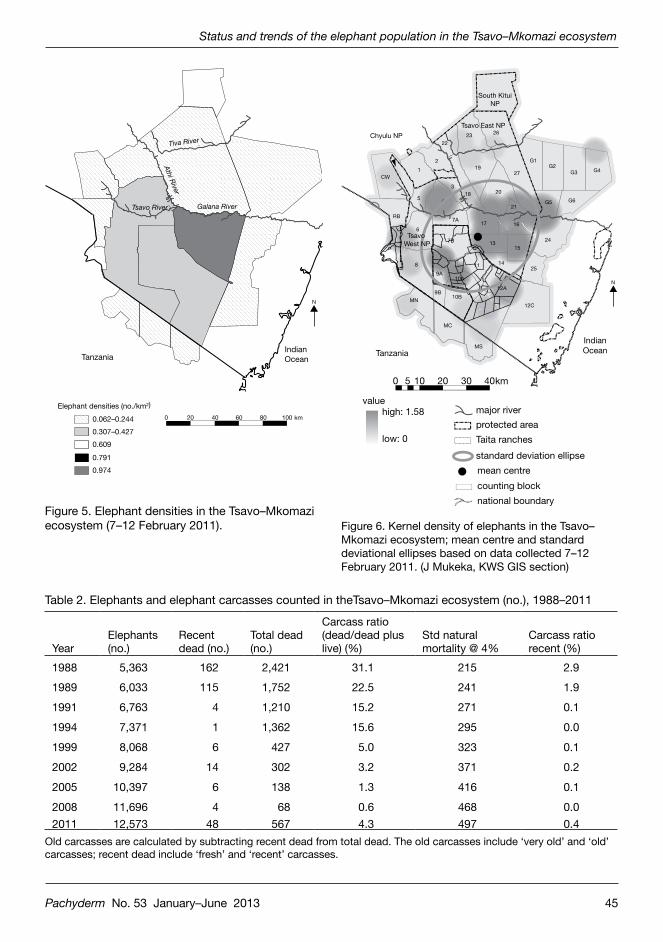
Pachyderm No. 53 January–June 2013 45
Status and trends of the elephant population in the Tsavo–Mkomazi ecosystem
Figure 5. Elephant densities in the Tsavo–Mkomazi ecosystem (7–12 February 2011).
0.974
0.791
0.609
0.307–0.427
0.062–0.244
TanzaniaIndianOcean
Tsavo River Galana River
Tiva River
Athi R
iver
200 40 60 80 100 km
N
Elephant densities (no./km2)
6
8
9A10A
10B9B
MN
Chyulu NP
Tsavo East NP
South KituiNP
MC
low: 0
high: 1.58value
Tanzania
IndianOcean
MS
major river
mean centre
protected area
Taita ranches
national boundary
standard deviation ellipse
12A
12C
25
24
1513
14
17 16
11
7A
7B
45
1CW
219
183
20
27
21
23
22
26
G1G2
G3 G4
G5 G6
RB
counting block
0 5 10 20 30 40km
N
Tsavo West NP
Figure 6. Kernel density of elephants in the Tsavo–Mkomazi ecosystem; mean centre and standard deviational ellipses based on data collected 7–12 February 2011. (J Mukeka, KWS GIS section)
Table 2. Elephants and elephant carcasses counted in theTsavo–Mkomazi ecosystem (no.), 1988–2011
YearElephants (no.)
Recent dead (no.)
Total dead (no.)
Carcass ratio (dead/dead plus live) (%)
Std natural mortality @ 4%
Carcass ratio recent (%)
1988 5,363 162 2,421 31.1 215 2.91989 6,033 115 1,752 22.5 241 1.91991 6,763 4 1,210 15.2 271 0.11994 7,371 1 1,362 15.6 295 0.01999 8,068 6 427 5.0 323 0.12002 9,284 14 302 3.2 371 0.22005 10,397 6 138 1.3 416 0.12008 11,696 4 68 0.6 468 0.02011 12,573 48 567 4.3 497 0.4
Old carcasses are calculated by subtracting recent dead from total dead. The old carcasses include ‘very old’ and ‘old’ carcasses; recent dead include ‘fresh’ and ‘recent’ carcasses.
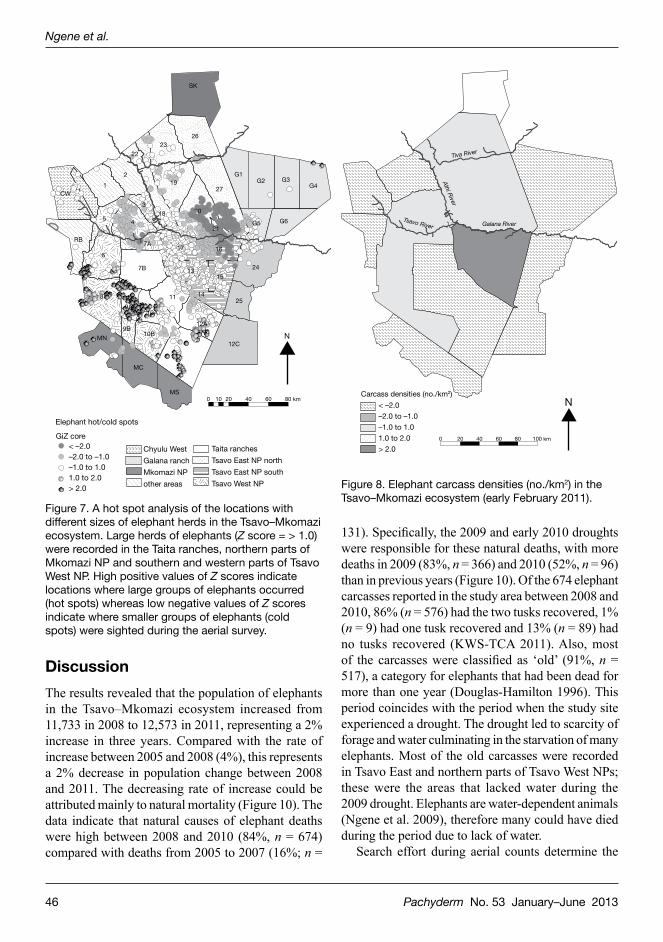
46 Pachyderm No. 53 January–June 2013
Ngene et al.
DiscussionThe results revealed that the population of elephants in the Tsavo–Mkomazi ecosystem increased from 11,733 in 2008 to 12,573 in 2011, representing a 2% increase in three years. Compared with the rate of increase between 2005 and 2008 (4%), this represents a 2% decrease in population change between 2008 and 2011. The decreasing rate of increase could be attributed mainly to natural mortality (Figure 10). The data indicate that natural causes of elephant deaths were high between 2008 and 2010 (84%, n = 674) compared with deaths from 2005 to 2007 (16%; n =
131). Specifically, the 2009 and early 2010 droughts were responsible for these natural deaths, with more deaths in 2009 (83%, n = 366) and 2010 (52%, n = 96) than in previous years (Figure 10). Of the 674 elephant carcasses reported in the study area between 2008 and 2010, 86% (n = 576) had the two tusks recovered, 1% (n = 9) had one tusk recovered and 13% (n = 89) had no tusks recovered (KWS-TCA 2011). Also, most of the carcasses were classified as ‘old’ (91%, n = 517), a category for elephants that had been dead for more than one year (Douglas-Hamilton 1996). This period coincides with the period when the study site experienced a drought. The drought led to scarcity of forage and water culminating in the starvation of many elephants. Most of the old carcasses were recorded in Tsavo East and northern parts of Tsavo West NPs; these were the areas that lacked water during the 2009 drought. Elephants are water-dependent animals (Ngene et al. 2009), therefore many could have died during the period due to lack of water.
Search effort during aerial counts determine the
0 20 40 60 80 100 km
N
> 2.01.0 to 2.0–1.0 to 1.0–2.0 to –1.0< –2.0
Athi R
iver
Tiva River
Galana RiverTsavo River
Carcass densities (no./km2)
Figure 8. Elephant carcass densities (no./km2) in the Tsavo–Mkomazi ecosystem (early February 2011).
0 10 20 40 60 80 km
N
6
8
9A10A
10B9B
MN
MC
> 2.01.0 to 2.0–1.0 to 1.0–2.0 to –1.0< –2.0
GiZ core
MS
Taita ranches
Tsavo East NP north
Tsavo East NP south
Tsavo West NP
Chyulu West
Elephant hot/cold spots
Galana ranch
Mkomazi NP
other areas
12A
12C
25
24
1513
14
17 16
11
7A
7B
45
1CW
219
183
20
27
21
23
22
26
SK
G1G2 G3
G4
G5 G6
RB
Figure 7. A hot spot analysis of the locations with different sizes of elephant herds in the Tsavo–Mkomazi ecosystem. Large herds of elephants (Z score = > 1.0) were recorded in the Taita ranches, northern parts of Mkomazi NP and southern and western parts of Tsavo West NP. High positive values of Z scores indicate locations where large groups of elephants occurred (hot spots) whereas low negative values of Z scores indicate where smaller groups of elephants (cold spots) were sighted during the aerial survey.

Pachyderm No. 53 January–June 2013 47
Status and trends of the elephant population in the Tsavo–Mkomazi ecosystem
0 5 10 20 30 40 50 km
N
6
8
9A10A
10B9B
MN
MC
very oldoldrecentfresh
MS
riverTaita ranches
Tsavo East NP north
Tsavo East NP south
Tsavo West
Chyulu West NP
Galana ranch
Mkomazi NP
other areas
12A
12C
25
24
1513
14
17 16
11
7A
7B
45
1CW
219
183
20
27
21
23
22
26
SK
G1G2 G3
G4
G5 G6
RB
Carcass stage
Figure 9. Spatial distribution of elephant carcasses according to different age classes in early February 2011. Most of the carcasses were ‘old’ and ‘very old’.
number of large mammals counted during the exercise (Douglas-Hamilton et al. 1994). This report uses the term ‘search effort’ to refer to the area (km2) covered by the aerial count crew in one hour (km2/hour) (Douglas-Hamilton et al. 1994). High and low search efforts result in higher and lower numbers of the large mammals being counted (Douglas-Hamilton et al. 1994). The 2011 aerial census recorded a search effort of 191 km2/hour, which was higher than for previous aerial census—321 km2/hour in 1988, 276 km2/hour in 1989, 247 km2/hour in1991, 210 km2/hour in 1994, 242 km2/hour in 2002, 224 km2/hour in 2005, and 213 km2/hour in 2008 (Douglas-Hamilton et al. 1994; Omondi et al. 2008). It is therefore possible that the high number of elephants counted in 2011 is not because of actual population increase but due to increased search effort (Figure 11).
High density of elephants was recorded in the southern part of Tsavo East NP. The area was also the mean centre where many groups of elephants were counted. This area has two permanent rivers (Galana and Voi) and many water pans, which are lacking in other parts of the ecosystem. High densities of elephants were recorded about 1–15 km from the rivers and water points. Since elephants are water-dependent animals (Estes 1991), their density is expected to be high in areas within 10–15 km from water points
Num
ber
of
dea
d e
lep
hant
s
2005
0
50
100
150
200
250
300
350
400
2006 2007 2008 2009 2010
Natural Illegal *PAC Unknown
Figure 10. Number of dead elephants against causes of elephant mortality in the Tsavo Conservation Area, 2008–2010. Other causes of death include train accidents, sickness and lion predation. *PAC = problem animal control.
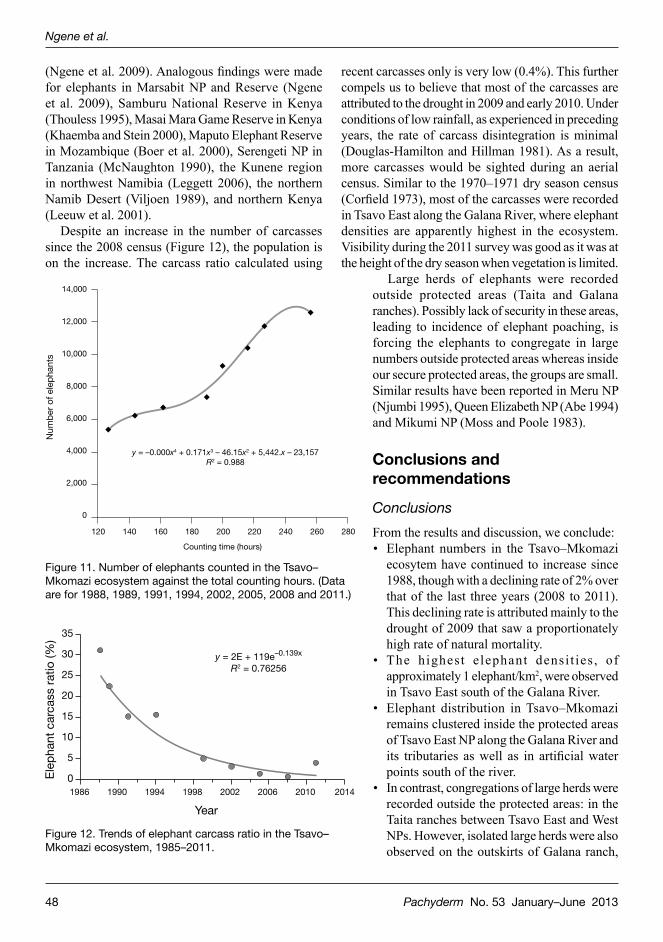
48 Pachyderm No. 53 January–June 2013
Ngene et al.
(Ngene et al. 2009). Analogous findings were made for elephants in Marsabit NP and Reserve (Ngene et al. 2009), Samburu National Reserve in Kenya (Thouless 1995), Masai Mara Game Reserve in Kenya (Khaemba and Stein 2000), Maputo Elephant Reserve in Mozambique (Boer et al. 2000), Serengeti NP in Tanzania (McNaughton 1990), the Kunene region in northwest Namibia (Leggett 2006), the northern Namib Desert (Viljoen 1989), and northern Kenya (Leeuw et al. 2001).
Despite an increase in the number of carcasses since the 2008 census (Figure 12), the population is on the increase. The carcass ratio calculated using
recent carcasses only is very low (0.4%). This further compels us to believe that most of the carcasses are attributed to the drought in 2009 and early 2010. Under conditions of low rainfall, as experienced in preceding years, the rate of carcass disintegration is minimal (Douglas-Hamilton and Hillman 1981). As a result, more carcasses would be sighted during an aerial census. Similar to the 1970–1971 dry season census (Corfield 1973), most of the carcasses were recorded in Tsavo East along the Galana River, where elephant densities are apparently highest in the ecosystem. Visibility during the 2011 survey was good as it was at the height of the dry season when vegetation is limited.
Large herds of elephants were recorded outside protected areas (Taita and Galana ranches). Possibly lack of security in these areas, leading to incidence of elephant poaching, is forcing the elephants to congregate in large numbers outside protected areas whereas inside our secure protected areas, the groups are small. Similar results have been reported in Meru NP (Njumbi 1995), Queen Elizabeth NP (Abe 1994) and Mikumi NP (Moss and Poole 1983).
Conclusions and recommendations
ConclusionsFrom the results and discussion, we conclude:• Elephant numbers in the Tsavo–Mkomazi
ecosytem have continued to increase since 1988, though with a declining rate of 2% over that of the last three years (2008 to 2011). This declining rate is attributed mainly to the drought of 2009 that saw a proportionately high rate of natural mortality.
• The highest e lephant densi t ies , of approximately 1 elephant/km2, were observed in Tsavo East south of the Galana River.
• Elephant distribution in Tsavo–Mkomazi remains clustered inside the protected areas of Tsavo East NP along the Galana River and its tributaries as well as in artificial water points south of the river.
• In contrast, congregations of large herds were recorded outside the protected areas: in the Taita ranches between Tsavo East and West NPs. However, isolated large herds were also observed on the outskirts of Galana ranch,
0
2,000
4,000
6,000
8,000
10,000
12,000
14,000
Num
ber
of e
lep
hant
s
y = –0.000x4 + 0.171x3 – 46.15x2 + 5,442.x – 23,157 R2 = 0.988
120 140 160 180 200 220 240 260 280
Counting time (hours)
Figure 11. Number of elephants counted in the Tsavo–Mkomazi ecosystem against the total counting hours. (Data are for 1988, 1989, 1991, 1994, 2002, 2005, 2008 and 2011.)
Year
y = 2E + 119e–0.139x
R2 = 0.76256
0
5
10
15
20
25
30
35
Ele
pha
nt c
arca
ss r
atio
(%)
1986 1990 1994 1998 2002 2006 2010 2014
Figure 12. Trends of elephant carcass ratio in the Tsavo–Mkomazi ecosystem, 1985–2011.
Pachyderm No. 53 January–June 2013 49
Status and trends of the elephant population in the Tsavo–Mkomazi ecosystem
the southwestern periphery of Tsavo West NP, and northwestern Mkomazi.
Recommendations
We recommend:• While it is evident that drought, as a natural
regulator, can check the population increase of the Tsavo–Mkomazi elephant population, there is need to ensure that human-induced mortality is minimal through effective anti-poaching and human–elephant conflict resolution. This will allow the population to regulate naturally based on habitat condition and climatic characteristics.
• The high density and clustering of elephants along the Galana and Ndii–Ndara plains, relative to the rest of the ecosystem, can be explained by the availability of water. If left unattended, and with increasing elephant numbers, this situation could lead to habitat degradation in these high-density areas. It is recommended, after extensive environmental impact assessment, to desilt old water pans and open new water points north of Tiva River, in the eastern parts of Tsavo East, and in the central to southern parts of Tsavo West NP. In this regard, the South Kitui National Reserve at the extreme northern section of the ecosystem serves as an obvious focus for future water provision.
• The clustering and high density along the Galana River also has implications: patrols andmobile unites should be deployed for anti-poaching efforts.
• Congregation of large herds as observed in the Taita ranches, in northern Galana and in southwestern Tsavo West NP may indicate poaching pressure; thus security should be directed to these areas. In addition, ongoing efforts to establish conservancies in these unprotected areas should be prioritized as a means of ensuring these critical elephant corridors and dispersal areas.
ReferencesAbe E. 1994. The behavioural ecology of elephants in
Queen Elizabeth National Park, Uganda. PhD thesis. University of Cambridge, Cambridge, UK.
Blanc JJ, Thouless CR, Hart JA, Dublin HT, Douglas-Hamilton I, Craig GC, Barnes RFW. 2007. African elephant status report 2007: an update from the African Elephant Database. Occasional paper of the
IUCN Species Survival Commission no. 33. IUCN, Gland, Switzerland, and Cambridge, UK.
Boer WF, Ntumi C, Correia AU, Mafuca MJ. 2000. Diet and distribution of elephants in the Maputo elephant reserve, Mozambique. African Journal of Ecology 38:188–201.
Caughley GJ. 1977. Analysis of vertebrate populations. John Wiley and Sons, London, UK.
Cobb S. 1976. The distribution and abundance of the large herbivore community of Tsavo National Park. PhD thesis. University of Oxford, Oxford.
Corfield TF. 1973. Elephant mortality in Tsavo National Park, Kenya. East African Wildlife Journal 11:339–368.
Douglas-Hamilton I. 1996. Counting elephants from the air: total counts. In: Kangwana KF, editor, Studying elephants, p. 28–37. African Wildlife Foundation, Nairobi, Kenya.
Douglas-Hamilton I, Gachago S, Litoroh M, Mirangi J. 1994. Tsavo elephant count 1994. Kenya Wildlife Service, Nairobi, Kenya.
Douglas-Hamilton I, Hillman AKK. 1981. Elephant carcasses and skeletons as indicators of population trends. In: Grimsdell JJR, Westley SB, editors, Low-level Aerial Survey Techniques Workshop, Addis Ababa, International Livestock Centre African Monographs, Ethiopia.
Esri. 1997. Enterprise Spatial Data Management with SDE. Esri ARC News (Summer) 1997:8. Redlands, California.
Esri. 2007. ArcGIS Desktop: tools for authoring, editing, and analyzing geographic information. Esri Press, Redlands, California.
Estes RD. 1991. The behavioural guide to African mammals including hoofed mammals, carnivores, primates. University of California Press, California.
Fowler J, Cohen L, Larvis P. 1998. Practical statistics for field biology. John Wiley and Sons, West Sussex, UK.
Inamdar A. 1996. The ecological consequences of elephant depletion. PhD thesis. University of Cambridge, Cambridge, UK.
[IUCN] International Union for Conservation of Nature. 1978. Results of an aerial census of the Tsavo National Park and ecosystem. IUCN, Nairobi, Kenya.
Kahumbu P, Omondi P, Douglas-Hamilton I, King J. 1999. Total aerial count of elephants in Tsavo National Park and adjacent areas. Kenya Wildlife Service, Nairobi, Kenya.
Khaemba WM, Stein A. 2000. Use of GIS for a spatial and temporal analysis of Kenyan wildlife with

50 Pachyderm No. 53 January–June 2013
Ngene et al.
generalized linear modeling. International Journal of Geographic Information Science 14(8):833–853.
[KWS–TCA] Kenya Wildlife Service–Tsavo Conser-vation Area. 2011. Elephant mortality data for Tsavo Conservation Area. KWS-TCA, Voi, Kenya.
Laws RM. 1969. The Tsavo research project. Journal of Reproductive Fertility Supplement 6:495–531.
Laws RM. 1970. Elephants as agents of habitat and landscape change in East Africa. Oikos 21:1–15.
Leeuw J, Waweru MN, Okello OO, Maloba M, Nguru P, Said MY, Aligula HM, Heitkönig IMA, Reid RS. 2001. Distribution and diversity of wildlife in northern Kenya in relation to livestock and permanent water points. Biological Conservation 100:297–308.
Leggett KEA. 2006. Home range and seasonal move-ment of elephant in the Kunene region, northwestern Namibia. African Zoology 41(1):17–36.
Leuthold W. 1973. Recent elephant counts in Tsavo National Park. Tsavo Research Project. Wildlife Conservation and Management Department, Voi, Kenya.
Leuthold W. 1976. Age structure of elephants in Tsavo National Park, Kenya. Journal of Applied Ecology 13:435–444.
Leuthold BM. 1978. Ecology of the giraffe in Tsavo East National Park, Kenya. East African Wildlife Journal 16(1):1–20.
McNaughton SJ. 1990. Mineral nutrition and seasonal movements of African migratory ungulates. Nature 345:613–615.
Milner-Gulland EJ, Beddington JR. 1993a. The exploitation of elephants for ivory trade: an historical perspective. Proceedings Royal Society of London 252:29–37.
Milner-Gulland EJ, Beddington JR. 1993b. The relative effects of hunting and habitat destruction on elephant population dynamics over time. Pachyderm 17:75–90.
Mitchell C. 2009. Status and distribution of Icelandic-breeding geese: results of the 2008 international census. Wildfowl and Wetlands Trust Report, Slimbridge, UK.
Moss CJ, Poole JH. 1983. Relationships and social structure in African elephants. In: Hinde RA, editor, Primate social relationships: an integrated approach. Blackwell Scientific Publications, Oxford, UK. pp. 315–325.
Mukeka J. 2010. Analyzing the distribution of the African elephant (Loxodonta africana) in Tsavo, Kenya. MSc thesis. Miami University, Oxford, Ohio.
Napier-Bax P, Sheldrick DLW. 1963. Some preliminary observations on the food of elephants in Tsavo East National Park of Kenya. East African Wildlife Journal 1:40–53.
Ngene SM, Skidmore AK, Van Gils H, Douglas-Hamilton I, Omondi POM. 2009. Elephant distribution around a volcanic shield dominated by a mosaic of forest savannah (Marsabit, Kenya). African Journal of Ecology 47:234–245.
Njumbi SJ. 1995. Effects of poaching in the population structure of African elephants (Loxodonta africana): a case study of the elephants of the Meru National Park. In: Daniel JC, Datye HS, editors, A week with elephants. Proceedings of the International Seminar on the Conservation of Asian Elephants, Mudumulai Wildlife Sanctuary. Oxford University Press, Oxford, UK. pp. 509–522.
Olindo P, Douglas-Hamilton I, Hamilton P. 1988. Tsavo elephant count 1988. Wildlife Conservation and Management Department, Nairobi, Kenya.
Omondi P, Bitok E, Kahindi O, Mayienda R. 2002. Total aerial count of elephants in Laikipia–Samburu ecosytsem. Kenya Wildlife Service, Nairobi, Kenya.
Omondi P, Bitok E. 2005. Total aerial count of elephants, buffalo and other species in the Tsavo–Mkomazi ecosystem. KWS/MIKE Programme, Nairobi, Kenya.
Omondi P, Bitok EK, Mukeka J, Mayienda RM, Litoroh M. 2008. Total aerial count of elephants and other large mammal species of Tsavo–Mkomazi ecosystem. Kenya Wildlife Service, Nairobi, Kenya.
Thouless CR. 1995. Long-distance movements of elephants in northern Kenya. African Journal of Ecology 33:321–334.
Tyrrell HG, Coe MJ. 1974. The rainfall regime of Tsavo National Park, Kenya, and its potential phenological significance. Journal of Biogeography 1:187–192.
Viljoen PJ. 1989. Spatial distribution and movements of elephants in the northern Namib Desert region of Kaokoveld, Namibia. South African Journal of Zoology 219:1–19.
[WCMD] Wildlife Conservation and Management Department (Kenya). 1976. Report of aerial counts of Tsavo. WCMD, Nairobi, Kenya.
Zar JH. 1996. Biostatistical analysis. Prentice Hall, New Jersey, USA.
Pachyderm No. 53 January–June 2013 51
Increasing rhino awareness in Yemen and a decline in rhino horn trade
Increasing rhino awareness in Yemen and a decline in the rhino horn trade
Lucy Vigne and Esmond MartinPO Box 15510–00503, Nairobi, Kenya; email: [email protected]
AbstractIn Yemen, the wholesale price for rhino horn for making dagger handles has remained at about USD 1,500/kg since 2006, unlike in eastern Asia where prices are over 10 times higher than in Yemen. Left-over shavings sell in Sana’a for about USD 940/kg and are illegally exported to eastern Asian markets. In November 2012, jambiya makers in the Sana’a old souk numbered 83 in 58 open workshops. More craftsmen are now using an increasingly popular material—a solidified gum—to make jambiya handles. These handles first appeared on the Yemen market in 2008 and in about 2010 were improved with a grainy material added that closely resembles rhino horn. Most people call them ‘Chinese’ jambiyas, believing they are imported from China. These inexpensive handles are now crafted in Sana’a. They need to be further promoted in Yemen. They are helping to reduce pressure on eastern Africa’s rhinos. During our November 2012 visit to Yemen, we also worked on an education campaign on the plight of the rhino. Yemen is no longer a major threat to rhinos due to the country’s economic crisis, the introduction of the new inexpensive material for making dagger handles, and further campaigning against the use of rhino horn.
RésuméAu Yémen le prix de la vente en gros pour la corne de rhinocéros (pour faire des manches de poignards) demeure à environ 1500 USD le kg depuis 2006 par rapport à l’Asie de l’Est où les prix se sont élevés à dix fois plus par rapport à ceux du Yémen. A Sanaa les restes de copeaux se vendent à environ 940 USD et sont exportés de façon illégale aux marchés de l’Asie de l’Est. En novembre 2012, on estimait le nombre de fabricants de jambiya au souk de Sanaa à 83 dans 58 ateliers ouverts. Davantage d’artisans utilisent maintenant un matériau de plus en plus populaire pour faire des manches de jambiya : une gomme solidifiée. Ces manches arrivaient sur le marché du Yémen en 2008 et ont été améliorées aux années 2010 par l’ajout d’un matériau granuleux qui ressemble beaucoup à la corne de rhinocéros. La plupart des gens appellent ces jambiyas «chinois», croy-ant qu’ils sont importés de Chine. Cependant, ces manches peu chers sont maintenant fabriqués à Sanaa ce qui donne du travail à ceux qui les fabriquent. Il faudrait les promouvoir davantage au Yémen car ils contribuent à réduire la pression sur les rhinocéros d’Afrique orientale. Lors de notre visite au Yémen en novembre 2012 nous avons travaillé sur une campagne d’éducation au sujet de la situation critique du rhinocéros. Le Yémen n’est plus une menace majeure pour les rhinocéros en raison du marasme économique du pays, l’introduction de ce nouveau matériau, et la campagne contre la corne du rhinocéros.
IntroductionYemen’s soaring demand for rhino horn from eastern Africa in the 1970s and 1980s caused near obliteration of the northern white rhino and the black rhino by the early 1990s. This was despite the Yemen government’s ban on rhino horn imports in 1982 and re-exports in 1987. Yemenis have had strong trading links with eastern Africa, and many Yemeni families have lived
for generations in the region. It thus remains relatively easy for traders to smuggle rhino horns to Yemen’s capital, Sana’a, to be made into handles for the traditional curved dagger, the jambiya, an important possession still treasured by Yemeni men. Rhino horn remains the most sought-after material for a dagger handle.
One of the main factors that enabled Yemeni men in the 1970s to buy expensive jambiyas with

52 Pachyderm No. 53 January–June 2013
Vigne and Martin
rhino horn handles was the oil boom in Saudi Arabia that brought them much wealth. Thousands of kilos of rhino horn from eastern Africa were carved up into dagger handles in Yemen, with the left-over chips and shavings being sold to China to be made into traditional Chinese medicines at government factories—until the China government banned the trade in 1993. In 1992, the Yemen government had banned all domestic trade in new rhino horn, and in that same year the grand mufti in Sana’a issued a fatwa to say it was against the will of God to kill rhinos for their horns (Martin et al. 1997). In 1997 Yemen finally joined CITES.
As rhino horn supplies reaching Yemen declined, only one of the several rhino horn trading families in Sana’a continued as a major player. Most craftsmen by the 1990s had resorted to carving water buffalo horn for handles (imported from the domestic Indian water buffalo). To promote this material, the government had removed its import tax. Although popular, these did not look like rhino horn handles and were never in the same league, and traders continued to look for substitutes. A public awareness campaign in 2007 and 2008 through banners, posters and stickers that we designed and printed in Sana’a, along with much media attention in the country, helped to encourage substitutes (Vigne et al. 2007; Vigne and Martin 2008).
Since 2008, rhino poaching has been rising in Africa once again, mainly for the East Asian market where there is an economic boom. The number of rhinos illegally killed in Africa has been the highest for several decades and has been especially serious in Zimbabwe and South Africa. While most horn from southern Africa is known to go to Viet Nam and China, there was concern that smuggling of rhino horn could have increased once more from East Africa to Yemen due to lack of law and order.
Yemen has been politically unstable for years, but due to the rising insecurity (including kidnapping of foreigners) culminating in a revolution in February 2011, no conservationists or other wildlife professionals had studied Yemen’s rhino horn market since our last visits there in 2007 and 2008 (Vigne et al. 2007; Vigne and Martin 2008). It was therefore important to find out about any recent rhino horn trade, to increase rhino awareness, and to encourage substitute materials for dagger handles.
MethodologyDuring a 10-day visit to Sana’a in mid-November 2012, we met the US and British ambassadors in Sana’a, Gerald Feierstein and Nicholas Hopton respectively, for advice and assistance and we shared information with them about the rhino horn trade threat in order to spread awareness. We had meetings with several high-level officials, some of whom we have worked with for many years. These officials included Dr Abdul Karim Al-Eryani, former prime minister, former foreign minister and presently an adviser to the new president; Abdulqader Ali Helal, new mayor of the capital; Abdul Karim Fakhir, Sana’a Zoo manager; and Abdulrahman Al-Eryani, former minister of Water and Environment and newly appointed as the first environment consultant to the president. We visited the government’s Environment Protection Authority to talk to Mahmoud Shidiwah, chairman; Omer Baesher, CITES coordinator; and Al Fotooh Abdulla, director general, Biodiversity of Protected Areas.
Information was collected, largely with the help of informers, regarding the origin of new rhino horn still entering Yemen, trade routes, quantities of horn being imported and re-exported, and prices. We visited jambiya workshops, repairers and retailers in Sana’a, concentrating our survey work in the Sana’a Old Town souk. There, we counted the numbers of open workshops and jambiya craftsmen during a spot check one late afternoon when the craftsmen are most active. This method is consistent with our past counts (since the mid-1980s) to ascertain trends. We learned about the present-day making of dagger handles and substitutes, and we heard the views of craftsmen, traders and the general public regarding jambiyas, rhino horn and substitutes. We had a meeting with the head of the main jambiya-making family.
We also produced in Sana’a more stickers, posters, banners and billboards for Sana’a Zoo and elsewhere for a renewed rhino awareness drive. We sent a banner also to the Taiz zoo. We gave out CDs with PowerPoint presentations (in English and Arabic) and films about rhino poaching to influential people in Yemen. These included David Stanton, executive director, and Mohamed al-Duais, associate director of Yemen’s Foundation for Endangered Wildlife, FEW, who are also teachers at the International School and Sana’a University, respectively; and to Tim Mackintosh-Smith, writer and educator in Yemen. We also provided laminated information sheets for
Pachyderm No. 53 January–June 2013 53
Increasing rhino awareness in Yemen and a decline in rhino horn trade
student notice boards and spoke to journalists to spread awareness further.
Results
Political and economic situations in YemenDuring the past two decades, Yemen’s economy has been driven by oil, but supplies in Yemen have started to decline. Corruption at the highest level, severe unemployment and acute insecurity led the country towards a financial and political crisis that caused, in early 2011, riots in Sana’a and other cities. Following months of demonstrations, President Ali Abdulla Saleh, after 33 years of rule, in November 2011 agreed to step down and in February 2012, following elections, the former vice president, Abdo Rabbo Mansur Hadi, became president (CIA 2012). The revolution sent the economy into a downward spiral. The per capita income fell by over 10% in 2011 (CIA 2012). Half the population today lives below the poverty line and nearly a million small children are acutely malnourished. About 40% of the population lives on only USD 2 a day and many on USD 1 a day. The depressed economy was evident during our visit with some children in Sana’a lacking shoes and not a single tourist group seen, although tourism was formerly a major earner of foreign exchange.
Many Yemenis are divided in their support of the old regime or the new. During our visit, the recent political unrest was still evident. Soldiers were deployed in the capital’s streets and even within Sana’a Zoo, where families simply go for entertainment. Some buildings had been burned, and many vehicles and taxis had bullet marks. Further turmoil occurred in September 2012 when a YouTube film denigrated Islam, and again riots led to acute insecurity in Sana’a. The windows of the US Embassy still had their bullet-proof glass splintered from the many bullets. The American staff working at the embassy had to remain in the compound except when on special missions.
Yemenis are tired of their past problems and are ready to see changes in their way of life, wanting more security, equity and, most important of all, an improved economy. The country yearns for reforms (Sanabani 2012; Abdulrahman Al-Eryani, pers. comm. November 2012). The government is aware of the need to generate jobs and growth. Assistance from other Gulf countries enabled the president to improve electricity and lower fuel prices in late 2012,
giving him popularity and providing the country with much-needed stability as time progresses towards elections to be held in 2013.
Due to the country’s insecurity, our visit was not welcomed by the US and British ambassadors, whose travel advice is not to come to Yemen. They suggested that we kept a low profile because of kidnappings. The smuggling of rhino horn is not of great concern to diplomats nor to Yemen officials compared with the other problems they presently face. Not only is Yemen an impoverished nation with widespread hunger, it also has over 65,000 refugees who arrived from Ethiopia and Somalia in the first half of 2012, and who continue to come, adding to the economic strain.
Despite the acute challenges, Yemenis’ support regarding our work was almost unanimous. Yemenis are renowned for being respectful and courteous and apart from a threatening incident in the souk from some of the retail jambiya salesmen, who blamed us for closing down their trade, forcing us to leave the souk in a hurry, Yemenis wanted to help us in reducing rhino horn demand. Some also asked for advice regarding assistance and expertise in wildlife and environmental issues that they requested us to publicize. Many officials and professionals are also aware of the need to improve their image to the outside world on environmental issues.
Rhino horn trade routes and trade in Sana’aRhino horn is still in demand with the small percentage of people who can still afford it. The breakdown in law and order has helped illegal activities such as the rhino horn trade. In October 2012, according to informers, the wholesale price offered to dagger makers for chunks of rhino horn was USD 1,350–1,500/kg for raw whole horn (of about 3 kg on average) in Sana’a. The traders in Sana’a said they would pay USD 900 for rhino horn reaching Djibouti and from there, according to the main trading family, ‘friends can help move the horns to Sana’a’; similarly they ‘can arrange for horns to be brought to Yemen via contacts in Addis Ababa or Asmara’. The best way to transport horns, our informers were told, is on Yemenia Airlines from Djibouti or Khartoum, or a longer but safer way for a large quantity is via Dubai. Crossing the Red Sea is no longer safe for smuggling due to the many foreign navy vessels whose officers search boats for weapons and other contraband. Traders in Sana’a ask to be told
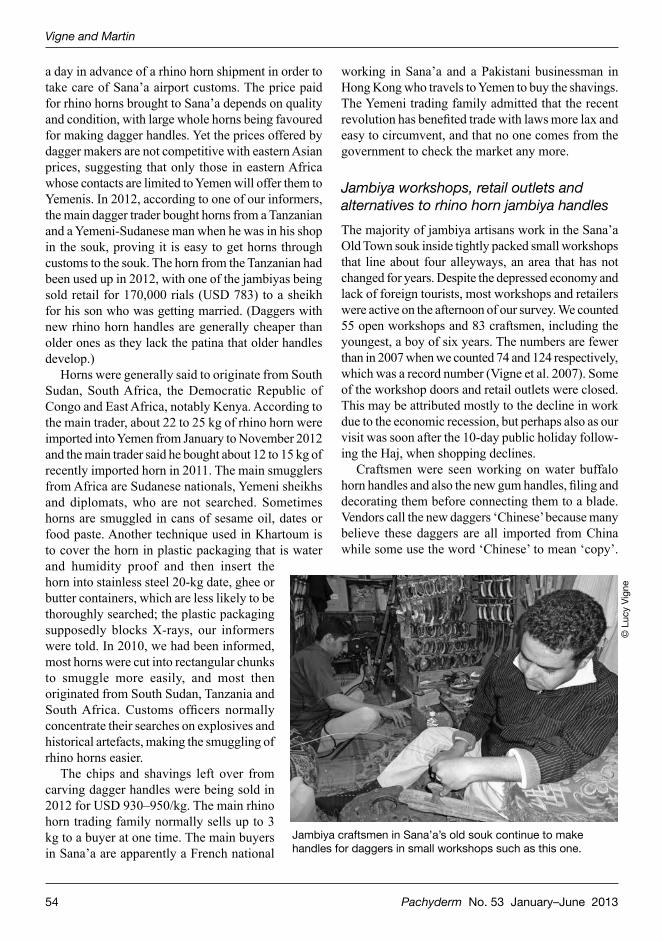
54 Pachyderm No. 53 January–June 2013
Vigne and Martin
a day in advance of a rhino horn shipment in order to take care of Sana’a airport customs. The price paid for rhino horns brought to Sana’a depends on quality and condition, with large whole horns being favoured for making dagger handles. Yet the prices offered by dagger makers are not competitive with eastern Asian prices, suggesting that only those in eastern Africa whose contacts are limited to Yemen will offer them to Yemenis. In 2012, according to one of our informers, the main dagger trader bought horns from a Tanzanian and a Yemeni-Sudanese man when he was in his shop in the souk, proving it is easy to get horns through customs to the souk. The horn from the Tanzanian had been used up in 2012, with one of the jambiyas being sold retail for 170,000 rials (USD 783) to a sheikh for his son who was getting married. (Daggers with new rhino horn handles are generally cheaper than older ones as they lack the patina that older handles develop.)
Horns were generally said to originate from South Sudan, South Africa, the Democratic Republic of Congo and East Africa, notably Kenya. According to the main trader, about 22 to 25 kg of rhino horn were imported into Yemen from January to November 2012 and the main trader said he bought about 12 to 15 kg of recently imported horn in 2011. The main smugglers from Africa are Sudanese nationals, Yemeni sheikhs and diplomats, who are not searched. Sometimes horns are smuggled in cans of sesame oil, dates or food paste. Another technique used in Khartoum is to cover the horn in plastic packaging that is water and humidity proof and then insert the horn into stainless steel 20-kg date, ghee or butter containers, which are less likely to be thoroughly searched; the plastic packaging supposedly blocks X-rays, our informers were told. In 2010, we had been informed, most horns were cut into rectangular chunks to smuggle more easily, and most then originated from South Sudan, Tanzania and South Africa. Customs officers normally concentrate their searches on explosives and historical artefacts, making the smuggling of rhino horns easier.
The chips and shavings left over from carving dagger handles were being sold in 2012 for USD 930–950/kg. The main rhino horn trading family normally sells up to 3 kg to a buyer at one time. The main buyers in Sana’a are apparently a French national
working in Sana’a and a Pakistani businessman in Hong Kong who travels to Yemen to buy the shavings. The Yemeni trading family admitted that the recent revolution has benefited trade with laws more lax and easy to circumvent, and that no one comes from the government to check the market any more.
Jambiya workshops, retail outlets and alternatives to rhino horn jambiya handlesThe majority of jambiya artisans work in the Sana’a Old Town souk inside tightly packed small workshops that line about four alleyways, an area that has not changed for years. Despite the depressed economy and lack of foreign tourists, most workshops and retailers were active on the afternoon of our survey. We counted 55 open workshops and 83 craftsmen, including the youngest, a boy of six years. The numbers are fewer than in 2007 when we counted 74 and 124 respectively, which was a record number (Vigne et al. 2007). Some of the workshop doors and retail outlets were closed. This may be attributed mostly to the decline in work due to the economic recession, but perhaps also as our visit was soon after the 10-day public holiday follow-ing the Haj, when shopping declines.
Craftsmen were seen working on water buffalo horn handles and also the new gum handles, filing and decorating them before connecting them to a blade. Vendors call the new daggers ‘Chinese’ because many believe these daggers are all imported from China while some use the word ‘Chinese’ to mean ‘copy’.
Jambiya craftsmen in Sana’a’s old souk continue to make handles for daggers in small workshops such as this one.
© L
ucy
Vign
e
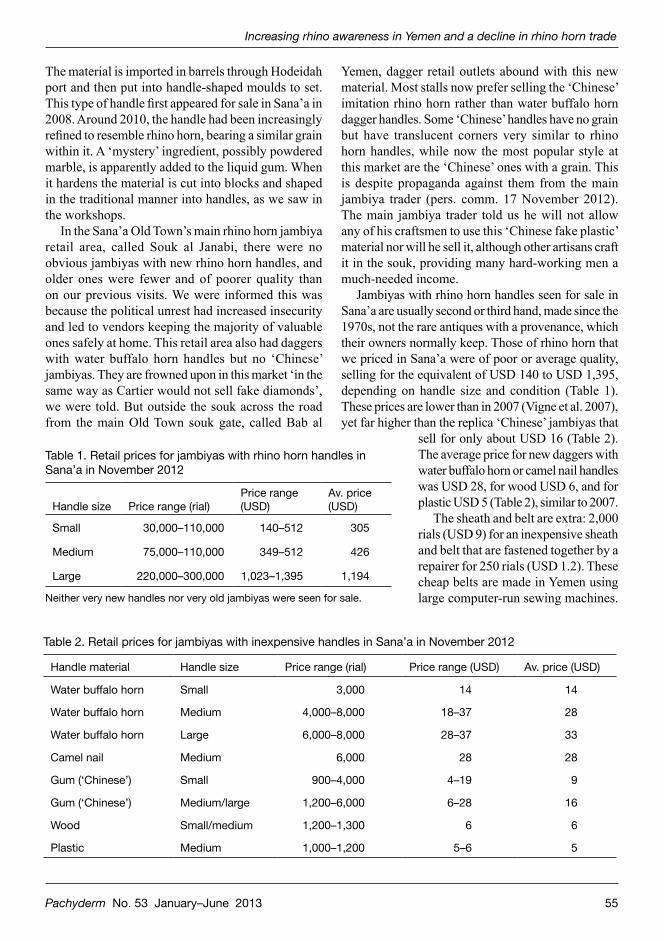
Pachyderm No. 53 January–June 2013 55
Increasing rhino awareness in Yemen and a decline in rhino horn trade
The material is imported in barrels through Hodeidah port and then put into handle-shaped moulds to set. This type of handle first appeared for sale in Sana’a in 2008. Around 2010, the handle had been increasingly refined to resemble rhino horn, bearing a similar grain within it. A ‘mystery’ ingredient, possibly powdered marble, is apparently added to the liquid gum. When it hardens the material is cut into blocks and shaped in the traditional manner into handles, as we saw in the workshops.
In the Sana’a Old Town’s main rhino horn jambiya retail area, called Souk al Janabi, there were no obvious jambiyas with new rhino horn handles, and older ones were fewer and of poorer quality than on our previous visits. We were informed this was because the political unrest had increased insecurity and led to vendors keeping the majority of valuable ones safely at home. This retail area also had daggers with water buffalo horn handles but no ‘Chinese’ jambiyas. They are frowned upon in this market ‘in the same way as Cartier would not sell fake diamonds’, we were told. But outside the souk across the road from the main Old Town souk gate, called Bab al
Yemen, dagger retail outlets abound with this new material. Most stalls now prefer selling the ‘Chinese’ imitation rhino horn rather than water buffalo horn dagger handles. Some ‘Chinese’ handles have no grain but have translucent corners very similar to rhino horn handles, while now the most popular style at this market are the ‘Chinese’ ones with a grain. This is despite propaganda against them from the main jambiya trader (pers. comm. 17 November 2012). The main jambiya trader told us he will not allow any of his craftsmen to use this ‘Chinese fake plastic’ material nor will he sell it, although other artisans craft it in the souk, providing many hard-working men a much-needed income.
Jambiyas with rhino horn handles seen for sale in Sana’a are usually second or third hand, made since the 1970s, not the rare antiques with a provenance, which their owners normally keep. Those of rhino horn that we priced in Sana’a were of poor or average quality, selling for the equivalent of USD 140 to USD 1,395, depending on handle size and condition (Table 1). These prices are lower than in 2007 (Vigne et al. 2007), yet far higher than the replica ‘Chinese’ jambiyas that
sell for only about USD 16 (Table 2). The average price for new daggers with water buffalo horn or camel nail handles was USD 28, for wood USD 6, and for plastic USD 5 (Table 2), similar to 2007.
The sheath and belt are extra: 2,000 rials (USD 9) for an inexpensive sheath and belt that are fastened together by a repairer for 250 rials (USD 1.2). These cheap belts are made in Yemen using large computer-run sewing machines.
Table 1. Retail prices for jambiyas with rhino horn handles in Sana’a in November 2012
Handle size Price range (rial)Price range (USD)
Av. price (USD)
Small 30,000–110,000 140–512 305
Medium 75,000–110,000 349–512 426
Large 220,000–300,000 1,023–1,395 1,194
Neither very new handles nor very old jambiyas were seen for sale.
Table 2. Retail prices for jambiyas with inexpensive handles in Sana’a in November 2012
Handle material Handle size Price range (rial) Price range (USD) Av. price (USD)
Water buffalo horn Small 3,000 14 14
Water buffalo horn Medium 4,000–8,000 18–37 28
Water buffalo horn Large 6,000–8,000 28–37 33
Camel nail Medium 6,000 28 28
Gum (‘Chinese’) Small 900–4,000 4–19 9
Gum (‘Chinese’) Medium/large 1,200–6,000 6–28 16
Wood Small/medium 1,200–1,300 6 6
Plastic Medium 1,000–1,200 5–6 5

56 Pachyderm No. 53 January–June 2013
Vigne and Martin
The best-quality belts, however, are made by hand with expensive gold thread, either by women at home or by inmates of the Central Sana’a Prison. These belts cost around 60,000 rials (USD 279). There are about six different stages in their making: one person draws the design, another sews the pattern with red or black cotton, a third fills the gaps with gold thread, a fourth man makes the leather backing, a fifth sews the two pieces together, and the final person adds the buckle. Some of these expensive belts are sold nowadays in new smart jambiya shops in the wealthy suburbs such as Hadda. Many newly rich Yemenis have built large houses in these areas and prefer to shop nearby rather than in the souk for replacement belts and also for sayfani jambiyas (the older best-quality ones with rhino horn handles).
Public awareness campaign on rhinos and jambiyasIt was important to resurrect the campaign we had initiated in 2007 and 2008 to spread awareness about
rhino poaching to reduce demand for new horn (Vigne et al. 2007; Vigne and Martin 2008). The staff at Sana’a Zoo welcomed our return and assisted us in choosing sites for new banners and billboards on metal stands and over the main gateway of the zoo. These showed an array of popular wild animals from Arabia and Africa, as well as a jambiya and the religious edict against killing rhinos. The zoo attracts about 600,000 Yemenis a year. After the 2012 haj, during their 10-day public holiday, about 70,000 visitors came, showing the zoo’s popularity and suitability for rhino awareness. It is a good location for educational materials, including posters and stickers, as people take time to observe them, much needed in a country where few people know about rhinos or even what they look like.
The new mayor of Sana’a, Abdulqader Ali Helal, enthusiastically supported our awareness drive at the zoo and elsewhere in the city. He gave us contacts for television to show rhino awareness films. He also asked for more wildlife information and assistance
at the zoo, as did the zoo staff, welcoming any expert advice to improve conditions for the animals.
We distributed stickers and posters in Sana’a with the help of Yemenis, displaying them in shop and taxi windows. These asked people to stop buying new rhino horn daggers. We stuck a poster at a cybercafe often visited by a member of the main jambiya-trading family, who was later seen taking photos of the poster. We talked to Yemenis about daggers and rhino horn as we circulated the stickers and posters. It was encouraging that most were interested and sympathetic. Many said we needed to talk to the main jambiya-making family, whom everybody knows, to tell this family to stop using and promoting rhino horn.
We had a meeting with Faris Sanabani, publisher of two prominent publications, the Yemen Observer and Yemen Today, who also produces a television programme shown in the afternoons, which is prime family viewing time. He suggested he would create an Arabic version of a rhino cartoon we brought him to use on his television programme to popularize rhino conservation. He and another leading journalist, Ahlem Mohsen, would also work At Sana’a Zoo we put up banners about the plight of rhinos,
such as this one, over the main gateway.
© L
ucy
Vign
e

Pachyderm No. 53 January–June 2013 57
Increasing rhino awareness in Yemen and a decline in rhino horn trade
to promote the new and popular ‘Chinese’ jambiyas being made in Sana’a in the Yemen Observer.
Public opinion about jambiyasAn informed Yemeni explained, ‘A jambiya is like the car you drive. That with a rhino horn handle is like a Ferrari—people notice it!’ Yet people also get pleasure following new trends and fashion as in wearing the new ‘Chinese’ jambiya. The president, unlike his predecessor, does not wear a jambiya; as he is the country’s main role model, this is advantageous to rhino conservation. The president epitomizes the trend that many now share of wanting modernization. With the growth of the internet, globalization and an increased wish to travel, many young men, especially in cities, are leaving behind their old tribal ways, such as wearing jambiyas. Yemenis are gradually becoming aware that the former flourishing rhino horn trade is a thing of the past. Some of the most educated Yemenis prefer jambiyas with agate handles, not only as gifts for foreign dignitaries but also to wear themselves on special occasions (Abdul Karim Al-Eryani, pers. comm., 14 November 2012). Mined in Yemen, agate is rare and expensive. Such a dagger costs around USD 1,000, thus is an appropriately expensive rhino horn substitute.
During Yemen’s civil unrest in 2011, many Yemenis were forced to sell their expensive jambiyas
that were often inherited from their fathers. This was a last resort, sometimes to help people leave Yemen or simply to feed their families. Some intend to buy another old rhino horn dagger when they have enough money as old jambiyas cycle in the market. Yet gradually others are choosing the much less expensive ‘Chinese’ jambiyas. These are of course legal and do not threaten rhinos. A main reason for their demand is that the wearer can walk safely on the streets without fearing theft of a valuable jambiya with a rhino horn handle. Some better-off Yemenis who would not be seen wearing a jambiya with a water buffalo horn handle are happy to wear this new type of dagger as it is so similar in appearance to rhino horn. Even if they still possess a rhino horn one, they often prefer to keep it nowadays safely at home and wear their Chinese alternative.
ConclusionYemen is no longer a major threat to rhinos. First, the severely slumped economy makes it harder for Yemenis to afford rhino horn. Second, there has been a sharp rise in the international price for rhino horn, mostly due to the growth in demand in Viet Nam and China. Third, young Yemenis are modernizing due to increasing popularity in the internet and the media, resulting in more men choosing to wear trousers as opposed to Yemeni dress. Fourth, the new improved, inexpensive material for dagger handles called ‘Chinese’ resembles rhino horn much more closely than previous alternatives.
Some who will not wear the cheap water buffalo horn daggers are now willing to wear these ‘Chinese’ ones. They are increasingly being crafted in the souk, giving employment and a new enthusiasm. These handles, however, are discouraged by the main jambiya-making family as they compete with traditional materials, including rhino horn. Even so, the new handles have become popular as the wearers do not need to fear having a valuable rhino horn dagger stolen. Many fathers are choosing to buy this new inexpensive variety for their sons.
It is important for Yemenis to promote these jambiyas and find a more alluring name for them
We printed in Yemen posters and stickers urging Yemenis not to buy jambiyas with rhino horn handles; these were stuck on walls and windows all over Sana’a during our rhino awareness campaign.
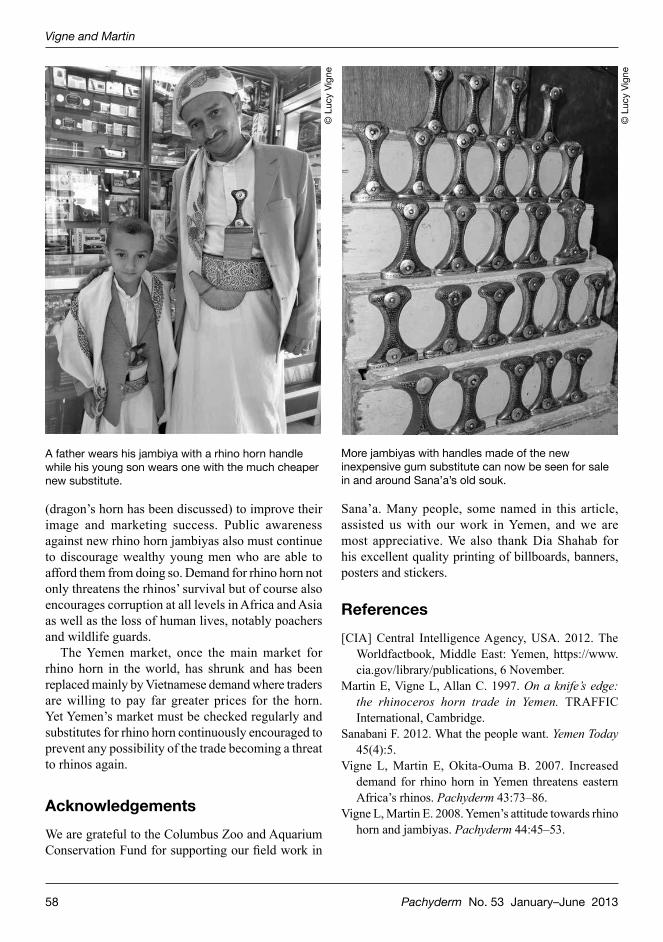
58 Pachyderm No. 53 January–June 2013
Vigne and Martin
(dragon’s horn has been discussed) to improve their image and marketing success. Public awareness against new rhino horn jambiyas also must continue to discourage wealthy young men who are able to afford them from doing so. Demand for rhino horn not only threatens the rhinos’ survival but of course also encourages corruption at all levels in Africa and Asia as well as the loss of human lives, notably poachers and wildlife guards.
The Yemen market, once the main market for rhino horn in the world, has shrunk and has been replaced mainly by Vietnamese demand where traders are willing to pay far greater prices for the horn. Yet Yemen’s market must be checked regularly and substitutes for rhino horn continuously encouraged to prevent any possibility of the trade becoming a threat to rhinos again.
AcknowledgementsWe are grateful to the Columbus Zoo and Aquarium Conservation Fund for supporting our field work in
Sana’a. Many people, some named in this article, assisted us with our work in Yemen, and we are most appreciative. We also thank Dia Shahab for his excellent quality printing of billboards, banners, posters and stickers.
References[CIA] Central Intelligence Agency, USA. 2012. The
Worldfactbook, Middle East: Yemen, https://www.cia.gov/library/publications, 6 November.
Martin E, Vigne L, Allan C. 1997. On a knife’s edge: the rhinoceros horn trade in Yemen. TRAFFIC International, Cambridge.
Sanabani F. 2012. What the people want. Yemen Today 45(4):5.
Vigne L, Martin E, Okita-Ouma B. 2007. Increased demand for rhino horn in Yemen threatens eastern Africa’s rhinos. Pachyderm 43:73–86.
Vigne L, Martin E. 2008. Yemen’s attitude towards rhino horn and jambiyas. Pachyderm 44:45–53.
© L
ucy
Vign
e
© L
ucy
Vign
e
A father wears his jambiya with a rhino horn handle while his young son wears one with the much cheaper new substitute.
More jambiyas with handles made of the new inexpensive gum substitute can now be seen for sale in and around Sana’a’s old souk.
Pachyderm No. 53 January–June 2013 59
Landscape-level assessment of the distribution of the Sumatran rhinoceros
Landscape-level assessment of the distribution of the Sumatran rhinoceros in Bukit Barisan Selatan National Park, Sumatra
Wulan Pusparini* and Hariyo T Wibisono
Wildlife Conservation Society – Indonesia Program, JI. Atletik No. 8, Tanah Sareal Bogor 16161, West Java, Indonesia*corresponding author email: [email protected]
AbstractWe conducted the first systematic survey on Sumatran rhinoceros following a robust patch occupancy framework in 3,500 km2 of Bukit Barisan Selatan National Park (BBSNP), Sumatra, Indonesia. We surveyed 55 grids (72.25 km2) between November 2007 and July 2008 to generate a reliable estimate of the proportion of area occupied (occupancy) by the Sumatran rhinoceros. Rhinoceros signs, e.g. footprints, dung, tree twists and wallows, were recorded along 833 km of transect routes, and 1-km sampling interval was used to develop detection/non-detection history for each grid. Rhinoceros signs were detected on 11 grids producing a naïve occupancy of 0.2. Occupancy modelling was used to control for imperfect detection probability (P). Based on the Royle/Nichols Heterogeneity model we concluded that Sumatran rhinoceros occupied approximately 32% of the BBSNP area (SE = 0.09). Occupancy can serve as a robust surrogate for an index of abundance in a population-monitoring framework. Further analysis using the multi-season models of the technique on time series data and season/survey-specific covariates can provide management authorities with accurate information about changes in rhinoceros populations and assist in prioritizing conservation actions for the Sumatran rhinoceros in the region.
RésuméNous avons mené une première enquête systématique sur les rhinocéros de Sumatra en suivant un cadre robuste d’occupation du territoire sur une superficie de 3500 km2 du Parc national de Bukit Barisan Selatan (PNBBS à Sumatra en Indonésie. Nous avons étudié 55 grilles (72,25 km2) entre novembre 2007 et juillet 2008 pour produire une estimation fiable de la proportion de la superficie occupée (occupation) par le rhinocéros de Sumatra. On a enregistré des signes de rhinocéros (par exemple, des empreintes, des crottes, des torsions d’arbres et des vautrements) le long de 833 km des transects et on a utilisé l’intervalle d’échantillonnage de 1 km afin de développer une histoire de détection/non-détection pour chaque grille. On a détecté des signes de rhinocéros dans 11 grilles produisant une occupation naïve de 0,2. Une modélisation de l’occupation a été utilisée pour contrôler la probabilité de détection imparfaite (P). En se basant sur le modèle d’hétérogénéité de Royle/Nichols, nous avons conclu que le rhinocéros de Sumatra occupait environ 32% de la superficie du PNBB (SE = 0,09). L’occupation peut servir comme un substitut robuste pour un indice d’abondance dans un cadre de surveillance de la population. Une analyse plus approfondie utilisant les modèles multi-saisonniers de la technique sur les données de séries chronologiques et des covariables spécifiques saisonnières/par études peuvent fournir aux autorités de gestion des informations précises sur l’évolution des populations de rhinocéros et aider à prioriser les mesures de conservation pour le rhinocéros de Sumatra dans la région.
IntroductionNo other group of animals has been so highly prized for so long yet also managed to survive human
onslaught as the rhinoceros has (Rabinowitz 1995). With their horn valued higher than gold (Gwin 2012) and much of their range converted to plantation, it is amazing that rhinoceros have survived into this

60 Pachyderm No. 53 January–June 2013
Pusparini and Wibisono
century. There are five extant species of rhinoceros in the world: two in Africa—white rhinoceros Ceratotherium simum and black rhinoceros Diceros bicornis—and three in Asia—Indian rhinoceros Rhinoceros unicornis, Javan rhinoceros Rhinoceros sondaicus and Sumatran rhinoceros Dicerorhinus sumatrensis. The Sumatran rhinoceros is the smallest and most primitive of all extant rhinoceros species (Dinerstein 2003). Once distributed throughout South and Southeast Asia (Foose and van Strien 1997), they are now confined to isolated parts of Indonesia and Malaysia: D.s. sumatrensis occurs in Sumatra and Peninsular Malaysia and D.s. harrissoni is endemic to Borneo (Ahmad Zafir et al. 2011). The failure of the Sumatran Rhino Trust in the late 1980s (Doherty 1992; Hutchins 1995; Lessee 1995) has become the source of the ‘parks or arks’ debate on Sumatran rhinoceros conservation. Rabinowitz (1995) cautioned that money and effort spent on the capture and breeding programme would not solve the problem nor remove the causal factors of rhinoceros decline in the wild. He summarized by asking rhetorically, ‘After all these years, do we know how many Sumatran rhinoceros we are dealing with?’ Surprisingly, 18 years have passed and the answer is still no.
By learning from the black rhinoceros captive breeding effort (Balmford et al. 1995), one can see that in situ conservation provides a greater benefit for species and ecosystem. The captive breeding programme for black rhinoceros costs three times more than protecting them in the wild, while recruitment was also higher in protected wild populations than with the captive one (Balmford et al. 1995). Establishing rhinoceros protection units (RPU) in Sumatra in 1995 became a crucial step in securing this species in the wild in three national parks: Kerinci Seblat and Bukit Barisan Selatan, and later in Way Kambas in 1998. After 17 years, Sumatra is now the only place where a wild population of Sumatran rhinoceros still persists. In contrast, rhinoceros have been ecologically extinct from habitats where no RPUs were operated, including Peninsular Malaysia (Clements et al. 2010; Ahmad Zafir et al. 2011) and Borneo (Payne and Ahmad 2012; Nichols 2012).
To be successful, managers need effective tools to evaluate and measure the outcome of their conservation interventions (Buckland et al. 2005). So far, the success of Sumatran rhinoceros protection has been evaluated by the number of illegal activities encountered (traps destroyed and poachers apprehended) (Isnan et al.
2007). However, the relationship between the rate of illegal activities and rhinoceros population parameters is unknown. In 1998, a univariate multiple comparison procedure was performed on rhinoceros footprint morphometrics, resulting in an estimate of 30–43 rhinoceros throughout the surveyed area (Wibisono 1998). A further attempt to estimate population status was a trend of abundance indices between 2002 and 2005 (Pusparini 2006). This study suggested that density estimation of Sumatran rhinoceros using photographic identification was not feasible due to lack of unique physical characteristics and extremely low capture rate. The most recent estimate of rhinoceros number in Bukit Barisan Selatan National Park (BBSNP) was 60–70 individuals, based on an educated guess (Rubianto and Suratman 2008; Talukdar et al. 2010).
Individual identification from rhinoceros foot-prints has proven to be reliable (van Strien 1985) and widely used on African rhinoceros (Alibhai et al. 2008). However, this technique usually deals with the problem of the low number of footprints being distinguished (van Strien 1986; Alibhai et al. 2008). Therefore, practical factors restrict the application of this method over a vast landscape. Population estimate using faecal DNA has been tested on Javan rhinoceros (Foead 1997; Fernando et al. 2006), Indian rhinoceros (Borthakur 2009), white rhinoceros (Steyn and Stalmans 2004), and black rhinoceros (Cunningham et al. 2001; de Groot et al. 2011). Nevertheless, the cost and time spent in analysing genetic materials make its application for large-scale monitoring not feasible.
Many population assessments do not consider two important sources of variability: spatial variation and detectability, resulting in uncertain relationship between the count statistic and the true population (MacKenzie and Kendall 2002; MacKenzie 2003; MacKenzie and Nichols 2004; O’Connell et al. 2006). The underlying questions of biological monitoring are how is biodiversity changing over time and at what rate? Without addressing such questions, there is little prospect of implementing effective action to prevent population decrease (Buckland et al. 2005). Occupancy approach (MacKenzie et al. 2002; MacKenzie and Nichols 2004; MacKenzie et al. 2005; MacKenzie and Royle 2005; MacKenzie et al. 2006) is considered superior over other methods commonly used for large mammals in terms of robustness, time, cost effectiveness and area coverage. It is especially appropriate for low-density, wide-ranging cryptic
Pachyderm No. 53 January–June 2013 61
Landscape-level assessment of the distribution of the Sumatran rhinoceros
mammals such as the Sumatran rhinoceros. The occupancy method has been proven successful in investigating wildlife population status ranging through salamanders (Bailey et al. 2004), tigers (Linkie et al. 2006; Wibisono et al. 2011) and African rhinoceros (Tosh et al. 2004). Therefore, we consider it as the most feasible and appropriate approach, especially to assess the distribution pattern of Sumatran rhinoceros over a large landscape (Karanth and Nichols 2010).
Study areaThis study was carried out between November 2007 and July 2008 in BBSNP (3,650 km2), the third largest national park in Sumatra. The park stretches along 150 km of the Bukit Barisan Mountains from Lampung Province (82% of the area) to Bengkulu and contains the largest lowland tropical evergreen forest in Sumatra (Gaveau et al. 2006). This part of Sumatra has been experiencing a dramatic human population increase since the 1930s and losing its forests faster than any other Sumatran region (Benoit and Indonesia Departement ORSTOM 1989). The long and narrow shape of the park results in a 700-km boundary and extensive development activity, especially small-scale agriculture and logging within and along the boundary of the park (O’Brien and Kinnaird 1996). As a consequence, 661 km2 (18%) of forest cover disappeared from the park between 1985 and 1999 (Kinnaird et al. 2003), mainly due to agricultural encroachment (Gaveau et al. 2006).
MethodsThe basic design of the survey followed the landscape-wide patch occupancy protocol (Karanth and Nichols 2010). A grid of 72.25 km2 was used as a sampling unit to reflect the largest home range of the Sumatran rhinoceros, measuring 60 km2 (van Strien 1986). A total of 55 imaginary grids was overlaid over the BBSNP. Four teams of four technicians were employed to search along paths having the highest probability to find rhinoceros signs. To provide an element of randomness, a smaller cell of 18 km2 was randomly chosen in each grid for the survey team to traverse. Presence of rhinoceros signs was recorded along 833 km of irregular transects, resulting in an average of 15.15 km/grid (min. 1 km, max. 56 km). Next, 1-km replicates were used to develop a detection
matrix of ‘1’ and ‘0’, each representing detected and not detected. Further, not all sampling units had the same proportion of unsuitable area (e.g. sea or human settlement), resulting in different transect lengths among grids. In the detection matrix, detection history of a grid with the longest transect represents a full trial. Therefore, missing values were assigned onto the detection histories of grids with shorter transects, which contribute nothing as they are treated as 0 by the log-likelihood function (Royle and Dorazio 2008). To estimate the probability that a grid was occupied by rhinoceros and its presence was detected, we used a multinomial maximum likelihood procedure (MacKenzie et al. 2006).
We performed a single season constant model and the Royle/Nichols Heterogeneity model to estimate the proportion of area occupied by rhinoceros across the park. The single-season constant model estimates a proportion of area occupied (psi) by animals assuming the detection probability (P) to be constant across sites. The Royle/Nichols Heterogeneity model estimates a proportion of area occupied by animals as a function of some heterogeneity in the detection probability across sites (Royle and Nichols 2003). Data analysis was performed using PRESENCE var. 4.5 (Hines 2006). Kernel density estimator in ArcGis 10.1 was performed on rhinoceros localities to generate a predictive map of rhinoceros distribution in BBSNP. Kernel density calculates the density of point features by fitting a smoothed surface curve over each point. A searching radius of 5 km was used to represent the size of the sampling unit. The surface value is highest at the point of rhinoceros occurrence and reaches zero at the end of the circle.
ResultsRhinoceros signs were detected in 11 out of 55 grids, giving a naïve occupancy of 0.2. The detection probability of the single-season constant model was higher than with the Royle/Nichols Heterogeneity model with 0.15 ± 0.04 and 0.10 ± 0.023 respectively. This resulted in a lower proportion of area occupied for the single season constant model with 0.30 (0.08) than with the Royle/Nichols Heterogeneity model with 0.32 (0.09). The Royle/Nichols Heterogeneity model estimated an abundance of 21 (± 7.1) rhinoceros living in the park. The kernel density map showed that most rhinoceros were distributed in the middle part of the
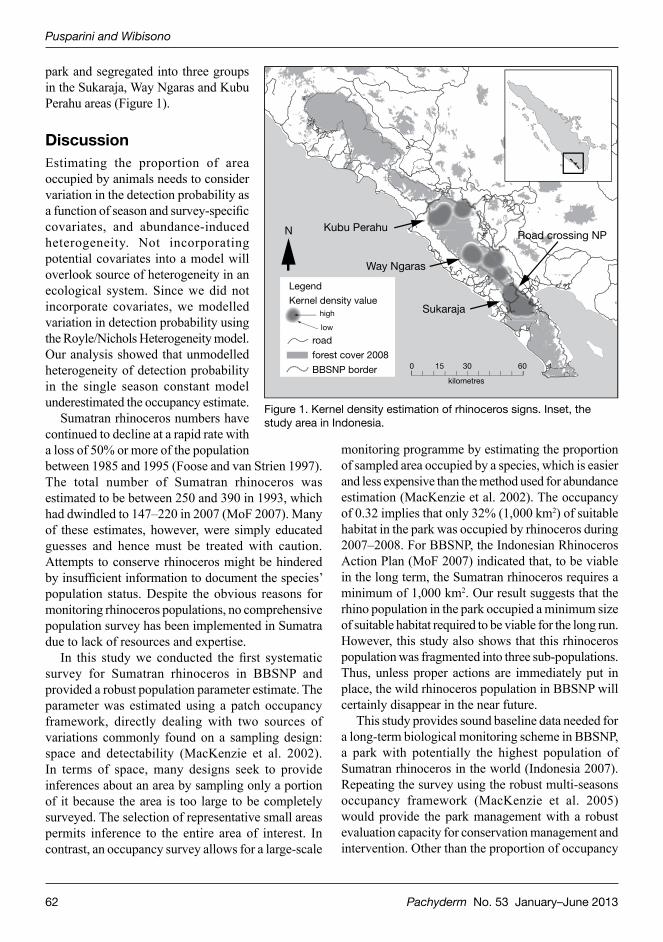
62 Pachyderm No. 53 January–June 2013
Pusparini and Wibisono
park and segregated into three groups in the Sukaraja, Way Ngaras and Kubu Perahu areas (Figure 1).
DiscussionEstimating the proportion of area occupied by animals needs to consider variation in the detection probability as a function of season and survey-specific covariates, and abundance-induced heterogeneity. Not incorporating potential covariates into a model will overlook source of heterogeneity in an ecological system. Since we did not incorporate covariates, we modelled variation in detection probability using the Royle/Nichols Heterogeneity model. Our analysis showed that unmodelled heterogeneity of detection probability in the single season constant model underestimated the occupancy estimate.
Sumatran rhinoceros numbers have continued to decline at a rapid rate with a loss of 50% or more of the population between 1985 and 1995 (Foose and van Strien 1997). The total number of Sumatran rhinoceros was estimated to be between 250 and 390 in 1993, which had dwindled to 147–220 in 2007 (MoF 2007). Many of these estimates, however, were simply educated guesses and hence must be treated with caution. Attempts to conserve rhinoceros might be hindered by insufficient information to document the species’ population status. Despite the obvious reasons for monitoring rhinoceros populations, no comprehensive population survey has been implemented in Sumatra due to lack of resources and expertise.
In this study we conducted the first systematic survey for Sumatran rhinoceros in BBSNP and provided a robust population parameter estimate. The parameter was estimated using a patch occupancy framework, directly dealing with two sources of variations commonly found on a sampling design: space and detectability (MacKenzie et al. 2002). In terms of space, many designs seek to provide inferences about an area by sampling only a portion of it because the area is too large to be completely surveyed. The selection of representative small areas permits inference to the entire area of interest. In contrast, an occupancy survey allows for a large-scale
monitoring programme by estimating the proportion of sampled area occupied by a species, which is easier and less expensive than the method used for abundance estimation (MacKenzie et al. 2002). The occupancy of 0.32 implies that only 32% (1,000 km2) of suitable habitat in the park was occupied by rhinoceros during 2007–2008. For BBSNP, the Indonesian Rhinoceros Action Plan (MoF 2007) indicated that, to be viable in the long term, the Sumatran rhinoceros requires a minimum of 1,000 km2. Our result suggests that the rhino population in the park occupied a minimum size of suitable habitat required to be viable for the long run. However, this study also shows that this rhinoceros population was fragmented into three sub-populations. Thus, unless proper actions are immediately put in place, the wild rhinoceros population in BBSNP will certainly disappear in the near future.
This study provides sound baseline data needed for a long-term biological monitoring scheme in BBSNP, a park with potentially the highest population of Sumatran rhinoceros in the world (Indonesia 2007). Repeating the survey using the robust multi-seasons occupancy framework (MacKenzie et al. 2005) would provide the park management with a robust evaluation capacity for conservation management and intervention. Other than the proportion of occupancy
Kubu PerahuN
Legend
Kernel density value
road
forest cover 2008
BBSNP border
high
low
Way Ngaras
Sukaraja
Road crossing NP
6030
kilometres
150
Figure 1. Kernel density estimation of rhinoceros signs. Inset, the study area in Indonesia.
Pachyderm No. 53 January–June 2013 63
Landscape-level assessment of the distribution of the Sumatran rhinoceros
and detection probability, the multi-seasons patch occupancy approach provides an estimate of local extinction and colonization between seasons. In general, occupancy may be a function of site-specific covariates that are constant throughout the season (e.g. habitat type), while detection probabilities may also be a function of covariates that change through season (e.g. weather conditions) (MacKenzie et al. 2005). A number of covariates measured at each site can be incorporated into the model to find the best fitted model that describes the data using a logistic model (MacKenzie et al. 2002; MacKenzie et al. 2003).
The Indonesian Rhinoceros Action Plan plans to expand the wild rhinoceros population in Bukit Barisan Selatan, Gunung Leuser and Way Kambas National Parks by at least 30% (MoF 2007). The kernel density shows that the rhinoceros were largely distributed in the central part of the park (Figure 1). In 2006, the development of an asphalt road crossing the Sukaraja area (Sanggi to Bengkunat) appeared to have a negative effect on several wildlife species, including the rhinoceros. The detrimental effect of a road inside a protected area has been demonstrated in many other studies (Bennett and Robinson 2000; Kerley et al. 2002; Linkie et al. 2006). Infrastructure development right in the centre of rhinoceros distribution would be disastrous for the population in the long term. Therefore, we urge the management authority to implement a ‘rhinoceros friendly’ road system. This may be done by developing underpasses that facilitate rhinoceros movement, controlling road uses, conducting routine patrols, and establishing active road block enforcements to control illegal activities facilitated by the road. The national park and partners also urgently need to implement a new adaptive protection scheme (Stokes 2010).
There are many examples where critically endangered species became extinct locally due to inadequate knowledge of their population status, including tigers in Sariska, India (Karanth 2011) and in the Seima Protection Forest, Cambodia (O’Kelly et al. 2012), and Sumatran rhinoceros in Kerinci Seblat NP (Isnan 2006). Therefore, a monitoring scheme based on a robust scientific approach is crucial as an evaluation tool for conservation interventions. Our study highlighted one of the main weaknesses of rhinoceros conservation approaches in the park: the absence of robust biological monitoring practices. While the proposed technique does not provide a
point of estimate of rhinoceros numbers, our finding strongly indicated that the rhinoceros population in BBSNP may not have been as healthy as what we have believed so far with 60–70 individuals (Talukdar et al. 2010). Thus, we recommend: 1) the method of population monitoring based on occupancy approach be integrated in Sumatran rhinoceros conservation, 2) the adaptive protection scheme be implemented, and 3) the green infrastructure be implemented to all existing and future developments inside the park.
AcknowledgementsThis study was part of a collaborative effort between the Wildlife Conservation Society Indonesia Program (WCS-IP), Yayasan Badak Indonesia (YABI), and the Indonesian Ministry of Forestry, Bukit Barisan Selatan NP. This work was funded by the Tiger and Rhinoceros Conservation Fund of the United States Fish and Wildlife Service and the International Rhinoceros Foundation through funds for the rhinoceros protection units. We would like to thank Arif Rubianto, Dr Nick Brickle, Dr Noviar Andayani, Waladi Isnan, Effendy Sumardja, Bibhab Talukdar, Dr Susie Ellis, all WCS-IP Kota Agung staff, all Rhinoceros Protection Units, staff of YABI and Bukit Barisan Selatan NP. We also thank the Nature Conservancy, Direktorat Jenderal Pendidikan Tinggi, Institut Pertanian Bogor, Perhimpunan Biologi Indonesia and the Association for Tropical Biology and Conservation (ATBC) 2010 that provided financial assistance for presentation of the study at the 2010 international meeting of the ATBC.
ReferencesAhmad Zafir AW, Mohamed A, Lau CF, Sharma DSK,
Payne J, Alfred R, Williams AC, Nathan S, Ramono WS, Clements GR. 2011. Now or never: what will it take to save the Sumatran rhinoceros Dicerorhinus sumatrensis from extinction? Oryx 45:225–233.
Alibhai SK, Jewell ZC, Law PR. 2008. A footprint technique to identify white rhinocerus Ceratotherium simum at individual and species levels. Endangered Species Research 4:205–218.
Bailey LL, Simons TR, Pollock KH. 2004. Estimating site occupancy and species detection probability parameters for terrestrial salamanders. Ecological Applications 14:692–702.
64 Pachyderm No. 53 January–June 2013
Pusparini and Wibisono
Balmford A, Leader-Williams N, Green MJB. 1995. Parks or arks—where to conserve threatened mammals. Biodiversity and Conservation 4:595–607.
Bennett EL, Robinson JG. 2000. Hunting of wildlife in tropical forests: implications for biodiversity and forest peoples. World Bank, Washington, DC. p. 56.
Benoit D, Indonesia Departement ORSTOM. 1989. Transmigration et migrations spontanees en Indonesie: Propinsi Lampung (Transmigration and spontaneous migrations in Indonesia: Propinsi Lampung). ORSTOM: Departement Transmigrasi Bondy, France; Jakarta Selatan, Indonesia.
Borthakur U. 2009. Non-invasive population genetic monitoring of Indian rhinoceros in Assam: a pilot study to standardise protocols for dung DNA analysis. The Rhino Print (Newsletter of the Asian Rhino Project) 4:6–7.
Buckland ST, Magurran AE, Green RE, Fewster RM. 2005. Monitoring change in biodiversity through composite indices. Philosphical Transactions of the Royal Society B, 360:243–254.
Clements R, Rayan DM, Zafir AWA, Venkataraman A, Alfred R, Payne J, Ambu L, Sharma DSK. 2010. Trio under threat: can we secure the future of rhinos, elephants and tigers in Malaysia? Biodiversity and Conservation 19:1115–1136.
Cunningham J, Morgan-Davies AM, O’Ryan C. 2001. Counting rhinos from dung: a method to estimate the minimum number of animals present in a protected area using microsatellite DNA. South African Journal of Science 97:293–294.
de Groot PJVC, Putnam AS, Erb P, Scott C, Melnick D, O’Ryan C, Boag PT. 2011. Conservation genetics of the black rhinoceros, Diceros bicornis bicornis, in Namibia. Conservation Genetics 12:783–792.
Dinerstein E. 2003. The return of the unicorns: the natural history and conservation of the greater one-horned rhinoceros. Columbia University Press, New York.
Doherty JG. 1992. Saving species: the Sumatran Rhino Trust. Zoo View 26:24–27.
Fernando P, Polet G, Foead N, Ng LS, Pastorini J, Melnick DJ. 2006. Genetic diversity, phylogeny and conservation of the Javan rhinoceros (Rhinoceros sondaicus). Conservation Genetics 7:439–448.
Foead N. 1997. Faecal DNA analysis: what does it offer to save Javan rhino? In: Foose TJ and van Strien NJ, editors, Javan Rhino Colloquium: agenda and briefing book. Editorial Committee, Bogor. p. 15.
Foose TJ, van Strien N. 1997. Asian rhinos—status survey and conservation action plan. IUCN, Gland,
Switzerland, and Cambridge, UK.Gaveau DLA, Wandono H, Setiabudi F. 2006. Three
decades of deforestation in southwest Sumatra: have protected areas halted forest loss and logging, and promoted re-growth? Biocon 8.
Gwin P. 2012. Rhino wars. National Geographic 221:106–120.
Hines JE. 2006. PRESENCE2: software to estimate patch occupancy and related parameters. US Geological Survey, Patuxent Wildlife Research Center, Laurel, MD. http://www.mbr-pwrc.usgs.gov/software/presence.shtml.
Hutchins M. 1995. Sumatran rhino conservation. Conservation Biology 9:977–977.
Isnan MW. 2006. Laporan Penyelamatan Badak Sumatera Taman Nasional Kerinci Seblat di Bengkulu. In: PHKA Kementrian Kehutanan, Bogor, Indonesia. p. 36.
Isnan W, Subrata D, van Strien NJ. 2007. Quarterly activity and performance report, 1 January–31 March 2007 (Q1). p. 28.
Karanth KU. 2011. India’s tiger counts: the long march to reliable science. Economic and Political Weekly 46:22–24.
Karanth KU, Nichols JD. 2010. Non-invasive survey methods for assessing tiger populations. In: Tilson RL, Nyhus PJ, editors., Tigers of the world: the science, politics, and conservation of Panthera tigris. Elsevier/Academic Press, Boston. pp. 241–261.
Kerley LL, Goodrich JM, Miquelle DG, Smirnov EN, Quigley HB, Hornocker MG. 2002. Effects of roads and human disturbance on Amur tigers. Conservation Biology 16:97–108.
Kinnaird MF, Sanderson EW, O’Brien TG, Wibisono HT, Woolmer G. 2003. Deforestation trends in a tropical landscape and implications for endangered large mammals. Conservation Biology 17(1):245–257.
Lessee J. 1995. Sad news [Sumatran rhino in San Diego]. Really Rhinos 9:1.
Linkie M, Chapron G, Martyr DJ, Holden J, Leader-Williams N. 2006. Assessing the viability of tiger subpopulations in a fragmented landscape. Journal of Applied Ecology 43:576–586.
MacKenzie DI. 2003. Assessing site occupancy modelling as a tool for monitoring Mahoenui giant meta populations. DOC Science Internal Series 145.
MacKenzie DI, Kendall Wl. 2002. How should detection probability be incorporated into estimates of relative abundance? Ecology 83:2387–2393.
Pachyderm No. 53 January–June 2013 65
Landscape-level assessment of the distribution of the Sumatran rhinoceros
MacKenzie DI, Nichols JD. 2004. Occupancy as a surrogate for abundance estimation. Animal Biodiversity and Conservation 27:461–467.
MacKenzie DI, Nichols JD, Hines JE, Knutson MG, Franklin AB. 2003. Estimating site occupancy, colonization and local extinction when a species is detected imperfectly. Ecology 84:2200–2207.
MacKenzie DI, Nichols JD, Lachman GB, Droege S, Royle JA, Langtimm CA. 2002. Estimating site occupancy rates when detection probabilities are less than one. Ecology 83:2248–2255.
MacKenzie DI, Royle JA. 2005. Designing occupancy studies: general advice and allocating survey effort. Journal of Applied Ecology 42:1105–1114.
MacKenzie DI, Nichols JD, Royle JA, Pollock KH, Bailey LL, Hines JE. 2006. Occupancy estimation and modeling: inferring patterns and dynamics of species occurrence. Elsevier/Academic Press, Burlington, MA.
MacKenzie DI, Nichols JD, Sutton N, Kawanishi K, Bailey Ll. 2005. Improving inferences in population studies of rare species that are detected imperfectly. Ecology 86:1101–1113.
[MoF] Ministry of Forestry. 2007. Stretgy and action plan for the conservation of rhinos in Indonesia. MoF, Republic of Indonesia.
Nichols, H. 2012. Sex and the single rhinoceros. Nature 485:566–569.
O’Brien TG, Kinnaird MF. 1996. Birds and mammals of the Bukit Barisan Selatan National Park, Sumatra, Indonesia. Oryx 30:207.
O’Connell AF, Talancy NW, Bailey LL, Sauer JR, Cook R, Gilbert AT. 2006. Estimating site occupancy and detection probability parameters for meso- and large mammals in a coastal ecosystem. Journal of Wildlife Management 70:1625–1633.
O’Kelly HJ, Evans TD, Stokes EJ, Clements TJ, Dara A, Gately M, Menghor N, Pollard EHB, Soriyun M, Walston J. 2012. Identifying conservation successes, failures and future opportunities; assessing recovery potential of wild ungulates and tigers in eastern Cambodia. PLoS One, 7 e40482.
Payne, J, Ahmad AH. 2012. A comment on ‘sex and the single rhinoceros’ by Henry Nichols. http://www.borneorhinoalliance.org
Pusparini W. 2006. Population and habitat feasibility study of the Sumatran rhino (Dicerorhinus
sumatrensis, Fischer 1814) at Bukit Barisan Selatan National Park. Thesis. Faculty of Math and Science, University of Indonesia Depok, p. 109.
Rabinowitz A. 1995. Helping a species go extinct—the Sumatran rhino in Borneo. Conservation Biology 9:482–488.
Royle, JA, Nichols JD. 2003. Estimating abundance from repeated presence–absence data or point counts. Ecology 84:777–790.
Royle JA, Dorazio RM. 2008. Hierarchical modeling and inference in ecology: the analysis of data from populations, metapopulations and communities. Academic, Amsterdam, Burlington, MA.
Rubianto A, Suratman. 2008. Konservasi dan dugaan populasi badak sumatera (Dicerorhinus sumatrensis, Fischer 1814) di Taman Nasional Bukit Barisan Selatan. RPU-YABI, TNBBS Kota Agung.
Steyn A, Stalmans M. 2004. Use of DNA technology in white rhino (Ceratotherium simum) identification and its applications in conservation. Game and Wildlife Science 21:787–795.
Stokes EJ. 2010. Improving effectiveness of protection efforts in tiger source sites: developing a framework for law-enforcement monitoring using MIST. Integrative Zoology 5:363–377.
Talukdar BK, Sectionov, Whetham LB, editors. 2010. Proceedings of the Asian Rhino Specialist Group meeting held at Kaziranga National Park, India, 10–12 February 2010. p. 30.
Tosh CA, Reyers B, Jaarsveld AS. 2004. Estimating the abundances of large herbivores in the Kruger National Park using presence–absence data. Animal Conservation 7:55–61.
van Strien NJ. 1986. The Sumatran rhinoceros, Dicero-rhinus sumatrensis (Fischer, 1814), in the Gunung Leuser National Park, Sumatra, Indonesia: its distribution, ecology and conservation. P Parey, Hamburg.
Wibisono HT. 1998. Laporan Akhir Monitoring Badak Sumatera TN Bukit Barisan Selatan. RPU - PKBI Kota Agung. Unpublished.
Wibisono HT, Linkie M, Guillera-Arroita G, Smith JA, Sunarto, Pusparini W, Asriadi, Baroto P, Brickle N, Dinata Y et al. 2011. Population status of a cryptic top predator: an island-wide assessment of tigers in Sumatran rainforests. PloS One 6.
66 Pachyderm No. 53 January–June 2013
Ramey et al.
Desert-dwelling African elephants (Loxodonta africana) in Namibia dig wells to purify drinking water
Eva M Ramey,1 Rob R Ramey, 2,3,* Laura M Brown,2,3 and Scott T Kelley 4
1 Lewis & Clark College, 0615 SW Palatine Hill Rd., Portland, OR 97219, USA2 Wildlife Science International, PO Box 386, Nederland, CO 80466, USA3 Desert Lion and Elephant Conservation, Namibia4 Department of Biology, San Diego State University, San Diego, CA 92182, USA* Corresponding author email: [email protected]
AbstractIn the arid regions of southern Africa, elephants (Loxodonta africana) are known to dig wells using their feet and trunks to access water beneath the surface of dry sandy riverbeds. This behaviour is observed even in areas where surface water is readily available. Desert-dwelling elephants of northwestern Namibia also routinely damage borehole infrastructure to access water, even when water is available in artificial drinking pools. This study sought to determine the qualities of the water in ‘elephant wells’ and boreholes that prompt elephants to go to such extremes to access it. This study compared faecal coliform bacterial counts in water sampled from recently dug elephant wells and boreholes with samples from the nearest surface water available to elephants in the arid Kunene region of northwestern Namibia. Results of 13 pairwise comparisons collected over two field seasons revealed significantly lower coliform counts in the elephant wells than in the nearest surface water or drinking pools. Coliform counts from the two boreholes in the study area, periodically damaged by elephants, were also dramatically lower. Alternatively, we found no evidence that elephant wells were less saline than nearby surface waters. We conclude that these behaviours are attempts by elephants to access less-contaminated drinking water. Understanding elephant behaviour in selecting water sources may also help in the development of more effective measures to protect artificial water sources and better provide for the needs of desert-dwelling elephants.
RésuméDans les régions arides d’Afrique australe, les éléphants (Loxodonta africana) sont connus pour creuser des puits à l’aide de leurs pattes et leurs trompes afin d’accéder à l’eau sous la surface des lits de rivières sablonneux et secs. Ce comportement est observé même dans les zones où l’eau de surface est facilement disponible. Les éléphants des déserts du nord-ouest de la Namibie endommagent régulièrement aussi les infrastructures des puits pour accéder à l’eau, même quand celle-ci est à leur disposition dans les mares artificielles immédiatement adjacentes. Cette étude visait à déterminer la qualité de l’eau dans « les puits des éléphants » et les forages qui font que les éléphants aillent à de tels extrêmes pour y accéder. Cette étude a comparé le nombre de bactéries coliformes fécaux des échantillons d’eau prise à partir des puits et des forages récemment creusés par les éléphants avec des échantillons d’eau de surface la plus proche à la disposition des éléphants dans la région aride de Kunene du nord-ouest de la Namibie. Les résultats de 13 comparaisons par paires collectées pendant deux saisons sur le terrain ont révélé des nombres de coliformes significativement plus faibles dans les puits d’éléphants par rapport à l’eau de surface la plus proche ou à la mare d’abreuvage. Les coliformes provenant des deux forages endommagés périodiquement par les éléphants dans la zone d’étude, étaient également nettement inférieurs. D’ailleurs, nous n’avons trouvé aucune preuve que les puits des éléphants étaient moins salés que les eaux de surface à proximité. Nous concluons que ce comportement de creuser des puits et de s’attaquer aux forages sont des tentatives des éléphants d’accéder à l’eau potable moins contaminée. La compréhension du comportement des éléphants dans leurs choix des sources d’eau peut également aider au développement des

Pachyderm No. 53 January–June 2013 67
Desert-dwelling elephants in Namibia dig wells to purify drinking water
Introduction Elephants in the arid Kunene region of northwestern Namibia spend most of the dry season feeding on sparse vegetation and drinking from scattered water sources in the riverbeds of ephemeral rivers. These ephemeral rivers, where intermittent surface water is present, are essentially linear oases in an otherwise waterless desert. In addition to surface water, elephants also access water by digging wells with their feet
and trunks in the dry sand of the riverbeds where groundwater nears the surface. These ‘elephant wells’ are up to 1 m deep (Figure 1a–c), and are used not only by elephants but by numerous other species as well, for example, springbok, jackals, baboons. Curiously, elephants will go to great lengths to dig wells immediately adjacent to free-flowing surface water or pools, rather than drink from those readily available water sources (Figure 1b). This behaviour is not unique to desert-dwelling elephants and has
Figure 1. A. Shallow well dug by an elephant in a dry section of the Hoarusib River. B. An elephant well immediately adjacent to surface flowing water in the Hoarusib River. C. Elephants drinking from an elephant well in the dry bed of the Hoanib River. D. Artificial drinking pool at the East Presidential borehole, Hoanib River.
contre-mesures plus efficaces pour protéger les sources d’eau artificielles et mieux répondre aux besoins des éléphants du désert et aider à leur survie à long terme.
Rob
Ram
ey
68 Pachyderm No. 53 January–June 2013
Ramey et al.
been documented in other elephant populations as well (Payne 1998).
In Namibia’s Kunene region, humans have also drilled numerous boreholes near settlements to supply water for villages and livestock. These community boreholes attract desert-dwelling elephants, which often damage the borehole infrastructure in their attempts to reach water. In an effort to keep elephants away from human settlements in the Hoanib River catchment, two wildlife-specific boreholes were drilled in 2002 by the Ministry of Environment and Tourism (MET), and outfitted with artificial drinking pools that allow easy access by all species (Leggett 2006; Figure 1d). These measures have helped to reduce human–elephant conflict at community boreholes near Sesfontein in the Hoanib River area. Nevertheless, even with water readily available in the wildlife drinking pools, elephants routinely damage the pumps, pipes and water storage tanks of these boreholes despite extensive ‘elephant-proof’ armouring, for example, rock or cement walls, trenches, loose rocks, cages, and fences made of railroad iron and 10-mm steel cables.
We and others (Wanke and Wanke 2007) have observed that, especially during the dry season, surface water and wildlife drinking pools are visibly contaminated with animal faeces from many different species, including elephants. Therefore, we hypothesized that well-digging behaviour is elephants’ attempts to access cleaner water, that is, less contaminated with faecal bacteria. To test our hypothesis, we applied a rapid faecal coliform assay (commonly used to assess faecal contamination in urban water and sewage systems) to 13 paired-water samples, that is, elephant well versus nearest surface source in the Kunene region. We also used the coliform assay to compare levels of contamination between wildlife-specific boreholes (pumps and storage tanks) and their adjacent drinking pools. Finally, we assayed faecal coliform levels at several natural springs, some with limited evidence of animal use.
Understanding elephant motivation and behaviour is of ultimate significance to this research in that it allows us to anticipate, and therefore reduce, points of conflict with humans, which in turn benefits elephant conservation. In this case, understanding elephant behaviour around water may help us to not only develop more effective countermeasures to protect artificial water sources, but also to better provide for the needs of these elephants and other desert species.
MethodsIn 2008 and 2009 we sampled water from sources used by elephants in the Hoarusib and Hoanib Rivers of Kunene region, west of the 100-mm rainfall isohyet, in the northern Namib Desert of Namibia (Figure 2). These ephemeral rivers drain large catchment areas that have substantial human and livestock populations upstream, and are subject to seasonal flooding during the wet season. At 13 sites we collected paired water samples: one from an elephant well that was less than a day old (elephant wells seldom last more than a day or two before they collapse) and the second from the nearest surface water that could have been used by elephants. These alternative surface water sources ranged anywhere from 3 m to 1800 m from the elephant wells. We also sampled individual natural desert springs and surface pools, some of which are located in the remote gravel plains and dune fields of the Skeleton Coast National Park, where there is minimal vegetation and therefore less use by elephants and other animals (Figure 2). Finally, we sampled water from the two wildlife boreholes (known as the East and West Presidential boreholes) and their artificial drinking pools that were drilled by MET in the Hoanib River. [Note: In 2008, the East Presidential borehole was not pumping due to a malfunction. In 2009 it was repaired, but subsequently destroyed by elephants, and a sample was obtained from the gushing (broken) wellhead. At the West Presidential borehole, the 2008 sample came from a storage tank, which may explain the positive coliform count; and in 2009, the wellhead was damaged by elephants and completely failed. Both boreholes were subsequently repaired in 2010 by MET and elephant-proofed with 3-m high stone and gabion walls.]
Total coliform was estimated using Colilert-18 and Quanti-Tray/2000 MPN tests (IDEXX Laboratories, Maine, USA). Coliform bacteria counts determined by the Colilert 18/Quanti-Tray method include coliform of faecal origin as well as some species of non-faecal origin (Chao et al. 2004; Sercu et al. 2011). Escherichia coli is a subset of faecal coliform and one of the most common microbes in the diverse microbial community found in intestines of mammals (Rompre et al. 2002; Ley et al. 2008). Coliform bacterial load has also been used as an indicator of viral contamination in water (Gersberg et al. 2006). Wearing sterile gloves, researchers collected 100 ml of water by hand in sterile 120-ml disposable vessels with sodium thiosulfate.
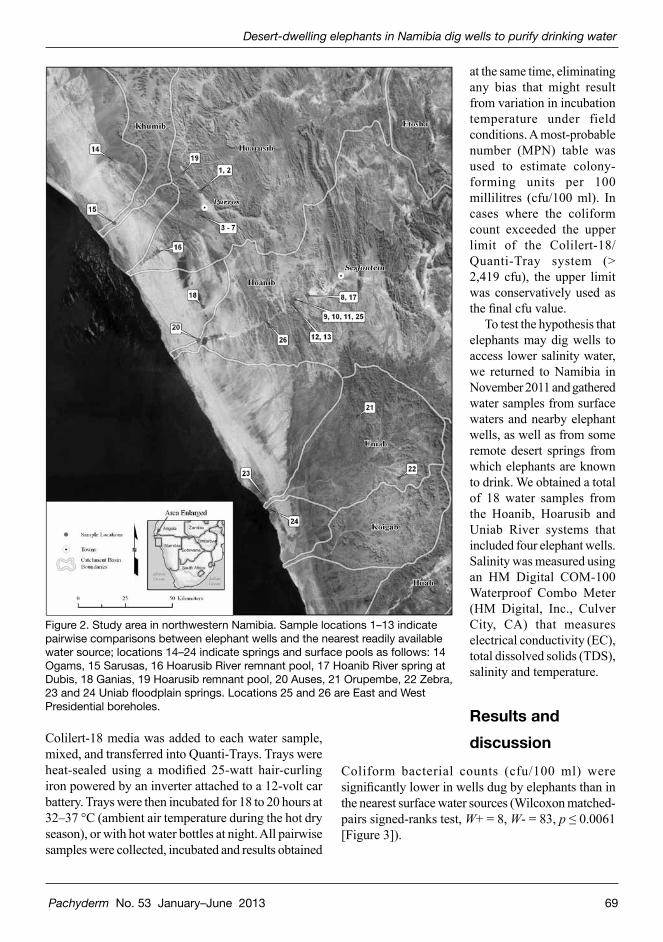
Pachyderm No. 53 January–June 2013 69
Desert-dwelling elephants in Namibia dig wells to purify drinking water
at the same time, eliminating any bias that might result from variation in incubation temperature under field conditions. A most-probable number (MPN) table was used to estimate colony-forming units per 100 millilitres (cfu/100 ml). In cases where the coliform count exceeded the upper limit of the Colilert-18/Quanti-Tray system (> 2,419 cfu), the upper limit was conservatively used as the final cfu value.
To test the hypothesis that elephants may dig wells to access lower salinity water, we returned to Namibia in November 2011 and gathered water samples from surface waters and nearby elephant wells, as well as from some remote desert springs from which elephants are known to drink. We obtained a total of 18 water samples from the Hoanib, Hoarusib and Uniab River systems that included four elephant wells. Salinity was measured using an HM Digital COM-100 Waterproof Combo Meter (HM Digital, Inc., Culver City, CA) that measures electrical conductivity (EC), total dissolved solids (TDS), salinity and temperature.
Results and discussion
Coliform bacterial counts (cfu/100 ml) were significantly lower in wells dug by elephants than in the nearest surface water sources (Wilcoxon matched-pairs signed-ranks test, W+ = 8, W- = 83, p ≤ 0.0061 [Figure 3]).
Colilert-18 media was added to each water sample, mixed, and transferred into Quanti-Trays. Trays were heat-sealed using a modified 25-watt hair-curling iron powered by an inverter attached to a 12-volt car battery. Trays were then incubated for 18 to 20 hours at 32–37 °C (ambient air temperature during the hot dry season), or with hot water bottles at night. All pairwise samples were collected, incubated and results obtained
Figure 2. Study area in northwestern Namibia. Sample locations 1–13 indicate pairwise comparisons between elephant wells and the nearest readily available water source; locations 14–24 indicate springs and surface pools as follows: 14 Ogams, 15 Sarusas, 16 Hoarusib River remnant pool, 17 Hoanib River spring at Dubis, 18 Ganias, 19 Hoarusib remnant pool, 20 Auses, 21 Orupembe, 22 Zebra, 23 and 24 Uniab floodplain springs. Locations 25 and 26 are East and West Presidential boreholes.

70 Pachyderm No. 53 January–June 2013
Ramey et al.
The coliform load in the majority of the elephant wells was close to that found in remote springs (elephant wells: mean 430 cfu, range 0–1,986 cfu, n = 13; remote springs: mean 153 cfu, range 37.0–344.8 cfu, n = 11), although two of the elephant wells sampled had relatively high coliform counts (sample locations 6 and 12). At the East and West Presidential boreholes (wildlife-specific), coliform bacterial loads in the artificial drinking pools were high (980 to > 2,419 cfu/100 ml) compared with water sampled directly from the wellheads or from the adjacent storage tanks (0–6.3 cfu/100 ml).
The possible hypotheses, that higher salinity of surface water prompts elephants to seek less-saline water or that elephants seek higher saline water because it harbours fewer coliforms, do not appear to explain why elephants dig shallow wells next to flowing streams. We found no correlation between salinity and coliform count in elephant wells and
alternative water sources. The Hoarusib and Hoanib Rivers drain large catchments and flood annually, and with a few notable exceptions (elephants rarely visit springs near the coast) are fresh to slightly saline. For example, the measured conductivity and total dissolved solids of wetlands along the intermittently flowing stretch of the Hoanib River where we sampled elephant wells, had measured levels that were suitable for consumption by domestic stock and wildlife, e.g. conductivity 2.3–5.5 mS/S, and total dissolved solids 1,040–1,700 mg/litres during the dry season (Knight 1995; Leggett et al. 2003). Furthermore, two of three elephant-dug wells in the Hoanib River were much more saline than nearby alternative water sources at artificial drinking pools (3,100 and 4,570 ppm in the elephant wells vs. 2,290 and 2,840 ppm in the artificial drinker pools). One elephant well sampled in the Hoarusib River was of a slightly lower salinity than the alternative water source, a flowing stream 20
Figure 3. Pairwise comparisons (1–13) of coliform bacterial concentrations in elephant wells dug by desert-dwelling elephants (grey) compared with the nearest surface water source that could have been used by the elephants (dark grey). Numbers indicate the sample locations depicted in Figure 2. Comparisons 1–8 involved elephant wells dug next to flowing streams (3–100 m apart, mean = 32 m), and comparisons 9–13 involved elephant wells next to remnant pools or artificial drinking pools (30–1,800 m apart, mean = 1,092 m). Coliform counts from remote natural springs are shown in no. 14 to 24. Samples from surface water sources in comparisons 2, 8 and 10–13 exceeded the upper detection limit of the IDEXX kits (> 2,419 cfu/100 ml).
Pachyderm No. 53 January–June 2013 71
Desert-dwelling elephants in Namibia dig wells to purify drinking water
m away (1,400 ppm vs. 1,590 ppm); however, both are classified as ‘good quality for livestock’ (Bagley et al. 1997). The Hoarusib River has more flowing surface water and is readily drunk year-round by people, livestock and wildlife.
These results are consistent with our hypothesis that elephants dig wells in the sandy riverbeds primarily to access cleaner (less bacteria-contaminated) water. Just as humans dig wells and use sand filters to purify drinking water (Elliott et al. 2008), elephants go to considerable effort to dig wells even when free-flowing water is often only metres away. Likewise, our results are consistent with the hypothesis that elephants break into borehole pumps and storage tanks to gain access to cleaner water than is readily available in the adjacent drinking pools. It is unknown whether elephants discriminate among the potential water sources based on taste or their well-developed sense of smell, or both.
Of historical significance, clean drinking water was obtained from elephant wells in the Hoarusib River during a 1943 overland rescue expedition. The rescuers filled their water barrels from elephant wells near Purros before proceeding across the waterless gravel plains and dune fields to aid shipwrecked survivors on the Skeleton Coast (Marsh 1944).
The results of this study have important implications for managing elephants in the desert regions (in particular, wildlife boreholes) as well as human–elephant conflict at community boreholes. If purer sources of water can be provided for elephants at artificial drinking pools, this could alleviate elephants’ desire to break into wellheads and destroy pipes and storage tanks. It is neither difficult nor expensive to add elephant drinking cribs (troughs) between the storage tanks and drinking pools so that elephants can access clean water before it enters the pool and faeces contaminate it. Elephant drinking cribs added between storage tanks and drinking pools simultaneously reduce faecal contamination and evaporation because they are continually flushed with fresh water (Wanke and Wanke 2007). Preliminary data from arid eastern Namibia suggest that human–elephant conflict at water points is reduced when elephant cribs are added, and that elephants selectively drink from cribs rather than drinking pools (Matson 2006). While we have shown that elephants prefer to drink from cleaner sources of water, including wells they have dug themselves, the precise mechanism for their choice (i.e. taste or smell) is unknown. Future experimental research could be
used to address this question.As human and livestock population densities in the
Kunene region increase, so does the microbial load running downstream. This will affect all available surface water, except for springs that are outside rivers. Notably, Ganias, the most remote spring in this study, had the lowest coliform count (Figure 3). It is also of such low volume that it takes several minutes to refill after a single oryx drinks from it.
Elephant damage to artificial boreholes is an emerging issue and is expected to become more of a problem because of increased human and livestock populations and reduced government subsidies, thus shifting the responsibility for repairs to local communities and conservancies (Hossain and Helao 2008). If damage from elephants is costly in terms of time and money, local communities will be less likely to tolerate elephant populations in their area, thus further shrinking the range of Namibia’s desert-dwelling elephants. Therefore, any action that can be taken to reduce elephant damage to boreholes and water sources is a wise investment for both humans and animals.
Ethics statementThis research was conducted under the Ministry of Environment and Tourism research and collection permits 1298/2008, 1393/2009, and 1508/2010 for research on the effects of climate change on desert-dwelling elephants of Namibia in Etosha National Park, Skeleton Coast National Park, Kunene and Omusati regions of Namibia.
AcknowledgementsWe would like to thank the following organizations and people for their help and support of this project: Namibia Ministry of Environment and Tourism; Dr Keith Leggett of the Namibian Elephant and Giraffe Trust; Dr Philip Stander of Desert Lion Conservation; the staff at Wilderness Safaris Skeleton Coast Camp, especially Willie Smit and Dreis; Emsie Vervay and Chris Bakkes of Wilderness Safaris Rhino Camp; the staff at Wereldsend Research Camp; the staff at Okahirongo Elephant Lodge, especially Pieter de Wet; and Rodney Tjavara of Skeleton Coast Fly-In Safaris. John Wieber provided GIS support.
72 Pachyderm No. 53 January–June 2013
Ramey et al.
Funding disclosureDonations toward supplies for the project were received by the primary author from the following individuals: Carl Griffin, Bud Isaacs, Gordon Beckstead, Marti Awad, Scot and Karen Barker, Eldon and Fleta Johnsen, Joseph Kelly, the Layton Family, Dyer of Broad Street Ventures. The donors had no role in the study design, data collection and analysis, decision to publish, or preparation of the manuscript.
ReferencesBagley C, Kotuby-Amacher J, Farrel-Poe K. 1997.
Analysis of water quality for livestock. Utah State University Cooperate Extension. Archived publications. Paper 106. Available at http://digitalcommons.usu.edu/cgi/viewcontent.cgi?article=1105&contet=extension_hista. Accessed 27 June 2013.
Chao KK, Chao CC, Chou WL. 2004. Evaluation of Colilert-18 for detection of coliforms and Escherichia coli in subtropical freshwater. Applied Environmental Microbiology 70(2):1242–1244.
Elliott MA, Stauber CE, Koksal F, DiGiano FA, Sobsey MD. 2008. Reductions of E. coli echovirus type 12 and bacteriophages in an intermittently operated household-scale slow sand filter. Water Research 42(10–11):2662–2670.
Gersberg RM, Rose MA, Robles-Sikisaka R, Dhar AK. 2006. Quantitative detection of hepatitis A virus and enteroviruses near the United States–Mexico border and correlation with levels of fecal indicator bacteria. Applied Environmental Microbiology 72(12):7438–7444.
Hossain F, Helao T. 2008. Local governance and water resource management: experiences from northern Namibia. Public Administration and Development 28:200–211.
Knight M. 1995. Drought-related mortality of wildlife in the southern Kalahari and the role of man. African Journal of Ecology 33(4):1365–2028.
Leggett K. 2006. Effect of artificial water points on the movement and behaviour of desert-dwelling elephants of northwestern Namibia. Pachyderm 40:40–51.
Leggett K, Fennessy J, Schneider S. 2003. Does land use matter in an arid environment? A case study from the Hoanib River catchment, north-western Namibia. Journal of Arid Environments 53(4):529–543.
Ley RE, Hamady M, Lozupone C, Turnbaugh PJ, Ramey RR, Bircher JS, Schlegel ML, Tucker TA, Schrenzel MD, Knight R, Gordon JI. 2008. Evolution of mammals and their gut microbes. Science 320(5883):1647–1651.
Marsh J. 1944. Skeleton Coast. Hodder and Stoughton, London and Cape Town.
Matson T. 2006. Factors affecting human–elephant conflicts in Nyae Nyae Conservancy and Khaudum National Park, Namibia. Human–Elephant Conflict Research Project technical report, May 2006. Nyae Nyae Conservancy and Khaudum National Park, Namibia.
Payne K. 1998. Silent thunder: in the presence of elephants. Simon and Schuster, New York.
Rompre A, Servais P, Baudart J, de-Roubin MR, Laurent P. 2002. Detection and enumeration of coliforms in drinking water: current methods and emerging approaches. Journal of Microbiological Methods 49(1):31–54.
Sercu B, Van De Werfhorst LC, Murray JL, Holden PA. 2011. Cultivation-independent analysis of bacteria in IDEXX Quanti-Tray/2000 fecal indicator assays. Applied Environmental Microbiology 77(2):627–633.
Wanke H, Wanke A. 2007. Water quality for game in drylands: a case study from the Khaudum National Park, Namibia. Journal of Arid Environments 70(3):553–559.
Two-choice discrimination learning in African elephants
Pachyderm No. 53 January–June 2013 73
Two-choice discrimination learning in African elephants (Loxodonta africana)
Charles W Hyatt
Human Elephant Learning Project, Suwanee, GA 30024; email: [email protected]
AbstractA study of two-choice discrimination learning across 22 pattern pairs was conducted with three African elephants (Loxodonta africana) at the Atlanta/Fulton County Zoo with rates of acquisition and retention observed to be similar to those earlier reported for the Asian species (Elephas maximus). A significant difference was found in trials to criterion for the second half of the stimulus pairs compared with the first, indicating potential development of the learning set; after seven months with no exposure to the pattern problems, one of the subjects correctly selected the appropriate pattern on 16 of 20 pairs, and the other subject demonstrated improvement on a computer joystick task. This study extends learning research to the African species and indicates potential for further cognitive skill development.
RésuméUne étude de l’apprentissage de discrimination de deux-choix parmi 22 paires de motifs s’est menée avec trois éléphants africains (Loxodonta africana) au zoo d’Atlanta/Fulton County où les niveaux d’apprentissage et mémoire se ressemblaient à ceux que Rensch (1957) a présenté pour l’espèce asiatique (Elephas maximus). Une différence considérable s’est trouvée dans les chemins de critères pour la deuxième moitié des paires stimulantes par comparaison à la première, ce qui indique le développement possible de l’ensemble de connaissance ; et après sept mois sans exposition aux problèmes, un des sujets a sélectionné correctement le motif approprié avec 16 des 20 paires, et l’autre sujet a démontré de l’amélioration sur une tâche avec un joystick de l’ordinateur. Cette étude étend la recherche de connaissance à l’espèce africaine et indique la possibilité du développement plus profondément des compétences cognitives.
Introduction Elephants have been studied relatively little under experimentally controlled conditions. Yet they are intriguing subjects for examination in view of their large brains (a cerebral mass of 6,000 g) and field studies that suggest that they routinely engage in ‘intelligent’ behaviour, including the use of tools and complex social interactions (Douglas-Hamilton and Douglas-Hamilton 1975; Moss 1988). Complicating the accurate evaluation of elephant behaviour are centuries of folklore regarding the animal’s alleged capacity for memory and intelligence (e.g. Williams 1989). It is therefore surprising that no experimental studies of learning by African elephants have been published, while only basic studies of learning have been attempted with the Asian species.
In early work, Murnin and Burckhardt (1949)
described without data their procedures to determine just-noticeable differences in shades of grey by an African elephant at the Bronx Zoo. Grzimek (1949) studied delayed responding in elephants to hidden food items with widely mixed results. Heffner and Heffner (1980, 1982) trained discriminative responding to right and left paddles by an Asian elephant in determining a hearing range of 17 hertz to 10.5 kilohertz for the species. Markowitz et al. (1975) describe how three Asian elephants learned to operate a light/dark key panel to obtain food rewards. With no exposure to the apparatus for eight years, one subject demonstrated significant retention of effective performance with the apparatus. More recently, Nissani et al. (2005) explored simultaneous visual discrimination between black and white and between large and small stimuli in 20 Asian logging elephants, finding an age effect in acquisition abilities favouring younger animals over
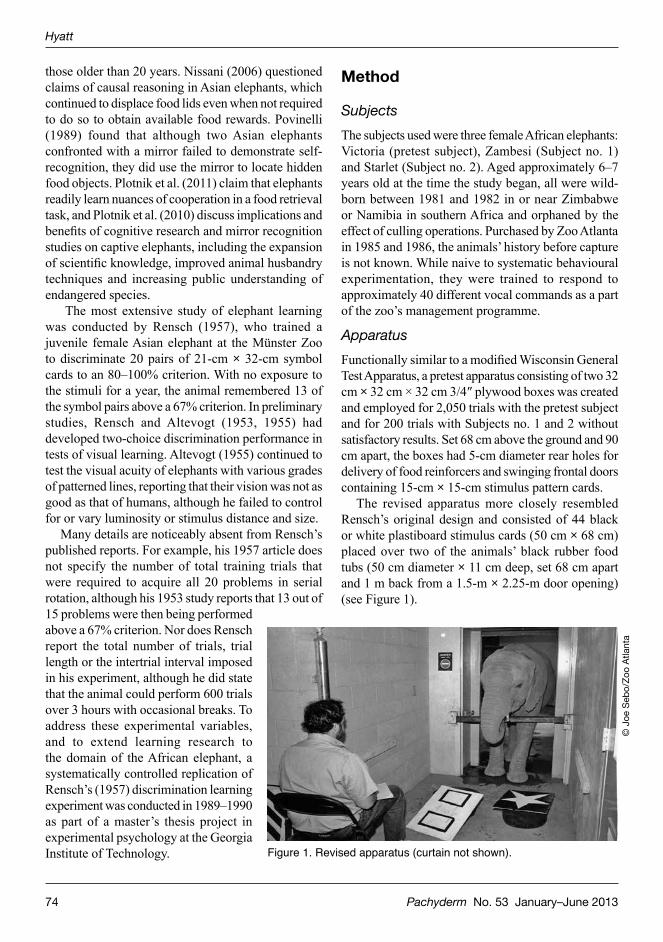
Hyatt
74 Pachyderm No. 53 January–June 2013
those older than 20 years. Nissani (2006) questioned claims of causal reasoning in Asian elephants, which continued to displace food lids even when not required to do so to obtain available food rewards. Povinelli (1989) found that although two Asian elephants confronted with a mirror failed to demonstrate self-recognition, they did use the mirror to locate hidden food objects. Plotnik et al. (2011) claim that elephants readily learn nuances of cooperation in a food retrieval task, and Plotnik et al. (2010) discuss implications and benefits of cognitive research and mirror recognition studies on captive elephants, including the expansion of scientific knowledge, improved animal husbandry techniques and increasing public understanding of endangered species.
The most extensive study of elephant learning was conducted by Rensch (1957), who trained a juvenile female Asian elephant at the Münster Zoo to discriminate 20 pairs of 21-cm × 32-cm symbol cards to an 80–100% criterion. With no exposure to the stimuli for a year, the animal remembered 13 of the symbol pairs above a 67% criterion. In preliminary studies, Rensch and Altevogt (1953, 1955) had developed two-choice discrimination performance in tests of visual learning. Altevogt (1955) continued to test the visual acuity of elephants with various grades of patterned lines, reporting that their vision was not as good as that of humans, although he failed to control for or vary luminosity or stimulus distance and size.
Many details are noticeably absent from Rensch’s published reports. For example, his 1957 article does not specify the number of total training trials that were required to acquire all 20 problems in serial rotation, although his 1953 study reports that 13 out of 15 problems were then being performed above a 67% criterion. Nor does Rensch report the total number of trials, trial length or the intertrial interval imposed in his experiment, although he did state that the animal could perform 600 trials over 3 hours with occasional breaks. To address these experimental variables, and to extend learning research to the domain of the African elephant, a systematically controlled replication of Rensch’s (1957) discrimination learning experiment was conducted in 1989–1990 as part of a master’s thesis project in experimental psychology at the Georgia Institute of Technology.
Method
SubjectsThe subjects used were three female African elephants: Victoria (pretest subject), Zambesi (Subject no. 1) and Starlet (Subject no. 2). Aged approximately 6–7 years old at the time the study began, all were wild-born between 1981 and 1982 in or near Zimbabwe or Namibia in southern Africa and orphaned by the effect of culling operations. Purchased by Zoo Atlanta in 1985 and 1986, the animals’ history before capture is not known. While naive to systematic behavioural experimentation, they were trained to respond to approximately 40 different vocal commands as a part of the zoo’s management programme.
ApparatusFunctionally similar to a modified Wisconsin General Test Apparatus, a pretest apparatus consisting of two 32 cm × 32 cm × 32 cm 3/4″ plywood boxes was created and employed for 2,050 trials with the pretest subject and for 200 trials with Subjects no. 1 and 2 without satisfactory results. Set 68 cm above the ground and 90 cm apart, the boxes had 5-cm diameter rear holes for delivery of food reinforcers and swinging frontal doors containing 15-cm × 15-cm stimulus pattern cards.
The revised apparatus more closely resembled Rensch’s original design and consisted of 44 black or white plastiboard stimulus cards (50 cm × 68 cm) placed over two of the animals’ black rubber food tubs (50 cm diameter × 11 cm deep, set 68 cm apart and 1 m back from a 1.5-m × 2.25-m door opening) (see Figure 1).
Figure 1. Revised apparatus (curtain not shown).
© J
oe S
ebo/
Zoo
Atla
nta
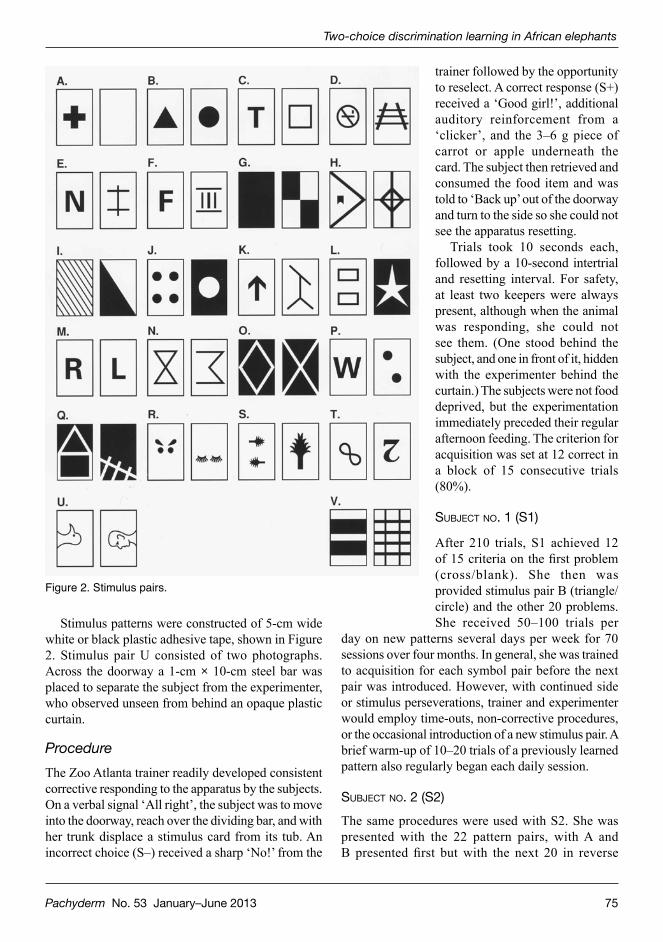
Two-choice discrimination learning in African elephants
Pachyderm No. 53 January–June 2013 75
Stimulus patterns were constructed of 5-cm wide white or black plastic adhesive tape, shown in Figure 2. Stimulus pair U consisted of two photographs. Across the doorway a 1-cm × 10-cm steel bar was placed to separate the subject from the experimenter, who observed unseen from behind an opaque plastic curtain.
ProcedureThe Zoo Atlanta trainer readily developed consistent corrective responding to the apparatus by the subjects. On a verbal signal ‘All right’, the subject was to move into the doorway, reach over the dividing bar, and with her trunk displace a stimulus card from its tub. An incorrect choice (S–) received a sharp ‘No!’ from the
trainer followed by the opportunity to reselect. A correct response (S+) received a ‘Good girl!’, additional auditory reinforcement from a ‘clicker’, and the 3–6 g piece of carrot or apple underneath the card. The subject then retrieved and consumed the food item and was told to ‘Back up’ out of the doorway and turn to the side so she could not see the apparatus resetting.
Trials took 10 seconds each, followed by a 10-second intertrial and resetting interval. For safety, at least two keepers were always present, although when the animal was responding, she could not see them. (One stood behind the subject, and one in front of it, hidden with the experimenter behind the curtain.) The subjects were not food deprived, but the experimentation immediately preceded their regular afternoon feeding. The criterion for acquisition was set at 12 correct in a block of 15 consecutive trials (80%).
Subject no. 1 (S1)
After 210 trials, S1 achieved 12 of 15 criteria on the first problem (cross/blank). She then was provided stimulus pair B (triangle/circle) and the other 20 problems. She received 50–100 trials per
day on new patterns several days per week for 70 sessions over four months. In general, she was trained to acquisition for each symbol pair before the next pair was introduced. However, with continued side or stimulus perseverations, trainer and experimenter would employ time-outs, non-corrective procedures, or the occasional introduction of a new stimulus pair. A brief warm-up of 10–20 trials of a previously learned pattern also regularly began each daily session.
Subject no. 2 (S2)The same procedures were used with S2. She was presented with the 22 pattern pairs, with A and B presented first but with the next 20 in reverse
Figure 2. Stimulus pairs.
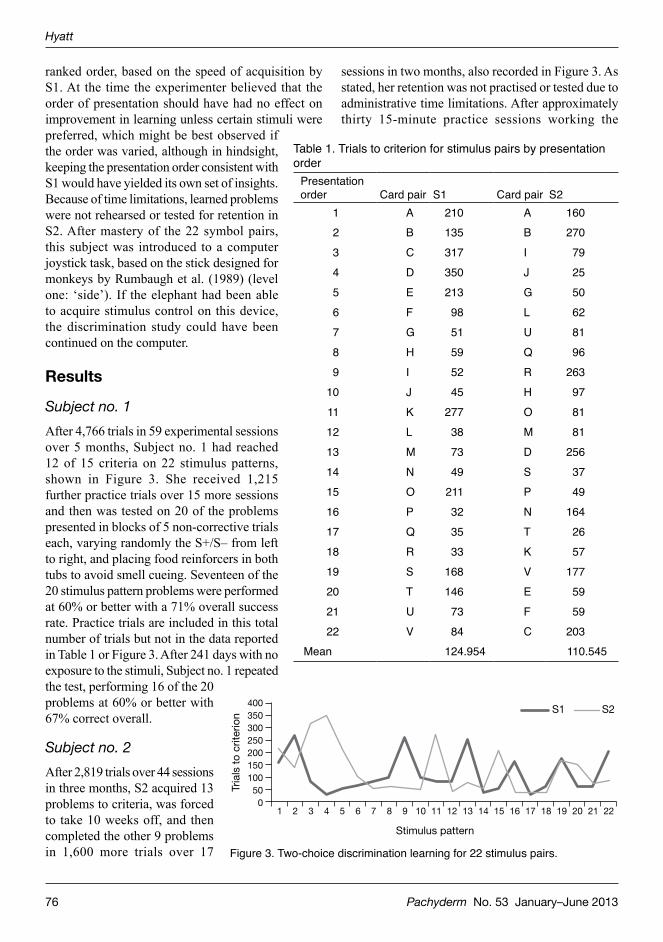
Hyatt
76 Pachyderm No. 53 January–June 2013
ranked order, based on the speed of acquisition by S1. At the time the experimenter believed that the order of presentation should have had no effect on improvement in learning unless certain stimuli were preferred, which might be best observed if the order was varied, although in hindsight, keeping the presentation order consistent with S1 would have yielded its own set of insights. Because of time limitations, learned problems were not rehearsed or tested for retention in S2. After mastery of the 22 symbol pairs, this subject was introduced to a computer joystick task, based on the stick designed for monkeys by Rumbaugh et al. (1989) (level one: ‘side’). If the elephant had been able to acquire stimulus control on this device, the discrimination study could have been continued on the computer.
Results
Subject no. 1After 4,766 trials in 59 experimental sessions over 5 months, Subject no. 1 had reached 12 of 15 criteria on 22 stimulus patterns, shown in Figure 3. She received 1,215 further practice trials over 15 more sessions and then was tested on 20 of the problems presented in blocks of 5 non-corrective trials each, varying randomly the S+/S– from left to right, and placing food reinforcers in both tubs to avoid smell cueing. Seventeen of the 20 stimulus pattern problems were performed at 60% or better with a 71% overall success rate. Practice trials are included in this total number of trials but not in the data reported in Table 1 or Figure 3. After 241 days with no exposure to the stimuli, Subject no. 1 repeated the test, performing 16 of the 20 problems at 60% or better with 67% correct overall.
Subject no. 2After 2,819 trials over 44 sessions in three months, S2 acquired 13 problems to criteria, was forced to take 10 weeks off, and then completed the other 9 problems in 1,600 more trials over 17
sessions in two months, also recorded in Figure 3. As stated, her retention was not practised or tested due to administrative time limitations. After approximately thirty 15-minute practice sessions working the
Table 1. Trials to criterion for stimulus pairs by presentation order
Presentation order Card pair S1 Card pair S2
1 A 210 A 1602 B 135 B 2703 C 317 I 794 D 350 J 255 E 213 G 506 F 98 L 627 G 51 U 818 H 59 Q 969 I 52 R 263
10 J 45 H 9711 K 277 O 8112 L 38 M 8113 M 73 D 25614 N 49 S 3715 O 211 P 4916 P 32 N 16417 Q 35 T 2618 R 33 K 5719 S 168 V 17720 T 146 E 5921 U 73 F 5922 V 84 C 203
Mean 124.954 110.545
10
50100150200250300350400
2 3 4 5 6 7 8 9 10
Stimulus pattern
Tria
ls t
o cr
iterio
n
S1 S2
11 12 13 14 15 16 17 18 19 20 21 22
Figure 3. Two-choice discrimination learning for 22 stimulus pairs.

Two-choice discrimination learning in African elephants
Pachyderm No. 53 January–June 2013 77
47 of that study are unclear. The statement that the elephant gained ‘know-how’ over successive problems with acquisition improving steadily with each new symbol pair is not statistically justified by the data reported in 1953. Yet if the 20 symbol pairs were ‘missed only one or two times’ over 600 trials, this would yield at least a 93% performance level and indicate definite improvement with time on the overall task. Since training continued for over two years, it may be assumed that rehearsal improved the subject’s performance to the level of ‘mastery’ reported. With more time, our subjects might have reached that performance level as well.
The trials to reach criteria across problems encompass similar ranges for each of the African and Asian elephants studied. For all three subjects, some patterns required more than 300 trials to learn and others less than 30 (mean = 129). Initial acquisition of two-choice discrimination learning appears to be much slower for elephants than for humans (Shepard 1957) and many primate species (Hayes et al. 1953; Rumbaugh and Pate 1970), although the number of trials necessary to acquire the first discrimination problem to criterion are absent from many of Harlow’s studies (e.g. 1945, 1949). Rensch (1957) also reported examining retention of two-choice discrimination learning in a horse, a zebra and an ass. He found that the horse was able to learn all 20 problems that the elephant had learned; the ass learned 13 and the zebra 10. It can be problematic to make comparisons between species tested with differing methodologies and training histories.
computer joystick, she had developed better control of it with her trunk and appeared to pay attention to the cursor moving on the computer screen as she moved the joystick, but she had not progressed beyond the first level of the first task in the software package before logistical and administrative issues ended the project altogether (Figure 4).
Both subjectsThe two subjects’ trials to criteria were averaged across stimulus pairs based on presentation order. A Pearson product-moment correlation (Olson 1987) was conducted and indicated a negative but statistically non-significant relationship between trials to criteria over an increased number of problems (r = –0.44). However, when a correlated t-test was conducted between the number of trials to criteria for first 11 pattern pairs when compared with the second 11 pairs, a significant difference was found (t(10) = 2.26, p < 0.025) indicating a learning effect had occurred, and that with practice the subjects significantly decreased the number of trials needed to reach criteria on new stimulus pairs.
Discussion
LearningThe relationships noted for the subjects’ performance suggests that elephants have the potential to ‘learn to learn’. However, traditional learning set testing as developed by Harlow (1949) was not conducted here, and so interpretation of this effect must be made cautiously. Potential distractions within the zoo setting compared with a controlled laboratory may have contributed to errors, and since elephants have such a large diet (more than 50 kg of food per day), the motivational quality of a single reinforcer may be diminished. Traditional learning set research would be valuable with elephants, but it would prohibitively require a larger subject pool, hundreds of six-trial problem blocks, and thousands of elephant-sturdy stimuli.
While Rensch (1957) did not use the vocabulary of Harlow’s learning set, the experiment was essentially a set of learned two-choice discrimination problems, much like this study. But the author’s claims on p.
Figure 4. Elephant with joystick.
© J
oe S
ebo/
Zoo
Atla
nta
Hyatt
78 Pachyderm No. 53 January–June 2013
The size, colour and dimension of stimuli are other important factors in studies of this type. Whether elephants see colours is unknown, although Yokoyama et al. (2005) determined that elephants and human colour-blind deuteranopes have identical sets of visual pigments. Stone and Halasz (1989) examined the physiology of the Asian elephant eye, but its acuity in detecting and processing stimuli is still unknown. These authors note that the visual field of the elephant is specialized to accommodate that area directly in front of the trunk. It may be that with the repositioning and increasing in size of the stimulus patterns, the success of the revised testing apparatus more appropriately fit this line of sight than the pretest apparatus.
Harlow (1945) found that three-dimensional stimuli were more easily discriminated by primates than were two-dimensional stimuli, and Meyer and Harlow (1949) found colour to be a more salient cue than size or shape for primates. Rensch (1958) was later interested in possible aesthetic factors in stimulus preferences of animals. While he mentions stimulus similarity as a possible factor in elephant learning in 1953, he does not elaborate on this further in 1957. This study chose to vary stimulus patterns from Rensch’s to explore the variety of symbols that elephants could learn. No cheating or cueing as described by Rosenthal (1965) in the case of Clever Hans was reflected in the elephants’ performance, but variations in subjects’ interest levels were evident, and they could easily become distracted by conspecific activity.
Learning and memory may also play key roles in elephants’ development and survival in the wild. Douglas-Hamilton and Douglas-Hamilton (1975) and Moss (1988) have both discussed how long maturation periods in young elephants may be associated with the learning of food and water acquisition strategies in large and shifting ecosystems as well as the learning of large numbers of conspecifics in home and extended herds. Foley et al. (2008) noted that survival of calves in a period of drought was higher in family groups with older mothers than in those with younger, indicating that knowledge and experience learned over time may be important elements of survival passed on to future generations.
Retention With no exposure to the stimulus patterns for eight months, African S1 responded correctly to 16 of 20
patterns, while Rensch’s Asian subject demonstrated retention for 13 patterns with no exposure for one year. Strong (1959) found rhesus monkeys performed significantly better on discrimination problems that had been presented to them before, and Gardner and Gardner (1969) and Rumbaugh (1977) have reported that chimpanzees can recall items from a vocabulary of more than 75 lexical items.
In each of the elephant studies, some relearning of stimuli may have been possible but was not indicated. It is also interesting to note that, even after thousands of trials, human investigators relied on written notes to refresh their identification of the correct stimuli. An evolutionary explanation for the elephants’ performance might suggest that searches for food and mating opportunities over large geographic and social ranges have encouraged selection of retention skills, while elephants’ sheer size and lack of predators may have lessened the need for learning to discriminate quickly.
Benefits and implications
Beyond its scientific merit, this study provided opportunities for the education and entertainment of the zoo-going public as well as simple, useful and demonstrable enrichment activity for captive animal wellbeing, as described by Hediger (1964). As large animals with active brains and bodies, elephants can benefit from behavioural enrichment, as described by Forthman et al, (2009), and further cognitive research into management and basic processes as described by Plotnik et al. (2010). The elephants were regularly observed waiting at their gate at the experimentation time, indicating the apparent reinforcing functions of the procedures. Training potentially dangerous captive animals to ‘target’, or attend and respond to certain symbols in developing hands-off management may also be aided by research on cognition.Finally, studies of this kind may contribute to the survival of wild elephants, which have suffered dramatic reductions in the past 50 years. After a brief decline in the rate of poaching in the 1990s, illegal kills rebounded significantly in the decade following (University of Washington 2008). The demonstration of complex elephant learning may heighten public awareness of the value of conserving wild populations in their native habitats.
Two-choice discrimination learning in African elephants
Pachyderm No. 53 January–June 2013 79
ConclusionsThis study demonstrated that two African elephants can learn at least 20 two-choice discrimination problems. One of the subjects showed significant retention of 16 of the problems after not being exposed to them for eight months. Similar patterns of acquisition and retention were noted for these elephants as for the Asian elephant trained by Rensch (1957).
These findings suggest rich potential for learning in this highly tractable animal. The development of stimulus control in the elephant may facilitate further research, enhance wellbeing for captive elephants and their caretakers, and increase public awareness to the issue of the long-term survival of elephants. Additional research with a greater sample size will provide more reliable assessments of learning ability in this species.
Statement on ethicsNo animals were harmed as a result of this study. Zoo Atlanta is a member of the American Association of Zoological Parks and Aquariums whose guidelines were followed in the care and handling of subjects.
AcknowledgementsThis research was supported by funds provided by the Atlanta/Fulton County Zoo, the Friends of Zoo Atlanta and the Georgia Institute of Technology. The following individuals participated in and supported the project: Terry L Maple, PhD; M Jackson Marr, PhD; Debra Forthman, PhD; elephant keepers James M Black Jr, Heidi Forrest, Thomas Walker and Gary Roessinger; and Zoo Atlanta’s research and veterinary staff. Thanks also to Gregory L Colomb, PhD, and Heidi Rockwood, PhD, of Georgia Tech and to Duane M Rumbaugh, PhD, Roger Bakeman, PhD, and William D Hopkins, PhD, of Georgia State University for valuable technical advice. Thanks to Cynthia Bennett, PhD, and Peter Grimm for English translations of Bernhard Rensch’s German works and to Angela Burgess for the French translation of the English abstract.
ReferencesAltevogt R. 1955. The minimum separable vision of an
Indian elephant. Journal of Comparative Physiology 37:323–337.
Douglas-Hamilton I, Douglas-Hamilton O. 1975. Among the elephants. Viking Press, New York.
Foley C, Pettorelli N, Foley N. 2008. Severe drought and calf survival in elephants. Biological Letters 4:541–544.
Forthman DL, Kane LF, Waldau PF. 2009. An elephant in the room. Tufts Center for Animals and Public Policy, North Graton, MA.
Gardner RA, Gardner BT. 1969. Teaching sign language to a chimpanzee. Science 165:664–672.
Grzimek B. 1949. Memory experiments with elephants. Zeitschrift fur Tierpsychologie 6:126–141.
Harlow HF. 1945. Studies in discrimination learning by monkeys: 3. Factors influencing the facility of solution of discrimination problems by rhesus monkeys. Journal of General Psychology 32:213–217.
Harlow HF. 1949. The formation of learning sets. Psychological Review 56:51–65.
Hayes KJ, Thompson R, Hayes C. 1953. Discrimination learning set in chimpanzees. Journal of Comparative and Physiological Psychology 46:99–104.
Hediger H. 1964. Wild animals in captivity. Dover, New York.
Heffner R, Heffner H. 1980. Hearing in the elephant. Science 208:518–520.
Heffner R, Heffner H. 1982. Hearing in the elephant (Elephas maximus): absolute sensitivity, frequency discrimination, and sound localization. Journal of Comparative and Physiological Psychology 96:926–944.
Markowitz H, Schmidt M, Nadal L, Squier L. 1975. Do elephants ever forget? Journal of Applied Behavior Analysis 8:333–335.
Meyer DR, Harlow HF. 1949. The development of transfer of response to patterning by monkeys. Journal of Comparative and Physiological Psychology 42:454–462.
Moss C. 1988. Elephant memories. Morrow, New York.Murnin JA, Burckhardt D. 1949. A discrimination
study with the African elephant. Anatomical Record 105:510.
Nissani M. 2006. Do Asian elephants apply causal reasoning to tool use tasks? Journal of Experimental Psychology: Animal Behavior Processes 31:91–96.
Nissani M, Hoefler-Nissani D, Lay UT, Htun UW. 2005. Simultaneous visual discrimination in Asian elephants. Journal of the Experimental Analysis of Behavior 83:15–29.
Olson CL. 1987. Statistics: making sense of data. Allyn & Bacon, Boston.
Hyatt
80 Pachyderm No. 53 January–June 2013
Plotnik JM, de Waal FBM, Moore D, Reiss D. 2010. Self-recognition in the Asian elephant and future directions for cognitive research with elephants in zoological settings. Zoo Biology 29(2):179–191.
Plotnik JM, Lair R, Suphachoksahakun W, de Waal FBM. 2011. Elephants know when they need a helping trunk in a cooperative task. www.pnas.org/cgi/doi/10.1073pnas.1101765108.
Povinelli DJ. 1989. Failure to find self-recognition in Asian elephants (Elephas maximus) in contrast to their use of mirror cues to discover hidden food. Journal of Comparative Psychology 103:122–131.
Rensch B. 1957. The intelligence of elephants. Scientific American 165:44–49.
Rensch B. 1958. The effect of aesthetic factors on vertebrates. Zeitschrift fur Tierpsychologie 15:44–461.
Rensch B, Altevogt R. 1953. The visual learning capacity of an Indian elephant. Zeitschrift fur Tierpsychologie 10:119–134.
Rensch B, Altevogt R. 1955. The extent of visual learning in an Indian elephant. Zeitschrift fur Tierpsychologie 12:68–76.
Rosenthal R, editor. 1965. Clever Hans (The horse of Mr. von Orsten), by Oskar Pfungst. Holt Rinehart & Winston, New York.
Rumbaugh DM, editor. 1977. Language learning by a chimpanzee: The Lana Project. Academic Press, New York.
Rumbaugh DM, Pate JL. 1970. Learning skills of anthropoids. In: LA Rosenblum, editor, Primate behavior: developments in field and laboratory research, vol. 1. Academic Press, New York.
Rumbaugh DM, Richardson WK, Washburn DA, Savage-Rumbaugh ES, Hopkins WD. 1989. Rhesus monkeys (Macaca mulatta), video tasks, and implications for stimulus–response contiguity. Journal of Comparative Psychology 103(1):32–38.
Shepard WO. 1957. Learning set in preschool children. Journal of Comparative and Physiological Psychology 50:15–17.
Stone J, Halasz P. 1989. Topography of the retina in the elephant (Loxodonta africana). Brain, Behavior and Evolution 34:84–95.
Strong PN. 1959. Memory for object discriminations in the rhesus monkey. Journal of Comparative and Physiological Psychology 52:333–335.
University of Washington. 2008. Ivory poaching at critical levels: elephants on path to extinction by 2020? Science Daily, 1 August 2008.
Williams H. 1989. Sacred elephant. Harmony Books, New York.
Yokoyama S, Takenaka N, Agnew DW, Shoshani J. 2005. Elephants and human color-blind deuteranopes have identical sets of visual pigments. Genetics 170:335–344.
Elephant population trends and associated factors in western Ghana
Pachyderm No. 53 January–June 2013 81
Elephant population trends and associated factors: a review of the situation in western Ghana
Emmanuel Danquah and Samuel K Oppong*
Department of Wildlife and Range Management, Faculty of Renewable Natural ResourcesKwame Nkrumah University of Science and Technology, Kumasi, Ghana* Corresponding author email: [email protected]
AbstractThe Ankasa and Bia Conservation Areas and the Goaso Forest Block form a significant portion of forest elephant range in western Ghana. This paper reviews historical and recent information on elephant population trends in western Ghana and the factors associated with these trends. We used two methods: 1) monitoring trends in elephant populations using density estimates, and 2) tracking changes in elephant distribution and density due to poaching activity. Our results indicate that most elephant populations have declined in western Ghana, although a few seem to have persisted. Specifically, we recorded positive trends in two protected areas, Ankasa and Bia, where elephants seem to be recovering under good management practices, such as reduced hunting pressure and habitat management. The Goaso elephant populations have suffered major declines in both numbers and range. Currently, elephant range is confined to only a few of the reserves in the northern Goaso Forest Block. These declines were probably as a consequence of accelerated immigration of farmers into Ghana’s western region in the 1990s, resulting in increased hunting activity and habitat loss due to unregulated timber extraction and agriculture. We also show that effective elephant range is negatively affected by poaching activity, and that elephants currently do not move across the Ghana–Cote d’Ivoire boundary.
Additional key words: Ankasa, Bia, Goaso Forest, poaching activity, elephant conservation
RésuméLes aires de conservation d’Ankasa et de Bia et le bloc forestier de Goaso constituent une partie importante de l’habitat des éléphants de forêt dans l’ouest du Ghana. Ici, nous passons en revue les données historiques et récentes sur les tendances des populations d’éléphants dans l’ouest du Ghana et les facteurs y associés. Nous avons utilisé deux méthodes 1) le suivi des tendances des populations d’éléphants en utilisant les estimations de densité et 2) le suivi des changements concernant la distribution et la densité des éléphants par rapport au braconnage. Nos résultats indiquent que la plupart des populations d’éléphants ont diminué dans l’ouest du Ghana, bien que quelques-unes semblent avoir persisté. Plus précisément, nous avons constaté des tendances positives dans deux aires protégées, Ankasa et Bia, où les éléphants semblent se rétablir grâce aux bonnes pratiques de gestion (par exemple, une pression de chasse réduite et une gestion de l’habitat). D’autre part, les populations d’éléphants de Goaso ont subi des baisses importantes en nombre et en habitat. À l’heure actuelle, l’habitat des éléphants se limite à seulement certaines réserves dans le bloc forestier nord de Goaso. Ces baisses étaient probablement une conséquence de l’immigration accélérée des agriculteurs dans la région ouest du Ghana dans les années 1990 donnant lieu à une activité de chasse accrue et une perte de l’habitat due à l’exploitation du bois non réglementée et à l’agriculture. Nous montrons également que l’habitat des éléphants est négativement affecté par le braconnage et qu’actuellement les éléphants ne traversent pas la frontière entre le Ghana et la Côte d’Ivoire.
Mots clés supplémentaires : Ankasa, Bia, la forêt de Goaso, le braconnage, la conservation des éléphants

Danquah and Oppong
82 Pachyderm No. 53 January–June 2013
IntroductionThe high forest zone of western Ghana is affected by intensive and varied human influences that have widespread and sometimes devastating effects on elephants (Danquah et al. 2007, 2009a,b). These influences include agricultural intensification, urbanization, water abstraction, land drainage and development. Such intensive land-use changes mean that elephants experience rapid changes in the extent, quality and fragmentation of their habitat, all of which affect their distribution and population size. Data on changes in the distribution and abundance of elephants over time and the factors that affect them are therefore required for a number of reasons, including setting management priorities, measuring the effects of management, managing populations of problem elephants, assessing the effects of agriculture and other human activity, and providing evidence for the need for policy change (Battersby and Greenwood 2004). We thus provide an update on the distribution of elephants in the Bia–Goaso Forest Block, review historical and recent information on elephant population trends in western Ghana, and track changes in elephant distribution and abundance with poaching activity. We hope that this review will generate broader discussion and help conservationists to identify the most appropriate and effective approaches to managing elephants under varying conditions.
Study areaThe study area is located in the high forest zone in western Ghana and comprises two wildlife reserves—the Ankasa and the Bia Conservation Areas (CAs)—and an extensive network of nine forest reserves and three shelterbelts referred to as the Goaso CA Forest Block (FB). The area extends from latitudes 6′15º to 7′20ºN and longitudes 2′24º to 3′16ºW, south of Sunyani to the west of the Tano River and to the Ghana–Cote d’Ivoire border (Figure 1).
The Ankasa CA (referred to simply as ‘Ankasa’) comprises the Ankasa Resource Reserve (RR) and the Nini-Suhien National Park (NP). These two adjacent forested areas cover 509 km2. The Bia CA (referred to simply as ‘Bia’) comprises Bia FB in the north and the adjacent Bia RR in the south, forming a block of 306 km2. The Goaso FB (referred to simply as
‘Goaso’) forms an extensive area of some 5,000 km2.The natural land cover of the western region
corresponds to the Guinea-Congolian forest vegetation area (Hall and Swaine 1981; Hawthorne and Musah 1993). At Goaso in the north, the vegetation is both moist and dry semi-deciduous; more southwards at Ankasa, the vegetation changes to the wet evergreen type (Hall and Swaine 1981). This matches with Taylor’s (1960) Celtis zenkeri–Triplochiton scleroxylon association. Key commercial species of these forests are T. scleroxylon, Entandrophragma utile and E. cylindricum, with the climbing palms Ancistrophyllum secundiflorum and Calamus deerratus being characteristic of swampy areas. The mean elevation is 200–550 m, with generally undulating topography. Mean annual rainfall is 680–1450 mm/
0 10 0 km20
7’00’’N
6’00’’N
5’00’’N
7’00’’N
6’00’’N
5’00’’N
river
forest reserve
Ghana boundary
3’00’’W 2’00’’W
3’00’’W 2’00’’W
Figure 1. Western Ghana showing the location of Ankasa (dotted), Bia (black) and the Goaso Forest Block (dark grey). Inset: location of the study area in Ghana.

Elephant population trends and associated factors in western Ghana
Pachyderm No. 53 January–June 2013 83
year characterized by a bimodal wet season from March to July and September to November, and a major dry season from December to February. High species richness and levels of endemism characterize the area (PADP 2000, 2001).
Methods
Review of elephant population trends and poaching activityWe reviewed publications—organizational documents and reports, journal articles and books—from the field of conservation as part of our overall synthesis of secondary data. We concentrated primarily on elephant research related to the study areas. In addition, we interviewed key informants from different conservation institutions to identify and obtain recommendations on key publications to review.
We analysed the literature to identify key trends in elephant densities, distribution patterns and poaching activity in the three focal areas over the years. Subsequently, we concentrated on elephant research that incorporated a combination of elephant abundance and poaching activity data. Elephant distribution in Ankasa, Bia and Goaso for specific survey periods was described using a geographic information system (GIS, ArcGIS version 9.2, ESRI Inc.). Elephant distribution was defined as land cover actively used and occupied by elephants, and this was scored using a grid overlay with a resolution of 0.25 km2. This grid overlay was expressed as a percentage of each elephant range and was termed the effective elephant range (EER) of each of these areas. EER was then regressed against poaching activity within each site for different survey periods.
We operated under the implicit assumption that increased management effort in the three focal elephant ranges would often lead to decreased poaching activity and therefore improved trends in elephant abundance patterns.
Update on elephant distribution and poaching activity
The Bia–Goaso FB is about 100 km x 100 km. We laid a grid of cells each 10 km x 10 km over a map of the area, resulting in 100 cells. Of these cells, we systematically selected 43% and recorded data on elephant presence and absence from them. Teams spent
four survey days in each cell following paths and trails on predetermined compass bearings and recording elephant signs (dung, footprints and feeding signs) and poaching activity, estimated as poaching indices (presence of spent cartridges, wire snares, poacher camps, etc.) as and when possible. We calculated distance walked with a global positioning system (GPS). Surveys took place in the wet season months of April–July and dry season months of November–February, from 2008 to 2009.
We noted all areas elephants and poachers used and recorded their coordinates using GPS. We digitized these areas in a geographic information system format (GIS, ArcView Spatial Analyst version 3.1, ESRI Inc.), which then provided an elephant distribution map.
Results
Review of elephant estimatesbia conServation area
In western Ghana, Bia has received the most attention in terms of elephant surveys (Table 1). In a first study based on track identification, Sikes (1975) estimated 52–82 elephants in Bia, giving a density of 0.25 elephants/km2. Martin (1982) followed with an estimate of between 200 and 250 for the ‘Bia Group of Forest Reserves’, which was previously 1,500 km2 and included Bia but is currently totally degraded leaving only Bia intact and with elephants. Based on his elephant densities, he provided an estimate of between 89 and 113 elephants (0.29–0.37 elephants/km2) for Bia. This compared well with the estimated density of 0.33/km2 (40 to 135 elephants) presented by Short (1983). Heffernan and Graham (2000) later estimated 137 elephants (0.45 elephants/km2), which was shortly followed by 127 elephants (0.42 elephants/km2) provided by Sam (2000).
Later in 2004, Sam et al. (2006) conducted a line transect elephant survey in the Bia-Goaso FB. They used two estimation models (Rainfall and Steady State Assumption) to generate two different estimates for the Bia range. These estimates were merged (Norton-Griffiths 1978) and gave 126 elephants (0.41 elephants/km2) for Bia. In 2007, Danquah et al. (2009a) conducted a retrospective elephant survey in the same area. Their merged estimate in both the dry and the wet seasons was 135 elephants (0.44/km2) for Bia. Danquah et al. (2007) again provided two estimates for Bia in 2007 but this time based on the Rainfall and Steady

Danquah and Oppong
84 Pachyderm No. 53 January–June 2013
State Assumption models. The merged estimate from the two estimation models was 131 elephants (0.43/km2). They repeated the survey in 2009 (Danquah et al. 2009b), which resulted in a merged estimate of 136 elephants (0.44/km2).
Goaso Forest BlockIn the Goaso area, pre-1995 densities indicated between 200 and 250 elephants (Dickinson 1990). After over a decade in 2004, Sam et al. (2006) produced a merged estimate (based on the Rainfall and Steady State Assumption models) of 65 elephants (0.09/km2) for the northern half of Goaso (Mpameso
area, 700 km2). In 2007, Danquah et al. (2009a) also provided a merged estimate (dry and wet seasons) of 87 elephants (0.12/km2) for the same area. Neither survey recorded any elephant activity in the southern half of Goaso.
Ankasa Conservation AreaDanquah et al. (2001) estimated 21 elephants in the first-ever standard survey of Ankasa. Later in 2005, the Forestry Commission (FC 2005) estimated between 66 and 70 elephants for Ankasa based on wildlife patrol sightings. In 2007, Danquah et al. (2007) provided a merged estimate of 40 elephants (0.08/km2) based
Table 1. Sequential elephant estimates for elephant ranges in western Ghana,1975–2009Elephant estimate / range
Source Estimation model Year Ankasa Bia GoasoSikes (1975) 1975 67 Range 52–82Martin (1982) 1982 101 Range 89–113Short (1983) 1983 88 Range 40–135Dickinson (1990) 1990 225 Range 200–250Heffernan & Graham (2000) 1999 137Sam (2000) 2000 127Danquah et al. (2001) 2001 21Sam et al. (2006) Rainfall model 2004 115 57Sam et al. (2006) Steady State Assumption 2004 146 72
Merged estimate 2004 126 65Forestry Commissin, Ghana (FC 2005) 2005 68
Range 2005 66–70Danquah et al. (2009a) Wet season 2007 133 90Danquah et al. (2009a) Dry season 2007 137 83
Merged estimate 2007 135 87Danquah et al. (2007) Rainfall model 2007 41 133Danquah et al. (2007) Steady State Assumption 2007 38 128
Merged estimate 2007 40 131Danquah et al. (2009b) Rainfall model 2009 61 139Danquah et al. (2009b) Steady State Assumption 2009 56 133
Merged estimate 2009 59 136
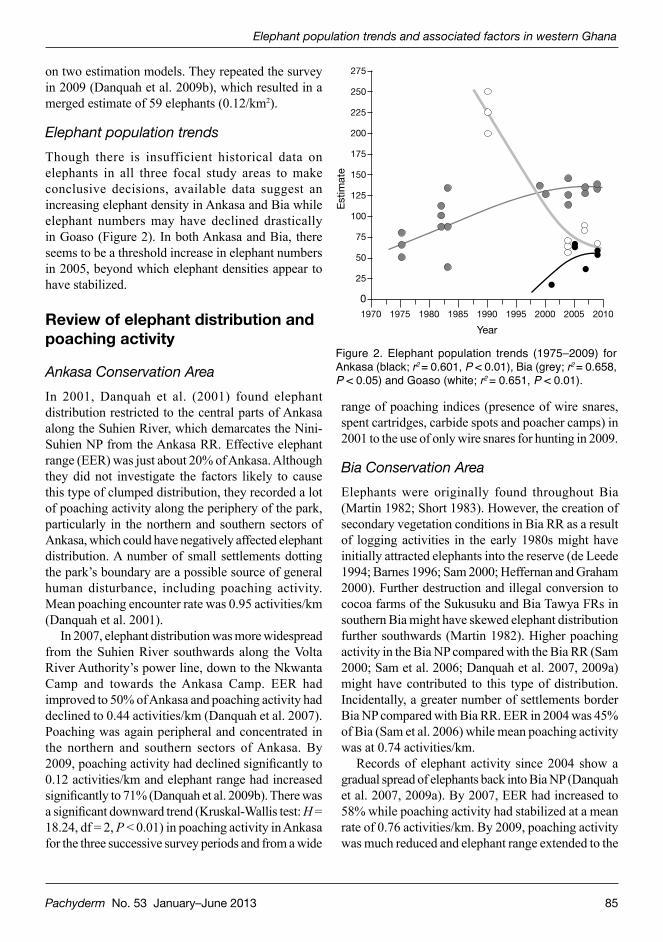
Elephant population trends and associated factors in western Ghana
Pachyderm No. 53 January–June 2013 85
range of poaching indices (presence of wire snares, spent cartridges, carbide spots and poacher camps) in 2001 to the use of only wire snares for hunting in 2009.
Bia Conservation AreaElephants were originally found throughout Bia (Martin 1982; Short 1983). However, the creation of secondary vegetation conditions in Bia RR as a result of logging activities in the early 1980s might have initially attracted elephants into the reserve (de Leede 1994; Barnes 1996; Sam 2000; Heffernan and Graham 2000). Further destruction and illegal conversion to cocoa farms of the Sukusuku and Bia Tawya FRs in southern Bia might have skewed elephant distribution further southwards (Martin 1982). Higher poaching activity in the Bia NP compared with the Bia RR (Sam 2000; Sam et al. 2006; Danquah et al. 2007, 2009a) might have contributed to this type of distribution. Incidentally, a greater number of settlements border Bia NP compared with Bia RR. EER in 2004 was 45% of Bia (Sam et al. 2006) while mean poaching activity was at 0.74 activities/km.
Records of elephant activity since 2004 show a gradual spread of elephants back into Bia NP (Danquah et al. 2007, 2009a). By 2007, EER had increased to 58% while poaching activity had stabilized at a mean rate of 0.76 activities/km. By 2009, poaching activity was much reduced and elephant range extended to the
on two estimation models. They repeated the survey in 2009 (Danquah et al. 2009b), which resulted in a merged estimate of 59 elephants (0.12/km2).
Elephant population trendsThough there is insufficient historical data on elephants in all three focal study areas to make conclusive decisions, available data suggest an increasing elephant density in Ankasa and Bia while elephant numbers may have declined drastically in Goaso (Figure 2). In both Ankasa and Bia, there seems to be a threshold increase in elephant numbers in 2005, beyond which elephant densities appear to have stabilized.
Review of elephant distribution and poaching activity
Ankasa Conservation AreaIn 2001, Danquah et al. (2001) found elephant distribution restricted to the central parts of Ankasa along the Suhien River, which demarcates the Nini-Suhien NP from the Ankasa RR. Effective elephant range (EER) was just about 20% of Ankasa. Although they did not investigate the factors likely to cause this type of clumped distribution, they recorded a lot of poaching activity along the periphery of the park, particularly in the northern and southern sectors of Ankasa, which could have negatively affected elephant distribution. A number of small settlements dotting the park’s boundary are a possible source of general human disturbance, including poaching activity. Mean poaching encounter rate was 0.95 activities/km (Danquah et al. 2001).
In 2007, elephant distribution was more widespread from the Suhien River southwards along the Volta River Authority’s power line, down to the Nkwanta Camp and towards the Ankasa Camp. EER had improved to 50% of Ankasa and poaching activity had declined to 0.44 activities/km (Danquah et al. 2007). Poaching was again peripheral and concentrated in the northern and southern sectors of Ankasa. By 2009, poaching activity had declined significantly to 0.12 activities/km and elephant range had increased significantly to 71% (Danquah et al. 2009b). There was a significant downward trend (Kruskal-Wallis test: H = 18.24, df = 2, P < 0.01) in poaching activity in Ankasa for the three successive survey periods and from a wide
1970
0
25
50
75
100
125
150
175
200
225
250
275
1975 1980 1985 1990
YearE
stim
ate
1995 2000 2005 2010
Figure 2. Elephant population trends (1975–2009) for Ankasa (black; r2 = 0.601, P < 0.01), Bia (grey; r2 = 0.658, P < 0.05) and Goaso (white; r2 = 0.651, P < 0.01).
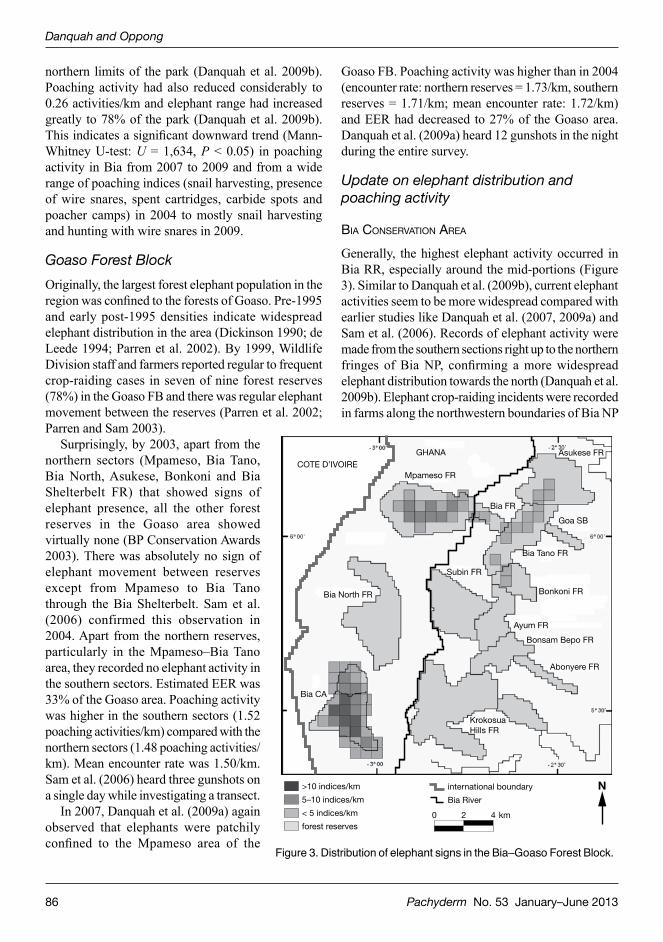
Danquah and Oppong
86 Pachyderm No. 53 January–June 2013
northern limits of the park (Danquah et al. 2009b). Poaching activity had also reduced considerably to 0.26 activities/km and elephant range had increased greatly to 78% of the park (Danquah et al. 2009b). This indicates a significant downward trend (Mann-Whitney U-test: U = 1,634, P < 0.05) in poaching activity in Bia from 2007 to 2009 and from a wide range of poaching indices (snail harvesting, presence of wire snares, spent cartridges, carbide spots and poacher camps) in 2004 to mostly snail harvesting and hunting with wire snares in 2009.
Goaso Forest BlockOriginally, the largest forest elephant population in the region was confined to the forests of Goaso. Pre-1995 and early post-1995 densities indicate widespread elephant distribution in the area (Dickinson 1990; de Leede 1994; Parren et al. 2002). By 1999, Wildlife Division staff and farmers reported regular to frequent crop-raiding cases in seven of nine forest reserves (78%) in the Goaso FB and there was regular elephant movement between the reserves (Parren et al. 2002; Parren and Sam 2003).
Surprisingly, by 2003, apart from the northern sectors (Mpameso, Bia Tano, Bia North, Asukese, Bonkoni and Bia Shelterbelt FR) that showed signs of elephant presence, all the other forest reserves in the Goaso area showed virtually none (BP Conservation Awards 2003). There was absolutely no sign of elephant movement between reserves except from Mpameso to Bia Tano through the Bia Shelterbelt. Sam et al. (2006) confirmed this observation in 2004. Apart from the northern reserves, particularly in the Mpameso–Bia Tano area, they recorded no elephant activity in the southern sectors. Estimated EER was 33% of the Goaso area. Poaching activity was higher in the southern sectors (1.52 poaching activities/km) compared with the northern sectors (1.48 poaching activities/km). Mean encounter rate was 1.50/km. Sam et al. (2006) heard three gunshots on a single day while investigating a transect.
In 2007, Danquah et al. (2009a) again observed that elephants were patchily confined to the Mpameso area of the
Goaso FB. Poaching activity was higher than in 2004 (encounter rate: northern reserves = 1.73/km, southern reserves = 1.71/km; mean encounter rate: 1.72/km) and EER had decreased to 27% of the Goaso area. Danquah et al. (2009a) heard 12 gunshots in the night during the entire survey.
Update on elephant distribution and poaching activity
bia conServation area
Generally, the highest elephant activity occurred in Bia RR, especially around the mid-portions (Figure 3). Similar to Danquah et al. (2009b), current elephant activities seem to be more widespread compared with earlier studies like Danquah et al. (2007, 2009a) and Sam et al. (2006). Records of elephant activity were made from the southern sections right up to the northern fringes of Bia NP, confirming a more widespread elephant distribution towards the north (Danquah et al. 2009b). Elephant crop-raiding incidents were recorded in farms along the northwestern boundaries of Bia NP
Figure 3. Distribution of elephant signs in the Bia–Goaso Forest Block.
Bia North FR
Subin FR
Mpameso FR
GHANACOTE D’IVOIRE
Bia FR
Asukese FR
Goa SB
Bia Tano FR
Bonkoni FR
Ayum FR
Bonsam Bepo FR
Abonyere FR
KrokosuaHills FR
Bia CA
>10 indices/km
5–10 indices/km
< 5 indices/km
forest reserves
international boundary
Bia River
N
0 2 4 km
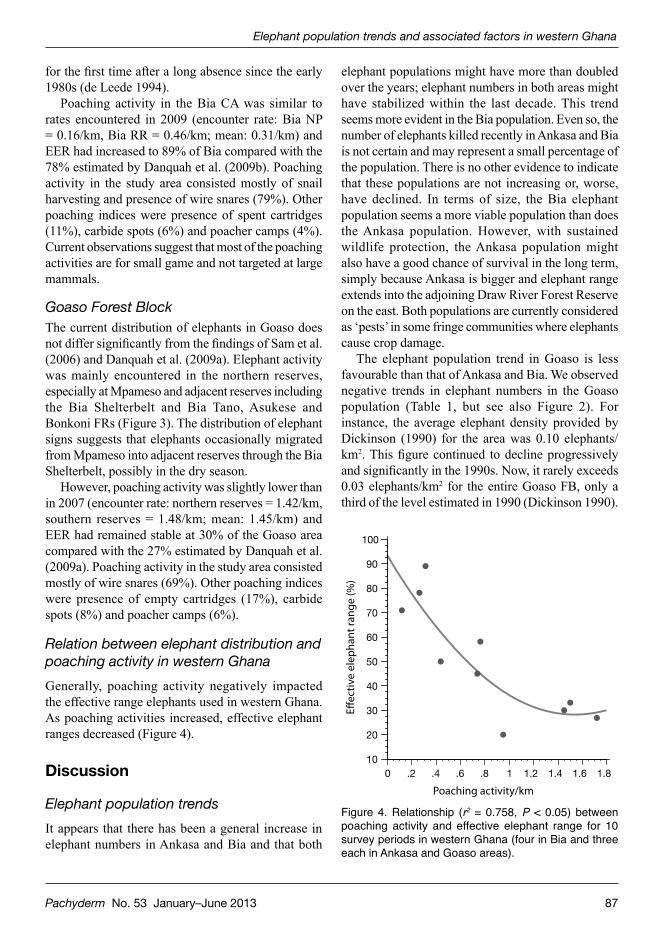
Elephant population trends and associated factors in western Ghana
Pachyderm No. 53 January–June 2013 87
for the first time after a long absence since the early 1980s (de Leede 1994).
Poaching activity in the Bia CA was similar to rates encountered in 2009 (encounter rate: Bia NP = 0.16/km, Bia RR = 0.46/km; mean: 0.31/km) and EER had increased to 89% of Bia compared with the 78% estimated by Danquah et al. (2009b). Poaching activity in the study area consisted mostly of snail harvesting and presence of wire snares (79%). Other poaching indices were presence of spent cartridges (11%), carbide spots (6%) and poacher camps (4%). Current observations suggest that most of the poaching activities are for small game and not targeted at large mammals.
Goaso Forest BlockThe current distribution of elephants in Goaso does not differ significantly from the findings of Sam et al. (2006) and Danquah et al. (2009a). Elephant activity was mainly encountered in the northern reserves, especially at Mpameso and adjacent reserves including the Bia Shelterbelt and Bia Tano, Asukese and Bonkoni FRs (Figure 3). The distribution of elephant signs suggests that elephants occasionally migrated from Mpameso into adjacent reserves through the Bia Shelterbelt, possibly in the dry season.
However, poaching activity was slightly lower than in 2007 (encounter rate: northern reserves = 1.42/km, southern reserves = 1.48/km; mean: 1.45/km) and EER had remained stable at 30% of the Goaso area compared with the 27% estimated by Danquah et al. (2009a). Poaching activity in the study area consisted mostly of wire snares (69%). Other poaching indices were presence of empty cartridges (17%), carbide spots (8%) and poacher camps (6%).
Relation between elephant distribution and poaching activity in western GhanaGenerally, poaching activity negatively impacted the effective range elephants used in western Ghana. As poaching activities increased, effective elephant ranges decreased (Figure 4).
Discussion
Elephant population trendsIt appears that there has been a general increase in elephant numbers in Ankasa and Bia and that both
elephant populations might have more than doubled over the years; elephant numbers in both areas might have stabilized within the last decade. This trend seems more evident in the Bia population. Even so, the number of elephants killed recently in Ankasa and Bia is not certain and may represent a small percentage of the population. There is no other evidence to indicate that these populations are not increasing or, worse, have declined. In terms of size, the Bia elephant population seems a more viable population than does the Ankasa population. However, with sustained wildlife protection, the Ankasa population might also have a good chance of survival in the long term, simply because Ankasa is bigger and elephant range extends into the adjoining Draw River Forest Reserve on the east. Both populations are currently considered as ‘pests’ in some fringe communities where elephants cause crop damage.
The elephant population trend in Goaso is less favourable than that of Ankasa and Bia. We observed negative trends in elephant numbers in the Goaso population (Table 1, but see also Figure 2). For instance, the average elephant density provided by Dickinson (1990) for the area was 0.10 elephants/km2. This figure continued to decline progressively and significantly in the 1990s. Now, it rarely exceeds 0.03 elephants/km2 for the entire Goaso FB, only a third of the level estimated in 1990 (Dickinson 1990).
10
20
30
40
50
60
70
80
90
100
E�ec
tive
elep
hant
rang
e (%
)
0 .2 .4 .6 .8 1 1.2 1.4 1.6 1.8
Poaching activity/km
Figure 4. Relationship (r2 = 0.758, P < 0.05) between poaching activity and effective elephant range for 10 survey periods in western Ghana (four in Bia and three each in Ankasa and Goaso areas).
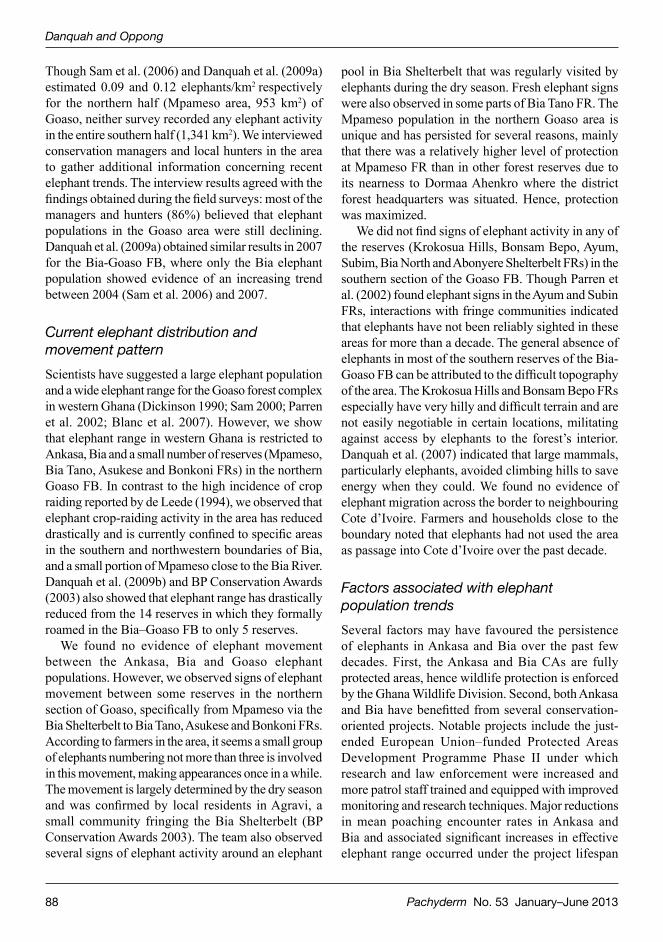
Danquah and Oppong
88 Pachyderm No. 53 January–June 2013
Though Sam et al. (2006) and Danquah et al. (2009a) estimated 0.09 and 0.12 elephants/km2 respectively for the northern half (Mpameso area, 953 km2) of Goaso, neither survey recorded any elephant activity in the entire southern half (1,341 km2). We interviewed conservation managers and local hunters in the area to gather additional information concerning recent elephant trends. The interview results agreed with the findings obtained during the field surveys: most of the managers and hunters (86%) believed that elephant populations in the Goaso area were still declining. Danquah et al. (2009a) obtained similar results in 2007 for the Bia-Goaso FB, where only the Bia elephant population showed evidence of an increasing trend between 2004 (Sam et al. 2006) and 2007.
Current elephant distribution and movement patternScientists have suggested a large elephant population and a wide elephant range for the Goaso forest complex in western Ghana (Dickinson 1990; Sam 2000; Parren et al. 2002; Blanc et al. 2007). However, we show that elephant range in western Ghana is restricted to Ankasa, Bia and a small number of reserves (Mpameso, Bia Tano, Asukese and Bonkoni FRs) in the northern Goaso FB. In contrast to the high incidence of crop raiding reported by de Leede (1994), we observed that elephant crop-raiding activity in the area has reduced drastically and is currently confined to specific areas in the southern and northwestern boundaries of Bia, and a small portion of Mpameso close to the Bia River. Danquah et al. (2009b) and BP Conservation Awards (2003) also showed that elephant range has drastically reduced from the 14 reserves in which they formally roamed in the Bia–Goaso FB to only 5 reserves.
We found no evidence of elephant movement between the Ankasa, Bia and Goaso elephant populations. However, we observed signs of elephant movement between some reserves in the northern section of Goaso, specifically from Mpameso via the Bia Shelterbelt to Bia Tano, Asukese and Bonkoni FRs. According to farmers in the area, it seems a small group of elephants numbering not more than three is involved in this movement, making appearances once in a while. The movement is largely determined by the dry season and was confirmed by local residents in Agravi, a small community fringing the Bia Shelterbelt (BP Conservation Awards 2003). The team also observed several signs of elephant activity around an elephant
pool in Bia Shelterbelt that was regularly visited by elephants during the dry season. Fresh elephant signs were also observed in some parts of Bia Tano FR. The Mpameso population in the northern Goaso area is unique and has persisted for several reasons, mainly that there was a relatively higher level of protection at Mpameso FR than in other forest reserves due to its nearness to Dormaa Ahenkro where the district forest headquarters was situated. Hence, protection was maximized.
We did not find signs of elephant activity in any of the reserves (Krokosua Hills, Bonsam Bepo, Ayum, Subim, Bia North and Abonyere Shelterbelt FRs) in the southern section of the Goaso FB. Though Parren et al. (2002) found elephant signs in the Ayum and Subin FRs, interactions with fringe communities indicated that elephants have not been reliably sighted in these areas for more than a decade. The general absence of elephants in most of the southern reserves of the Bia-Goaso FB can be attributed to the difficult topography of the area. The Krokosua Hills and Bonsam Bepo FRs especially have very hilly and difficult terrain and are not easily negotiable in certain locations, militating against access by elephants to the forest’s interior. Danquah et al. (2007) indicated that large mammals, particularly elephants, avoided climbing hills to save energy when they could. We found no evidence of elephant migration across the border to neighbouring Cote d’Ivoire. Farmers and households close to the boundary noted that elephants had not used the area as passage into Cote d’Ivoire over the past decade.
Factors associated with elephant population trendsSeveral factors may have favoured the persistence of elephants in Ankasa and Bia over the past few decades. First, the Ankasa and Bia CAs are fully protected areas, hence wildlife protection is enforced by the Ghana Wildlife Division. Second, both Ankasa and Bia have benefitted from several conservation-oriented projects. Notable projects include the just-ended European Union–funded Protected Areas Development Programme Phase II under which research and law enforcement were increased and more patrol staff trained and equipped with improved monitoring and research techniques. Major reductions in mean poaching encounter rates in Ankasa and Bia and associated significant increases in effective elephant range occurred under the project lifespan

Elephant population trends and associated factors in western Ghana
Pachyderm No. 53 January–June 2013 89
from 2006 to 2009 (Danquah et al. 2007, 2009a,b). Hence, both elephant populations seem to have recovered best in these reserves in which improved wildlife management strategies were applied regularly and simultaneously. It is difficult to explain why the significant increases in elephant range for the period did not result in corresponding increases in elephant numbers. Increased random elephant movements arising from decreased human disturbance are more likely to have increased elephant range than are increased population numbers because it is doubtful if elephant numbers could have increased tremendously in less than four years.
The Goaso range of reserves is managed by the Ghana Forestry Division, which does not focus on conserving wildlife. Thus the area has not benefitted from any major wildlife conservation-related projects as most of the management priorities are directed at sustaining logging regimes. The area has also not benefitted from any major wildlife conservation-related project. Moreover, more than a decade of excessive commercial hunting in the 1990s has severely reduced the populations of elephants and several other large mammals. Recent confirmed reports (Sam et al. 2006; Danquah et al. 2009b) as well as observations by naturalists and Wildlife Division staff give substantial indications that there have been massive declines in both elephant numbers and range, especially over the past decade, primarily as a result of illegal hunting for ivory. Reports from the field indicate that elephant poaching in the area is fuelled by professional elephant hunters from nearby Cote d’Ivoire, who easily transport the ivory across the border. Most large mammal species have not been reliably observed for several years, and this is suspected to reflect population changes, resulting from high hunting pressure (Danquah et al. 2009b).
However, the principal threat in Goaso, which could have led the transition of elephants from highly abundant animals to their generally threatened and vulnerable status, is loss of range and habitat as a result of rapidly increasing human populations. The beginning of 1990 witnessed a massive acceleration of migrants, mainly farmers from other regions in Ghana to the high forest zone in western Ghana (Sam 2000). The boom in Ghana’s timber and cocoa industry in the 1990s exacerbated the situation and contributed to severe encroachment on elephant habitat with major recorded decreases in effective elephant range and numbers. For this period, forest cover decreased by
4.53%. The rate of forest loss was estimated to be 326.23 ha per annum. The size of the degraded or open area increased by 18.95%. Current satellite images combined with ground investigations indicate few forests remaining outside the reserves as much of the original vegetation has been converted to agriculture and urban expansion. Currently, many villages and hamlets are scattered throughout the whole area.
From this discussion, it is possible to identify three broad objectives for elephant conservation in the high forest zone of western Ghana. First, it is clearly necessary to establish a long-term programme for monitoring elephant abundance and trends on a large scale. Second, the conservation and restoration of degraded forests should be a priority for stabilizing and maintaining existing healthy elephant populations. Finally, despite the lack of extensive experimental evidence, management activities aimed at decreasing poaching activity and increasing the quantity and quality of both refuge and food should continue to be implemented.
AcknowledgementsWe acknowledge the United States Fish and Wildlife Service’s Division for International Conservation, Protected Areas Development Program Phase II and A Rocha Ghana for providing funds to conduct the various elephant studies we used in our review. Special thanks go to the management of the Ghana Wildlife Division and Forestry Division for providing logistics and granting permission to work within the reserves.
The study would not have been possible without the contributions of the field team. We thank Phil Marshall and Moses Kofi Sam for their technical advice.
ReferencesBarnes RFW. 1996. Estimating forest elephant abundance
by dung counts. In: Kangwana K, editor. Studying elephants. AWF Handbook no. 7. African Wildlife Foundation, Nairobi.
Battersby JE, Greenwood JJD. 2004. Monitoring terrestrial mammals in the UK: past, present and future, using lessons from the bird world. Mammal Review 34:3–29.
Blanc JJ, Barnes RFW, Craig GC, Dublin HT, Thouless CR, Douglas-Hamilton I, Hart J. 2007. African elephant status report 2007: an update from the African Elephant Database. Occasional Paper Series,

Danquah and Oppong
90 Pachyderm No. 53 January–June 2013
IUCN Species Survival Commission, no. 33. IUCN/SSC African Elephant Specialist Group. IUCN, Gland, Switzerland. vi + 276 pp.
BP Conservation Awards. 2003. Survey of elephant movement and corridor issues in western Ghana and eastern Cote d’ Ivoire. Technical report submitted by the Faculty of Renewable Natural Resources, KNUST, to the BP Conservation Programme.
Danquah E, Boafo Y, Dubiure UF, Nandjui A, Hema EM, Amofah Appiah M. 2001. Elephant census in the Ankasa Conservation Area in south-western Ghana. Pachyderm 31:63–69.
Danquah E, Sam MK, Marshal P. 2007. A survey of large mammals of the Ankasa and Bia Conservation Areas. Technical report submitted to EU/WD Protected Areas Development Programme Phase II Project.
Danquah E, Sam MK, Marshal P. 2009a. Monitoring matters: a survey of large mammals of the Ankasa and Bia Conservation Areas. Technical report submitted to EU/WD Protected Areas Development Programme Phase II Project.
Danquah E, Sam MK, Akom E, Appiah-Kubi SK, Ayiku T. 2009b. Elephant conservation and possibilities of creating corridors in western Ghana. Project AFE-0348. Technical report submitted by A Rocha Ghana to African Elephant Conservation Fund of the US Fish and Wildlife Service.
de Leede BM. 1994. Feasibility study on the establishment of corridors for forest elephants (Loxodonta africana cyclotis, Matschie) between forest reserves in western Ghana and eastern Cote d’Ivoire. Unpublished report.
Dickinson B. 1990. An estimation of population density of forest elephant (Loxodonta africana cyclotis, Matschie) in Bia Tano and Subin Forest Reserves, Brong Ahafo Region, Ghana. Game and Wildlife Department, Accra, Ghana. Unpublished report.
[FC] Forestry Commission, Ghana. 2005. Monitoring law enforcement, illegal activity and wildlife trends in six protected areas. An evaluation 2004–2005. Report to the Netherlands Development Organization (SNV). Unpublished.
Hall JB, Swaine MD. 1981. Distribution and ecology of vascular plants in tropical rainforest forest: forest vegetation in Ghana. Junk, The Hague.
Hawthorne W, Musah J. 1993. Forest protection in Ghana. ODA and Forest Inventory and Management Project Planning Branch, Forestry Department, Kumasi, Ghana.
Heffernan PJ, Graham NAJ. 2000. Bia elephant census, Ghana. Report I. Elephant census. University of Newcastle, UK. Unpublished.
Martin C. 1982. Management plan for the Bia Conservation Area. General part (1). Final report IUCN/WWF Project 1251. Wildlife & National Parks Division, Ghana Forestry Committee. Unpublished.
Norton-Griffiths M. 1978. Counting animals. African Wildlife Foundation, Nairobi.
[PADP] Protected Area Development Programme. 2000. Ankasa CA management plan. Ghana Wildlife Division, Accra.
[PADP] Protected Area Development Programme. 2001. Bia CA management plan. Ghana Wildlife Division, Accra.
Parren MPE, de Leede BM, Bongers F. 2002. A proposal for a transnational forest network area for elephants in Cote d’Ivoire and Ghana. Oryx 36:249–256
Parren MPE, Sam MK. 2003. Elephant corridor creation and local livelihood improvement in West Africa. Paper presented at the International Conference on Rural Livelihoods, Forests and Biodiversity, 19–23 May 2003, Bonn, Germany.
Sam MK. 2000. The distribution of elephants in relation to crop damage around Bia Conservation Area during the 1999 rainy season. Report for IUCN (World Conservation Union), Gland, Switzerland.
Sam MK, Danquah E, Oppong SK, Bosu ED. 2006. Elephant survey in the Bia Conservation Area, western Ghana. Pachyderm 40:42–50.
Short JC. 1983. Density and seasonal movements of the forest elephant (Loxodonta africana cyclotis, Matschie) in Bia National Park, Ghana. African Journal of Ecology 21:175–184.
Sikes SK. 1975. Report on preliminary elephant population survey in Bia National Park. Unpublished.
Taylor CJ. 1960. Synecology and silviculture in Ghana. Nelson and Sons Publ., Edinburgh. pp. 240–360.
Pachyderm No. 53 January–June 2013 91
Systems approach towards surface water distribution in South Africa
Systems approach towards surface water distribution in Kruger National Park, South AfricaIzak PJ Smit
Scientific Services, South African National Parks, Skukuza, South Africaemail: [email protected]
AbstractThere was concerted effort, especially between the 1960s and 1990s, to increase the distribution of surface water in Kruger National Park (KNP). As a consequence, most of the park was within easy walking distance of a permanent water source for large, mobile herbivores during the peak of the water-for-game programme. This situation was unnatural and led to various unintended ecological effects. In reaction to this and in response to changing conservation and management paradigms, the water provision policy was revised in 1997. Since the policy change, about two-thirds of the more than 300 boreholes have been closed and many catchment dams have been breached in an ongoing process. This new approach towards water provision has a strong spatial focus and aims to recreate and mimic a more natural mosaic of spatio-temporal variability in surface water availability. KNP managers hope that the change in water provision will induce spatial and temporal variation in how elephants utilize landscapes, which is a key objective of the current KNP Elephant Management Plan. Although it seems unlikely that the reduced availability of water has had any numerical effects on the elephant population thus far, it did induce some spatial changes: elephants are now even more strongly attracted to the large river systems than before. More research is needed to ascertain whether surface water manipulation in KNP, where water is naturally relatively widely distributed, is effective in creating spatio-temporal refugia for biodiversity that are sensitive towards elephant impacts.
RésuméL’on a vu des efforts concertés, surtout entre les années 1960 et 1990, d’augmenter la distribution de l’eau de surface dans le Parc National Kruger (PNK). En conséquence, la plus grande partie du parc se trouvait à une courte distance de marche d’une source d’eau permanente pour les grands herbivores mobiles lors du pic du programme de l’eau-pour-la-faune. Cette situation était anormale et a conduit à divers effets écologiques inattendus. En réaction à cela et en réponse à l’évolution des paradigmes de conservation et de gestion, la politique d’approvisionnement en eau a été révisée en 1997. Depuis le changement de politique, environ deux tiers des plus de 300 forages ont été fermés et de nombreux barrages de captage percés dans un processus continu. Cette nouvelle approche d’approvisionnement en eau a une forte concentration spatiale et vise à recréer et à imiter une mosaïque plus naturelle de variabilité spatio-temporelle de la disponibilité en eau de surface. Les gestionnaires du PNK espèrent que la variation de l’approvisionnement en eau va induire des variations spatiales et temporelles dans la façon dont les éléphants utilisent les paysages, ce qui est un objectif clé du plan actuel de gestion des éléphants du PNK. Bien qu’il semble peu probable que la disponibilité réduite de l’eau ait eu des effets numériques sur la population des éléphants à ce jour, elle a induit quelques changements
MANAGEMENT

92 Pachyderm No. 53 January–June 2013
Izak
History of artificial water provision in Kruger National Park Artificial water sources in Kruger National Park (KNP) consist of borehole-fed water points and constructed catchment dams in ephemeral rivers. These were introduced from as early as 1911, but a concerted effort was made, especially in the 1960s, when a dry cycle occurred just as the western boundary fence was completed. Initially the water provision programme was primarily intended to stabilize existing water, supply water where water supposedly previously existed and provide water during periods of severe droughts (Pienaar 1970). This was further amplified by the perception that the lowveld was experiencing progressive desiccation (Pienaar 1985). However, by 1995, 365 boreholes and about 50 earth dams had been constructed throughout the park, leaving less than 20% of the park farther than 5 km from permanent water during a severe drought (Gaylard et al. 2003). This was clearly an unnatural situation.
Revision of water provision policyDuring the 1980s and early 1990s, it became evident that the wide distribution of artificial water sources in KNP and surrounding parks had various ecological effects. These effects included elevated starvation-induced mortality of herbivores due to wide-scale overgrazing during severe droughts (Walker et al. 1987), altered herbivore distribution patterns (Smit et al. 2007a), changed predation patterns with detrimental effects on the rare antelope (Harrington et al. 1999; Owen-Smith and Mills 2006), as well as effects on woody vegetation structure (Brits et al. 2002) and her-baceous species composition (Parker and Witkowski 1999). These unnatural effects of water provision together with the change in paradigm for KNP from a nature-in-balance management approach towards a nature-evolving approach (Grant et al. 2002; du Toit et al. 2003) led to a revision of the water provision policy in 1997 (Pienaar et al. 1997). The revision of the policy paved the way for the closure of numerous boreholes
and the breaching and rehabilitation of various catch-ment dams. This process of reducing and manipulating the distribution of artificial waterholes is still ongoing as capacity and funding allows, as new phases are rolled out and as decisions are revised through the adaptive management process (see Figure 1 for the historical and current distribution of boreholes).
0 25 50 0
N
100 km
closed
Status of boreholes (2012)
open
perennial rivers
large seasonal rivers
Figure 1. Distribution of borehole-fed artificial waterholes in Kruger National Park in the early 1990s (grey and black dots combined) and 2012 (black dots only). Note how the boreholes have been reduced to about a third of their historical extent.
spatiaux: les éléphants sont encore plus fortement attirés par les grands systèmes fluviaux qu’auparavant. Il faut plus de recherche pour déterminer si la manipulation des eaux de surface dans le PNK où l’eau est assez largement distribué naturellement, est efficace dans la création de refuges spatio-temporels de la biodiversité sensibles aux impacts des éléphants.
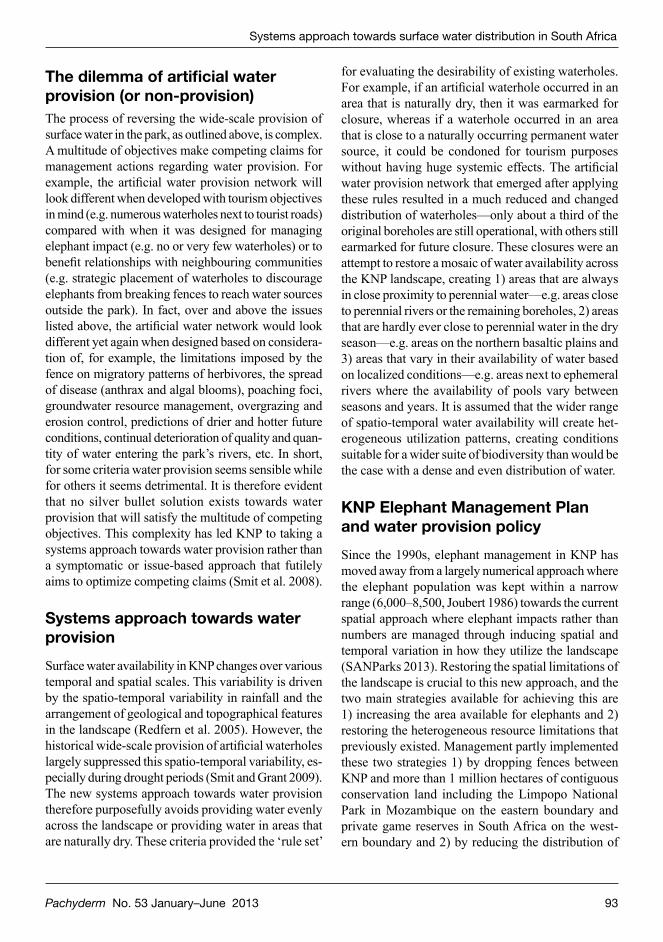
Pachyderm No. 53 January–June 2013 93
Systems approach towards surface water distribution in South Africa
The dilemma of artificial water provision (or non-provision)The process of reversing the wide-scale provision of surface water in the park, as outlined above, is complex. A multitude of objectives make competing claims for management actions regarding water provision. For example, the artificial water provision network will look different when developed with tourism objectives in mind (e.g. numerous waterholes next to tourist roads) compared with when it was designed for managing elephant impact (e.g. no or very few waterholes) or to benefit relationships with neighbouring communities (e.g. strategic placement of waterholes to discourage elephants from breaking fences to reach water sources outside the park). In fact, over and above the issues listed above, the artificial water network would look different yet again when designed based on considera-tion of, for example, the limitations imposed by the fence on migratory patterns of herbivores, the spread of disease (anthrax and algal blooms), poaching foci, groundwater resource management, overgrazing and erosion control, predictions of drier and hotter future conditions, continual deterioration of quality and quan-tity of water entering the park’s rivers, etc. In short, for some criteria water provision seems sensible while for others it seems detrimental. It is therefore evident that no silver bullet solution exists towards water provision that will satisfy the multitude of competing objectives. This complexity has led KNP to taking a systems approach towards water provision rather than a symptomatic or issue-based approach that futilely aims to optimize competing claims (Smit et al. 2008).
Systems approach towards water provisionSurface water availability in KNP changes over various temporal and spatial scales. This variability is driven by the spatio-temporal variability in rainfall and the arrangement of geological and topographical features in the landscape (Redfern et al. 2005). However, the historical wide-scale provision of artificial waterholes largely suppressed this spatio-temporal variability, es-pecially during drought periods (Smit and Grant 2009). The new systems approach towards water provision therefore purposefully avoids providing water evenly across the landscape or providing water in areas that are naturally dry. These criteria provided the ‘rule set’
for evaluating the desirability of existing waterholes. For example, if an artificial waterhole occurred in an area that is naturally dry, then it was earmarked for closure, whereas if a waterhole occurred in an area that is close to a naturally occurring permanent water source, it could be condoned for tourism purposes without having huge systemic effects. The artificial water provision network that emerged after applying these rules resulted in a much reduced and changed distribution of waterholes—only about a third of the original boreholes are still operational, with others still earmarked for future closure. These closures were an attempt to restore a mosaic of water availability across the KNP landscape, creating 1) areas that are always in close proximity to perennial water—e.g. areas close to perennial rivers or the remaining boreholes, 2) areas that are hardly ever close to perennial water in the dry season—e.g. areas on the northern basaltic plains and 3) areas that vary in their availability of water based on localized conditions—e.g. areas next to ephemeral rivers where the availability of pools vary between seasons and years. It is assumed that the wider range of spatio-temporal water availability will create het-erogeneous utilization patterns, creating conditions suitable for a wider suite of biodiversity than would be the case with a dense and even distribution of water.
KNP Elephant Management Plan and water provision policySince the 1990s, elephant management in KNP has moved away from a largely numerical approach where the elephant population was kept within a narrow range (6,000–8,500, Joubert 1986) towards the current spatial approach where elephant impacts rather than numbers are managed through inducing spatial and temporal variation in how they utilize the landscape (SANParks 2013). Restoring the spatial limitations of the landscape is crucial to this new approach, and the two main strategies available for achieving this are 1) increasing the area available for elephants and 2) restoring the heterogeneous resource limitations that previously existed. Management partly implemented these two strategies 1) by dropping fences between KNP and more than 1 million hectares of contiguous conservation land including the Limpopo National Park in Mozambique on the eastern boundary and private game reserves in South Africa on the west-ern boundary and 2) by reducing the distribution of

94 Pachyderm No. 53 January–June 2013
Izak
numerical effect on the park’s elephant population (Figure 2). It can be argued that this may be due to the fact that elephants in KNP have not yet experi-enced water limitations after waterhole closure. At regional scales, however, numerical responses vary considerably (SANParks unpublished data), some of which may reflect responses to resource availability at regional scales. It is likely that the effect of closing waterholes will only become evident during a severe drought and allowing the elephant population to respond following the release from culling pressure.
Although the closure of waterholes did not induce noticeable park-wide numerical effects after 15 years of extensive waterhole closure, there is some evidence suggesting spatial responses (Figure 3). Localized dry season elephant densities have increased disproportionally around large perennial rivers and large seasonal rivers compared with smaller streams and areas far removed from rivers where localized densities have shown only limited changes (Smit and Ferreira 2010). It is therefore suggested that dry season utilization patterns have intensified around most large rivers in recent years in response to the closure of artificial water sources and the moratorium on culling.
artificial waterholes. This approach resulted in larger areas for elephants to roam with a wider range of surface water availability. These changes should result in increased spatio-temporal variability in elephant distribution and impact.
It is important to note that the process of restoring the natural variability in water availability was not introduced specifically for achieving elephant management objectives. In fact, the elephant and the water provision management plans converged because both subscribed to a broader systems approach philosophy. As such, the new systems approach towards artificial water provision in KNP provides an important tool in the multipronged approach towards achieving the objectives as set out in the KNP Elephant management plan (SANParks 2013).
Numerical and spatial responses of elephants to closure of artificial water pointsThe closure of more than two-thirds of KNP’s bore-holes and the breaching of various artificial dams since the 1990s did not have any noticeable short-term
6,000
7,000
8,000
9,000
10,000
11,000
12,000
13,000
14,000
15,000
16,000
1970
1972
1974
1976
1978
1980
1982
1984
1986
1988
1990
1992
1994
1996
1998
2000
2002
2004
2006
2008
2010
2012
Year
KN
P e
lep
hant
pop
ulat
ion
Moratorium on
large-scale culling
Start of large-scale
closure of arti�cial
water sources
Figure 2. Kruger National Park (KNP) elephant population has not shown a noticeable numerical response at the park level to the wide-scale removal of artificial waterholes after revision of the policy in 1997.
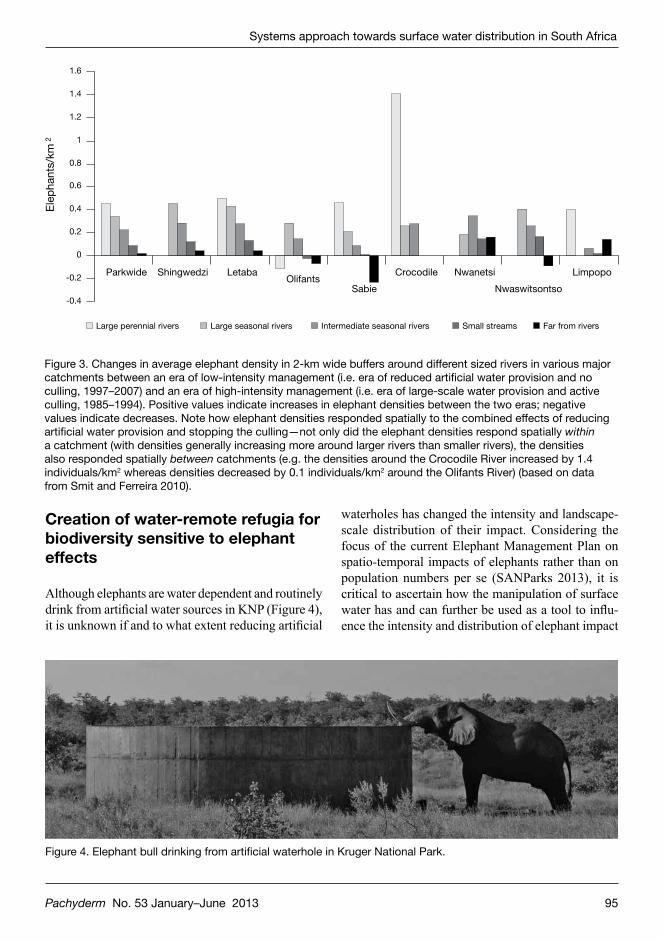
Pachyderm No. 53 January–June 2013 95
Systems approach towards surface water distribution in South Africa
Creation of water-remote refugia for biodiversity sensitive to elephant effects
Although elephants are water dependent and routinely drink from artificial water sources in KNP (Figure 4), it is unknown if and to what extent reducing artificial
waterholes has changed the intensity and landscape-scale distribution of their impact. Considering the focus of the current Elephant Management Plan on spatio-temporal impacts of elephants rather than on population numbers per se (SANParks 2013), it is critical to ascertain how the manipulation of surface water has and can further be used as a tool to influ-ence the intensity and distribution of elephant impact
-0.4
-0.2
0
0.2
0.4
0.6
0.8
1
1.2
1.4
1.6
Parkwide Shingwedzi LetabaOlifants
Sabie
Crocodile Nwanetsi
Nwaswitsontso
Limpopo
Ele
pha
nts/
km
Large perennial rivers Large seasonal rivers Intermediate seasonal rivers Small streams Far from rivers
2
Figure 3. Changes in average elephant density in 2-km wide buffers around different sized rivers in various major catchments between an era of low-intensity management (i.e. era of reduced artificial water provision and no culling, 1997–2007) and an era of high-intensity management (i.e. era of large-scale water provision and active culling, 1985–1994). Positive values indicate increases in elephant densities between the two eras; negative values indicate decreases. Note how elephant densities responded spatially to the combined effects of reducing artificial water provision and stopping the culling—not only did the elephant densities respond spatially within a catchment (with densities generally increasing more around larger rivers than smaller rivers), the densities also responded spatially between catchments (e.g. the densities around the Crocodile River increased by 1.4 individuals/km2 whereas densities decreased by 0.1 individuals/km2 around the Olifants River) (based on data from Smit and Ferreira 2010).
Figure 4. Elephant bull drinking from artificial waterhole in Kruger National Park.
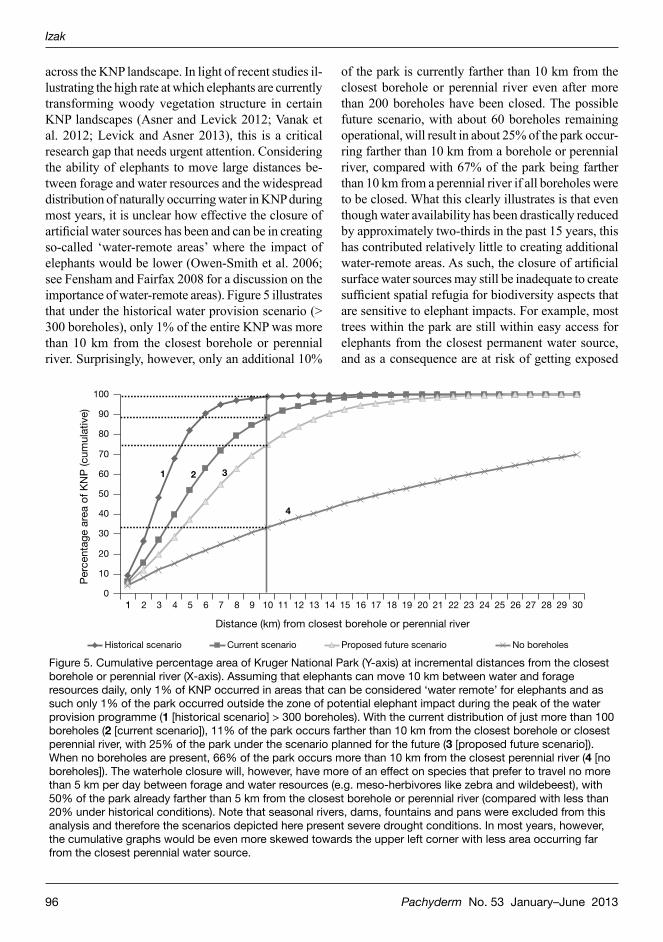
96 Pachyderm No. 53 January–June 2013
Izak
across the KNP landscape. In light of recent studies il-lustrating the high rate at which elephants are currently transforming woody vegetation structure in certain KNP landscapes (Asner and Levick 2012; Vanak et al. 2012; Levick and Asner 2013), this is a critical research gap that needs urgent attention. Considering the ability of elephants to move large distances be-tween forage and water resources and the widespread distribution of naturally occurring water in KNP during most years, it is unclear how effective the closure of artificial water sources has been and can be in creating so-called ‘water-remote areas’ where the impact of elephants would be lower (Owen-Smith et al. 2006; see Fensham and Fairfax 2008 for a discussion on the importance of water-remote areas). Figure 5 illustrates that under the historical water provision scenario (> 300 boreholes), only 1% of the entire KNP was more than 10 km from the closest borehole or perennial river. Surprisingly, however, only an additional 10%
of the park is currently farther than 10 km from the closest borehole or perennial river even after more than 200 boreholes have been closed. The possible future scenario, with about 60 boreholes remaining operational, will result in about 25% of the park occur-ring farther than 10 km from a borehole or perennial river, compared with 67% of the park being farther than 10 km from a perennial river if all boreholes were to be closed. What this clearly illustrates is that even though water availability has been drastically reduced by approximately two-thirds in the past 15 years, this has contributed relatively little to creating additional water-remote areas. As such, the closure of artificial surface water sources may still be inadequate to create sufficient spatial refugia for biodiversity aspects that are sensitive to elephant impacts. For example, most trees within the park are still within easy access for elephants from the closest permanent water source, and as a consequence are at risk of getting exposed
10
10
20
30
40
50
60
70
80
90
100
1 2 3 4 5 6 7 8 9 10 11 12 13 14 15 16 17 18 19 20 21 22 23 24 25 26 27 28 29 30
Distance (km) from closest borehole or perennial river
Per
cent
age
area
of K
NP
(cum
ulat
ive)
Historical scenario Current scenario Proposed future scenario No boreholes
1 2 3
4
Figure 5. Cumulative percentage area of Kruger National Park (Y-axis) at incremental distances from the closest borehole or perennial river (X-axis). Assuming that elephants can move 10 km between water and forage resources daily, only 1% of KNP occurred in areas that can be considered ‘water remote’ for elephants and as such only 1% of the park occurred outside the zone of potential elephant impact during the peak of the water provision programme (1 [historical scenario] > 300 boreholes). With the current distribution of just more than 100 boreholes (2 [current scenario]), 11% of the park occurs farther than 10 km from the closest borehole or closest perennial river, with 25% of the park under the scenario planned for the future (3 [proposed future scenario]). When no boreholes are present, 66% of the park occurs more than 10 km from the closest perennial river (4 [no boreholes]). The waterhole closure will, however, have more of an effect on species that prefer to travel no more than 5 km per day between forage and water resources (e.g. meso-herbivores like zebra and wildebeest), with 50% of the park already farther than 5 km from the closest borehole or perennial river (compared with less than 20% under historical conditions). Note that seasonal rivers, dams, fountains and pans were excluded from this analysis and therefore the scenarios depicted here present severe drought conditions. In most years, however, the cumulative graphs would be even more skewed towards the upper left corner with less area occurring far from the closest perennial water source.

Pachyderm No. 53 January–June 2013 97
Systems approach towards surface water distribution in South Africa
to elephant impact. The influence of surface water manipulation on elephant density, distribution and movement patterns will most likely be significantly smaller in KNP than in systems with a more restricted distribution of natural surface water where artificial waterholes have been shown to exert extensive spatial and demographical responses, e.g. Chobe (Verlinden and Gavor 1998), Hwange (Chamaillé-Jammes et al. 2007a), Etosha (de Beer and van Aarde 2008) and other African savannah parks (Loarie et al. 2009). Care should therefore be taken to have realistic expecta-tions on the influence that Kruger’s management can potentially exert on the park’s elephant density and distribution by ways of manipulating artificial water sources (see debate between Smit et al. 2007b and Chamaillé-Jammes et al. 2007b).
ConclusionsApplying a systems approach philosophy, KNP has since the late 1990s moved away from providing water widely and evenly across the landscape, mov-ing towards a reduced distribution of artificial water sources. The closing of waterholes and the breaching of catchment dams are an ongoing process to mimic the natural variability in surface water availability more closely within the constraints imposed by fences and stakeholder relationships (e.g. tourists, neighbour-ing land-users). It is anticipated that the current water provision scenario induces more spatial and temporal variation in how herbivores utilize the landscape than was the case at the peak of the water-for-game pro-gramme, resulting in a more natural and ultimately more resilient system.
AcknowledgementsSam Ferreira, Freek Venter and Rina Grant, all of South African National Parks, are thanked for inputs to the manuscript.
ReferencesAsner GP, Levick SR. 2012. Landscape-scale effects of
herbivores on treefall in African savannas. Ecology Letters 15:1211–1217. http://onlinelibrary.wiley.com/doi/10.1111/j.1461-0248.2012.01842.x/abstract
Brits J, van Rooyen MW, van Rooyen N. 2002. Ecological impact of large herbivores on the woody vegetation at selected watering points on the eastern basaltic soils in
the Kruger National Park. African Journal of Ecology 40:53–60. http://onlinelibrary.wiley.com/doi/10.1046/j.0141-6707.2001.00344.x/abstract?denied AccessCustomisedMessage=&userIsAuthenticated=false
Chamaillé-Jammes S, Valeix M, Fritz H. 2007a. Managing heterogeneity in elephant distribution: interactions between elephant population density and surface water availability. Journal of Applied Ecology 44:625–633. http://onlinelibrary.wiley.com/doi/10.1111/j.1365-2664.2007.01300.x/full.
Chamaillé-Jammes S, Valeix M, Fritz H. 2007b. Elephant management: why can’t we throw out the babies with the artificial bathwater? Diversity and Distributions 13:663–665. http://onlinelibrary.wiley.com/doi/10.1111/j.1472-4642.2007.00415.x/abstract
de Beer Y, van Aarde RJ. 2008. Do landscape heterogeneity and water distribution explain aspects of elephant home range in southern Africa’s arid savannas? Journal of Arid Environments 72:2017–2025. http://www.sciencedirect.com/science/article/pii/S0140196308001869.
du Toit JT, Rogers KH, Biggs HC. 2003. The Kruger experience: ecology and management of savanna heterogeneity. Island Press, Washington DC.
Fensham RJ, Fairfax RJ. 2008. Water-remoteness for grazing relief in Australian arid-lands. Biological Conservation 141:1447–1460. http://www.sciencedirect.com/science/article/pii/S0006320708001249.
Gaylard A, Owen-Smith N, Redfern J. 2003. Surface water availability: implications for heterogeneity and ecosystem processes. In: du Toit JT, Rogers KH, Biggs HC, editors, The Kruger experience: ecology and management of savanna heterogeneity. Island Press, Washington DC. p. 171–188.
Grant CC, Davidson T, Funston PJ, Pienaar DJ. 2002. Challenges faced in the conservation of rare antelope: a case study on the northern basalt plains of the Kruger National Park. Koedoe 45:45–62. http://www.koedoe.co.za/index.php/koedoe/article/view/26.
Harrington R, Owen-Smith N, Viljoen PC, Biggs HC, Mason DR, Funston P. 1999. Establishing the causes of the roan antelope decline in Kruger National Park, South Africa. Biological Conservation 90:69–78.http://www.sciencedirect.com/science/article/pii/S0006320798001207.
Joubert S. 1986. Masterplan for the management of Kruger National Park. Unpublished internal memo-randum. National Parks Board, Skukuza, South Africa.
98 Pachyderm No. 53 January–June 2013
Izak
Levick SR, Asner GP. 2013. The rate and spatial pattern of treefall in a savanna landscape. Biological Conservation 157:121–127. http://www.sciencedirect.com/science/article/pii/S0006320712003266
Loarie SR, van Aarde RJ, Pimm SL. 2009. Fences and artificial water affect African savannah elephant movement patterns. Biological Conservation 142:3086–3098. http://www.sciencedirect.com/science/article/pii/S0006320709003759.
Owen-Smith N, Kerley GIH, Page B, Slotow R, van Aarde RJ. 2006. A scientific perspective on the management of elephants in Kruger National Park and elsewhere. South African Journal of Science 102:389–394.
Owen-Smith N, Mills MGL. 2006. Manifold interactive influences on the population dynamics of a multispecies ungulate assemblage. Ecological Monographs 76:73–92. http://www.esajournals.org/doi/abs/10.1890/04-1101?journalCode=emon.
Parker AH, Witkowski ETF. 1999. Long-term impacts of abundant perennial water provision for game on herbaceous vegetation in a semi-arid African savanna woodland. Journal of Arid Environments 41:309–321.http://www.sciencedirect.com/science/article/pii/S0140196398904840.
Pienaar DJ, Biggs HC, Deacon A, Gertenbach W, Joubert S, Nel F, van Rooyen L, Venter F. 1997. A revised water distribution policy for biodiversity maintenance in the Kruger National Park. Internal report. South African National Parks, Skukuza, South Africa.
Pienaar UdV. 1970. Water resources of the Kruger Park. African Wildlife 24:180–191.
Pienaar UdV. 1985. Indications of progressive desiccation of the Transvaal lowveld over the past 100 years, and implications for the water stabilization programme in the Kruger National Park. Koedoe 28:93–165.http://www.koedoe.co.za/index.php/koedoe/article/view/540.
Redfern JV, Grant CC, Gaylard A, Getz WM. 2005. Surface water availability and the management of herbivore distributions in an African savanna ecosystem. Journal of Arid Environments 63:406–424. http://www.sciencedirect.com/science/article/pii/S014019630500073X.
[SANParks] South African National Parks. 2013. Elephant management plan, Kruger National Park
2011–2020. South African National Parks, Pretoria, South Africa.
Smit IPJ, Ferreira SM. 2010. Management intervention affects river-bound spatial dynamics of elephants. Biological Conservation 143:2172–2181. http://www.sciencedirect.com/science/article/pii/S0006320710002673
Smit IPJ, Freitag-Ronaldson S, Venter F, Ferreira SM, Grant CC, Pienaar DJ. 2008. Towards a systems approach for artificial water provision in the Kruger National Park. Internal report for conservation management. South African National Parks, Skukuza, South Africa.
Smit IPJ, Grant CC, Devereux BJ. 2007a. Do artificial waterholes influence the way herbivores use the landscape? Herbivore distribution patterns around rivers and artificial surface water sources in a large African savanna park. Biological Conservation 136:85–99. http://www.sciencedirect.com/science/article/pii/S0006320706005039.
Smit IPJ, Grant CC, Whyte IJ. 2007b. Elephants and water provision: what are the management links? Diversity and Distributions 13:666–669. http://onlinelibrary.wiley.com/doi/10.1111/j.1472-4642.2007.00403.x/pdf
Smit IPJ, Grant CC. 2009. Managing surface water in a large semi-arid savanna park: effects on grazer distribution patterns. Journal for Nature Conservation 17:61–71. http://www.sciencedirect.com/science/article/pii/S1617138109000041.
Vanak AT, Shannon G, Thaker M, Page B, Grant R, Slotow R. 2012. Biocomplexity in large tree mortality: interactions between elephant, fire and landscape in an African savanna. Ecography 35:315–321.http://onlinelibrary.wiley.com/doi/10.1111/j.1600-0587.2011.07213.x/abstract.
Verlinden A, Gavor IKN. 1998. Satellite tracking of elephants in northern Botswana. African Journal of Ecology 36:105–116. http://onlinelibrary.wiley.com/doi/10.1046/j.1365-2028.1998.00118.x/abstract.
Walker BH, Emslie RH, Owen-Smith N, Scholes RJ. 1987. To cull or not to cull: lessons from a southern African drought. Journal of Applied Ecology 24:381–401. http://www.jstor.org/discover/10.2307/2403882?uid=3739368&uid=2129&uid=2&uid=70&uid=4&sid=21101865526657.

Field note
Pachyderm No. 53 January–June 2013 99
Participatory survey of elephants (Loxodonta africana) in Kamuku National Park and its environs, northwestern Nigeria TO Amusa,1* JA Ogunjobi,2 SK Halidu,2 IB Likita,2 AR Muraina,3 IJ Fxentirimam3 and AM Gunu3
1 Department of Forest Resources Management, University of Ilorin, Ilorin, Nigeria2 Federal College of Wildlife Management, Forestry Research Institute of Nigeria, New Bussa, Nigeria3 Kamuku National Park, Birnin Gwari, Kaduna State, Nigeria*Corresponding author email: [email protected]
Introduction Kamuku National Park (NP) in Kaduna State, northwestern Nigeria, is one of the few protected elephant ranges in the country. Despite this, no accurate estimate of the elephant population exists for the park. This article reports the first attempt at a rigorous and systematic survey of the Kamuku elephants. The survey was conducted from April 2010 to February 2011, covering both wet and dry seasons. The unique feature of the survey was the adoption of a participatory approach involving all stakeholders, including the local communities, through sensitization, planning meetings, capacity building and conservation education. Participants were informed of the need for a participatory survey of large mammals, and why endangered species must be protected. Emphasis was on using standardized methods so that survey results can be used to monitor changes over time, and analysing whether changes were positive as a result of management interventions or negative as a result of unrestrained anthropogenic and ecological factors. Two methods of elephant census were used: the line transect survey method (Barnes and Jensen 1987; Buckland et al. 2001) and the short-cut or reconnaissance (‘recce’) method (Barnes 1988). These methods effectively involved distance measurements and elephant dung categorization (Hedges and Lawson 2006). A third approach to collecting data was using an interview schedule to obtain information from elders, farmer groups and youths.
Elephant presence in Kamuku National ParkKamuku NP has two ranges: Doka and Dagara. More indices of elephants occurred in the Doka range than in Dagara. Within the Doka range, where open woodland with Isoberlinia spp. is dominant, dung and footprints of elephants were found around Budungu stream. The decay state of the dung piles was within S5 (see Table 1). In the Dagara range, dung and footprints were found within a fadama ground, that is, open woodland with no specific plant species dominating. There the decay state of the dung piles was also within S5. Around villages and farmlands in Gwaska, fresh dung (S1), footprints, trails and other signs of elephant presence were found. Agricultural crops in the farms consisted of guinea corn, maize, cassava, cowpea, rice and groundnut. There were indications of browsing, uprooting and trampling of crops by elephants. The farmlands where elephant indices occurred were very close to River Kumunanu, a major river in the Gwaska area.
Footprint diameters ranged from 0.17 m to 0.49 m. The estimated elephant population for the two ranges was 13 individuals. Analysis of elephant age groups from dung and footprint diameter measurements revealed there were about four to six sub-adults and adults, and two to three young ones. Gwaska, Goron-dutse, Nabango and Kuyambana junction were found to be important migration routes for the Kamuku elephants. Figure 1 shows the geo-referenced areas
FIELD NOTE
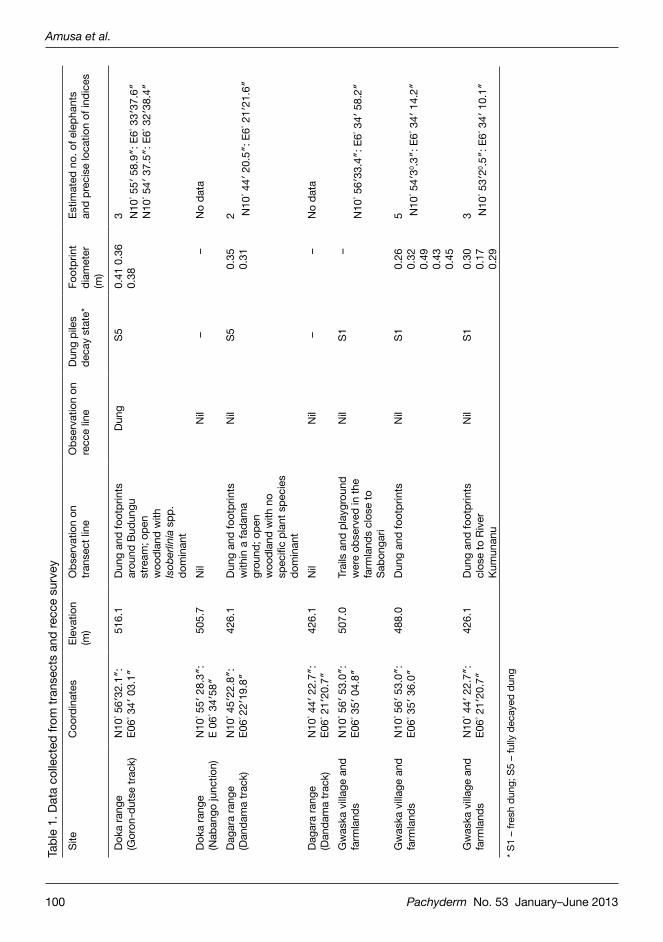
Amusa et al.
100 Pachyderm No. 53 January–June 2013
Tabl
e 1.
Dat
a co
llect
ed fr
om tr
anse
cts
and
recc
e su
rvey
Site
Coo
rdin
ates
Elev
atio
n (m
)O
bser
vatio
n on
tra
nsec
t lin
eO
bser
vatio
n on
re
cce
line
Dung
pile
s de
cay
stat
e*
Foot
prin
t di
amet
er
(m)
Estim
ated
no.
of e
leph
ants
an
d pr
ecis
e lo
catio
n of
indi
ces
Doka
rang
e (G
oron
-dut
se tr
ack)
N10
° 56′
32.1
″:
E06° 3
4′ 0
3.1″
516.
1 Du
ng a
nd fo
otpr
ints
ar
ound
Bud
ungu
st
ream
; ope
n w
oodl
and
with
Is
ober
linia
spp
. do
min
ant
Dung
S50.
41 0
.36
0.
38
3 N10
° 55′
58.
9″: E
6° 33′
37.6
″ N
10° 5
4′ 3
7.5″
: E6° 3
2′38
.4″
Doka
rang
e (N
aban
go ju
nctio
n)N
10° 5
5′ 2
8.3″
: E
06° 3
4′58
″ 50
5.7
Nil
Nil
––
No
data
Daga
ra ra
nge
(Dan
dam
a tra
ck)
N10
° 45′
22.8
″:
E06° 2
2′19
.8″
426.
1Du
ng a
nd fo
otpr
ints
w
ithin
a fa
dam
a gr
ound
; ope
n w
oodl
and
with
no
spec
ific
plan
t spe
cies
do
min
ant
Nil
S50.
35
0.31
2 N10
° 44′
20.
5″: E
6° 21′
21.6
″
Daga
ra ra
nge
(Dan
dam
a tra
ck)
N10
° 44′
22.
7″:
E06° 2
1′20
.7″
426.
1N
ilN
il–
–N
o da
ta
Gw
aska
villa
ge a
nd
farm
land
sN
10° 5
6′ 5
3.0″
: E0
6° 35′
04.
8″
507.
0 Tr
ails
and
pla
ygro
und
wer
e ob
serv
ed in
the
farm
land
s cl
ose
to
Sabo
ngar
i
Nil
S1
–N
10° 5
6′33
.4″:
E6° 3
4′ 5
8.2″
Gw
aska
villa
ge a
nd
farm
land
sN
10° 5
6′ 5
3.0″
: E0
6° 35′
36.
0″
488.
0
Dung
and
foot
prin
tsN
ilS1
0.26
0.
32
0.49
0.
43
0.45
5 N10
° 54′
30 .3″:
E6° 3
4′ 1
4.2″
Gw
aska
villa
ge a
nd
farm
land
sN
10° 4
4′ 2
2.7″
: E0
6° 21′
20.7
″ 42
6.1
Dung
and
foot
prin
ts
clos
e to
Riv
er
Kum
unan
u
Nil
S10.
30
0.17
0.
29
3 N10
° 53′
20 .5″:
E6° 3
4′ 1
0.1″
* S1
– fre
sh d
ung;
S5
– fu
lly d
ecay
ed d
ung
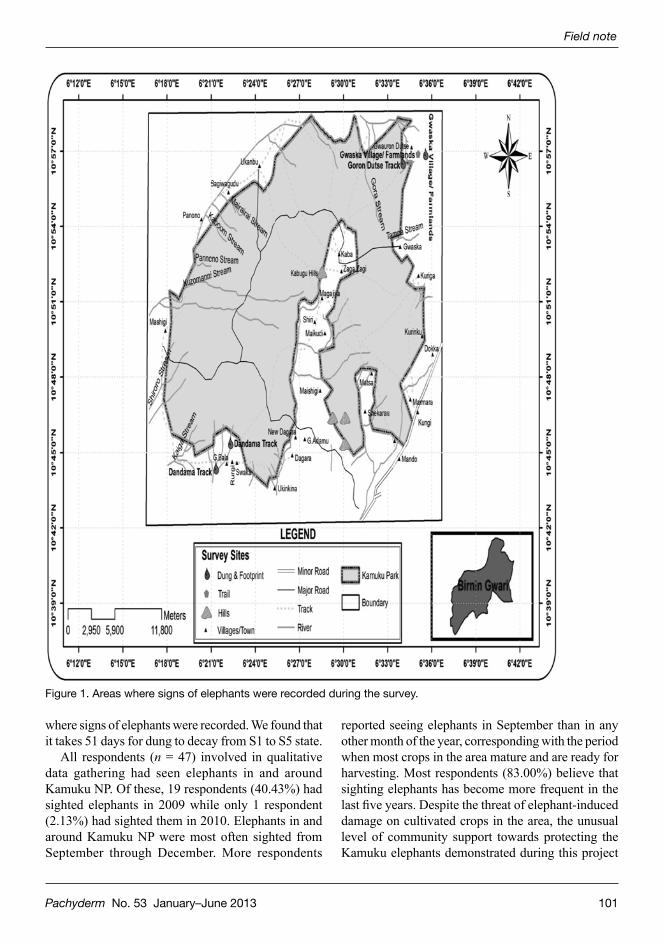
Field note
Pachyderm No. 53 January–June 2013 101
where signs of elephants were recorded. We found that it takes 51 days for dung to decay from S1 to S5 state.
All respondents (n = 47) involved in qualitative data gathering had seen elephants in and around Kamuku NP. Of these, 19 respondents (40.43%) had sighted elephants in 2009 while only 1 respondent (2.13%) had sighted them in 2010. Elephants in and around Kamuku NP were most often sighted from September through December. More respondents
reported seeing elephants in September than in any other month of the year, corresponding with the period when most crops in the area mature and are ready for harvesting. Most respondents (83.00%) believe that sighting elephants has become more frequent in the last five years. Despite the threat of elephant-induced damage on cultivated crops in the area, the unusual level of community support towards protecting the Kamuku elephants demonstrated during this project
Figure 1. Areas where signs of elephants were recorded during the survey.

Amusa et al.
102 Pachyderm No. 53 January–June 2013
is remarkable. This support could be attributed to the positive emotions generated for wildlife conservation among the participants through the survey approach. However, the survey also exposed the presence of threats along elephant routes and ranging and dispersal areas. The threats include slash-and-burn agriculture, pastoralism, poaching, increased settlements and habitat encroachment due to rising human population. A widespread trait common to these threats is habitat loss and fragmentation.
RecommendationsIt is important to identify and understand the movement patterns of the elephants as well as their resource needs and resource availability along migration routes. The park management authorities should also identify and geo-reference migration routes and cordon them off from all forms of human activity. Because elephants often migrate through defined corridors, the routes and habitats they use must be protected. Indeed, Kamuku NP management authorities have started discussions with the relevant stakeholders on how to carry out joint patrol activities and sensitization campaigns within Kuyambana Game Reserve (GR) and its support zone communities in Zamfara State. This will ensure the Kamuku elephant population is viable. The game reserve was identified as an important haven for the elephants. Given the current state of Kuyambana GR, it will not be out of place if the Nigerian government links the reserve with Kamuku NP to develop a coherent strategy to conserve and manage the elephants.
This project established community-based elephant conservation and monitoring committees in some support zone communities of the park. This initiative is a platform for providing the park with reports on elephant sighting, movement and activities in and around the support zone communities.
AcknowledgementsThe authors are sincerely grateful to the Rufford Small Grants Foundation (for nature conservation) for providing financial support to carry out this work through grant RSG 53.10.09. We profoundly appreciate the moral support received from Dr AJ Meduna, provost of the Federal College of Wildlife Management, in ensuring the success of the project. We deeply appreciate the logistics and personnel assistance provided by the Nigerian National Park Service and Kamuku National Park management authorities led by Mr Abdullahi Ahmad. We also thank all village leaders and communities in the project area for providing the enabling environment to carry out the survey. We sincerely thank the community-based elephant conservation and monitoring committees, members of survey corps as well as staff and rangers of Kamuku NP.
ReferencesBarnes RFW. 1988. A short-cut method for obtaining
preliminary estimates of elephant abundance. Wildlife Conservation International.
Barnes RFW, Jensen KL. 1987. How to count elephants in forests. Technical bulletin 1. African Elephant and Rhino Specialist Group, World Conservation Union, Gland, Switzerland.
Buckland ST, Anderson DR, Burnham KP, Laake JL, Borchers DL, Thomas L. 2001. Introduction to distance sampling: estimating abundance of biological populations. Oxford University Press.
Hedges S, Lawson D. 2006. Dung survey standards for the MIKE programme. Central Coordinating Unit, CITES–MIKE Programme, Nairobi, Kenya.

Pachyderm No. 53 January–June 2013 103
MIKE update
End of MIKE Phase II and beginning of MIKE 3.0As reported in the last issue of Pachyderm, the MIKE Phase II project came to an end in December 2012 after nearly seven years of generous support from the European Union. An evaluation of the project has been conducted by Dr Rob Malpas of the Conservation Development Centre. In the course of the evaluation, Dr Malpas conducted extensive consultations with range States and elephant experts across the continent and beyond. At the time of writing, we are eagerly awaiting his evaluation report, the final version of which will be made publicly available through the MIKE website.
Just as MIKE Phase II ended, a new two-year project, MIKE 3.0, started in January 2013 with funding from the European Union. In mid-February, the MIKE team met in Nairobi for two days to plan in detail the activities to be undertaken over the next two years. These work plans were presented to the range States of Eastern and West Africa at their respective Subregional Steering Committee meetings, both of which were held in May. These meetings also provided an opportunity to present the new operational arrangements under MIKE 3.0, as well as to introduce these two subregions to their new subregional support officers.
The first site to receive training under the MIKE 3.0 project is also the newest MIKE site, located in the newest participating range State. Kasungu National Park (Malawi), where Tapera Chimuti
CITES-MIKE update
Mise à jour de la CITES-MIKE
Julian Blanc
Acting Coordinator and Data Analyst, CITES-MIKE, UNEP/DELC, United Nations Compound T-36, UN Avenue Gigiri, Nairobi; email: [email protected]
Fin de la Phase II de MIKE et début de MIKE 3.0Comme indiqué dans le dernier numéro de Pachyderme, la phase II du projet MIKE a pris fin en décembre 2012 après presque sept ans d’un soutien généreux de l’Union européenne. Une évaluation du projet a été menée par le Dr. Rob Malpas du Centre de Développement de la Conservation. Au cours de l’évaluation, le Dr. Malpas a mené de vastes consultations avec les Etats de l’aire de répartition de l’éléphant et des experts à travers le continent et au-delà. Au moment où nous écrivons ces lignes, nous attendons avec impatience son rapport d’évaluation dont la version finale sera mise à disposition au public via le site MIKE. Au moment où la Phase II de Mike prenait fin, un nouveau projet de deux ans, MIKE 3.0, a débuté en janvier 2013 grâce au financement de l’Union européenne. A la mi-février, l’équipe MIKE s’est réunie à Nairobi pendant deux jours afin de planifier en détail les activités à entreprendre au cours des deux prochaines années. Ces plans de travail ont été présentés aux états de l’aire de répartition de l’Afrique de l’Ouest et de l’Est lors des réunions de leurs comités directeurs sous-régionaux respectifs, qui ont eu lieu en mai. Ces rencontres ont également été l’occasion de présenter les nouveaux accords opérationnels sous MIKE 3.0, ainsi que de présenter ces deux sous-régions à leurs nouveaux agents d’appui sous-régionaux.
Le premier site à bénéficier d’une formation dans le cadre du projet MIKE 3.0 est également le site MIKE le plus récent, situé dans l’Etat de l’aire de répartition participant le plus récent. Le Parc national de Kasungu (Malawi), dans lequel Tapera Chimuti a organisé un cours
MIKE/ETIS UPDATES

104 Pachyderm No. 53 January–June 2013
Blanc
conducted a training course for rangers in April, is also the first site to be introduced to the new SMART system by the MIKE programme. MIKE 3.0 has started on a good footing with all these firsts, and we feel confident that the project will be a success. We are extremely grateful to the European Union for its continued confidence in MIKE in Africa.
SMART 1.0 was released in February, and two updates have since been released (1.0.5 and 1.1.0). In addition to the standard law-enforcement monitoring functions present in beta versions, these releases of SMART now include planning and intelligence functions, additional analytical options and language localization. If you would like to try out SMART in your conservation area, you can download the software and training materials from http://www.smartconservationsoftware.org/.
CITES CoP16The 16th meeting of the Conference of Parties to CITES (CoP16) was held at the Queen Sirikit Centre in Bangkok, Thailand, 3–14 March 2013. As is habitual at these meetings, elephants occupied a prominent role on the agenda. MIKE and ETIS delivered reports to CoP, and Parties adopted a number of new and amended Resolutions and Decisions affecting elephants.
MIKE report to CoP 16On 7 March, the MIKE programme delivered its report to CoP16. The report, which is available at http://www.cites.org/eng/cop/16/doc/E-CoP16-53-01.pdf, documents an increasing trend in levels of illegal killing of elephants across African MIKE sites starting in 2006, and identifies poverty, governance and consumer demand in China as the most important factors associated with poaching levels. An update on poaching trends at MIKE sites up to mid-2012 was included in an addendum to the report, which was released in February. The trend update suggests that poaching levels in the first half of 2012 were of a similar magnitude as those recorded in 2011, which was the highest year on record. Using methods developed by Dr Ken Burnham, the MIKE statistician, the addendum also presents an estimate of some 17,000 elephants illegally
de formation pour les écogardes en avril, est également le premier site à introduire le nouveau système SMART au programme MIKE. MIKE 3.0 a commencé sur un bon pied avec toutes ces premières, et nous sommes sûrs que le projet sera un succès. Nous sommes extrêmement reconnaissants à l’Union européenne pour sa confiance continue dans MIKE en Afrique.
SMART 1.0 est sorti en février, et deux mises à jour ont paru depuis (1.0.5 et 1.1.0). En plus des fonctions de suivi de l’application de la loi standard qui figurent dans les versions bêta, ces parutions de SMART incluent désormais des fonctions de planification et de renseignement, des options d’analyse supplémentaires et la localisation de la voix. Si vous souhaitez essayer SMART dans votre zone de conservation, vous pouvez télécharger le logiciel et le matériel de formation à partir de http://www.smartconservationsoftware.org/.
La CdP 16 de la CITESLa 16ème réunion de la Conférence des Parties à la CITES (CdP16) a eu lieu au Centre de la Reine Sirikit à Bangkok, en Thaïlande entre le 4 et le 14 mars 2013. Comme il est d’usage lors de ces réunions, les éléphants ont occupé un rôle de premier plan au programme. MIKE et ETIS ont distribué des rapports à la CdP, et plusieurs résolutions et décisions nouvelles et modifiées affectant les éléphants ont été adoptées par les Parties au cours de la CdP.
Le rapport de MIKE à la CdP16Le 7 mars, le programme MIKE a remis son rapport à la CdP16. Le rapport, qui est disponible à partir de http://www.cites.org/eng/cop/16/doc/E-CoP16-53-01.pdf documente une tendance à la hausse des niveaux d’abattage illégal des éléphants à travers les sites MIKE d’Afrique à partir de 2006, et identifie la pauvreté, la gouvernance et la demande des consommateurs en Chine comme les facteurs les plus importants associés à ces niveaux de braconnage. Une mise à jour sur les tendances du braconnage sur les sites MIKE jusqu’à la mi-2012 figure dans un addendum au rapport, publié en février. La mise à jour de la tendance suggère que les niveaux de braconnage dans la première moitié de 2012 étaient d’une ampleur similaire à ceux enregistrés en 2011, qui était l’année avec le braconnage le plus élevé officiellement. En utilisant des méthodes mises au point par le statisticien de MIKE, le Dr. Ken Burnham, l’addendum présente également une estimation de quelques 17.000 éléphants tués illégalement dans les sites de MIKE en 2011 seulement. On estime que les

Pachyderm No. 53 January–June 2013 105
MIKE update
killed at MIKE sites in 2011 alone. MIKE sites in Africa are estimated to hold about 40% of the continental population, but it would not be advisable to simply extrapolate the rate of illegal killing found at MIKE sites to the entire African elephant population, as a large proportion of the elephants outside MIKE sites are in southern Africa, where poaching levels are generally lower. The addendum to the MIKE CoP16 report is available from http://www.cites.org/eng/cop/16/doc/E-CoP16-53-01-Addendum.pdf.
Resolutions related to elephantsCoP16 amended its main elephant Resolution (Resolution Conf. 10.10 Rev. CoP16). It also adopted a new Resolution on the African Elephant Action Plan and the African Elephant Fund, and directed the Standing Committee to establish a working group to review Resolution 10.9—the Resolution that governs transfers of elephant populations between the Appendices—and to report to CoP17 with a proposed revision.
Revision of Resolution 10.10 on trade in elephant specimensAfter a thorough and consultative review process, a revision of the CITES Resolution that governs both MIKE and ETIS was passed at CoP16. The new version of the Resolution introduces a number of new elements, including recommendations for Parties to maintain inventories of ivory stocks and report them to the Secretariat annually; to take samples from large ivory seizures and submit them to appropriate forensic facilities for sourcing and dating; and to engage in campaigns to reduce the supply of illegal ivory and the demand for it. The MIKE and ETIS sections of the Resolution have also been amended. In the case of MIKE, roles and responsibilities are more clearly delineated, and range States are more explicitly requested to designate agencies and focal points responsible for MIKE implementation. Finally, a data release policy for MIKE is embedded in the Resolution. The text of the amended Resolution is available at http://www.cites.org/eng/res/10/10-10R16.php.
sites de MIKE en Afrique contiennent environ 40% de la population continentale, mais il ne serait pas souhaitable de simplement extrapoler le taux d’abattage illégal trouvé sur les sites MIKE à l’ensemble de la population d’éléphants d’Afrique, car une grande partie des éléphants en dehors des sites MIKE sont en Afrique australe, où les niveaux de braconnage sont généralement plus faibles. L’addendum au rapport de MIKE à la CdP16 est disponible à partir de http://www.cites.org/eng/cop/16/doc/E-CoP16-53-01-Addendum.pdf.
Les résolutions liées à l’éléphantLa CdP16 a modifié sa résolution principale sur les éléphants (Résolution Conf. 10.10 (Rev. CdP16)). Elle a également adopté une nouvelle résolution sur le Plan d’action pour l’éléphant d’Afrique et le Fonds pour l’éléphant d’Afrique, et a demandé au Comité permanent d’établir un groupe de travail pour examiner la Résolution 10.9 – la Résolution qui régit les transferts de populations d’éléphants se trouve dans les annexes – et de faire rapport à la CdP17 avec une proposition de révision.
Révision de la résolution 10.10 sur le commerce des spécimens d’éléphantsAprès un processus d’examen approfondi et de consultation, une révision de la résolution de la CITES qui régit MIKE et ETIS a été adoptée à la CdP16. La nouvelle version de la résolution introduit un certain nombre d’éléments nouveaux, notamment des recommandations pour que les Parties maintiennent des inventaires de stocks d’ivoire et qu’ils fassent des rapports annuellement au Secrétariat; qu’ils prélèvent des échantillons sur d’importantes saisies d’ivoire et les soumettent aux services criminalistiques appropriés pour déterminer la source et la datation et qu’ils entreprennent des campagnes visant à réduire l’offre et la demande d’ivoire illégal. Les sections relatives à MIKE et à ETIS dans la résolution ont également été modifiées. Dans le cas de MIKE, les rôles et les responsabilités sont plus clairement définis, et les états de l’aire de répartition sont plus expressément invités à désigner des organismes et des points focaux chargés de la mise en œuvre de MIKE. Enfin, une politique de diffusion des données de MIKE est intégrée dans la résolution. Le texte de la résolution amendée est disponible sur http://www.cites.org/eng/res/10/10-10R16.php.
106 Pachyderm No. 53 January–June 2013
Blanc
Resolution 16.9 on the African Elephant Action Plan and the African Elephant FundThis new Resolution, based on a proposed text submitted by Nigeria and Rwanda, encourages elephant range States to prioritize actions to catalyse funding for the African Elephant Fund within their own national and regional mechanisms, such as their National Biodiversity Strategies and Action Plans. The Resolution also calls on other conventions, such as the Convention on Migratory Species and the Convention on Biological Diversity, as well as donors, to support the implementation of the African Elephant Action Plan (AEAP). Parties and organizations are also urged in the Resolution to provide in-kind support to the African Elephant Fund’s Steering Committee and to elephant range States in the implementation of the African Elephant Action Plan. It also requests the CITES Secretariat and UNEP to promote fund raising for implementing AEAP, and calls on UNEP to provide AEAP with the secretariat support necessary to explore partnerships and synergies for implementing the plan.
New and amended CoP and Standing Committee Decisions relating to elephantsIn response to the alarming levels of illegal killing and trade reported by MIKE and ETIS, both the Standing Committee (SC) and CoP passed landmark Decisions that aim to bring the illegal trade in ivory under control.
CITES Meetings SC63 and SC64SC meetings were held immediately before and after COP16 in Bangkok. At SC63, the Standing Committee requested the eight countries identified by ETIS at SC62 (Geneva, July 2012) as being most heavily implicated in the illegal ivory trade (Kenya, Tanzania and Uganda in Africa and China, Malaysia, the Philippines, Thailand and Viet Nam in Asia) to develop action plans, with timeframes and milestones, to address the worrying situation. The Secretariat and its MIKE team assisted these countries through CoP16 to develop draft action plans. At SC64, the Standing Committee set a
Résolution 16.9 sur le Plan d’action pour l’éléphant d’Afrique et le Fonds pour l’Eléphant d’AfriqueCette nouvelle résolution, basée sur un projet de texte présenté par le Nigéria et le Rwanda, encourage les Etats de l’aire de répartition de prioriser les actions afin de catalyser le financement du Fonds pour l’éléphant d’Afrique au sein de leurs propres mécanismes nationaux et régionaux, tels que les Stratégies et Plans d’Action Nationaux pour la Biodiversité. La résolution fait également appel à d’autres conventions, telles que la Convention sur la Conservation des Espèces Migratrices et la Convention sur la Diversité Biologique, ainsi qu’aux bailleurs de fonds, de soutenir la mise en œuvre du Plan d’Action pour l’Eléphant d’Afrique (PAEA). Dans la résolution, les Parties et les organisations sont également invitées à fournir un appui en nature au Comité directeur du Fonds pour l’Eléphant d’Afrique et aux Etats de l’aire de répartition dans la mise en œuvre du Plan d’Action pour l’Eléphant d’Afrique Elle demande également au Secrétariat de la CITES et au PNUE de promouvoir la mobilisation de fonds pour la mise en œuvre du PAEA, et appelle le PNUE à fournir des services de secrétariat nécessaires au PAEA et à explorer les partenariats et les synergies pour la mise en œuvre du plan.
Décisions nouvelles et modifiées de la CdP et du CP sur les éléphantsEn réponse aux niveaux alarmants de l’abattage et du commerce illégaux rapportés par MIKE et ETIS, le Comité Permanent (CP) et la CdP ont adopté des décisions historiques visant à contrôler le commerce illégal de l’ivoire.
Le CP63 et le CP64Les réunions du Comité Permanent de la CITES, CP63 et CP64, ont eu lieu immédiatement avant et après la CdP16 à Bangkok. Au CP63, le Comité Permanent a demandé aux huit pays identifiés par ETIS au CP62 (Genève, juillet 2012) comme étant les plus fortement impliqués dans le commerce illicite de l’ivoire (le Kenya, la Tanzanie et l’Ouganda en Afrique et la Chine, la Malaisie, les Philippines, la Thaïlande et le Viet Nam en Asie), d’ élaborer des plans d’action, avec des calendriers et des étapes importantes, pour remédier à cette situation préoccupante. Le Secrétariat et son équipe MIKE ont aidé ces pays au cours de la CdP16 à élaborer des plans d’action provisoires. Au CP64, le Comité permanent a fixé
Pachyderm No. 53 January–June 2013 107
MIKE update
deadline of 15 May 2013 for these countries to submit their final ivory action plans to the Secretariat, which they all did. These Parties now need to implement their plans and the Secretariat is to monitor their progress. The Parties will also need to report on their progress at SC65, and the Secretariat will make recommendations at that same meeting.
Decisions 16.78 to 16.83The Conference of Parties instructed the Secretariat through Decision 16.78 to convene an Ivory Enforcement Task Force, which will be mandated to review and develop strategies to combat the illegal trade in ivory and to propose measures to enhance collaboration on law enforcement. The Task Force is to comprise representatives of the eight countries identified by the ETIS analysis as being most implicated in the illicit trade in ivory, as well as members of the International Consortium to Combat Wildlife Crime (ICCWC) and other parties and experts as appropriate.
Recognizing the potential value of DNA-based and forensic techniques in understanding the dynamics of the illegal ivory trade chain, the Decision also instructs the Secretariat to examine and advise on existing techniques for determining the age and origin of seized ivory, to identify relevant forensic facilities and research institutions, and to consider the need for further research in these areas.
The Secretariat is also asked in the Decision to convene a workshop on controlled deliveries, a law-enforcement technique that can help identify and capture kingpins behind the illegal ivory trade. Finally, Decision 16.78 also calls on the Secretariat to develop, in collaboration with ICCWC partners, a manual to assist law-enforcement agencies to improve the effectiveness of their actions by intercepting money laundering and recovering assets from suspects.
Decision 16.79 instructs the Secretariat to contact the countries identified by ETIS as being of ‘secondary concern’ in the illegal ivory trade (Cameroon, Republic of Congo, Democratic Republic of Congo, Egypt, Ethiopia, Gabon, Mozambique, Nigeria and Uganda) to assess their provisions for control of the ivory trade and ivory markets. The Secretariat will then develop, in consultation with these countries, specific actions
le délai du 15 mai pour que ces pays soumettent leurs plans d’action finaux pour l’ivoire au Secrétariat, ce qu’ils ont tous fait. Ces Parties doivent maintenant mettre en œuvre leurs plans et le Secrétariat doit suivre leurs progrès. Les Parties devront également rendre compte de leurs progrès au CP65, et le Secrétariat fera des recommandations à cette même réunion.
Les Décisions 16.78 à 16.83La Conférence des Parties a demandé au Secrétariat de convoquer un « groupe de travail de mise en vigueur sur l’ivoire » par la décision 16.78, qui sera chargé d’examiner et d’élaborer des stratégies pour lutter contre le commerce illégal de l’ivoire et proposer des mesures pour améliorer la collaboration en matière de mise en application de la loi. Le Groupe de travail doit être composé des huit pays identifiés par l’analyse ETIS comme étant les plus impliqués dans le commerce illicite de l’ivoire, ainsi que les membres du Consortium International de Lutte contre la Criminalité liée aux espèces sauvages (ICCWC) et le cas échéant, d’autres parties et experts.
En reconnaissant la valeur potentielle des techniques basées sur l’ADN et la criminalistique dans la compréhension de la dynamique de la chaîne du commerce illégal de l’ivoire, la Décision donne également instructions au Secrétariat d’examiner et de donner des conseils sur les techniques existantes pour déterminer l’âge et l’origine de l’ivoire saisi, afin d’identifier les établissements médico-légales pertinentes et les institutions de recherche et d’examiner la nécessité de poursuivre les recherches dans ces domaines.
Dans cette Décision, on a également demandé au Secrétariat d’organiser un atelier sur les livraisons surveillées, une technique de mise en application de la loi pouvant aider à identifier et capturer les gros bonnets derrière le commerce illégal de l’ivoire. Enfin, la décision 16.78 demande également au Secrétariat d’élaborer, en collaboration avec les partenaires de l’ICCWC, un manuel pour aider les forces de l’ordre à améliorer l’efficacité de leurs actions en interceptant le blanchiment d’argent et en recouvrant les avoirs des suspects.
La Décision 16.79, charge le Secrétariat de contacter les pays identifiés par ETIS comme étant d’une «préoccupation secondaire » dans le commerce illicite de l’ivoire (le Cameroun, le Congo, la République Démocratique du Congo, l’Egypte, l’Ethiopie, le Gabon, le Mozambique, le Nigeria et l’Ouganda) d’évaluer leurs dispositions pour le contrôle du commerce de l’ivoire et ses marchés. Le Secrétariat élaborera ensuite, en consultation avec ces pays, des actions spécifiques et des délais pour s’assurer
108 Pachyderm No. 53 January–June 2013
Blanc
and deadlines to ensure significant progress by SC65 (Geneva, June 2014). The Secretariat will report its findings and recommendations at SC65 and SC66 (2015).
Decision 16.80 instructs the Secretariat to contact countries identified by ETIS as being ‘of importance to watch’ (Angola, Laos People’s Democratic Republic, Qatar and the United Arab Emirates) to seek clarification on their provisions for control of the ivory trade and ivory markets, and to report its findings to SC65.
Decision 16.81 directs the CITES Secretary-General to collaborate with the United Nations Office on Drugs and Crime regarding the levels of illegal killing of elephants and illegal trade in ivory and their implications on national security for certain African countries.
To determine the origin of ivory in large ivory seizures of 500 kg or more, Decision 16.83 directs Parties making such seizures, including seizures made in the previous two years, to collect samples from them, and to submit them to appropriate forensic analysis facilities. Samples from new seizures should be collected and submitted for analysis within 90 days of the seizure.
The Standing Committee is directed through Decision 16.82 to review, at SC65 and SC66, the reports and recommendations from the Secretariat on implementing the above Decisions, and to determine whether further actions are necessary.
Decision 16.55—Decision-making mechanism for a process of trade in ivoryA CoP14 Decision (14.77) mandated the development of a decision-making mechanism for a process of trade in ivory. As the development process could not be completed by the stipulated deadline of CoP16, the Parties agreed, through this Decision, to extend the deadline until CoP17 (2016). A working group of the Standing Committee has now been established to move the process forward.
Extension of Decision 14.78Decision 14.78 called on the African and Asian Elephant Specialist Groups, MIKE, ETIS, WCMC-UNEP (World Conservation Monitoring Centre of the United Nations Environment
d’un progrès significatif lors du CP65 (Genève, juin 2014). Le Secrétariat fera rapport de ses conclusions et recommandations au CP65 et au CP66 (2015).
La décision 16.80 charge le Secrétariat de contacter les pays identifiés par ETIS comme étant « d’importance à surveiller » (l’Angola, le Cambodge, la République Démocratique populaire du Laos, le Qatar et les Émirats Arabes Unis) et de leur demander des éclaircissements sur leurs dispositions pour le contrôle du commerce de l’ivoire et ses marchés, et présenter ses conclusions à la CP65.
La décision 16.81 demande au Secrétaire Général de la CITES de collaborer avec l’Office des Nations Unies contre la Drogue et le Crime en ce qui concerne les niveaux d’abattage illégal des éléphants et le commerce illégal de l’ivoire, et leurs implications sur la sécurité nationale pour certains pays africains.
Afin de déterminer l’origine de l’ivoire dans les grandes saisies d’ivoire de 500 kg ou plus, la décision 16.83 demande aux Parties qui font de telles saisies, y compris des saisies effectuées au cours des 2 années précédentes, d’y prélever des échantillons, et de les soumettre à l’analyse des établissements médico-légales appropriés. Les échantillons provenant de nouvelles saisies devraient être prélevés et envoyés pour analyse dans les 90 jours après la saisie.
La décision 16.82 demande au Comité permanent de revoir, au CP65 et au CP66, les rapports et les recommandations du Secrétariat sur la mise en œuvre des décisions ci-dessus, et déterminer si des mesures supplémentaires sont nécessaires.
La Décision 16.55 - mécanisme de prise de décisions pour un processus de commerce de l’ivoireUne décision de la CdP14 (14.77) a mandaté le développement d’un mécanisme de prise de décisions pour un processus de commerce de l’ivoire. Comme le processus de développement n’a pas pu être achevé dans les délais prévus de la CdP16, les Parties ont convenu, par cette décision, de prolonger le délai jusqu’à la CdP17 (2016). Un groupe de travail du Comité permanent a été mis en place pour faire avancer le processus.
Extension de la Décision 14.78La décision 14.78 a fait appel aux Groupes de Spécialistes des Eléphants d’Afrique et d’Asie, MIKE, ETIS, le PNUE-WCMC et les Etats de l’aire de répartition de l’éléphant d’Afrique de faire rapport au CP61 et au CP 62 sur la situation des éléphants, les niveaux d’abattage

Pachyderm No. 53 January–June 2013 109
MIKE update
Programme) and the African elephant range States to report to SC61 and SC62 on the status of elephants, levels of illegal killing and trade in ivory. The reports were distressing in their content, but well received by the Parties. It is perhaps for this reason that the Decision was amended and extended at CoP16, providing for updated reports to be submitted to SC65 (2014) and SC66 (2015). On the basis of these reports, the Secretariat will make recommendations for any necessary action by the Standing Committee. We at the MIKE programme look forward to the continuation of our productive collaboration with AfESG, AsESG and TRAFFIC to improve the understanding of the illegal ivory supply chain.
Carcass forensics: a training toolkitThe MIKE programme requires participating elephant range States to regularly submit data on dead elephants found at MIKE sites. The data we ask for include the cause of death, age and sex of the animal, whether any ivory was removed, and the decomposition stage of the carcass. While we try to keep the data requirements as simple as possible, data are often submitted with missing information. Most commonly, this is due to rangers lacking sufficient skills to determine the age, sex and decomposition stage of dead elephants. To improve the quality of data submitted to MIKE, we have developed a training toolkit on ‘carcass forensics’. The toolkit, which is primarily the work of Howard Frederick and Onesmus Kahindi, guides rangers through a methodical investigation process and gives tips on what to look out for in order to accurately determine these parameters. The toolkit was released for review in April but is intended to be a living resource to be constantly improved with new information. In particular, there is a need for better information on carcass decay stages in forest environments. The toolkit is currently only web-based (see http://forensic.citesmike.org/wp/) but pages can be printed, and we are developing a foldable sheet that rangers can easily carry in the field with checklists and pointers on what to look out for. If you have expertise on elephant carcass forensics, please take a look at the site and submit your comments through the site itself.
et le commerce illégal de l’ivoire. Les rapports étaient bouleversants dans leur contenu, mais très bien reçus par les Parties. C’est peut-être pour cette raison que la décision a été modifiée et prolongée à la CdP16, pour que des rapports mis à jour soient soumis au CP65 (2014) et au CP66 (2015). Sur la base de ces rapports, le Secrétariat fera des recommandations pour toute action nécessaire par le Comité permanent. Nous, au programme MIKE nous nous réjouissons de la poursuite de notre collaboration fructueuse avec le GSEAf, GSEAs et TRAFFIC pour améliorer la compréhension de la chaîne d’approvisionnement illégal de l’ivoire.
Criminalistique des carcasses: une boîte à outils pour la formationLe programme MIKE demande aux états de l’aire de répartition des éléphants participant de soumettre régulièrement des données sur les éléphants morts trouvés sur les sites MIKE. Les données que nous demandons sont la cause du décès, l’âge et le sexe de l’animal, si on a retiré de l’ivoire, et le stade de décomposition de la carcasse. Alors que nous essayons de ne demander que des données aussi simples que possible, les données sont souvent présentées avec des informations qui manquent. Le plus souvent, cela est dû au fait que les écogardes n’ont pas les compétences suffisantes pour déterminer l’âge, le sexe et le stade de décomposition des éléphants morts. Pour améliorer la qualité des données soumises à MIKE, nous avons développé un ensemble d’outils de formation sur la « criminalistique de la carcasse ». Cette boîte à outils, qui est principalement l’œuvre de Howard Frederick et Onesmus Kahindi, guide les écogardes à travers le processus d’enquête méthodique et donne des conseils sur ce qu’il faut chercher afin de déterminer avec précision ces paramètres. L’ensemble d’outils a été lancé pour examen en avril, mais se veut une ressource vivante qui doit être constamment amélioré par de nouvelles informations. Surtout, il faut de meilleures informations sur les stades de décomposition des carcasses dans les milieux forestiers. L’ensemble d’outils est actuellement basé sur le Web seulement (voir http://forensic.citesmike.org/wp/) mais les pages peuvent être imprimées, et nous développons une feuille pliable que les écogardes peuvent facilement transporter sur terrain contenant des listes de contrôle et des indicateurs sur ce qu’on doit chercher. Si vous avez une expertise sur la criminalistique des carcasses d’éléphants, veuillez jeter un coup d’œil sur le site et soumettre vos commentaires sur le site.
110 Pachyderm No. 53 January–June 2013
Blanc
Eléphants dans la poussière : Une évaluation de la réponse rapideLe Secrétariat de la CITES, à travers son Unité centrale de Coordination de MIKE, a mandaté le GRID du PNUE à Arendal de publier un rapport sur la crise de l’éléphant d’Afrique. Le rapport, rédigé en grande partie par les partenaires du GSEAf, de MIKE et d’ETIS, rend plus accessibles les conclusions de ces trois partenaires sur la dynamique de la chaîne d’approvisionnement illégal de l’ivoire à un public plus large. Le rapport, lancé à la CdP16, a été largement rapporté par les médias. Elephants in the Dust est disponible pour téléchargement en format pdf à partir de http://www.grida.no/publications/rr/elephants/. Une version française est en cours de finalisation et sera également disponible sur le même site.
Elephants in the dust: a rapid response assessmentThe CITES Secretariat, through its MIKE Central Coordination Unit, commissioned UNEP Grid Arendal to publish a report on the African elephant crisis. The report, written largely by partners from AfESG, MIKE and ETIS, makes the findings from these three partners on the dynamics of the illegal ivory supply chain more accessible to a wider audience. The report was launched at CoP16 and was widely reported by the media. Elephants in the dust is available for download in pdf from http://www.grida.no/publications/rr/elephants/. A French version is currently being finalized and will also be available from the same site.
Pachyderm No. 53 January–June 2013 111
ETIS update
Throughout the 16th meeting of the CITES Conference of Parties (CoP16) held in Bangkok, Thailand from 3 to 14 March 2013, a palpable sense of urgency drove the elephant deliberations with widespread recognition of the fact that African elephants are currently facing a resurgent trade crisis unlike anything witnessed over the last 25 years. Following the withdrawal of an elephant downlisting and ivory trade proposal by Tanzania, the focus of the meeting decidedly shifted to the reports presented by the MIKE and ETIS programmes, which detailed escalating elephant poaching across Africa and record levels of illegal ivory trade in 2011. Indeed, there was unprecedented uptake of the ETIS results, sound decisionmaking for elephants generally ruled the day, and agreement was reached on a series of interventions to curb illegal ivory trade and hold countries answerable for their actions. The CITES Parties left Bangkok with very important achievements in hand and a clear sense of direction moving forward. Importantly, the compliance requirements addressed to countries that perennially fail to take steps against illegal trade in ivory were strengthened, introducing a higher degree of accountability and, hopefully, motivation to seriously tackle outstanding problems for the benefit of elephant conservation.
The prospect of scaled-up action was put into motion at the 62nd meeting of the CITES Standing Committee in July 2012 as a consequence of the joint report by MIKE, ETIS and IUCN/SSC African and Asian Elephant Specialist Groups. There, eight countries or territories identified by ETIS as being most heavily implicated in major illegal ivory trade flows were requested to
Progress in implementing the Elephant Trade Information System (ETIS)Avancement dans la mise en œuvre du Système d’Information sur le Trafic des Eléphants (ETIS)
Tom Milliken
Elephant & Rhino Programme Coordinator, TRAFFIC, PO Box CY 1409, Causeway, Harare, Zimbabwe email: [email protected]
Tout au long de la 16ème réunion de la Conférence des Parties de la CITES (CdP16) qui s’est tenue à Bangkok, en Thaïlande du 3 au 14 mars 2013, un sentiment palpable d’urgence a conduit les travaux sur l’éléphant avec une reconnaissance généralisée du fait que les éléphants d’Afrique sont actuellement confrontés à une crise renaissante du commerce qui ne ressemble pas à tout ce que l’on a connu au cours des 25 dernières années. Après le retrait de la proposition du déclassement de l’éléphant et du commerce de l’ivoire par la Tanzanie, la réunion s’est focalisé sur les rapports présentés par les programmes MIKE et ETIS, qui donnaient des détails sur l’intensification du braconnage des éléphants à travers l’Afrique et des niveaux record du commerce illicite de l’ivoire en 2011. En effet, il y a eu une adoption sans précédent des résultats d’ETIS, la prise de décisions avisées sur les éléphants a généralement été la règle du jour, et un accord a été conclu sur une série d’interventions visant à réduire le commerce illégal de l’ivoire et à tenir les pays responsables de leurs actions. Les Parties à la CITES ont quitté Bangkok ayant des réalisations importantes en main et un sens clair de la direction à prendre. Surtout, les obligations de conformité envoyées aux pays qui prennent rarement des mesures contre le commerce illégal de l’ivoire ont été renforcées, en introduisant un degré élevé de responsabilité et, espérons-le, une motivation pour s’attaquer sérieusement aux problèmes en suspens au profit de la conservation des éléphants.
La perspective d’une action intensifiée a été mise en marche lors de la 62ème réunion du Comité permanent de la CITES en juillet 2012 suite au rapport conjoint de MIKE, ETIS et les groupes de spécialistes de l’éléphant d’Afrique et d’Asie de la CSE/l’UICN. Là, huit pays ou territoires identifiés par ETIS comme étant les plus fortement impliqués dans les grands flux du commerce illicite d’ivoire ont été invités à soumettre des rapports
112 Pachyderm No. 53 January–June 2013
Milliken
submit written reports on their implementation of CITES ivory trade requirements to the CITES Secretariat by 1 January 2013. This obligation was directed at China and Thailand as end-use markets, Malaysia, Philippines, Hong Kong and Viet Nam as transit countries, and Kenya, Tanzania and Uganda as ivory source, transit or exit points in Africa. The CITES Secretariat was charged with evaluating the reports and producing recommendations to the Standing Committee at its 63rd meeting convened in Bangkok the day before CoP16 officially commenced. However, three countries—Malaysia, Tanzania and Viet Nam—failed to submit reports, and three others—Philippines, Uganda and Kenya—only produced reports or letters shortly before the meeting. This poor response was duly noted by the Standing Committee members who clearly were not amused and subsequently pushed a series of measures to force focused attention on ivory trade matters. The major result was a Decision, confirmed at the 64th meeting of the Standing Committee on the last day of CoP16, which required the eight countries or territories to develop ivory trade ‘action plans’ with clearly articulated compliance milestones and time frames for addressing salient issues that contribute to the illegal movement and trade in ivory in their countries. Failure to submit action plans or demonstrate progress on their implementation could result in CITES trade sanctions being imposed through a Standing Committee process. The next major review of this development will transpire at the 65th meeting of the Standing Committee in June/July 2014.
These Standing Committee deliberations clearly put the plight of elephants centre stage in Bangkok and set the tone for getting tough on illegal ivory trade. A day later, at the opening ceremony for CoP16, Thailand’s Prime Minister Yingluck Shinawatra announced that her country would be pursuing ‘the goal of putting an end to ivory trade and to be in line with international norms’. As one of the largest unregulated ivory markets in Asia, one of the countries targeted in the Standing Committee action plan process and an Asian elephant range State, this powerful declaration from CoP16’s host country provided further impetus for realizing strong action on illicit ivory trade. Equally, John Scanlon, Secretary-General of CITES, in his speech added:
écrits sur la mise en œuvre de leurs obligations à la CITES en matière de commerce de l’ivoire à son Secrétariat avant le 1er janvier 2013. Cette obligation était adressée à la Chine et à la Thaïlande en tant que marchés d’utilisation finale, à la Malaisie, aux Philippines, à Hong Kong et au Vietnam en tant que pays de transit et au Kenya, à la Tanzanie et à l’Ouganda comme pays sources, de transit ou de sortie de l’ivoire en Afrique. Le Secrétariat de la CITES a été chargé d’évaluer les rapports et de présenter des recommandations au Comité Permanent lors de sa 63ème réunion tenue à Bangkok la veille du commencement officiel de la CdP16. Toutefois, trois pays - la Malaisie, la Tanzanie et le Viet Nam n’ont pas présenté leurs rapports, et trois autres, les Philippines, l’Ouganda et le Kenya, ont présenté des rapports ou des lettres seulement peu de temps avant la réunion. Ce faible taux de réponse a été dûment noté par les membres du Comité permanent qui manifestement n’étaient pas contents et par la suite ont décidé une série de mesures pour focaliser l’attention sur les questions du commerce de l’ivoire. Le principal résultat a été une décision, confirmée lors de la 64ème réunion du Comité permanent le dernier jour de la CdP16, qui a exigé que les huit pays ou territoires élaborent des « plans d’action » sur le commerce de l’ivoire, avec des étapes de mise en conformité clairement articulées et des échéanciers pour régler les problèmes saillants qui contribuent à la circulation et au commerce de l’ivoire illégal dans leurs pays. Faute de présenter des plans d’action ou de démontrer des progrès de leur mise en œuvre, la CITES pourrait imposer des sanctions commerciales par un processus du Comité permanent. La prochaine révision majeure de ce développement se fera lors de la 65ème réunion du Comité permanent en juin/juillet 2014.
Ces délibérations du Comité permanent ont clairement mis le sort des éléphants au premier plan à Bangkok et a donné le ton pour sévir contre le commerce illégal de l’ivoire. Un jour plus tard, lors de la cérémonie d’ouverture de la CdP16, le Premier Ministre Yingluck Shinawatra a annoncé que son pays poursuivrait « le but de mettre fin au commerce de l’ivoire et être en conformité avec les normes internationales ». Comme l’un des plus grands marchés non réglementés de l’ivoire en Asie et l’un des pays ciblés dans le processus du plan d’action du Comité permanent et un Etat de l’aire de répartition de l’éléphant d’Asie, cette puissante déclaration du pays hôte de la CdP16 a donné un nouvel élan pour une action forte sur le commerce illicite de l’ivoire. De même, dans son discours, John Scanlon, Secrétaire général de la CITES a ajouté: « Le crime de la faune a récemment été mentionné
Pachyderm No. 53 January–June 2013 113
ETIS update
‘Wildlife crime has recently been referred to by the UN Security Council, which has linked the Lord’s Resistance Army to illicit trade in ivory in the Democratic Republic of the Congo. This criminal activity can pose a serious threat to the stability and economy of these countries; it also robs countries of their natural resources and cultural heritage, and it undermines good governance and the rule of law. These criminals must be stopped and we need to better deploy the sorts of techniques used to combat illicit trade in narcotics to do so.’ And a few days later, a new report entitled Elephants in the dust: the African elephant crisis, collaboratively produced by UNEP, CITES, IUCN and TRAFFIC sounded a further alarm concerning the escalating threats to the survival of African elephant populations in Africa.
The ETIS report, based on a new improved analytical framework developed by statisticians affiliated with the University of Reading, was presented by TRAFFIC in Committee II, together with the presentations from the MIKE programme and the CITES law-enforcement officer, to support decisionmaking in the context of the broader elephant agenda. Once again, the ETIS analysis drew attention to those countries most heavily implicated in illicit ivory trade, with the result differing from the priorities identified at SC62 by a single change: Uganda dropped to the second tier and South Africa moved onto the top tier list. The Parties quickly moved to adopt a Decision creating a CITES Ivory Enforcement Task Force to work with the countries of ‘primary concern’ in the ETIS analysis. Accordingly, the CITES Secretariat will, subject to funding, convene a task force to review law-enforcement strategies combating illegal trade and examine DNA testing, other forensic identification techniques for ivory, the use of controlled deliveries, and the application of anti-money-laundering and asset recovery in wildlife crime cases. This task force will include China, (with Hong Kong separately represented), Kenya, Malaysia, Philippines, South Africa, Thailand, Tanzania and Viet Nam, plus Uganda, as well as the International Coalition to Combat Wildlife Crime (ICCWC) partner organisations comprising ICPO-Interpol, the United Nations Office on Drugs and Crime, the World Bank, the World Customs Organization and the CITES
par le Conseil de sécurité de l’ONU, qui a lié l’Armée de Résistance du Seigneur au commerce illicite de l’ivoire en République Démocratique du Congo. Cette activité criminelle peut constituer une menace sérieuse pour la stabilité et l’économie de ces pays; il prive également les pays de leurs ressources naturelles et du patrimoine culturel, et sape la bonne gouvernance et l’état de droit. Ces criminels doivent être arrêtés et nous devons mieux déployer les sortes de techniques utilisées pour lutter contre le commerce illicite des stupéfiants». Et quelques jours plus tard, un nouveau rapport intitulé « Eléphants dans la poussière: la crise de l’éléphant d’Afrique », produit en collaboration avec le PNUE, la CITES, l’UICN et TRAFFIC a sonné une nouvelle alerte sur les menaces croissantes à la survie des populations d’éléphants de l’Afrique.
Le rapport d’ETIS, basé sur un nouveau cadre amélioré d’analyse développé par les statisticiens affiliés à l’Université de Reading, a été présenté par TRAFFIC au Comité II, avec les présentations par le programme MIKE et le Chargé de l’application de la loi de la CITES, afin de soutenir la prise de décision dans le contexte du programme de l’éléphant en général. Une fois de plus, l’analyse d’ETIS a attiré l’attention sur les pays les plus fortement impliqués dans le commerce illicite de l’ivoire, avec un résultat qui diffère des priorités identifiées au Comité Permanant 62 par un seul changement: sur la liste, l’Ouganda est descendu au deuxième niveau et l’Afrique du Sud est montée au premier niveau. Les Parties ont rapidement décidé d’adopter une décision instituant un groupe de travail sur l’application de la loi de la CITES sur l’ivoire pour travailler avec les pays de «préoccupation majeure» dans l’analyse ETIS. En conséquence, le Secrétariat de la CITES, sous réserve de financement, va convoquer un groupe de travail pour examiner les stratégies d’application de la loi pour lutter contre le commerce illégal et examiner des tests d’ADN, d’autres techniques d’identification médico-légale pour l’ivoire, le recours aux livraisons surveillées, et l’application des techniques d’anti-blanchiment d’argent et de récupération des biens dans les affaires de criminalité de la faune. Ce groupe de travail comprendra la Chine (avec Hong Kong représenté séparément), le Kenya, la Malaisie, les Philippines, l’Afrique du Sud, la Thaïlande, la Tanzanie et le Viet Nam, plus l’Ouganda, ainsi que le Consortium International de Lutte contre la Criminalité liée aux espèces sauvages (ICCWC), organisations partenaires comprenant l’OIPC-Interpol, l’Office des Nations Unies contre la Drogue et le Crime, la Banque Mondiale, l’Organisation Mondiale des Douanes (OMD)

114 Pachyderm No. 53 January–June 2013
Milliken
Secretariat. As some three-quarters of the illegal ivory trade since 2009 has moved through or to these countries, a focused collaborative law-enforcement body operating all along this trade chain holds promise for scaling up investigations and enforcement actions in the future.
In another Decision, the countries of ‘secondary concern’ in the ETIS analysis were compelled to report to the CITES Secretariat on their implementation of CITES provisions concerning control of ivory and ivory markets. These countries comprise Cameroon, the Republic of Congo, Democratic Republic of Congo, Egypt, Ethiopia, Gabon, Mozambique, Nigeria and Uganda. Following review, some of these nations may be required to submit action plans addressing issues inhibiting effective control of ivory. Regular review of these countries at future CITES Standing Committee meetings will also transpire.
And finally a third Decision addressed countries identified in the ETIS analysis as ‘important to watch’. This Decision required the CITES Secretariat to seek clarification from Angola, Cambodia, Japan, Lao People’s Democratic Republic, Qatar and United Arab Emirates on their implementation of CITES provisions for the control of ivory trade. The Secretariat’s findings and recommendations will be reported at future Standing Committee meetings and further actions may result if necessary.
In other developments, the revision of Resolution Conf. 10.10 on ‘Trade in Elephant Specimens’ was one of the most important elephant items on the agenda as this Resolution provides the mandate for the MIKE and ETIS programmes, establishes the criteria against which legal domestic trade in ivory must comply, and provides the general framework for addressing any elephant specimen trade under the Convention. At the outset of CoP16, the draft Resolution that came forward lacked a number of important considerations, but a drafting group of Parties under the impressive chairmanship of the United States, and ensuing interventions from the floor, led to a series of improvements:• compulsory annual reporting of all ivory
stockpiles held by governments anywhere in the world
• mandatory forensic examination of all large-
et le Secrétariat de la CITES. Puisque depuis 2009 les trois-quarts de l’ivoire illégal ont été acheminés à travers ou jusqu’à ces pays, un organisme d’application de la loi axée sur la collaboration et qui opère tout au long de cette chaîne commerciale est prometteur. Il pourra intensifier les enquêtes et les mesures d’application dans le futur.
Dans une autre décision, les pays de « préoccupation secondaire » dans l’analyse ETIS ont été contraints de faire rapport au Secrétariat de la CITES sur la mise en œuvre de leurs dispositions en matière de contrôle de l’ivoire et des marchés d’ivoire. Ces pays comprennent le Cameroun, le Congo, la République Démocratique du Congo, l’Egypte, l’Ethiopie, le Gabon, le Mozambique, le Nigeria et l’Ouganda. Après l’examen, on doit exiger à certains de ces pays de présenter des plans d’action portant sur les facteurs qui empêchent le contrôle effectif de l’ivoire. A l’avenir, un examen régulier de ces pays lors des réunions du Comité permanent de la CITES se fera aussi.
Enfin, une troisième décision concernait les pays identifiés dans l’analyse d’ETIS comme étant « importants à observer ». Selon cette décision, il faut que le Secrétariat de la CITES demande des éclaircissements à l’Angola, au Cambodge, au Japon, à la République Démocratique populaire du Laos, au Qatar et aux Émirats Arabes Unis concernant leur mise en œuvre des dispositions de la CITES pour le contrôle du commerce de l’ivoire. Les conclusions et les recommandations du Secrétariat seront présentées lors des futures réunions du Comité permanent et de nouvelles mesures pourraient en résulter si nécessaire.
Dans d’autres développements, la révision de la Résolution Conf. 10.10 sur « le commerce des spécimens d’éléphants » était l’un des éléments les plus importants concernant l’éléphant à l’ordre du jour car cette résolution précise le mandat des programmes MIKE et ETIS, elle établit les critères auxquels le commerce intérieur légal de l’ivoire doit se conformer, et fournit le cadre général pour le contrôle du commerce des spécimens d’éléphants en vertu de la Convention. Au début de la CdP16, le projet de résolution qu’on avançait manquait un certain nombre de considérations importantes, mais un groupe de rédaction des Parties sous la présidence impressionnante des États-Unis, et les interventions suivantes dans la salle, ont conduit à une série d’améliorations :• un rapport annuel obligatoire de tous les stocks d’ivoire
détenus par les gouvernements partout dans le monde• un examen médico-légal obligatoire de toutes les saisies
d’ivoire à grande échelle• l’inclusion de la « réduction de la demande », comme un

Pachyderm No. 53 January–June 2013 115
ETIS update
scale ivory seizures• inclusion of ‘demand reduction’ as a necessary
course of action in end-use markets• the tracking of trade in live elephants • a compliance mechanism, including the threat
of sanctions, when Parties fail to implement the requirements of the Resolution.
These requirements all serve to strengthen the purview of CITES in dealing with illegal trade in ivory and will assist the ETIS and MIKE programmes through the generation of important new sets of data. It was recognized that growing ivory stockpiles around the world represent an undocumented source of ivory, some of which is surreptitiously entering illegal trade. Until now, CITES has never required Parties to report on the status of their ivory stocks. In the face of increasing evidence of ongoing ivory theft from government-held stocks in both Africa and Asia, this new measure should improve regulation and allow annual tracking of ivory stockpiles all around the world. Governments that fail to secure their ivory stocks and allow ‘leakage’ into illegal trade, now run the risk of exposure. Assisting countries to establish robust ivory stock management programmes is an important consideration for TRAFFIC going forward.
The mandate for forensic examination was another major breakthrough. The Parties agreed compulsory forensic testing in all seizure cases involving 500 kg of ivory or more. Further, retroactive implementation of this mandate should be considered, if possible, for such seizure cases that have occurred during the last 24 months. TRAFFIC has consistently made the case that forensic examination should be a routine procedure for all large-scale ivory seizures to improve our understanding and knowledge of poaching patterns, trade routes and, ultimately, the criminal syndicates behind the smuggling. Considering all seizures of 500 kg or more from 2009 through 2012, the ETIS data indicate that the origin of some 90 tonnes of seized ivory remains unknown or is highly questionable. If adequately implemented, this void should be effectively addressed. This far-reaching development should greatly enhance understanding of illegal ivory trade chain relationships for the high-volume seizure cases in the ETIS data in the future.
plan d’action nécessaire dans les marchés d’utilisation finale
• le suivi du commerce des éléphants vivants• un mécanisme de conformité, y compris la menace de
sanctions, lorsque les Parties ne parviennent pas à se conformer aux obligations de la résolution.
Ces obligations servent toutes à renforcer le champ d’application de la CITES pour enrayer le commerce illicite de l’ivoire et aidera les programmes d’ETIS et MIKE grâce à la création de nouveaux ensembles de données importants. Il a été reconnu que la croissance des stocks d’ivoire à travers le monde représente une source non documentée d’ivoire, dont une partie entre subrepticement dans le commerce illégal. Jusqu’à présent, la CITES n’a jamais exigé aux Parties de faire rapport sur l’état de leurs stocks d’ivoire. Etant donné les vols d’ivoire de plus en plus manifestes en cours à partir des stocks détenus par les gouvernements en Afrique et en Asie, cette nouvelle mesure devrait permettre d’améliorer la réglementation et le suivi annuel des stocks d’ivoire dans le monde entier. Les gouvernements qui ne parviennent pas à sécuriser leurs stocks d’ivoire et permettent «la fuite» vers le commerce illicite, courent maintenant le risque d’exposition. Aider les pays à établir des programmes de gestion des stocks d’ivoire robustes est une considération importante pour TRAFFIC à l’avenir.
Le mandat pour l’examen médico-légal était une autre percée majeure. Les Parties se sont mis d’accord sur des examens médico-légaux obligatoires dans tous les cas de saisies impliquant 500 kg d’ivoire ou plus. En outre, on devrait envisager la mise en œuvre rétroactive de ce mandat, si possible, pour des saisies faites au cours des 24 derniers mois. TRAFFIC a toujours fait valoir le fait que l’examen médico-légal devrait être une procédure de routine pour toutes les saisies d’ivoire à grande échelle afin d’améliorer notre compréhension et notre connaissance des modes de braconnage, des routes commerciales et, finalement, des organisations criminelles derrière la contrebande. En ce qui concerne toutes les saisies de 500 kg ou plus entre 2009 et 2012, les données d’ETIS indiquent que l’origine de quelque 90 tonnes d’ivoire saisies demeure inconnue ou très discutable. Une mise en œuvre correcte comblerait cette lacune de façon efficace. Ce développement important devrait permettre à comprendre les rapports dans la chaîne du commerce illégal d’ivoire pour les cas de saisie de grands volumes dans les données d’ETIS à l’avenir.
Une autre réalisation importante a été la reconnaissance du fait que « la réduction de la demande » dans les

116 Pachyderm No. 53 January–June 2013
Milliken
Another important achievement was the recognition that ‘demand reduction’ in key consuming markets is a very important consideration for managing legal trade in ivory. The evidence is mounting that there is a pronounced need for consumer countries with legal ivory trade to embrace the concept of demand reduction wholeheartedly as extreme limitations exist in terms of the supply of elephant ivory that can be sourced legitimately. Left unfettered, demand for ivory inevitably fuels illegal trade as is presently the case in China. Thus, making demand reduction a legitimate requirement through CITES represents a major step forward. In fact, to support rhino conservation at CoP16, the Parties actually adopted a much stronger decision that calls upon ‘all Parties implicated in the illegal trade of rhinoceros horn as a range or consumer state, … should develop and implement long term demand reduction strategies or programs and [take] immediate actions aimed at reducing the illegal movement and consumption of rhino horn products, taking into consideration the draft demand reduction principles included in the Annex to document CoP16 Doc. 54.1 (Rev. 1), to achieve measurable change in consumer behaviour.’ With respect to demand reduction and ivory trade, the directive is less precise but nonetheless the approved text in Resolution Conf. 10.10 stands out as an important consideration going forward.
Another breakthrough was secured with respect to trade in live elephants. Until now, the ongoing and increasingly worrying trade in live Asian elephants has not been addressed in Resolution Conf 10.10, the so-called ‘elephant Resolution’. It is believed that, more than ivory trade, illegal capture from the wild is the single greatest trade threat to Asian elephants and this issue seriously affects the species in many parts of its distribution. Now, range States will be required to report on measures taken to prevent illegal trade in live captive elephants, an important move to support endangered populations that continue to be subjected to live animal trafficking. This foothold in Resolution Conf. 10.10 now provides a basis for highlighting live elephant trade issues at future CITES meetings. In the past, TRAFFIC has provided reports on this trade, including an investigation into the trafficking of live Asian
principaux marchés de consommation est un facteur très important pour la gestion du commerce légal de l’ivoire. Les preuves s’accumulent qu’il est très essentiel que les pays consommateurs ayant un commerce légal de l’ivoire adoptent de tout cœur le concept de réduction de la demande car il existe des restrictions extrêmes en termes d’approvisionnement d’ivoire d’éléphant dont on peut légitimement établir la source. Si elle n’est pas contrôlée, la demande pour l’ivoire inévitablement soutient le commerce illégal, comme c’est actuellement le cas en Chine. Ainsi, le fait de faire la réduction de la demande une obligation légitime de la CITES représente un grand pas en avant. En fait, pour soutenir la conservation des rhinocéros à la CdP16, les Parties ont adopté une décision beaucoup plus forte qui fait appel à « toutes les parties impliquées dans le commerce illégal de corne de rhinocéros en tant qu’état de l’aire de distribution ou de consommation, ... d’élaborer et mettre en œuvre des stratégies de réduction de la demande à long terme ou des programmes et de prendre des mesures immédiates visant à réduire la circulation illégale et la consommation de produits de cornes de rhinocéros, en prenant en considération le projet de principes de réduction de la demande figurant dans l’annexe du document CdP16 Doc. 54.1 (Rev. 1), pour obtenir un changement mesurable dans le comportement des consommateurs. » En ce qui concerne la réduction de la demande et du commerce de l’ivoire, la directive est moins précise ; néanmoins le texte approuvé dans la Résolution Conf. 10.10 constitue un facteur important pour l’avenir.
Une autre percée a été obtenue en ce qui concerne le commerce des éléphants vivants. Jusqu’à présent, le commerce continu et de plus en plus inquiétant des éléphants vivants en Asie n’a pas été abordé dans la Résolution Conf. 10.10, la soi-disant « Résolution sur l’éléphant ». On pense que, plus que le commerce de l’ivoire, la capture illégale dans la nature est la plus grande menace commerciale pour les éléphants d’Asie et ce problème affecte sérieusement l’espèce dans de nombreuses régions de l’aire de distribution. Maintenant, les Etats de l’aire de distribution seront tenus de faire rapport sur les mesures prises pour prévenir le commerce illégal des éléphants captifs vivants, un geste important pour soutenir les populations en voie de disparition qui continuent à être soumis à un trafic d’animaux vivants. Cette «prise» dans la Résolution Conf. 10.10 fournit désormais une base pour mettre en évidence les questions relatives au commerce d’éléphants vivants lors des prochaines réunions de la CITES. Dans le passé, TRAFFIC a fourni des rapports sur ce commerce, y
Pachyderm No. 53 January–June 2013 117
ETIS update
elephants from Myanmar into Thailand.And finally, the compliance measures that
were formerly articulated in CITES Decision 13.26, the ‘Action plan for the control of trade in African elephant ivory’, were incorporated in the revised Resolution Conf. 10.10 to embed the notion of accountability and erase any sense of ambiguity in this regard. The directive calls for the CITES Secretariat, on the basis of MIKE and ETIS findings, to identify Parties where illegal trade in ivory is ongoing, to seek explanation and information as to the causes and underlying issues behind such trade, to inform the Standing Committee and, where necessary, to invoke the provisions of Resolution Conf. 14.3 on ‘CITES compliance procedures’, which includes the possibility of trade sanctions.
In the final analysis, the CITES Parties have put some real teeth into Resolution Conf. 10.10 and elephant conservation under the Convention is now on a much stronger footing in the aftermath of Bangkok. Going forward, one can expect better transparency and understanding on a range of ivory trade fronts, the generation of new sources of data and information, and a stronger basis for holding governments accountable for their ivory trade policies and practices. Translating these positive CITES decisions into a major reduction in elephant poaching and illegal trade in ivory is now the overriding imperative.
compris une enquête sur le trafic d’éléphants d’Asie vivants à partir de Myanmar vers la Thaïlande.
Et enfin, les mesures de conformité qui étaient auparavant énoncés dans la décision de la CITES 13.26, ‘le Plan d’action pour le contrôle du commerce d’ivoire de l’éléphant d’Afrique’, ont été incorporées dans la Résolution Conf. 10.10 pour intégrer la notion de responsabilité et effacer tout sentiment d’ambiguïté à cet égard. Sur la base des conclusions de MIKE et ETIS, la directive fait appel au Secrétariat de la CITES, d’identifier les Parties où le commerce illégal de l’ivoire se pratique, de chercher des explications et des informations sur les causes et les facteurs qui sous-tendent ces échanges, d’informer le Comité permanent et, le cas échéant, d’invoquer les dispositions de la Résolution Conf. 14.3 sur « le respect des procédures de la CITES », ce qui inclut la possibilité de sanctions commerciales.
Dans l’analyse finale, les Parties à la CITES ont mis quelques vrais pouvoirs dans la Résolution Conf. 10.10 et la conservation de l’éléphant en vertu de la Convention est maintenant sur un pied beaucoup plus fort suivant la réunion de Bangkok. À l’avenir, on peut s’attendre à une plus grande transparence et compréhension sur plusieurs fronts concernant le commerce de l’ivoire, la génération de nouvelles sources de données et d’informations, et une base plus solide pour tenir les gouvernements responsables de leurs politiques et leurs pratiques de commerce de l’ivoire. La traduction de ces décisions positives de la CITES en une réduction importante du braconnage des éléphants et du commerce illégal de l’ivoire est maintenant une nécessité.

Guidelines for contributors
118 Pachyderm No. 53 January–June 2013
Aim and scopePachyderm publishes papers and notes concerning all aspects of the African elephant, the African rhino and the Asian rhino with a focus on the conservation and management of these species in the wild. At the same time, the journal is a platform for disseminating information concerning the activities of the African Elephant, the African Rhino, and the Asian Rhino Specialist Groups of the IUCN Species Survival Commission.
Submission of manuscriptsAll manuscripts should be submitted online at http://pachydermjournal.org
If there are any questions or concerns regarding the submission process, please send an email to: [email protected] or otherwise contact by post or telephone:
The Editor, PachydermIUCN/SSC AfESGPO Box 68200 – 00200Nairobi, Kenyatelephone: +254 20 249 3561/65fax: +254 20 2493570
Manuscripts are accepted in both English and French. Where possible, the abstract should be provided in both languages.
Pachyderm’s Editorial Board categorizes material received into the following sections:
Research and management papersThese should be not more than 5,000 words and be structures as follows: 1) Title, 2) Abstract of not more than 250 words (informative type, outlining information from the Introduction, Materials and methods, Results, Discussion, but not detailed results), 3) additional key words (if any), not appearing in the title, 4) Introduction, 5) Materials and methods, 6)
GUIDELINES FOR CONTRIBUTORS
Results, 7) Discussion, 8) Conclusions, if appropriate,9) Acknowledgements (optional, brief), 10) References (no more than 25), 11) Tables, 12) Figure and photo captions, 13) Figures and photos.
Papers may be reports of original biology research or they may focus more on the socio-economic aspects of conservation, including market surveys.
Field notesThe journal welcomes notes from the field. They may contain figures and tables but should be < 2,500 words.
Review papersReview papers, which are unbiased reviews of all the existing knowledge on a specific topic, are welcomed. Length should be < 6,000 words.
Book reviews
Pachyderm invites reviews of newly published books, which should be < 1500 words.
Letters to the editorLetters should be addressed to the relevant Specialist Group Chair and should be < 1,000 words. Letters are welcome that comment on articles published in Pachyderm or on any other issue relating to elephant and rhino conservation in the wild.
Preparation of manuscripts
Images, figures and mapsPreferably provide figures and maps in their original form, for example, charts and data in Excel files, maps as EPS and images in the highest quality possible, such as TIF (600 dpi). Indicate clearly the author or source of figures, maps and photographs.
Title and authorsThe title should contain as many of the key words as possible but should not be more than 25 words
Guidelines for Contributors
Pachyderm No. 53 January–June 2013 119
long. Follow with the name(s) of the author(s) with institutional affiliation and full postal and email address of the corresponding author, to whom proofs and editorial comments will be sent.
Journal conventions
NomenclatureUse common names of animals and plants, giving scientific names in italics on first mention. Generally refer to animals in the plural form (i.e. rhinos, elephants).
SpellingUse British spelling, following the latest edition of the Concise Oxford Dictionary or the Oxford English Dictionary, using ‘z’ instead of ‘s’ in words like recognize, organization, immobilized; but analyse, paralyse. The dictionary is available online at http://oed.com.
NumbersUse the International System of Units for measurement (m, km, g, ha, h) with a space between the numeral and the unit of measurement. Give measurements in figures, for example 12 mm, 1 km, 3 ha, except at the beginning of a sentence.
Spell out numbers under 10 if not a unit of meas- urement unless the number is part of a series contain- ing numbers 10 or over, for example: 14 adult males, 23 adult females and 3 juveniles.
In the text, use a comma as the separator for figures four digits or more: 1,750 and 11,750. The separator will be a full stop in French papers.
ReferencesWe use the name-year method of citing and listing references. As of this issue, the punctuation and typographic style we use are as advocated by the internationally recognized Council of Science Editors in its Scientific style and format, 7th edition.
In the text, cite a single author: (X 2005) or X (2005); cite two authors as (X and Y 2005) or X and Y (2005); cite more than two authors as (X et al. 2007) or X et al. (2007). Note that there is no comma between the author(s) and the year. If multiple works are being cited, separate them by a semicolon, listing them in
chronological order: (X et al. 1998; B 2002; Z 2010).In the reference list, punctuation is minimized.
Examples are drawn from previous issues of Pachyderm:
Article in a journal or periodicalBarnes RFW, Barnes KI, Alers MPT, Blom A. 1991.
Man determines the distribution of elephants in the rain forests of northeastern Gabon. African Journal of Ecology 29:54–63.
BookSmithers RHN.1983. Mammals of the southern African
sub-region. 2nd ed. Pretoria University, Pretoria.White I, Edwards A, editors. 2000. Conservation
research in the African rain forests: a technical handbook. Wildlife Conservation Society, New York.
Chapter in a bookBarnes RFW. 1996. Estimating forest elephant
abundance by dung counts. In: Kangwana K, editor. Studying elephants. AWF Technical Handbook no. 7. African Wildlife Foundation, Nairobi. p. 33–48.
Unpublished materialAdcock K. 2006. Estimates of black rhino carrying
capacity at Ol Pejeta’s new rhino area. Kenya Wildlife Service, Nairobi. Unpublished.
Blake S. 2002. The ecology of forest elephant distribution and its implications for conservation. PhD thesis. Institute of Cell, Animal and Population Biology, University of Edinburgh, Edinburgh.
Electronic siteElephants of Cameroon. 2000. Saving Africa’s
vanishing giants, the elephants of Cameroon. http://www.nczooeletrack.org/project/index.htm. Accessed 25 February 2000.
Verlinden A, Gavor IKN. 1998. Satellite tracking of elephants in northern Botswana. African Journal of Ecology 36:105–116. http://onlinelibrary.wiley.com/doi/10.1046/j.1365-2028.1998.00118.x/abstract.
Payne, J, Ahmad AH. 2012. A comment on ‘sex and the single rhinoceros’ by Henry Nichols. http://www.borneorhinoalliance.org