jacob canick, phd on behalf of the faster consortium 12 th international conference on prenatal...
TRANSCRIPT

Jacob Canick, PhDon behalf of the FASTER Consortium
12th International Conferenceon Prenatal Diagnosis and Therapy
Budapest
June 24-27, 2004
First and Second Trimester Screening Markers:
Results of the FASTER Trial

The Faster Consortium
• Mary D’Alton overall PI
• Fergal Malone co-PI • Nicholas Wald analysis
• Alicja Rudnicka analysis
• Allan Hackshaw analysis
• Jacob Canick laboratory
• Geralyn Messerlian lab
• Diana Bianchi fetal cells and fetal
outcome
• Kimberly Dukes data mgmt
• Robert Ball Intermountain Utah
• David Nyberg Swedish Med Ctr
• Christine Comstock Beaumont
• Radek Bukowski UT-Galveston
• Richard Berkowitz Mount Sinai
• Susan Gross Albert Einstein
• Lorraine Dugoff Univ Colorado
• Sabrina Craigo Tufts NE Med Ctr
• Ilan Timor NYU
• Stephen Carr Women & Infants
• Honor Wolfe UNC Chapel Hill
National Institute of Child Health and Human Development Grant RO1 HD 38652
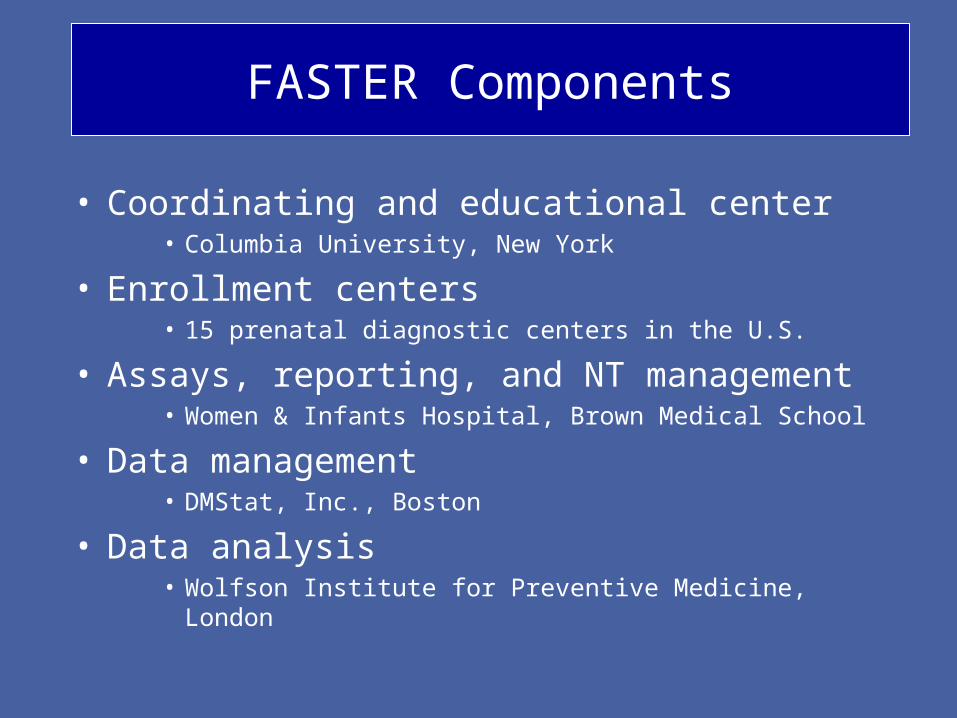
FASTER Components
• Coordinating and educational center• Columbia University, New York
• Enrollment centers• 15 prenatal diagnostic centers in the U.S.
• Assays, reporting, and NT management • Women & Infants Hospital, Brown Medical School
• Data management• DMStat, Inc., Boston
• Data analysis• Wolfson Institute for Preventive Medicine, London
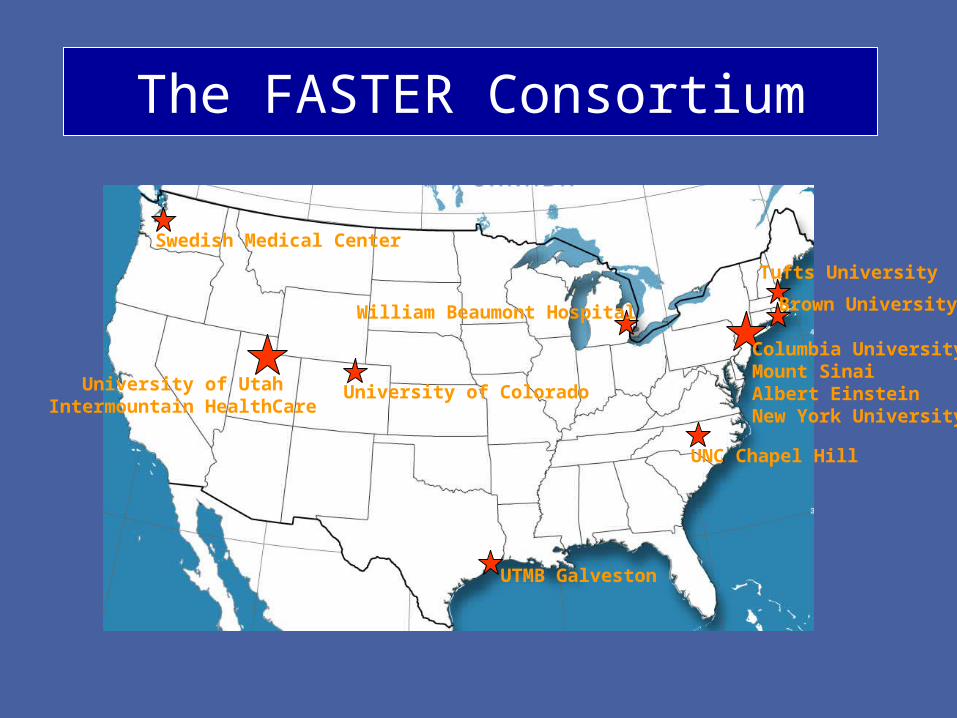
Swedish Medical Center
University of Colorado
UTMB Galveston
UNC Chapel Hill
William Beaumont Hospital
University of UtahIntermountain HealthCare
Columbia UniversityMount SinaiAlbert EinsteinNew York University
Tufts University
Brown University
The FASTER Consortium

OBJECTIVES
• To define performance of first trimester combined ultrasound and serum screening.
• To compare performance of first trimester combined screening and second trimester quad marker screening in the same women.
• To describe optimal combinations of tests for population-based Down syndrome screening.

STUDY DESIGN
• Prospective trial: intervention only after both 1st and 2nd trimester screening completed.
• A direct comparison is the only way to compare 1st and 2nd trimester screening fairly.
• Inclusion criteria:• Viable singleton pregnancy (≥ 16 yrs)• 103 – 136 weeks (CRL 36 – 79 mm)
• Exclusion criteria:• Anencephaly• Septated cystic hygroma

103 – 136 weeksNT / PAPP-A / fβhCG / Age
150 – 186 weeksAFP / hCG / uE3 / Inh-A / Age
First -Second -
First -Second +
First +Second -
First +Second +
Genetic CounselingAmniocentesis offered
Follow-Up(pregnancy / pediatric)
Karyotype(amnio / SAB / cord blood)
Septatedcystic hygroma

Nuchal Translucency Sonography
• 102 sonographers
• Initial uniform practical training
• Standard NT protocol
• > 50 images each to confirm technique
RESULTS• These results were reported at the Society for
Maternal Fetal Medicine annual meeting, held in New Orleans in February 2004.
• The results are from an interim analysis.
• Final data analysis has now been completed, and the principal findings of the FASTER Trial are being prepared for publication.
• The performance estimates will be slightly different in the final analysis.

42,367 Evaluated
134 Cystic Hygroma
38,033 First Trimester Screening
4,178 Ineligible*
22 Anencephaly
RESULTS
38,189 Eligible
35,244 Second Trimester Screening (93%)
*Ineligible due to: CRL outside range (2636); multiple (896); <16 years (357); refused (203); other (69)
2,789 No quad sample

Completeness of Ascertainment
Pregnancies enrolled 38,189
Outcome obtained (n) 37,002
Outcome obtained (%) 97%
Downs expected* 112
Downs observed 117
* Estimates based on maternal age distribution of enrolled patients, and 23% loss rate from 16 - 40 wks

Maternal Age Distribution*
• Mean = 30.1 years• SD = 5.8 years• Range = 16 – 53 years
21.6%
78.4%
< 35
≥ 35
* Maternal age in years at Estimated Date of Delivery

Maternal Race Distribution
Other (2%)Asian (4%)
African-American (5%)
Hispanic (22%)
Caucasian (67%)

Down Syndrome Screening PerformanceDirectly Observed Results
1. Combined First Trimester ScreenNT / PAPP-A / fβhCG / age
2. Second Trimester Serum ScreenAFP / hCG / uE3 / Inhibin-A / age
3. Integrated 1st and 2nd Trimester ScreenI. SERUM: PAPP-A / AFP / hCG / uE3 / Inh-A / age
II. FULL: NT / PAPP-A / AFP / hCG / uE3 / Inh-A / age
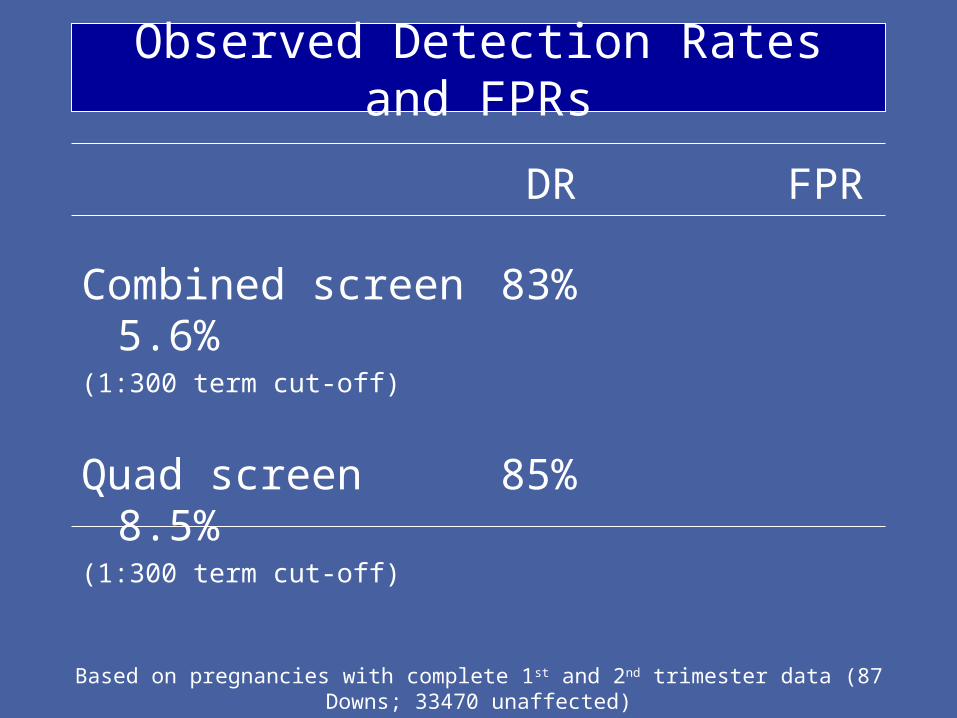
Observed Detection Rates and FPRs
DR FPR
Combined screen 83%5.6%
(1:300 term cut-off)
Quad screen 85%8.5%
(1:300 term cut-off)
Based on pregnancies with complete 1st and 2nd trimester data (87 Downs; 33470 unaffected)

Combined Versus Quad ScreeningWhich is better?
p = 0.7
Discordant pairs analysis:
No significant difference.

Cystic Hygroma Outcome134 Cases (1 : 285 Pregnancies)
50% Aneuploidy (n=67):• 37% Down (n=25)• 28% Turner (n=19)• 20% Trisomy 18 (n=13)• 15% Other (n=10)
50% Euploid (n=67):• 32% Cardiac anomaly (n=21)• 12% Skeletal anomaly (n=8)• 10% Fetal demise (n=7)• 46% “Normal” (n=31)

Observed Detection Rates and FPRs
DR FPR
Combined screen 83% 5.6%(1:300 term cut-off)
Combined screen 87% 5.6%With hygromas (1:300 term cut-off)
Quad screen 85% 8.5%(1:300 term cut-off)
Based on pregnancies with complete 1st and 2nd trimester data (87 Downs; 33470 unaffected)

• Developed by Nick Wald in 1999.
• The integration of the best tests performed at different times in pregnancy into a single test.
• A single risk is estimated after the two parts of the test have been completed.
0 13 26 40 PAPP-A quad test = SERUM INTEGRATED NT+PAPP-A quad test = FULL INTEGRATED
(weeks)
Integrate results into a single risk
Other Combinations of Markers:The Integrated Test

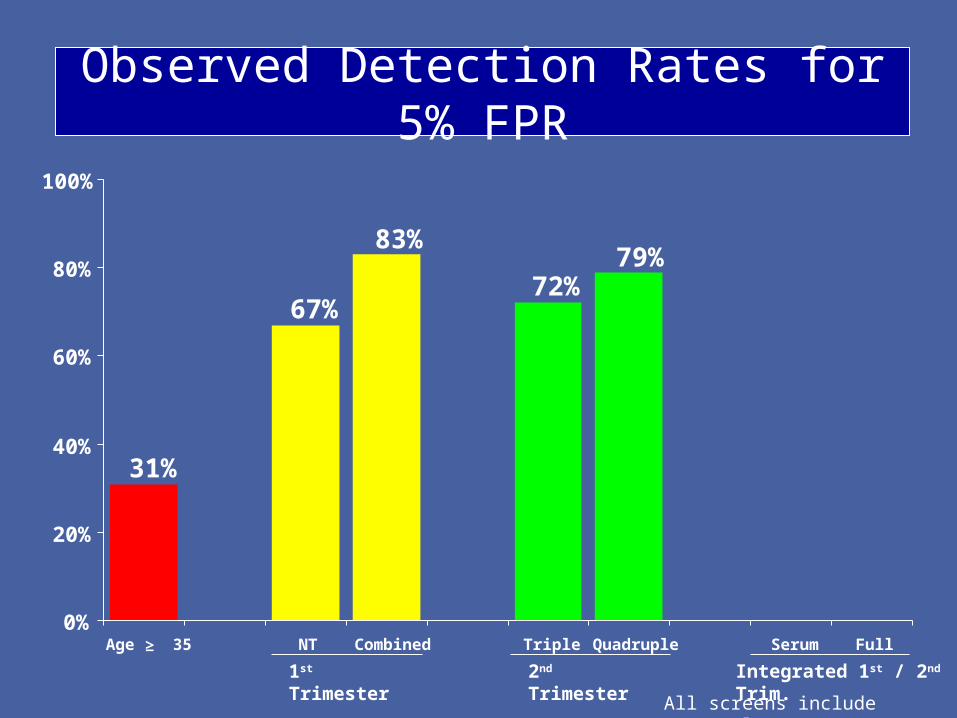
Observed Detection Rates for 5% FPR
1st Trimester Integrated 1st / 2nd Trim.2nd Trimester
All screens include maternal age
≥
31%
0%
20%
40%
60%
80%
100%
Age 35 NT Combined Triple Quadruple Serum Full

Observed Detection Rates for 5% FPR
1st Trimester Integrated 1st / 2nd Trim.2nd Trimester
All screens include maternal age
≥
67%
83%
31%
0%
20%
40%
60%
80%
100%
Age 35 NT Combined Triple Quadruple Serum Full
Observed Detection Rates for 5% FPR
1st Trimester Integrated 1st / 2nd Trim.2nd Trimester
All screens include maternal age
≥
67%72%
79%83%
31%
0%
20%
40%
60%
80%
100%
Age 35 NT Combined Triple Quadruple Serum Full

Observed Detection Rates for 5% FPR
1st Trimester Integrated 1st / 2nd Trim.2nd Trimester
All screens include maternal age
≥
67%72%
84%88%
79%83%
31%
0%
20%
40%
60%
80%
100%
Age 35 NT Combined Triple Quadruple Serum Full

1st Trimester Integrated 1st / 2nd Trim.2nd Trimester
All screens include maternal age
Observed FPR for 85% Detection Rate
7.6%
17.4%
0%
5%
10%
15%
20%
NT Combined Triple Quadruple Serum Full

1st Trimester Integrated 1st / 2nd Trim.2nd Trimester
All screens include maternal age
Observed FPR for 85% Detection Rate
7.2%
11.5%
7.6%
17.4%
0%
5%
10%
15%
20%
NT Combined Triple Quadruple Serum Full

1st Trimester Integrated 1st / 2nd Trim.2nd Trimester
All screens include maternal age
Observed FPR for 85% Detection Rate
2.4%
5.5%7.2%
11.5%
7.6%
17.4%
0%
5%
10%
15%
20%
NT Combined Triple Quadruple Serum Full

Down Syndrome PregnanciesFirst Trimester Median MoMs
Completed week
11 12 13
NT 2.20 1.75 1.39
PAPP-A 0.30 0.49 0.78
fβhCG 1.66 2.03 2.49
Calculated from linear regression of individual Downs cases

Using these data and applying them
to the U.S. population of pregnancies,
the following results were obtained:
Down Syndrome Screening Performance

NT alone
Quad
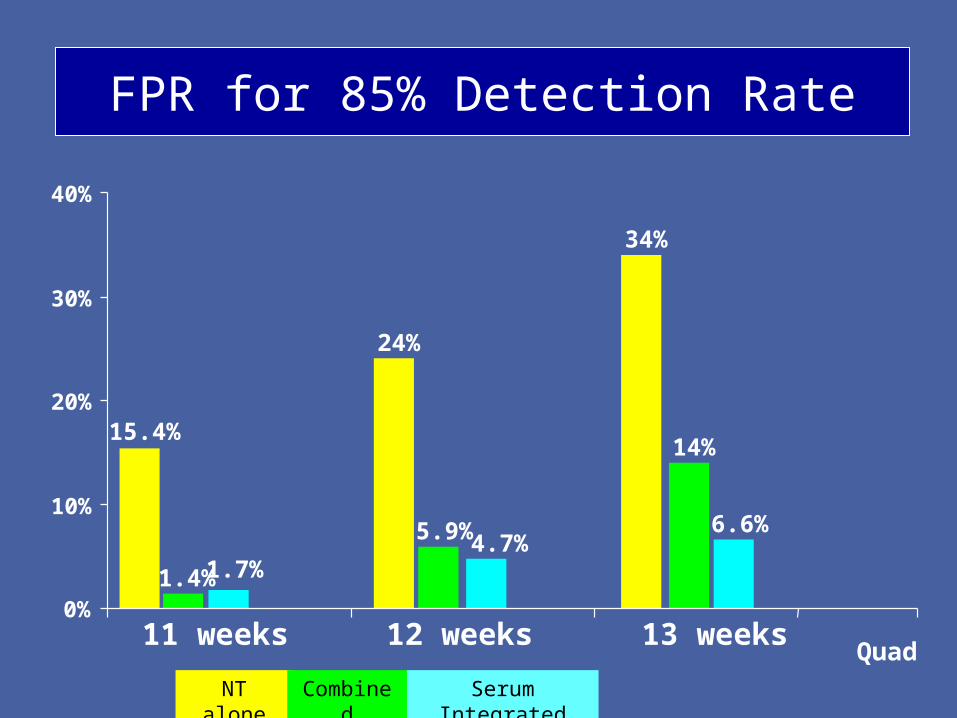
FPR for 85% Detection Rate
24%
34%
15.4%
0%
10%
20%
30%
40%
11 weeks 12 weeks 13 weeks

NT alone Combined
Quad
FPR for 85% Detection Rate
24%
34%
1.4%
5.9%
14%15.4%
0%
10%
20%
30%
40%
11 weeks 12 weeks 13 weeks
NT alone Combined
Quad
FPR for 85% Detection Rate
Serum Integrated
24%
34%
1.4%
5.9%
14%
1.7%4.7%
6.6%
15.4%
0%
10%
20%
30%
40%
11 weeks 12 weeks 13 weeks

NT alone Combined
Quad
FPR for 85% Detection Rate
Serum Integrated Full Integrated
24%
34%
1.4%
5.9%
14%
1.7%4.7%
6.6%
0.2% 0.8%3%
15.4%
0%
10%
20%
30%
40%
11 weeks 12 weeks 13 weeks

NT alone Combined
Quad
FPR for 85% Detection Rate
Serum Integrated Full Integrated
24%
34%
1.4%
5.9%
14%
1.7%4.7%
6.6%
0.2% 0.8%3%
15.4%
7.6%
0%
10%
20%
30%
40%
11 weeks 12 weeks 13 weeks

CONCLUSIONS
• 1st trimester combined and 2nd trimester quad screening are similarly effective .
• The Integrated test performs better than either the 1st or 2nd trimester screening methods.
• 1st trimester markers vary by gestational age. Algorithms should account for these gestational age effects.

ACKNOWLEDGMENTS
• Columbia: K. Welch, R. Denchy, K. Berentsen
• Univ Utah: F. Porter, L. Cannon, K. Nelson, C. Loucks, A. Yoshimura
• Swedish: D. Luthy, S. Coe
• Beaumont: D. Schmidt, J. Esler
• UTMB: G. Saade, G. Hankins, J. Lee
• Mount Sinai: K. Eddleman, Y. Kharbutli
• Montefiore: I. Merkatz, S. Carter
• U Colorado: J. Hobbins, L. Schultz
• Tufts U: B. Isquith, B. Berlin
• NYU: M. Paidas, J. Borsuk
• Brown U: C. Duquette
• UNC: R. Baughman
• DM-STAT: D. Emig, T. Tripp, J. Vidaver, L. Sullivan, N. Tibbetts, P. Folan
• NICHD: J. Hanson, D. Alexander, F. de la Cruz
• ….. and all 102 sonographers who participated