it service management metrics benchmarks: 2013 update · 2016-01-25 · it service management...
TRANSCRIPT
IT Service Management Metrics Benchmarks: 2013 Update
A Report From The Pink Elephant IT Management Metrics Benchmark Service
www.pinkelephant.com 2
The Pink Elephant IT Management Metrics Benchmark Service collects, analyzes and presents IT management metrics benchmarks. This Incident, Problem and Change Management Metrics Benchmarks update presents an analysis of voluntary survey responses by IT managers across the globe since early 2010. The surveys have thus far been limited to simpler metrics and the processes most broadly practiced. This year’s report includes a statistical profile of the survey respondents. Key points in this analysis: Incident Management: The number of Incidents is most influenced by (in order of influence): 1. The size of an IT organization — measured by quantity of IT Full Time Equivalent
workers (FTEs) of all kinds – (employees, contractors and direct service providers’ workers).
2. The number of users (opportunities to dissatisfy) and the number of years that formal Incident Management has been in practice (incident capture strength).
It is becoming clearer that organizations with more formal Incident Management (indicated by the presence of IM SLAs) enjoy a markedly higher proportion of Incidents resolved within expectations. Problem Management: The number of Problems added every month has nearly doubled to exceed the Active Problems already in progress (Problem WIP). This implies that the exit rate (rate at which Problems get resolved – or at least closed) has not kept pace with the new Problems recorded every month. The 3.7 month average problem average age at closure implies that newer Problems are being closed very quickly – perhaps too quickly – while older Problems remain.
Change Management: Organizations that process RFCs without experiencing any issues tend to have more Changes that are executed correctly the first time. However, it appears that at some point, the longer an RFC is open, the lower the Right First Time rate. This may reflect the Lean “waste of waiting” observation. This is an update on the Pink Elephant IT Management Metrics Benchmarks Service. Please submit or update your organization’s data! The more participants the better! Links to the surveys are online at https://www.pinkelephant.com/MetricsSurvey/. We welcome comments and feedback. Please comment on this white paper at the blog post to let us know what you think, or write us at [email protected].
www.pinkelephant.com 3
1 Incident Management…………………………………………………………………………………………….5
2 Incident Management Respondent Profile………………………………………………....…..……11
3 Problem Management………………………………………………………………………..…………….…..13
4 Problem Management Respondent Profile …………….…………………………..……………….18
5 Change Management……………………………….…………………………………………….………..….20
6 Change Management Respondent Profile……………………………………………..………...….25
www.pinkelephant.com 4

Incidents Per Month (Incident Rate):
Although the total number of Incidents metric still varies widely, the average declined by 5% from the average of the 2010-2012 survey responses. The size of the IT organization (measured by the number of IT FTEs) has an even stronger relationship with Incident Rate: a positive correlation factor of .49.
M1. In a typical month, how many Incidents are closed in your organization?
0 - 1,000 1,001 - 5,000 5,001 - 10,000 10,001 - 20,000 More than
20,000 na
40% 30% 13% 6% 7% 3%
0 -
1,0
00
1,0
01 -
5000
5,0
01 -
10,0
00
10,0
01-
20,0
00
More
than 2
0,0
00
M1.
In a
typ
ical m
onth
how
many
Incid
ents
are
clo
sed in
your
org
aniz
ation?
Incident Quantity/Month Distribution Average: 5,785
na
www.pinkelephant.com 5
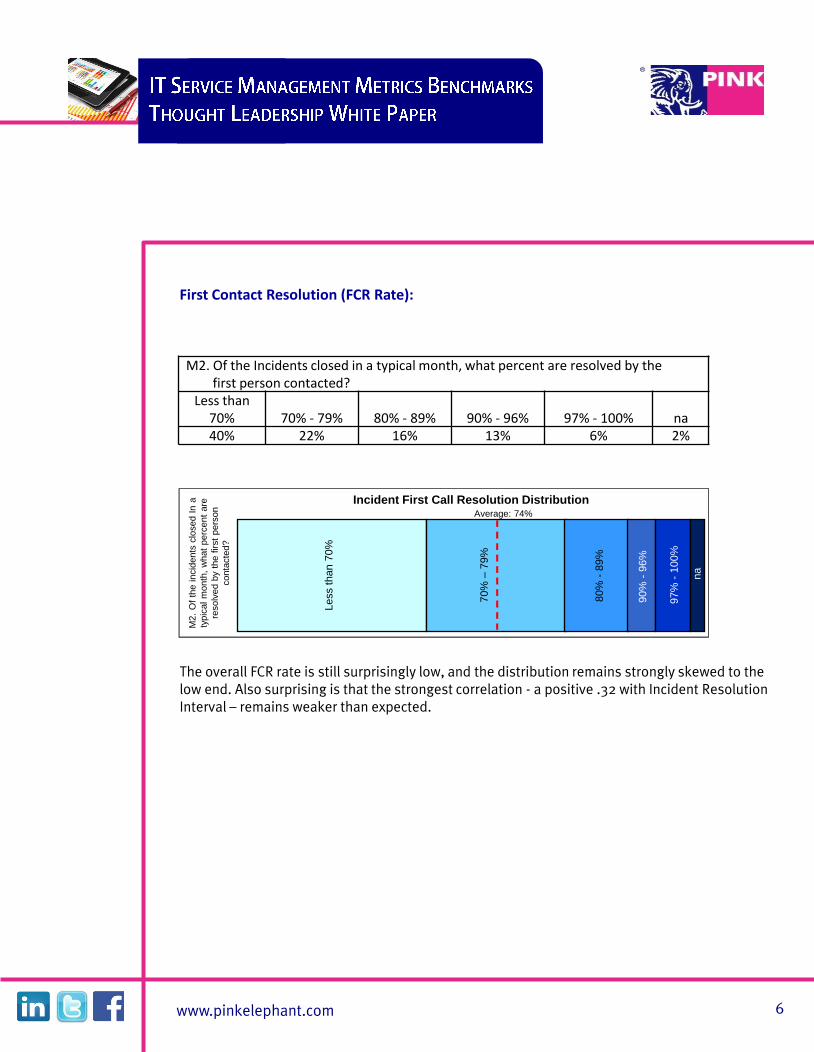
First Contact Resolution (FCR Rate):
The overall FCR rate is still surprisingly low, and the distribution remains strongly skewed to the low end. Also surprising is that the strongest correlation - a positive .32 with Incident Resolution Interval – remains weaker than expected.
www.pinkelephant.com 6
Less than 7
0%
70%
– 7
9%
80%
- 8
9%
90%
- 9
6%
97%
- 1
00%
M2.
Of
the incid
ents
clo
sed I
n a
typic
al m
onth
, w
hat
perc
ent
are
resolv
ed b
y th
e f
irst
pers
on
conta
cte
d?
Incident First Call Resolution Distribution Average: 74%
na
M2. Of the Incidents closed in a typical month, what percent are resolved by the first person contacted?
Less than 70% 70% - 79% 80% - 89% 90% - 96% 97% - 100% na 40% 22% 16% 13% 6% 2%
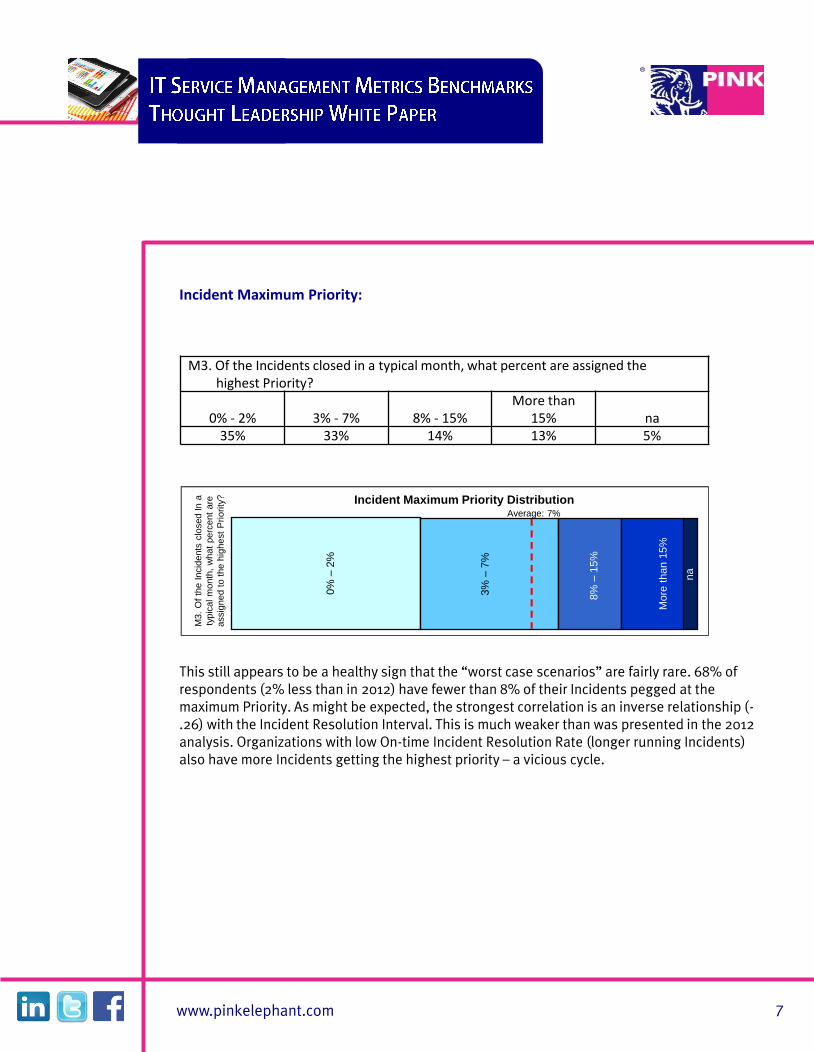
Incident Maximum Priority:
This still appears to be a healthy sign that the “worst case scenarios” are fairly rare. 68% of respondents (2% less than in 2012) have fewer than 8% of their Incidents pegged at the maximum Priority. As might be expected, the strongest correlation is an inverse relationship (-.26) with the Incident Resolution Interval. This is much weaker than was presented in the 2012 analysis. Organizations with low On-time Incident Resolution Rate (longer running Incidents) also have more Incidents getting the highest priority – a vicious cycle.
www.pinkelephant.com 7
0%
– 2
%
3%
– 7
%
8%
– 1
5%
M3.
Of
the I
ncid
ents
clo
sed In a
typic
al m
onth
, w
hat
perc
ent
are
assig
ned t
o t
he h
ighest
Priority
?
Incident Maximum Priority Distribution Average: 7%
na
M3. Of the Incidents closed in a typical month, what percent are assigned the highest Priority?
0% - 2% 3% - 7% 8% - 15% More than
15% na 35% 33% 14% 13% 5%
More
than 1
5%
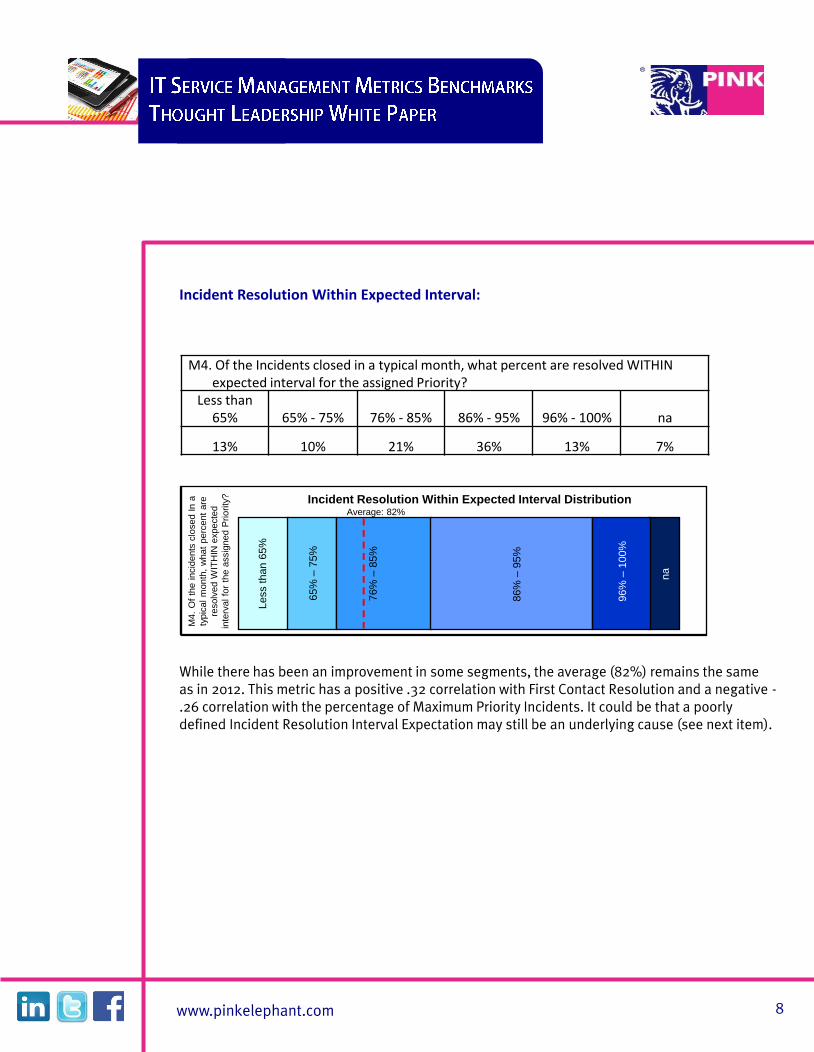
Incident Resolution Within Expected Interval:
While there has been an improvement in some segments, the average (82%) remains the same as in 2012. This metric has a positive .32 correlation with First Contact Resolution and a negative -.26 correlation with the percentage of Maximum Priority Incidents. It could be that a poorly defined Incident Resolution Interval Expectation may still be an underlying cause (see next item).
www.pinkelephant.com 8
0 –
2%
M4.
Of
the incid
ents
clo
sed I
n a
typic
al m
onth
, w
hat
perc
ent
are
resolv
ed W
ITH
IN e
xpecte
d
inte
rval fo
r th
e a
ssig
ned P
riority
?
Incident Resolution Within Expected Interval Distribution Average: 82%
na
More
than 1
5%
M4. Of the Incidents closed in a typical month, what percent are resolved WITHIN expected interval for the assigned Priority?
Less than 65% 65% - 75% 76% - 85% 86% - 95% 96% - 100% na
13% 10% 21% 36% 13% 7%
86%
– 9
5%
76%
– 8
5%
65%
– 7
5%
Less than 6
5%
96%
– 1
00%
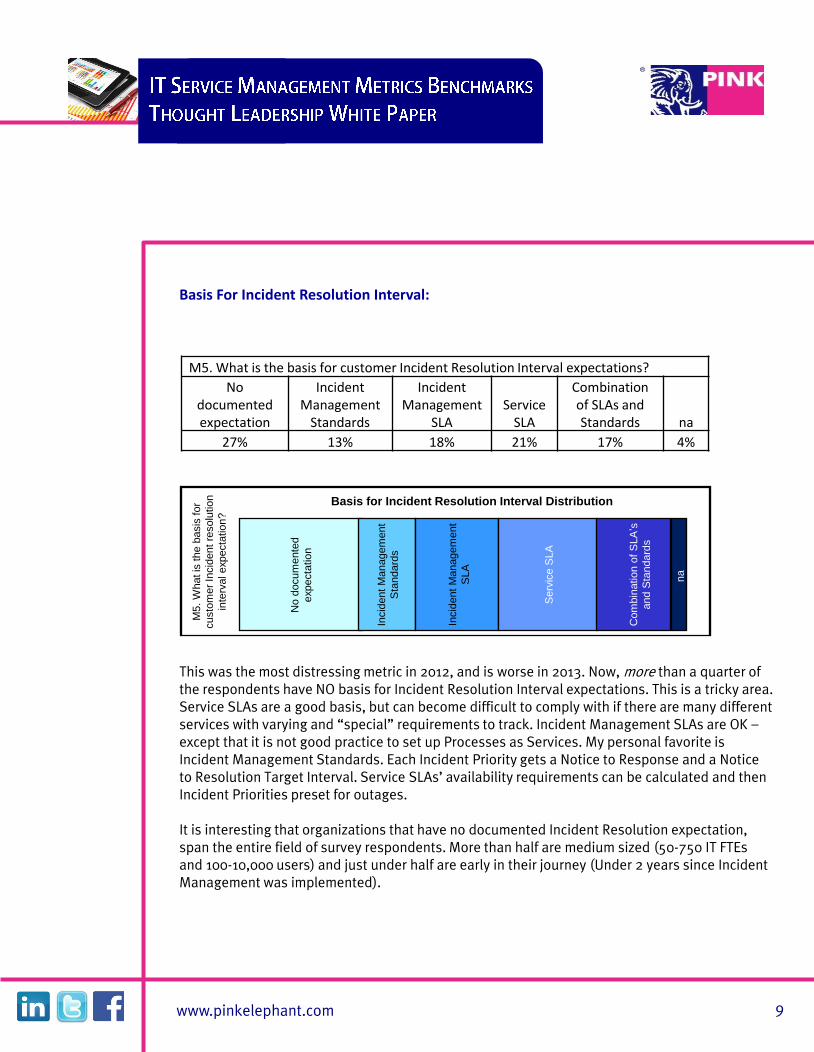
Basis For Incident Resolution Interval:
This was the most distressing metric in 2012, and is worse in 2013. Now, more than a quarter of the respondents have NO basis for Incident Resolution Interval expectations. This is a tricky area. Service SLAs are a good basis, but can become difficult to comply with if there are many different services with varying and “special” requirements to track. Incident Management SLAs are OK – except that it is not good practice to set up Processes as Services. My personal favorite is Incident Management Standards. Each Incident Priority gets a Notice to Response and a Notice to Resolution Target Interval. Service SLAs’ availability requirements can be calculated and then Incident Priorities preset for outages. It is interesting that organizations that have no documented Incident Resolution expectation, span the entire field of survey respondents. More than half are medium sized (50-750 IT FTEs and 100-10,000 users) and just under half are early in their journey (Under 2 years since Incident Management was implemented).
www.pinkelephant.com 9
M5.
What is
the b
asis
for
custo
mer
Incid
ent
resolu
tio
n
inte
rval expecta
tio
n?
Basis for Incident Resolution Interval Distribution
No d
ocum
ente
d
expecta
tio
n
Serv
ice S
LA
Incid
ent
Managem
ent
Sta
ndard
s
Incid
ent
Managem
ent
SLA
M5. What is the basis for customer Incident Resolution Interval expectations?
No documented expectation
Incident Management
Standards
Incident Management
SLA Service
SLA
Combination of SLAs and Standards na
27% 13% 18% 21% 17% 4%
Com
bin
atio
n o
f S
LA
’s
and S
tandard
s
na

The impact of experience with a process and continual improvement: The breadth and depth of the Incident Management data provides the following Incident Management metrics averages for “years of experience” (which also indicates the minimum age of the IT organization). We should soon have the same breadth and depth for the Problem and Change metrics:
The responses by the number of users and/or IT FTEs (IT organization size indicator) have been less broad. As the population of the database grows, reliable implications of these factors will be analyzed and provided.
A1. How long ago was Incident Management first implemented in your organization?
Metrics Question
Data Collected
2010-x
Less than 2 years
ago
2 - 4 years ago
4 - 6 years ago
6 - 10 years ago
More than 10 years ago
Corr.
M1. In a typical month how many Incidents are closed in your organization?
2012 3,391 5,479 6,474 9,500 12,438
2013 2,817 4,516 8,760 9,941 11,111 .29
M2. Of the Incidents closed in a typical month what percent are resolved by the first person contacted?
2012 76.5% 72.8% 75.9% 64.2% 78.3%
2013 76.3% 73.2% 73.9% 68.0% 76.2% -.07
M3. Of the Incidents closed in a typical month what percent are assigned the highest Priority?
2012 8% 4% 7% 5% 5%
2013 9% 4% 6% 5% 6% -.26
M4. Of the Incidents closed in a typical month what percent are resolved WITHIN expected interval for the assigned Priority?
2012 81% 83% 80% 90% 74%
2013 81% 83% 79% 89% 76% -.02
M5. What is the basis for customer Incident resolution interval expectations?
2012 IM Std. IM SLA IM SLA IM SLA IM SLA
2013 IM SLA IM SLA IM SLA IM SLA IM SLA
www.pinkelephant.com 10

Incident Management Process Age: A1. How long ago was Incident Management first implemented in your organization?
IT User Community Size: A2. How many people are using your IT services during peak periods? (Please include estimated internet users)
IT Organization Size: A3. How many Full-Time Equivalent (FTE) people in the IT organization are providing the IT
services?(Please include all staff management contractors sourced headcount regardless of location etc.)
Less than 2 years ago
2 - 4 years ago
4 - 6 years ago
6 - 10 years ago
More than 10 years ago
na
31% 24% 19% 13% 7% 7%
Less than
20
20 - 100
100 - 1,000
1,000 - 10,000
10,000 - 25,000
25,000 - 100,000
100,000 - 300,000
More than
300,000 na
3% 7% 25% 30% 15% 8% 2% 3% 7%
Less than 5 5 - 10 11 - 50 51 - 100
101 - 250
251 - 750
751 - 1,500
More than 1,500 na
3% 9% 15% 18% 16% 17% 4% 9% 10%
www.pinkelephant.com 11
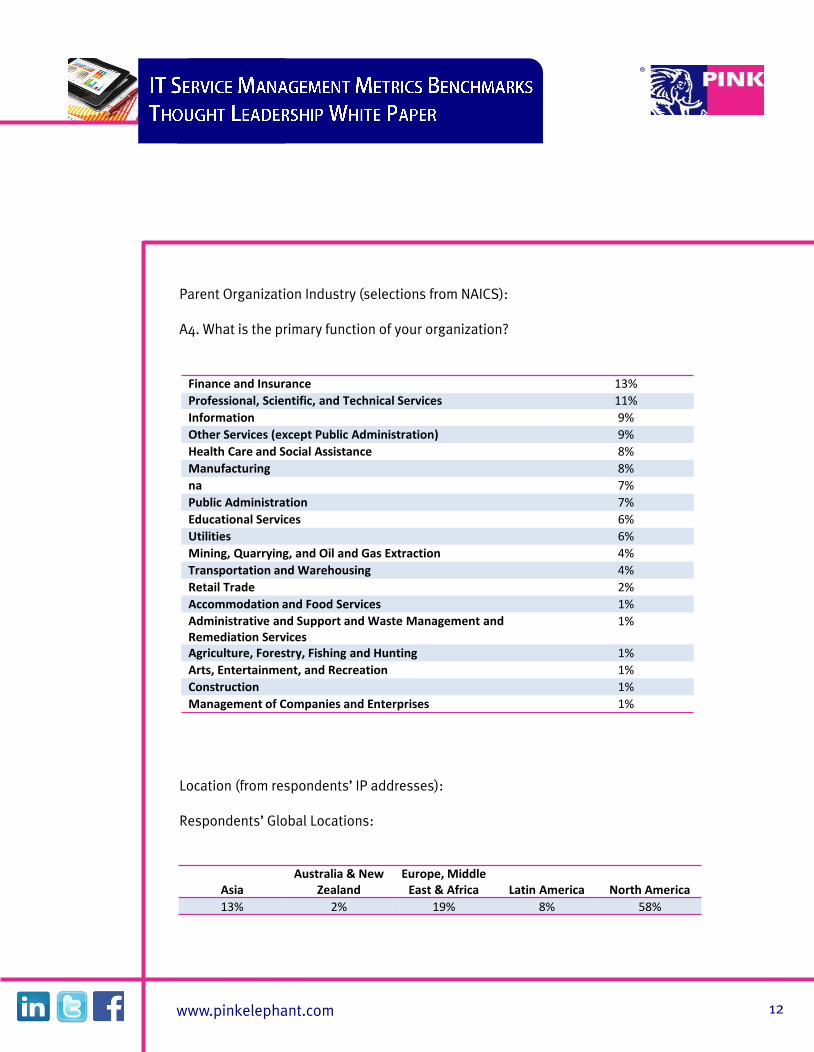
Parent Organization Industry (selections from NAICS): A4. What is the primary function of your organization?
Location (from respondents’ IP addresses): Respondents’ Global Locations:
www.pinkelephant.com 12
Finance and Insurance 13%
Professional, Scientific, and Technical Services 11%
Information 9%
Other Services (except Public Administration) 9%
Health Care and Social Assistance 8%
Manufacturing 8%
na 7%
Public Administration 7%
Educational Services 6%
Utilities 6%
Mining, Quarrying, and Oil and Gas Extraction 4%
Transportation and Warehousing 4%
Retail Trade 2%
Accommodation and Food Services 1%
Administrative and Support and Waste Management and Remediation Services
1%
Agriculture, Forestry, Fishing and Hunting 1%
Arts, Entertainment, and Recreation 1%
Construction 1%
Management of Companies and Enterprises 1%
Asia
Australia & New Zealand
Europe, Middle East & Africa Latin America North America
13% 2% 19% 8% 58%
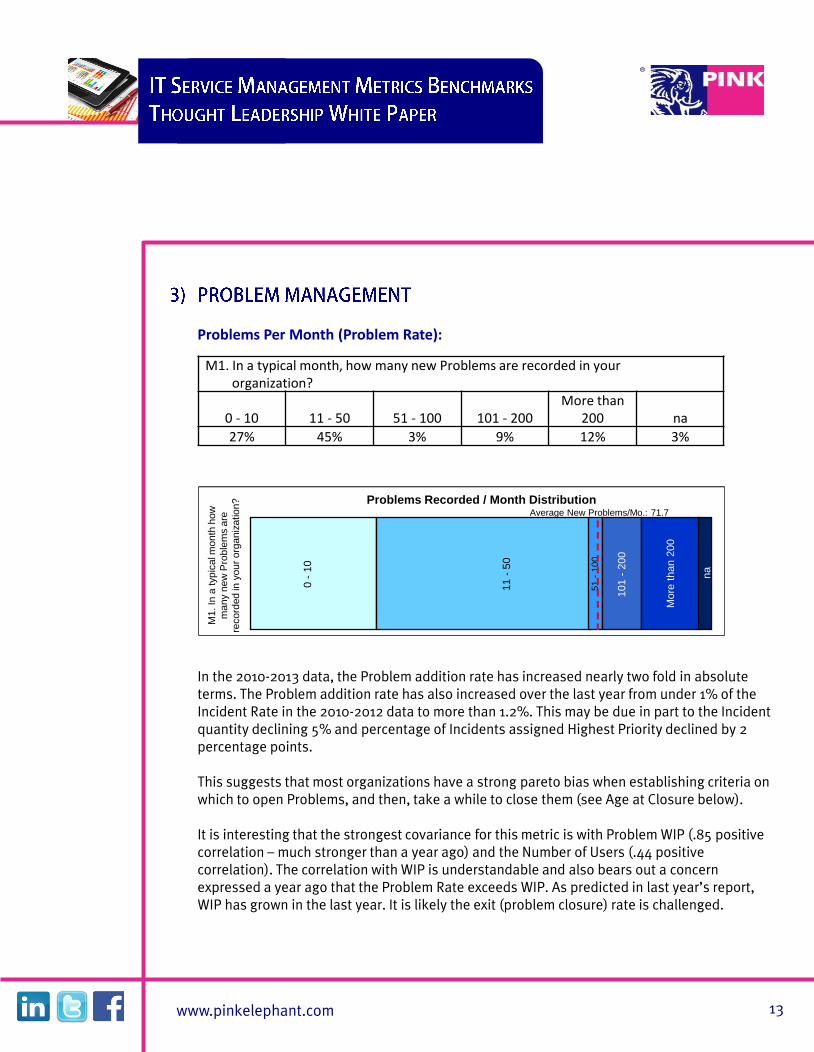
Problems Per Month (Problem Rate):
In the 2010-2013 data, the Problem addition rate has increased nearly two fold in absolute terms. The Problem addition rate has also increased over the last year from under 1% of the Incident Rate in the 2010-2012 data to more than 1.2%. This may be due in part to the Incident quantity declining 5% and percentage of Incidents assigned Highest Priority declined by 2 percentage points. This suggests that most organizations have a strong pareto bias when establishing criteria on which to open Problems, and then, take a while to close them (see Age at Closure below). It is interesting that the strongest covariance for this metric is with Problem WIP (.85 positive correlation – much stronger than a year ago) and the Number of Users (.44 positive correlation). The correlation with WIP is understandable and also bears out a concern expressed a year ago that the Problem Rate exceeds WIP. As predicted in last year’s report, WIP has grown in the last year. It is likely the exit (problem closure) rate is challenged.
www.pinkelephant.com 13
0 -
10
11 -
50
51 -
100
101 -
200
More
than 2
00
M1. In
a typic
al m
onth
how
ma
ny n
ew
Pro
ble
ms a
re
reco
rded
in y
ou
r o
rga
niz
atio
n?
Problems Recorded / Month Distribution Average New Problems/Mo.: 71.7
na
M1. In a typical month, how many new Problems are recorded in your organization?
0 - 10 11 - 50 51 - 100 101 - 200
More than 200 na
27% 45% 3% 9% 12% 3%
There is ample anecdotal evidence that Known Error mitigations compete poorly against other opportunities in Project Portfolio prioritization negotiations. The alternative — raising the Problem initiation threshold criteria, may have been tried. In any event, the Problem backlog appears to be growing.
The correlation of Problems added with the number of users may be as simple as this: the number of users drives a larger set of discrete systems and applications – and therefore more discrete points of failure or unique errors at the root of more problems.
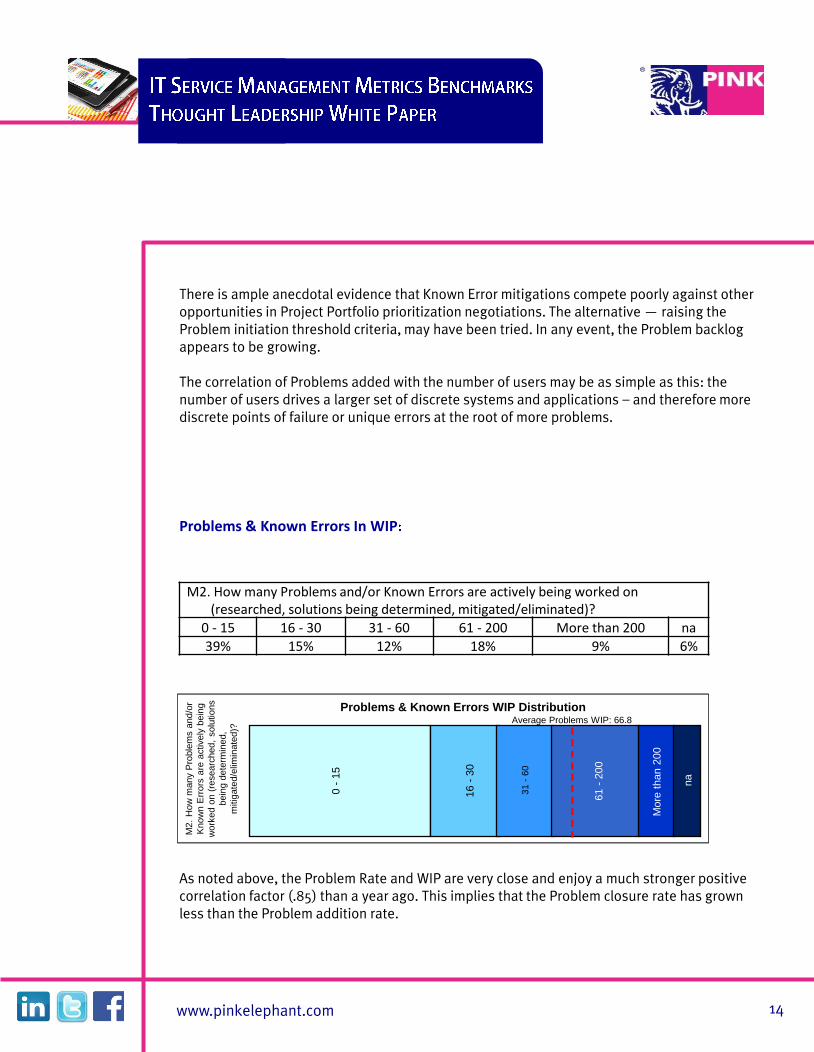
Problems & Known Errors In WIP
As noted above, the Problem Rate and WIP are very close and enjoy a much stronger positive correlation factor (.85) than a year ago. This implies that the Problem closure rate has grown less than the Problem addition rate.
www.pinkelephant.com 14
0 -
15
16 -
30
31 -
60
61 -
200
More
than 2
00
M2.
How
many
Pro
ble
ms a
nd/o
r
Know
n E
rrors
are
actively
bein
g
work
ed o
n (
researc
hed
, solu
tions
bein
g d
ete
rmin
ed,
mitig
ate
d/e
limin
ate
d)?
Problems & Known Errors WIP Distribution Average Problems WIP: 66.8
na
M2. How many Problems and/or Known Errors are actively being worked on (researched, solutions being determined, mitigated/eliminated)?
0 - 15 16 - 30 31 - 60 61 - 200 More than 200 na
39% 15% 12% 18% 9% 6%

Problems Assigned Highest Priority:
At 7.9% of Problems assigned highest Priority, this also compares closely with Incident Management’s 7% Maximum Priority average. The strongest positive correlations are with the Number of Users and New Problems per month per User and per FTE. In a change from 2012, the strongest negative correlation moved to Number of Problems without Known Errors from 2012’s Number of Years since Problem Management was implemented and the size of the IT organization (measured in IT FTEs). This metric may also indicate that Problem Management is being practiced like Risk Management – which is a good model for Problem Management. In Risk Management, the priority is a function of the Risk Exposure: the business impact in lost business cost and recovery cost per occurrence times the probable number of occurrences per year.
www.pinkelephant.com 15
M3.
Of
the P
roble
ms a
nd K
now
n
Err
ors
bein
g w
ork
ed o
n,
what
perc
ent
of
them
are
assig
ned t
he
hig
hest
Priority
?
Problems Assigned Highest Priority Distribution Average: 7.9% @ Highest Priority
na
More
than 1
5%
8%
- 1
5%
3%
- 7
%
0%
- 2
%
More
than 1
5%
M3. Of the Problems and Known Errors being worked on, what percent of them are assigned the highest Priority?
0% - 2% 3% - 7% 8% - 15%
More than 15% na
33% 21% 15% 18% 12%
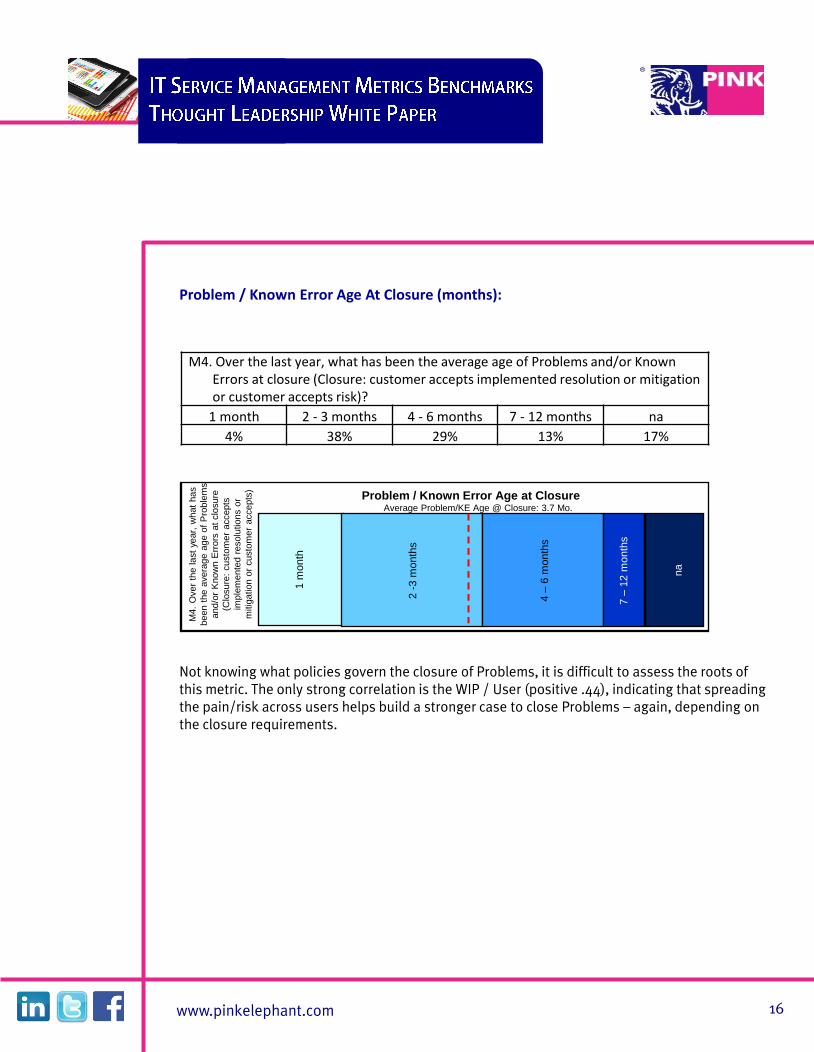
Problem / Known Error Age At Closure (months):
Not knowing what policies govern the closure of Problems, it is difficult to assess the roots of this metric. The only strong correlation is the WIP / User (positive .44), indicating that spreading the pain/risk across users helps build a stronger case to close Problems – again, depending on the closure requirements.
www.pinkelephant.com 16
M4.
Over
the last
year,
what
has
been t
he a
vera
ge a
ge o
f P
roble
ms
and/o
r K
now
n E
rrors
at
clo
sure
(Clo
sure
: custo
mer
accepts
imple
mente
d r
esolu
tions o
r
mitig
ation o
r custo
mer
accepts
)
Problem / Known Error Age at Closure Average Problem/KE Age @ Closure: 3.7 Mo.
na
More
than 1
5%
4 –
6 m
onth
s
2 -
3 m
onth
s
1 m
onth
7 –
12 m
onth
s
M4. Over the last year, what has been the average age of Problems and/or Known Errors at closure (Closure: customer accepts implemented resolution or mitigation or customer accepts risk)?
1 month 2 - 3 months 4 - 6 months 7 - 12 months na
4% 38% 29% 13% 17%
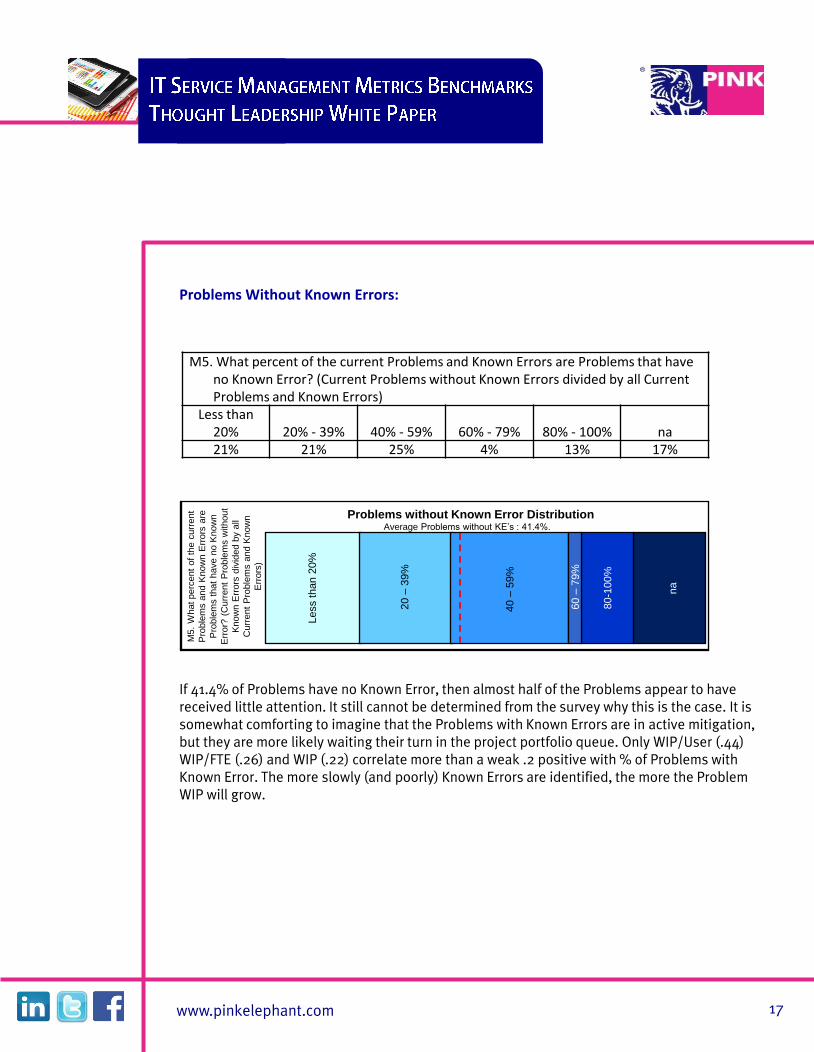
Problems Without Known Errors:
If 41.4% of Problems have no Known Error, then almost half of the Problems appear to have received little attention. It still cannot be determined from the survey why this is the case. It is somewhat comforting to imagine that the Problems with Known Errors are in active mitigation, but they are more likely waiting their turn in the project portfolio queue. Only WIP/User (.44) WIP/FTE (.26) and WIP (.22) correlate more than a weak .2 positive with % of Problems with Known Error. The more slowly (and poorly) Known Errors are identified, the more the Problem WIP will grow.
www.pinkelephant.com 17
M5.
What perc
ent
of
the c
urr
ent
Pro
ble
ms a
nd K
now
n E
rrors
are
Pro
ble
ms t
hat
have n
o K
now
n
Err
or?
(C
urr
ent
Pro
ble
ms w
ithout
Know
n E
rrors
div
ided b
y all
Curr
ent
Pro
ble
ms a
nd K
now
n
Err
ors
)
Problems without Known Error Distribution Average Problems without KE’s : 41.4%.
na
40 –
59%
20 –
39%
Less than 2
0%
M5. What percent of the current Problems and Known Errors are Problems that have no Known Error? (Current Problems without Known Errors divided by all Current Problems and Known Errors)
Less than 20% 20% - 39% 40% - 59% 60% - 79% 80% - 100% na
21% 21% 25% 4% 13% 17%
60 –
79%
80-1
00%
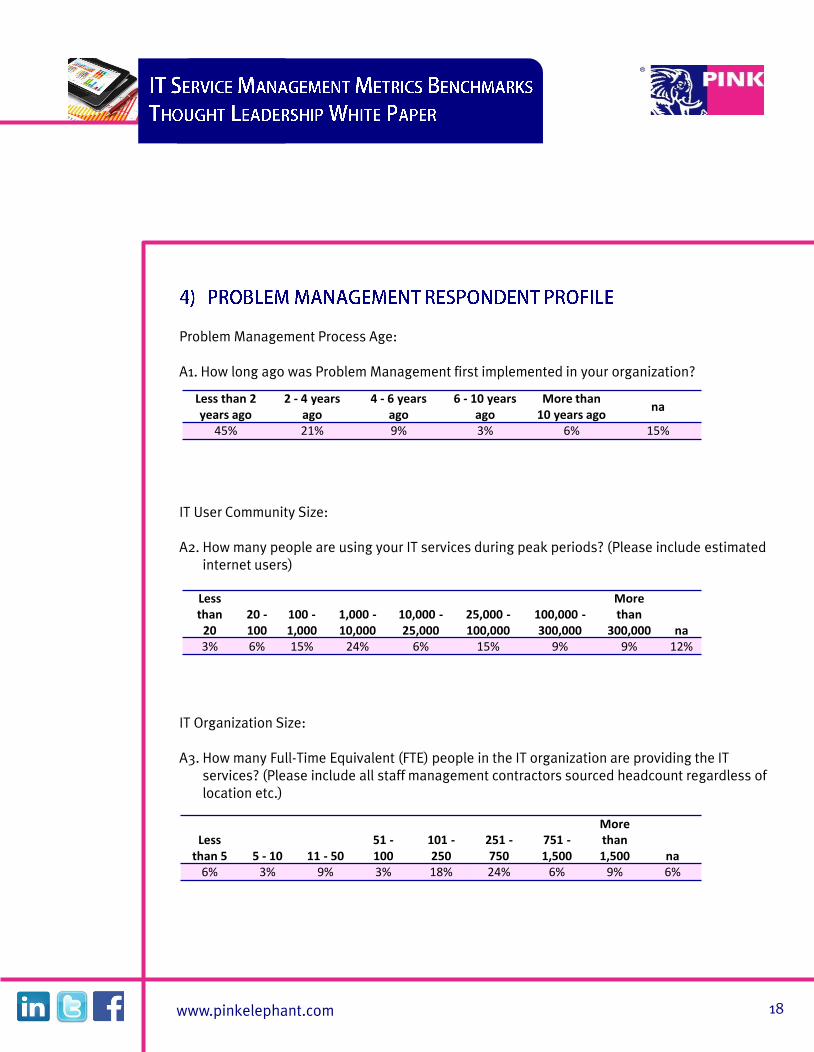
Problem Management Process Age: A1. How long ago was Problem Management first implemented in your organization? IT User Community Size: A2. How many people are using your IT services during peak periods? (Please include estimated internet users) IT Organization Size: A3. How many Full-Time Equivalent (FTE) people in the IT organization are providing the IT services? (Please include all staff management contractors sourced headcount regardless of location etc.)
www.pinkelephant.com 18
Less than 2 years ago
2 - 4 years ago
4 - 6 years ago
6 - 10 years ago
More than 10 years ago
na
45% 21% 9% 3% 6% 15%
Less than
20
20 - 100
100 - 1,000
1,000 - 10,000
10,000 - 25,000
25,000 - 100,000
100,000 - 300,000
More than
300,000 na
3% 6% 15% 24% 6% 15% 9% 9% 12%
Less than 5 5 - 10 11 - 50
51 - 100
101 - 250
251 - 750
751 - 1,500
More than 1,500 na
6% 3% 9% 3% 18% 24% 6% 9% 6%
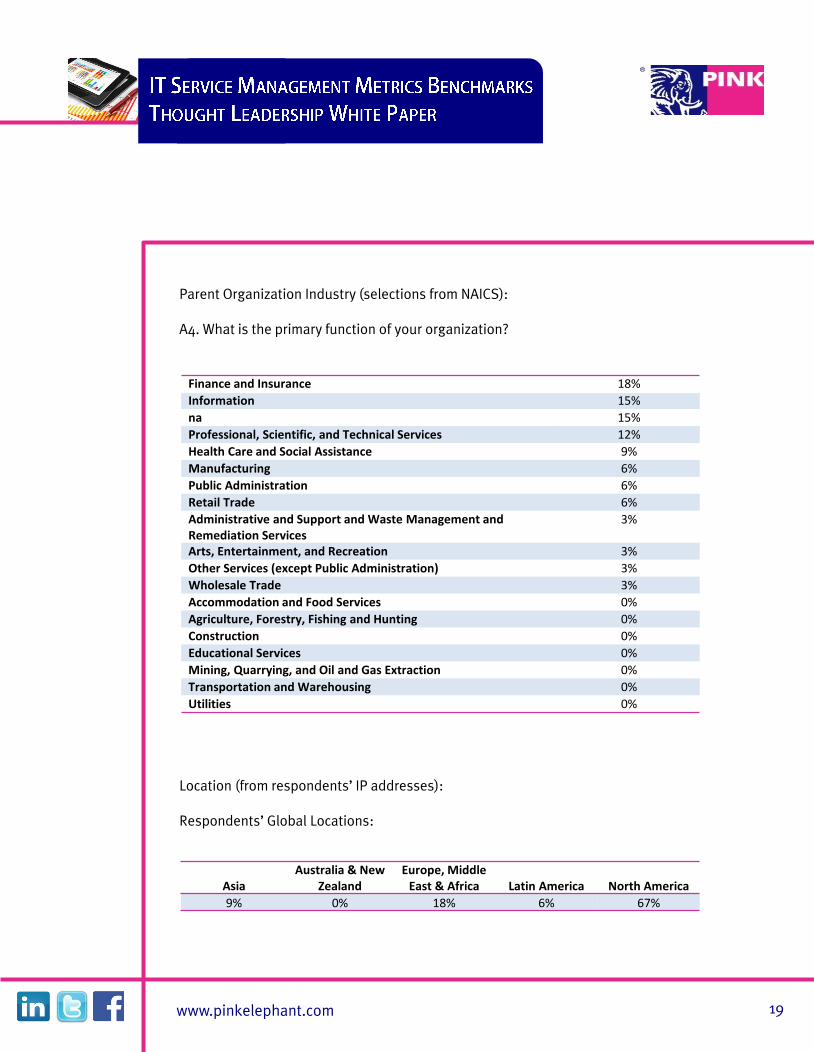
Parent Organization Industry (selections from NAICS): A4. What is the primary function of your organization?
Location (from respondents’ IP addresses): Respondents’ Global Locations:
www.pinkelephant.com 19
Finance and Insurance 18%
Information 15%
na 15%
Professional, Scientific, and Technical Services 12%
Health Care and Social Assistance 9%
Manufacturing 6%
Public Administration 6%
Retail Trade 6%
Administrative and Support and Waste Management and Remediation Services
3%
Arts, Entertainment, and Recreation 3%
Other Services (except Public Administration) 3%
Wholesale Trade 3%
Accommodation and Food Services 0%
Agriculture, Forestry, Fishing and Hunting 0%
Construction 0%
Educational Services 0%
Mining, Quarrying, and Oil and Gas Extraction 0%
Transportation and Warehousing 0%
Utilities 0%
Asia
Australia & New Zealand
Europe, Middle East & Africa Latin America North America
9% 0% 18% 6% 67%
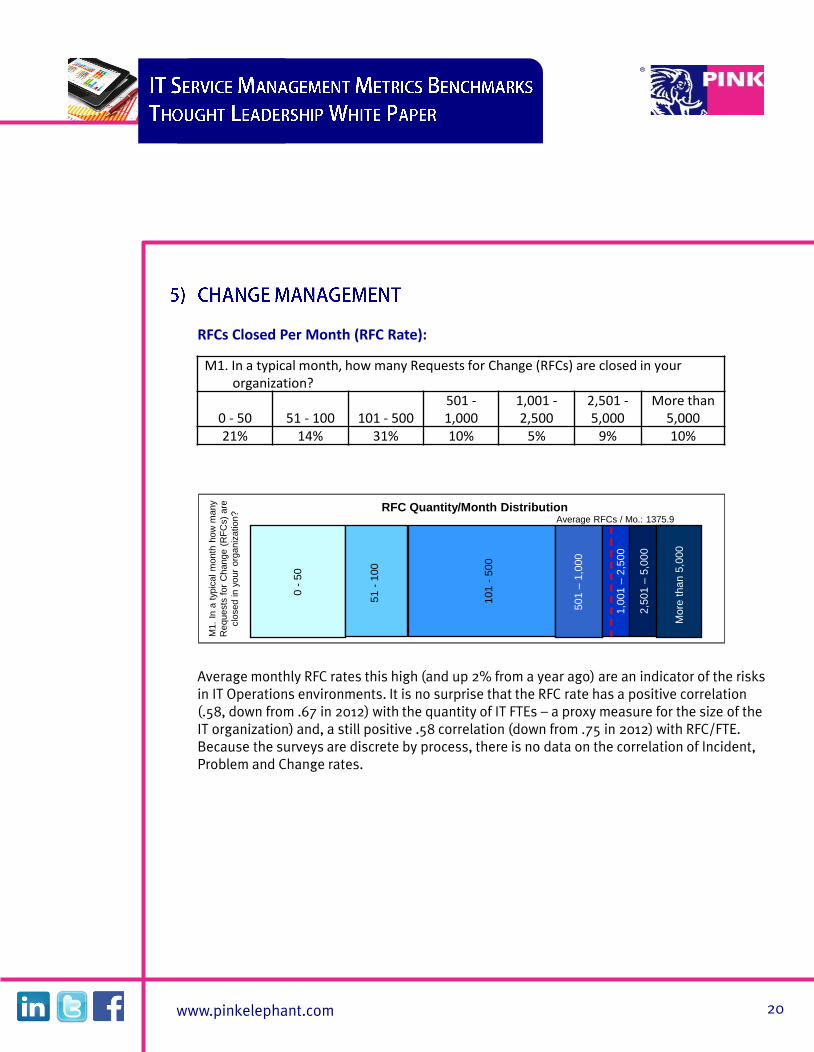
RFCs Closed Per Month (RFC Rate):
Average monthly RFC rates this high (and up 2% from a year ago) are an indicator of the risks in IT Operations environments. It is no surprise that the RFC rate has a positive correlation (.58, down from .67 in 2012) with the quantity of IT FTEs – a proxy measure for the size of the IT organization) and, a still positive .58 correlation (down from .75 in 2012) with RFC/FTE. Because the surveys are discrete by process, there is no data on the correlation of Incident, Problem and Change rates.
www.pinkelephant.com 20
0 -
50
51 -
100
101 -
500
2,5
01 –
5,0
00
1,0
01 –
2,5
00
M1.
In a
typ
ical m
onth
how
many
Requests
for
Change (
RF
Cs)
are
clo
sed in y
our
org
aniz
ation? RFC Quantity/Month Distribution
Average RFCs / Mo.: 1375.9
501 –
1,0
00
M1. In a typical month, how many Requests for Change (RFCs) are closed in your organization?
0 - 50 51 - 100 101 - 500
501 - 1,000
1,001 - 2,500
2,501 - 5,000
More than 5,000
21% 14% 31% 10% 5% 9% 10%
More
than 5
,000
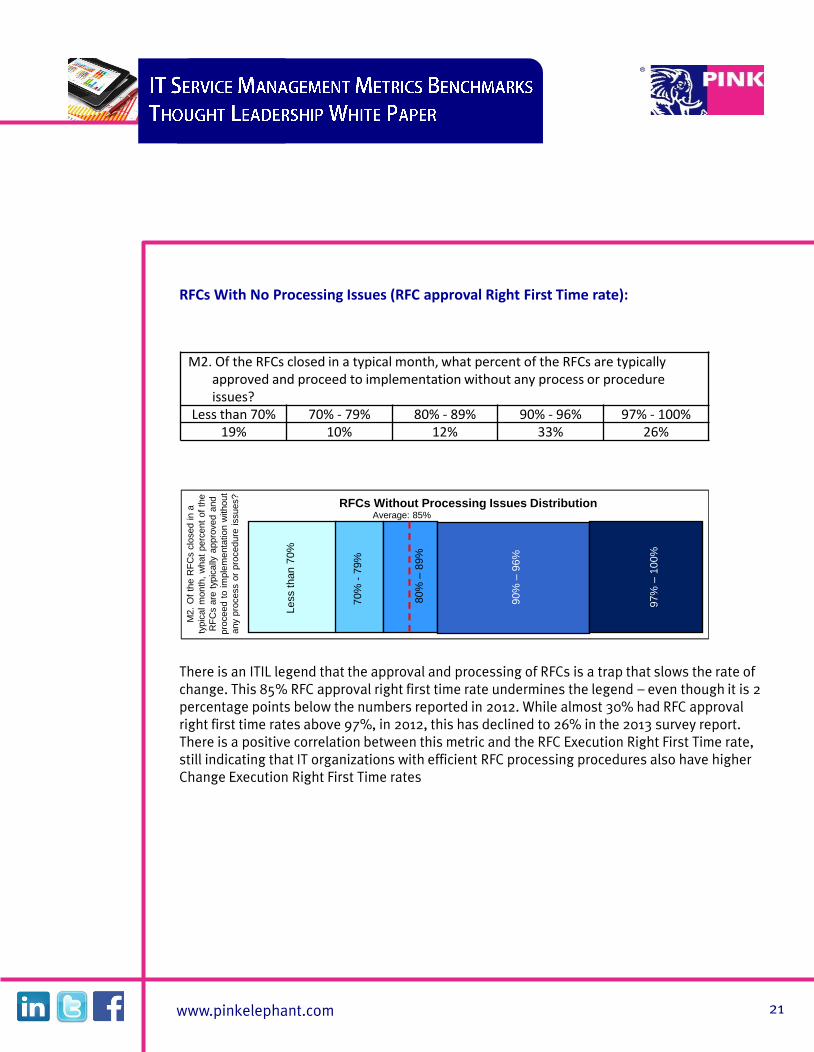
RFCs With No Processing Issues (RFC approval Right First Time rate):
There is an ITIL legend that the approval and processing of RFCs is a trap that slows the rate of change. This 85% RFC approval right first time rate undermines the legend – even though it is 2 percentage points below the numbers reported in 2012. While almost 30% had RFC approval right first time rates above 97%, in 2012, this has declined to 26% in the 2013 survey report. There is a positive correlation between this metric and the RFC Execution Right First Time rate, still indicating that IT organizations with efficient RFC processing procedures also have higher Change Execution Right First Time rates
www.pinkelephant.com 21
Less than 7
0%
70%
- 7
9%
80%
– 8
9%
M2.
Of
the R
FC
s c
losed in a
typic
al m
onth
, w
hat
perc
ent
of
the
RF
Cs a
re t
ypic
ally
appro
ved a
nd
pro
ceed t
o im
ple
menta
tion w
ithout
any
pro
cess o
r pro
cedure
issues?
RFCs Without Processing Issues Distribution Average: 85%
90%
– 9
6%
M2. Of the RFCs closed in a typical month, what percent of the RFCs are typically approved and proceed to implementation without any process or procedure issues?
Less than 70% 70% - 79% 80% - 89% 90% - 96% 97% - 100%
19% 10% 12% 33% 26%
97%
– 1
00%
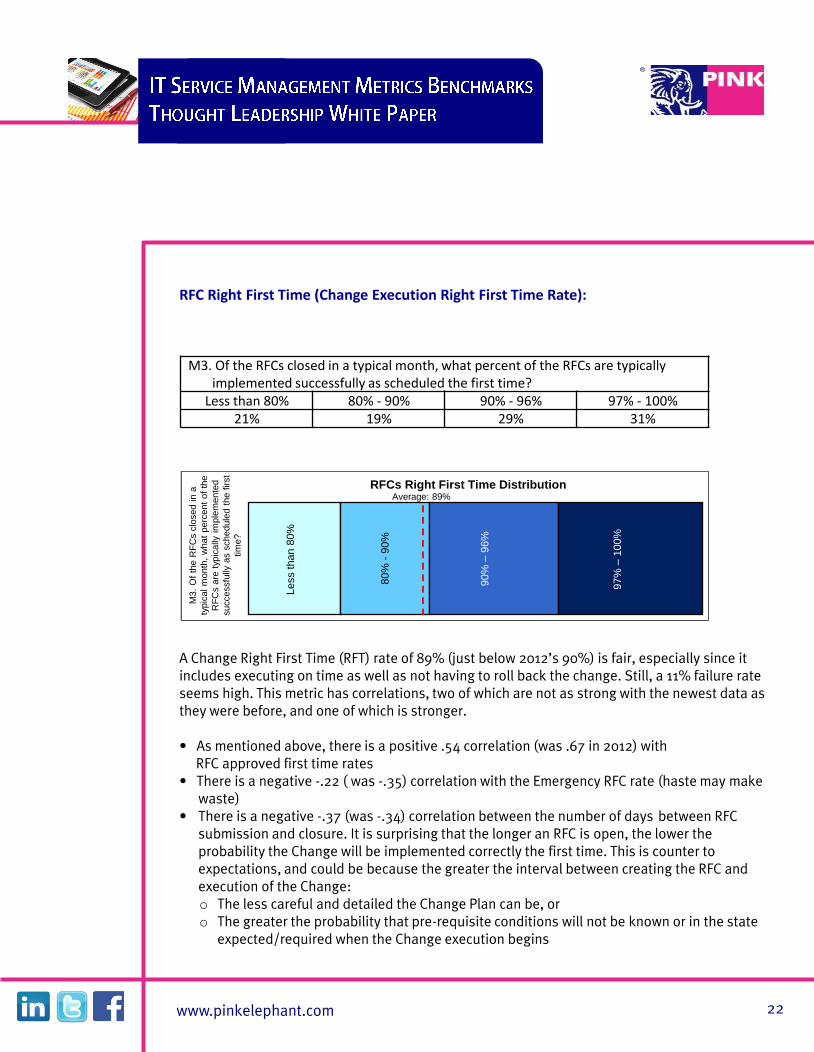
RFC Right First Time (Change Execution Right First Time Rate):
A Change Right First Time (RFT) rate of 89% (just below 2012’s 90%) is fair, especially since it includes executing on time as well as not having to roll back the change. Still, a 11% failure rate seems high. This metric has correlations, two of which are not as strong with the newest data as they were before, and one of which is stronger. • As mentioned above, there is a positive .54 correlation (was .67 in 2012) with RFC approved first time rates • There is a negative -.22 ( was -.35) correlation with the Emergency RFC rate (haste may make waste) • There is a negative -.37 (was -.34) correlation between the number of days between RFC submission and closure. It is surprising that the longer an RFC is open, the lower the probability the Change will be implemented correctly the first time. This is counter to expectations, and could be because the greater the interval between creating the RFC and execution of the Change:
o The less careful and detailed the Change Plan can be, or o The greater the probability that pre-requisite conditions will not be known or in the state
expected/required when the Change execution begins
www.pinkelephant.com 22
Less than 8
0%
80%
- 9
0%
M3.
Of
the R
FC
s c
losed in a
typic
al m
onth
, w
hat
perc
ent
of
the
RF
Cs a
re t
ypic
ally
im
ple
mente
d
successfu
lly a
s s
chedule
d t
he f
irst
tim
e?
RFCs Right First Time Distribution Average: 89%
90%
– 9
6%
97%
– 1
00%
M3. Of the RFCs closed in a typical month, what percent of the RFCs are typically implemented successfully as scheduled the first time?
Less than 80% 80% - 90% 90% - 96% 97% - 100%
21% 19% 29% 31%
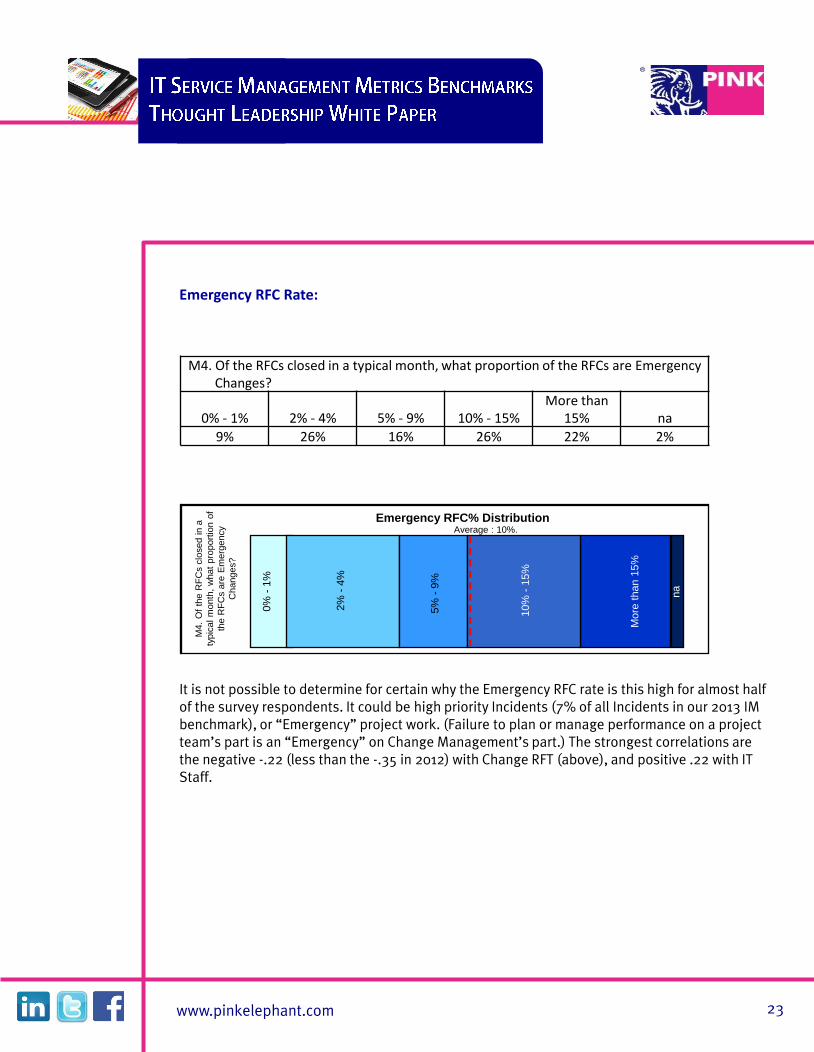
Emergency RFC Rate:
It is not possible to determine for certain why the Emergency RFC rate is this high for almost half of the survey respondents. It could be high priority Incidents (7% of all Incidents in our 2013 IM benchmark), or “Emergency” project work. (Failure to plan or manage performance on a project team’s part is an “Emergency” on Change Management’s part.) The strongest correlations are the negative -.22 (less than the -.35 in 2012) with Change RFT (above), and positive .22 with IT Staff.
www.pinkelephant.com 23
M4. Of the RFCs closed in a typical month, what proportion of the RFCs are Emergency Changes?
0% - 1% 2% - 4% 5% - 9% 10% - 15%
More than 15% na
9% 26% 16% 26% 22% 2%
M4.
Of
the R
FC
s c
losed in a
typic
al m
onth
, w
hat
pro
port
ion o
f
the R
FC
s a
re E
merg
ency
Changes?
Emergency RFC% Distribution Average : 10%.
na
5%
- 9
%
2%
- 4
%
0%
- 1
%
10%
- 1
5%
More
than 1
5%
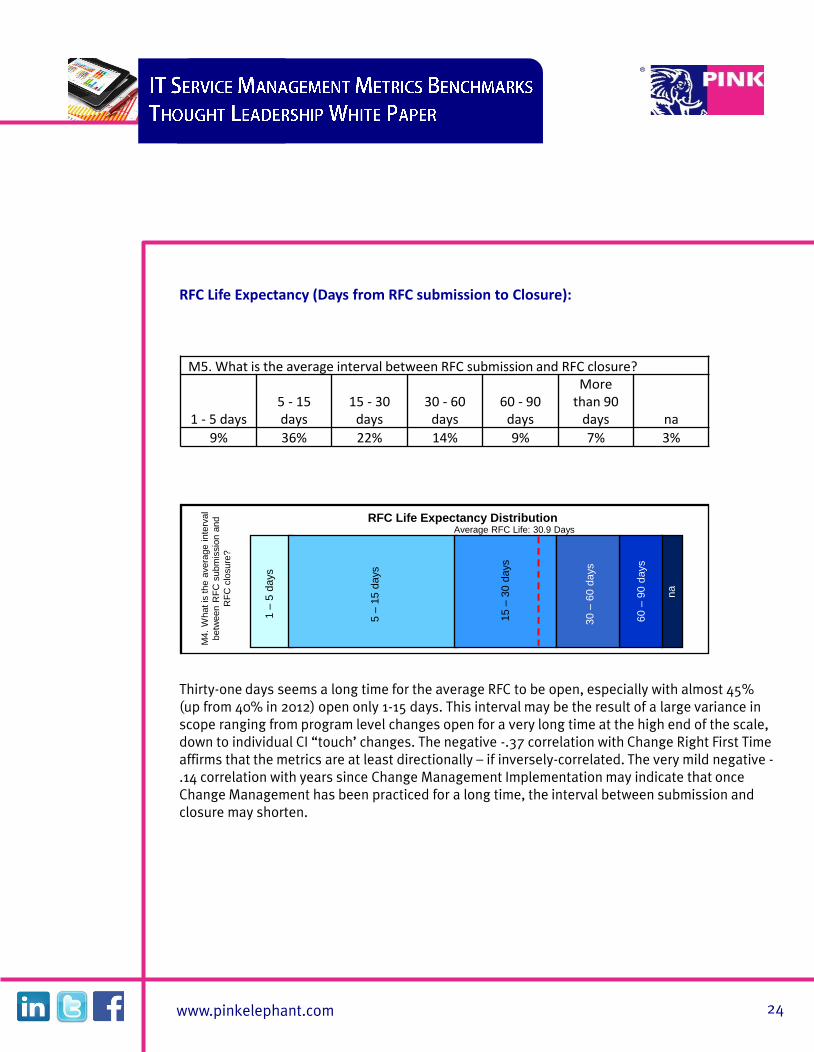
RFC Life Expectancy (Days from RFC submission to Closure):
Thirty-one days seems a long time for the average RFC to be open, especially with almost 45% (up from 40% in 2012) open only 1-15 days. This interval may be the result of a large variance in scope ranging from program level changes open for a very long time at the high end of the scale, down to individual CI “touch’ changes. The negative -.37 correlation with Change Right First Time affirms that the metrics are at least directionally – if inversely-correlated. The very mild negative -.14 correlation with years since Change Management Implementation may indicate that once Change Management has been practiced for a long time, the interval between submission and closure may shorten.
www.pinkelephant.com 24
M4.
What is
the a
vera
ge inte
rval
betw
een R
FC
subm
issio
n a
nd
RF
C c
losure
?
RFC Life Expectancy Distribution Average RFC Life: 30.9 Days
na
5 –
15 d
ays
1 –
5 d
ays
15 –
30 d
ays
60 –
90 d
ays
M5. What is the average interval between RFC submission and RFC closure?
1 - 5 days
5 - 15 days
15 - 30 days
30 - 60 days
60 - 90 days
More than 90
days na
9% 36% 22% 14% 9% 7% 3%
30 –
60 d
ays
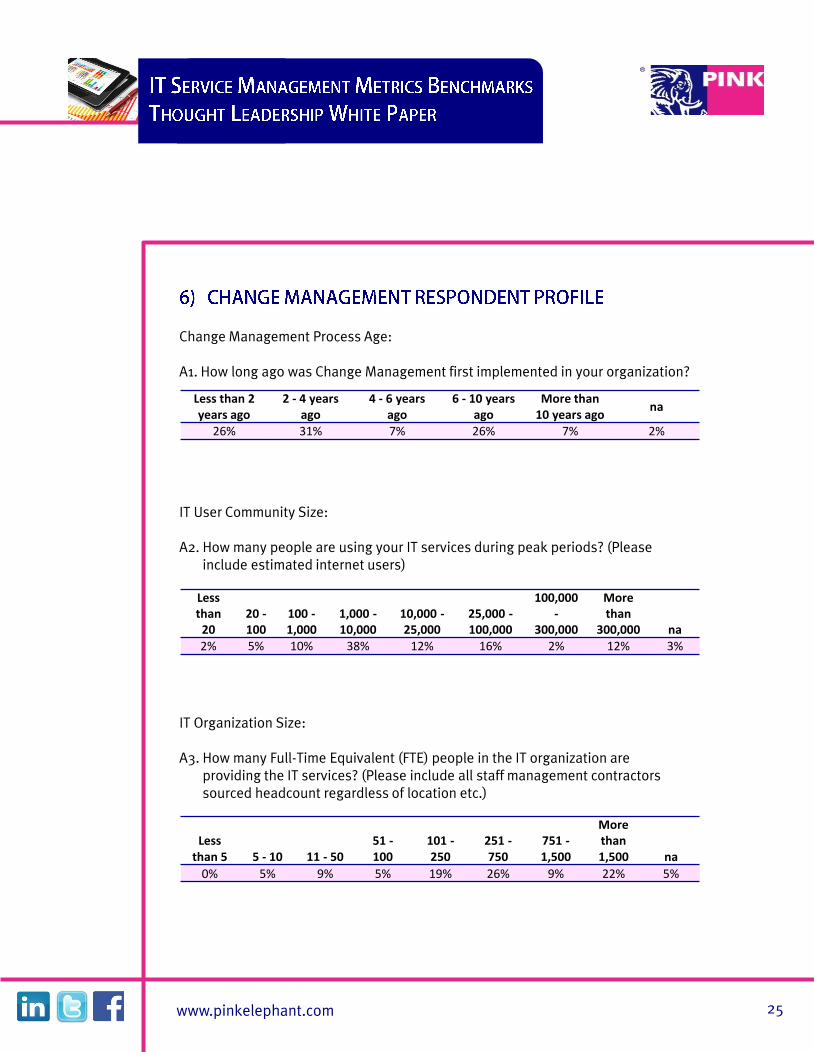
Change Management Process Age: A1. How long ago was Change Management first implemented in your organization? IT User Community Size: A2. How many people are using your IT services during peak periods? (Please include estimated internet users) IT Organization Size: A3. How many Full-Time Equivalent (FTE) people in the IT organization are providing the IT services? (Please include all staff management contractors sourced headcount regardless of location etc.)
www.pinkelephant.com 25
Less than 2 years ago
2 - 4 years ago
4 - 6 years ago
6 - 10 years ago
More than 10 years ago
na
26% 31% 7% 26% 7% 2%
Less than
20 20 - 100
100 - 1,000
1,000 - 10,000
10,000 - 25,000
25,000 - 100,000
100,000 -
300,000
More than
300,000 na 2% 5% 10% 38% 12% 16% 2% 12% 3%
Less than 5 5 - 10 11 - 50
51 - 100
101 - 250
251 - 750
751 - 1,500
More than 1,500 na
0% 5% 9% 5% 19% 26% 9% 22% 5%
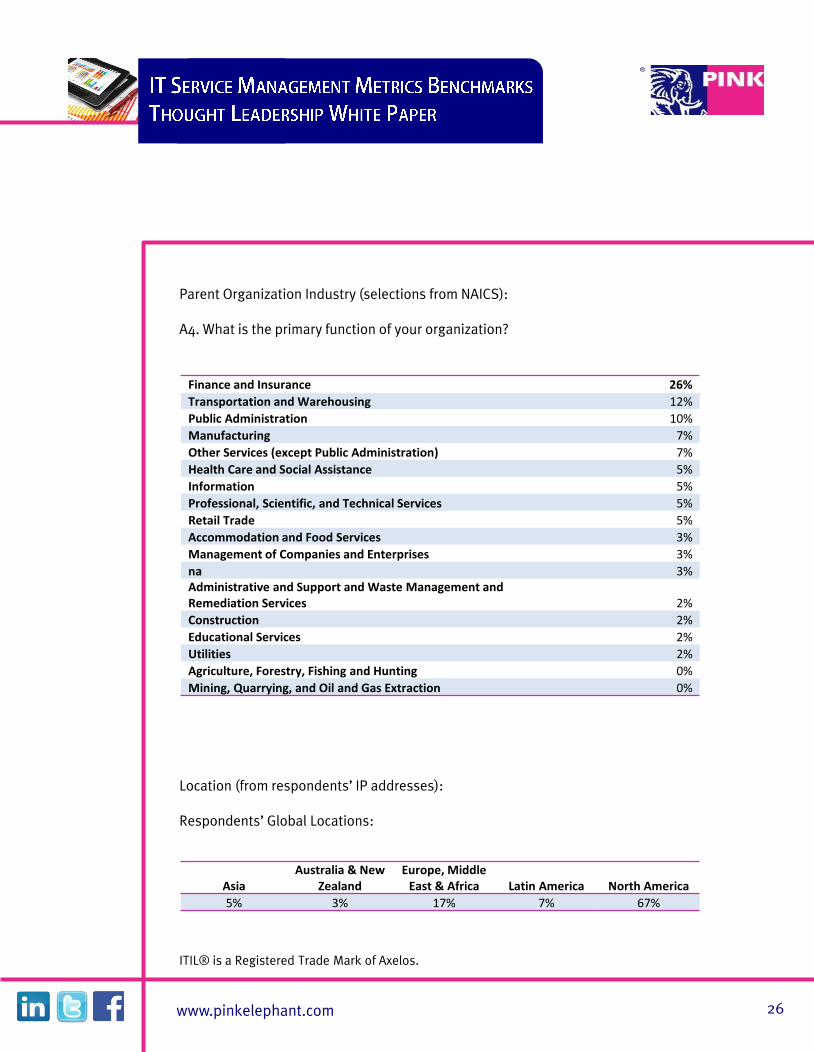
Parent Organization Industry (selections from NAICS): A4. What is the primary function of your organization?
Location (from respondents’ IP addresses): Respondents’ Global Locations: ITIL® is a Registered Trade Mark of Axelos.
www.pinkelephant.com 26
Asia
Australia & New Zealand
Europe, Middle East & Africa Latin America North America
5% 3% 17% 7% 67%
Finance and Insurance 26%
Transportation and Warehousing 12%
Public Administration 10%
Manufacturing 7%
Other Services (except Public Administration) 7%
Health Care and Social Assistance 5%
Information 5%
Professional, Scientific, and Technical Services 5%
Retail Trade 5%
Accommodation and Food Services 3%
Management of Companies and Enterprises 3%
na 3%
Administrative and Support and Waste Management and Remediation Services 2%
Construction 2%
Educational Services 2%
Utilities 2%
Agriculture, Forestry, Fishing and Hunting 0%
Mining, Quarrying, and Oil and Gas Extraction 0%