storage performance-metrics and benchmarkspmchen/papers/chen93_2.pdf · storage performance-metrics...
TRANSCRIPT

Storage Performance-Metrics and Benchmarks PETER M. CHEN AND DAVID A. PAmRSON, FELLOW, IEEE
An ever-widening mismatch between storage and processor performance is causing storage pe$ormance evaluation to become increasingly more important. In this paper, we discuss the metrics and benchmarks used in storage performance evaluation. We first high fight the technology trends taking place in storage system, such as disk and tape evolution, disk arrays, and solid-state disks. We then describe, review, and run today’s popular I/O benchmarks on three system: a DECstation 5000/200 running the Sprite Operating System, a SPARCstation I + running SunOS, and an HP Series 700 (Model 730) running HP-UX. We also describe two new appmaches to storage benchmarks-UDDIS and A Self-scaling Benchmark with Predicted Pegormance.
I. INTRODUCTION In the last decade, innovations in technology have led
to extraordinary advances in computer processing speed. These advances have led many of those who evaluate a computer’s performance to focus their attention on mea- suring processor performance to the near exclusion of all other metrics; some have even equated a computer system’s performance with how well its CPU performs. This view- point, which makes system-wide performance synonymous with CPU speed, is becoming less and less valid. One way to demonstrate this declining validity is illustrated in Fig. 1, where IBM disk performance, represented by the throughput of accessing a random 8-kb block of data, is contrasted with IBM mainframe CPU performance [ 181. For the sake of comparison, both CPU and disk performance are normalized to their 1971 levels. As can readily be seen, over the past two decades, IBM mainframe CPU performance has increased more than 30-fold, while IBM disk perfor- mance has barely doubled. Microprocessor performance has increased even faster than mainframe performance [12],[41]. If CPU performance continues to improve at its current pace and disk performance continues to obtain more moderate improvements, eventually the performance of all applications that do any input or output (YO) will be limited by that YO component-further CPU performance improvements will be wasted [I].
In light of this developing trend toward I/O-limited applications, storage performance and storage architecture
Manuscript received May 13, 1993. The authors are with the Computer Science Division, Department of
Electrical Engineering and Computer Science, University of California, Berkeley, CA 94720.
IEEE Log Number 92 I I348
501
45 -I N I
m
i IBM-mainframe-CPU
I ez 3 o i
P 251 e l / ; 0 r m a n
e C
,3390
1970 1975 1980 1985 1990 Year
Fig. 1. Contrasting trends of CPU and disk performance improve- ments. Over the past two decades, CPU performance improvements have far outstripped disk performance improvements. In this graph, CPU performance refers to IBM mainframe performance; disk performance refers to IBM disk (33x0 series) throughput on a random 8-kb access. Both are normalized to their 1971 level. The IBM mainframe performance comes from [18, p. 4, fig.l.l].
become increasingly more crucial to overall system perfor- mance. In this paper, we use the terms U0 performance and storage performance interchangeably.
In this paper, we first discuss common metrics used in evaluating storage. systems. Next, we highlight several trends in storage systems and how these trends affect storage performance evaluation. After addressing metrics and trends in storage systems, we devote the rest of the paper to discussing benchmarks used in evaluating VO performance. We list desirable characteristics of an VO benchmark, survey and run current VO benchmarks, and discuss two new U 0 benchmarks-one an evolutionary step in VO benchmarks, the other a new approach to VO benchmarks.
0018-9219/93$03.00 0 1993 IEEE
PROCEEDINGS OF THE IEEE, VOL. 81. NO. 8, AUGUST 1993 1151

11. METRICS More than other areas of computer performance eval-
uation, storage evaluation involves many varied types of metrics. In this section, we present an overview of some of the metrics commonly used today in choosing and evaluating storage systems. The value of most metrics depend strongly on the, workload used, hence the dual emphasis on metrics and benchmarks in this paper.
The most basic metric for VO performance is throughput. Throughput is a measure of speed-the rate at which the storage system delivers data. Throughput is measured in two ways: VO rate, measured in accessedsecond, and data rate, measured in byteshecond ( B h ) or megabytedsecond (MBh). The VO rate is generally used for applications where the size of each request is small, such as transaction processing [2]; data rate is generally used for applications where the size of each request is large, such as scientific applications [38].
Response time is the second basic performance metric for storage systems. Response time measures how long a storage system takes to access data. This time can be measured in several ways. For example, one could measure time from the user’s perspective, the operating system’s perspective, or the disk controller’s perspective, depending on what you view as the storage system.
Usefulness for a storage system not only includes how fast data can be accessed, but also how much data can be stored on the storage system. Capacity is not normally applied as a metric to nonstorage components of a computer system, but it is an integral part of evaluating an U 0 system. If capacity were ignored as a metric, tape, and disk manufacturers would soon find their customers switching to solid-state (memory-based) storage systems, which offer much higher performance but less capacity per dollar.
Because users store valuable data on U 0 systems, they demand a reliability level much higher than for other parts of the computer. If a memory chip develops a parity error, the system will (hopefully) crash and be restarted. If a storage device develops a parity error in a database of bank accounts, however, banks could unwittingly lose billions of dollars. Thus reliability is a metric of great importance to storage systems.
Cost, of course, applies to all components in computer systems. Disk subsystems are often the most expensive component in a large computer installation [3]. Cost is usually expressed as a composite metric, such as capacity cost, or throughput cost.
Various combinations of these five metrics in storage system evaluation, throughput, response time, capacity, reliability, and cost, are common. One popular combination is a response time versus throughput graph (Fig. 2). Such graphs vary a parameter, such as the number of users on the system, to display the tradeoff between improving throughput and degrading response time. More users gen- erate higher system utilization and increase throughput. On the other hand, higher utilization leads to slower response times. Because a single performance number is easier to use
Mehc
e S s ; 300-
y 200-
e
T
,BM 3390 Redundant Disk Array of IBM 0661 disks
t
Max Read Data Rate Min Response Time
Capacity Mean Time (0 Data Loss
Cost (estimated)
faster 1 , , , , 0 0.0 0.2 0.4 0.6 0.8 1.0
Throughput (MEVs)
lower higher
Fig. 2. Example response time versus throughput graph. Increas- ing the utilization of a system usually leads to higher throughput but slower response time. This figure was adapted from [6].
15 ME per second 130 MLI p& second 20 ms U) ms 23 GB 22 GB
6-28 years 753 years $67.ooo - ? $156.000 - $260,WO
Fig. 3. Metria for two storage systems. Here we show the differences in the values of several types of metrics for an IBM 3390 disk system and a redundant disk array made of IBM 0661 3.5 in drives [23]. This table was adapted from [13].
than a full graph, many evaluators combine throughput and response time by reporting throughput at a given response time [2], [6]. For example, the TPC-B benchmark reports maximum throughput with 90% of all requests completed within 2 s [65].
Another composite metric is data temperature, defined as VO rate divided by capacity [26]. Data temperature measures how many VO’s per second a storage system can support for a fixed amount of storage. Users who are limited by VO rate rather than capacity should buy systems with high data temperature.
A general parameterizable composite metric can be for- mulated for any combination of the above metrics. For example, one could imagine a system administrator who wanted a system with the highest capacity per dollar, as long as it satisfied minimum reliability, throughput, and response time demands.
Figure 3, adapted from [ 131 shows the values of the above metrics for two different disk systems.
111. TRENDS IN STORAGE SYSTEMS
In this section we highlight some of the current trends in storage systems. We discuss advances in magnetic disk technology, arrays of disks, file caching and solid-state disks, magnetic tape, and log-structured file systems.
Magnetic disks have long been the mainstay of storage systems. But, since 1970, disk performance has improved
1152 PROCEEDINGS OF THE IEEE, VOL. 81. NO. 8, AUGUST 1993

Metic I IBM 3330 I IBM 0661 I Average Yearly Immovement AverageSxkTime I 30ms I 12.5 ms I 5%
Average Rofational Delay Transfer Rate
8.3 ms 7 ms 1% 806 KB/s 1700 KB/s 4%
only modestly. In Fig. 4 we compare two disks, the IBM 3330, introduced in 1971, and the IBM 0661, introduced in 1989. The average yearly improvement in performance has inched forward at a few percent a year. Cost per capacity, on the other hand, has improved at a much faster pace, averaging a 23% reduction per year from 1977 to 1986 [ 131. Disk size has also been gradually decreasing. The most common disk diameter of the 1970’s and 1980’s was 14 in. Those disks are disappearing and are being replaced with 5.25- and 3.5-in diameter disks. These smaller disks have somewhat better performance than their larger, more expensive predecessors.
The trend toward smaller, less expensive disks creates an opportunity to combine many of these disks into a parallel storage system known as a disk array. The concept of constructing an array of multiple disks has been used for many years for special purposes [24] but is only now becoming popular for general use. The list of companies developing or marketing disk arrays is quite long: Array Technology, Auspex, Ciprico, Compaq, Cray, Datamax, Hewlett-Packard, IBM, Imprimis, Intel Scientific, Intellis- tor, Maximum Strategy, Pacstor, SF2, Storage Concepts, Storage Technology, and Thinking Machines. Some ana- lysts have projected the disk array market to expand to $8 billion market by 1994 [391.
The basic concept behind disk arrays is straightfor- ward-combine many small disks and distribute data among them (Fig. 5). This increases the aggregate throughput available to an application. The array of disks can either service many small accesses in parallel or cooperate to deliver a higher data rate to a single large access [5], [6], [13], [28], [32], [49], [54]. Disk arrays compensate for the lower reliability inherent in using more disks by storing redundant, error-correcting information. Current disk array research is focusing on how to distribute (stripe) data across disks to get optimal performance [5], [29], [30], how to spread redundant information across disks to increase reliability and minimize the effect of disk failures [13], [20], [40], and how to reduce the penalties associated with small writes in certain types of disk arrays [35], [63].
Disk arrays improve throughput by using more disks to service requests. Requests which are serviced by a single disk, however, see the same response time. File caches, disk caches, and solid-state disks use dynamic RAM (random- access memory) to decrease response time. Caches can be placed in a variety of places in the system memory hierarchy [62]. Two common places are the disk controller, as in the IBM 3990 disk cache [34], and main memory, as in the Sprite operating system’s file cache [42], [45].
Exabyte-120 Tap Library M e t ” RSS-600 Taw Library
Fig. 5. Combining multiple smaller disks to improve perfor- mance. Performance of single disks is not improving rapidly (Fig. 4); however, disks are rapidly becoming physically smaller and cheaper. Disk arrays take advantage of this downsizing to provide higher aggregate throughput by simultaneously operating many small disks.
$8O/GB 5 G B ICOsec. 500 GB 8700 GB $62/GB 14.5GB 5Oscc.
Diloe DAT Slacker I IOGB I $527/GB I 1.308 I 75scc.
Response times for writes is decreased by writing the data to RAM, acknowledging the request, then transferring the data to disk asynchronously. This technique, called wrire- behind, leaves the data in RAM more vulnerable to system failures until written to disk. Some systems, such as the IBM 3990, mitigate this reliability problem by storing the cached data in nonvolatile memory, which is immune to power failures [34]. As with any cache, read response time is decreased if the requested data are found in cache RAM.
Solid-state disks are similar to caches in that they im- prove response time by storing requests in RAM rather than on magnetic disks. The principal difference between solid-state disks and caches is that solid-state disks speed up all accesses while caches speed up access only to the most commonly requested data. Solid-state disk is much more expensive than magnetic disk for equal capacity but is dramatically faster. Response times for solid-state disks are commonly less than 3 ms [4], [25], while response times for magnetic disks are approximately 10-30 ms. On the other hand, solid-state disks cost 50-100 times more than magnetic disks for the same capacity [13].
Two storage metrics have been addressed-throughput and response time. Dramatic improvements to capacity per cost have occurred in magnetic tapes (Fig. 6). A new method of reading and writing tapes, helical scan, has increased the capacity of a single tape from 0.1-0.2 GB to 5-20 GB [27], [66], [68]. Tapes are extremely slow, however, with response times of 20 s to a few minutes. Throughput for these devices is less dismaying, ranging from 0.1-2.0 MB/s. Current research related to tape devices addresses the questions of how to migrate data from tape to faster storage [15], [17], [37], [61], [67], how to increase tape throughput using striping [27], and how to decrease response time by prefetching and caching 191, [14].
Reported disk reliability has improved dramatically over the past ten years, though actual reliability has improved more slowly. The most common metric for reliability,
CHEN AND PATTERSON: STORAGE PERFORMANCE I153

mean-time-to-failure, has increased from 30 OOO to 150 000-200 000 h. This jump in apparent reliability comes mostly from changing the method of computing mean-time- to-failure and is not expected to continue improving as quickly [ 131.
Innovation is also taking place in the file system. A good example of how file systems have improved VO system performance is the Log-Structured File System (LFS) [46], [50]. LFS writes data on the disk in the same order that they are written. This leads to highly sequentialized disk writes and thus improves the sustainable disk write throughput.
Although the raw performance in storage technology has improved much slower than processor technology, innovation such as file caches, disk arrays, robot-driven tape systems, and new file systems have helped close the gap.
IV. YO BENCHMARKS These developments in disks, disk array, file caches,
solid-state disks, tapes, and file systems create new chal- lenges for storage system evaluation. Benchmarks used in the evaluation process must evolve to comprehensively stress these new YO systems. For example, disk arrays are able to service many VO’s at the same time; benchmarks therefore need to issue many simultaneous VO’s if they hope to stress a disk array. Caches create distinct perfor- mance regions based on the size of the file space touched by a program; benchmarks likewise should measure these different performance regions.
The rest of this paper is devoted to discussing bench- marks used in evaluating VO performance. We first list standards used to critique VO benchmarks. We then review, run, and evaluate VO benchmarks in use today. Last, we discuss two new U 0 benchmarks being proposed.
In this paper, we use I/O benchmarks to measure the data VO performance seen by a program issuing reads and writes. Specifically, we are not using VO benchmarks to measure the performance of file system commands, such as deleting files, making directories, or opening and closing files. While these are perfectly valid and important metrics, they are more a measure of the operating system and processor speed than they are of the storage components.
V. THE IDEAL I/O BENCHMARK In purchasing and evaluating an U 0 system, most people
unfortunately use trivial benchmarks. These include, for example, the time to write 1 MB to disk, the average disk access time, or the raw disk transfer rate. These metrics are similar to the CPU clock rate in processor performance evaluation; they provide some insight but do not translate easily into performance visible to the end user. In this section we list some desirable characteristics of U 0 benchmarks.
First, a benchmark should help system designers and users understand why the system performs as it does. Computer architects and operating system programmers need to have benchmarks to evaluate design changes and isolate reasons for poor performance. Users should be also
-
able to use benchmarks to understand optimal ways to use the machine. For instance, if a user wanted to have his application fit within the file cache, the ideal VO benchmark should be able to provide information on the file cache size of a machine. This criterion may require reporting results for several different workloads, enabling the user to compare these results. These multiple workloads should require little human interaction to run.
Second, to maintain the focus of measuring and under- standing VO systems, the performance of an VO benchmark should be limited by the U 0 devices. The most intuitive test of being VO-limited is the following: if the speedup resulting from taking out all VO from an application is greater than the speedup resulting from taking out all CPU operations (leaving only YO), then the application is VO-limited. Unfortunately, this test is quite hard to perform in practice-almost any nontrivial application will not function when its U 0 is eliminated. Instead, we test for how VO-limited an application is by measuring the fraction of time spent in doing data YO.
Third, the ideal VO benchmark should scale gracefully over a wide range of current and future machines. Without a well planned-out scaling strategy, VO benchmarks quickly become obsolete as machines evolve. For instance, ZOSrone tries to exercise the memory hierarchy, but touches only 1 MB of user data. Perhaps at the time IOStone was written, 1 MB was a lot of data, but this is no longer true. Another example of an U 0 benchmark’s need to scale is provided by disk arrays. As mentioned above, disk arrays allow multiple VO’s to be in progress simultaneously. Most current VO benchmarks do not scale the number of processes issuing YO, and hence are unable to properly stress disk arrays. Unfortunately, it is difficult to find widespread agreement on a scaling strategy, especially for benchmarks intended for a wide range of audiences.
Fourth, a good U 0 benchmark should allow fair compar- isons across machines. This comparison has two aspects. First, a fair comparison across machines should be able to be made for VO workloads identical to the benchmark. However, users rarely have the same workload as a standard benchmark. Thus the results from a benchmark should predict performance for workloads that differ from the benchmark.
Fifth, the ideal YO benchmark would be relevant to a wide range of applications. It is certainly easier to target a benchmark to a specific audience, and benchmarks that do a good job representing their target applications are invaluable for those applications. But, it would be even better for a benchmark to be usable by many audiences.
Finally, in order for results to be meaningful, benchmarks must be tightly specified. Results should be reproducible by general users; optimizations which are allowed and disallowed must be explicitly stated; the machine envi- ronment on which the benchmarking takes place must be well-defined and reported (CPU type and speed, operating system, compiler, network, disk, other load on the system) the starting state of the system (file cache state, data layout on disk) should be well-defined and consistent, and so on.
1 I54 PROCEEDINGS OF THE IEEE, VOL. 81. NO. 8, AUGUST 1993

Fig. 7. System platforms. This table shows the three systems on which we run benchmarks. The DECstation uses a three disk RAID disk array [49] with a 16-kE% striping unit [6] and is configured without redundancy. The SPECint rating is a measure of the integer speed of the processor. Ratings are relative to the speed of a VAX 1 ln80. The full name of the HP 730 is the HP Series 700 Model 730.
DECstation so00 HP 730
In summary, the six characteristics of the ideal VO benchmark are as follows: it should help in understanding system performance; its performance should be VO-limited; it should scale gracefully over a wide range of current and future machines; it should allow fair comparisons across machines; it should be relevant to a wide range of applications; it should be tightly specified.
20 sec. (10%) 67 sec. (3%) 87 sec. (4%) 17 sec. (27%) 28 sec. (6%) 45 sec. (13%)
VI. SYSTEM PLATFORMS
In running benchmarks in this paper, we use three sys- tems. All are high-performance workstations with differing VO systems. Figure 7 summarizes their characteristics. Note that these computers were introduced in different years-our study is not meant to be a competitive market analysis of the competing products.
In order to better understand these benchmarks, we slightly modified their software. For example, we compiled in special VO routines which traced VO activity. Hence, we used publicly available code for as many programs as possible. In general, we used GNU (Gnu’s Not Unix) code developed by the Free Software Foundation. To make results directly comparable between machines for bench- marks which used the compiler, we took the same step as Ousterhout [47] in having the GNU C compiler generate code for an experimental CPU called SPUR [19].
VII. OVERVIEW OF CURRENT Yo BENCHMARKS In this section, we describe, critique, and run five com-
mon benchmarks used in VO system evaluation: Andrew, TPC-B, Sdet, Bonnie, and IOStone. Figure 14 contains information for obtaining these benchmarks. We categorize them into two classes: application benchmarks and synthetic benchmarks.
A. Application Benchmarks Application benchmarks use standard programs, such as
compilers, utilities, editors, and databases, in various com- binations, to produce a workload. Each benchmark targets a single application area, such as transaction processing or system development. Application benchmarks usually do a good job of accurately representing their target application area. But, as we shall see, they are often not VO-limited.
I) Andrew: The Andrew .benchmark was designed at Carnegie-Mellon University to be a file system bench-
System I CODV Phase /% 1/01 1 Compile Phase /% VO) I Total (% I/O SPARCstation I + I 82 sec. (4%) I 137 sec. (7%) I 219 sec. (6%)
mark for comparatively evaluating the Andrew File System against other file systems [21]. It was originally meant to be only a convenient yardstick for measuring file systems, not necessarily as a representative workload for benchmarking. Despite this intent, it has become a widely used defacto benchmarking standard [47].
Andrew is meant to represent the workload generated by a typical set of software system developers. It copies a file directory hierarchy, examines and reads the new copy, then compiles the copy. The file directory contains 70 files totaling 0.2 MB. CMU’s experience in 1987 suggests the load generated roughly equals that generated by five users.
In Fig. 8, we list results from Andrew on our three system platforms. As in [47], we divide Andrew into two sections: the copy phase, consisting of the copy, examination, and reading stages; and the compile phase. Note that on all machines Andrew spends only 6%-13% actually doing data reads and writes. The HP 730, which has the fastest CPU, spends a higher fraction of time in YO than the others. This supports our contention that systems with faster and faster CPU’s will become more and more VO-limited.
2) TPC-B: TPC-B measures transaction processing per- formance for a simple database update [65]. The first version, TPl, first appeared in 1985 [2] and quickly be- came the de facto standard in benchmarking transaction processing systems. TPC-A’ [64] and TPC-B [65] are more tightly specified versions of TP1 and have replaced TPl as the standard transaction processing benchmark. As a transaction processing benchmark, TPC-B not only measures the machine supporting the database but also the database software.
TPC-B repeatedly performs Debit-Credit transactions, each of which simulates a typical bank account change on a bank database. The database consists of customer accounts, bank branches, and tellers. Using a random customer re- quest, a Debit-Credit transaction reads and updates the necessary account, branch, and teller balances. Requests are generated by a number of simulated customers, each requesting transactions as quickly as possible.
TPC-B’s main metric is maximum throughput measured in transactions-per-second, qualified by a response time threshold demanding that 90% of all transactions complete
‘The main difference between TPC-A and TPC-B is the presence of real terminals. TPC-A demands the test be done with actual terminals providing input at an average rate of one request every 10 s. TPC-B generates requests with intemal drivers running as fast as possible. This paper discusses only TPC-B.
CHEN AND PA’ITERSON: STORAGE PERFORMANCE 1 I55

\
80 - %
O f 70
T 60 -
SPARCstation 1+ 1001
peak throughput 9.1 transactions/second
(concurrency of 2)
average response time 166 ms
"1 80 ~
%
O f 'O
T 60 - r ," 50.
peak throughput 13.2 transactionshecond
(concurrency of 2)
average response time 98 ms
90% response time 200 ms
r I
9b
'O
T 60 - r 4 5o J A 90% response time 200 ms
peak throughput 11.0 transactiondsecond
(concurrency of 2)
average response time 126 ms
n II I
I O
04 t 0.0 0.5 1 .o 1.5
Response Time (seconds) ~
DECstation 5000/200 lo0l
"1
201 I O \ 0.0 0.5 1 .o 1.5
Response Time (seconds)
(a) (b)
Fig. 9. TPC-B Results. These figures show TPC-B results for our three experimental systems. As a database program, we used Seltzer's simple transaction processing library LIBTP [57]. Due to software limitations, we were unable to run at concurrencies higher than 2, reflected by response times much faster than those required by TPC-B.
within 2 s. TPC-B also reports price for the system and required storage. The number of accounts, branches, and tellers specified by TPC-B is proportional to through- put-for each additional transaction-per-second of perfor- mance reported, the test system database must add 10 MB more account information. Using this database size, TPC-B reports a graph of throughput versus the average number of outstanding requests and a histogram of response times for the maximum throughput. In Fig. 9, we show the TPC-B response time characteristic on our three systems, using Seltzer's simple transaction supporting package LIBTP W l .
3) Sdet: The System Performance Evaluation Coopera- tive (SPEC) was founded in 1988 to establish independent standard benchmarks [56]. Their first set of benchmarks, SPEC Release 1, primarily measures CPU performance. Their second set of benchmarks, System Development Multi-tasking (SDM) Suite, measures overall system per- formance for software development and research environ- ments. SDM consists of two benchmarks, Sdet [lo], [ 111 and Kenbusl [33]. Sdet and Kenbusl are quite similar in benchmarking methodology; their main difference is the specific mix of user commands. We limit our discussion to Sdet, which does more U 0 than Kenbus 1.
Sdet's workload consists of a number of concurrently running scripts. Each script contains a list of user com- mands in random order. These commands are taken from a typical software development environment and include editing, text formatting, compiling, file creating and delet- ing, as well as miscellaneous other UNIX utilities [52]. Sdet increases the number of concurrently running scripts until it reaches the system's maximum throughput, measured as the script completion rate (scripts per hour). Sdet reports this maximum rate, along with the graph of throughput versus
Hp 730 lo0l
"i
the script concurrency (Fig. 10). Once again, only a small percentage of time, 10%-22%, is spent in UO.
B. Synthetic Benchmarks Synthetic benchmarks exercise an VO system by directly
issuing read and write commands. In contrast, application benchmarks use standard programs, which in turn issue VO. By issuing reads and writes directly, synthetic benchmarks are able to generate more U 0 intensive workloads. But, synthetic benchmarks often yield less convincing results because they, unlike application benchmarks, do not per- form useful work. We review three synthetic benchmarks here. Two popular benchmarks are Bonnie and IOStone; we also create a third synthetic benchmark to demonstrate a typical scientific VO workload.
1 ) Bonnie: Bonnie measures VO performance on a single file for a variety of simple workloads. One workload sequentially reads the entire file a character at a time; another writes the file a character at a time. Other work- loads exercise block-sized sequential reads, writes, or reads followed by writes (rewrite). The final workload uses three processes to simultaneously issue random VO's. The size of the file is set by the evaluator and should be several times larger than the system's file cache size, thus preventing the entire file from fitting in the cache. For each workload, Bonnie reports throughput, measured in kilobytes per second or VO's per second, and CPU utilization. We show results for the three systems in Fig. 11. Most of Bonnie's workloads are UO-limited, however, the character reads and writes are CPU-limited.
2) IOStone: IOStone is a synthetic U 0 benchmark [48] based on system traces of Unix minicomputers and work- stations [22], [44] and IBM mainframes [59], [60]. Using 400 files totaling 1 MB, IOStone reads and writes data in
1 I56 PROCEEDINGS OF THE IEEE, VOL. 81, NO. 8, AUGUST 1993

T h r
80-
6 e 4
7
t 60-
C
r i 40-
i 0 20 U r 1
0
(a)
Fig. 10. Sdet results. These figures show results
peak 26.7 scriptshour (6 scripts)
10% time spent in I/O (6 scripts)
-7
0 5 I O 15 Number of Concurrent Scripts
DECstation 5000/200
1 7 /------
6 E t 60-
4 C
I peak 96.8 scriptshour (5 scripts)
10% time spent in I/O (5 scripts)
r i 40-
P
; 20-
S I
U r 1
0 5 IO I5
f%, Number of Concurrent Scripts
(b)
from the SPEC SDM benchmark Sdet.
Sequential Sequential Sequential System Char Write Block Write Block Rewrite.
KB/s (% CPU) KB/s (5% CPU) KBh (% CPU) SPARCstation I + 229 (99%) 558 (37%) 230 (26%) DECstation5000 300(77%) . 663 (14%) 297(14%)
HP 730 1285 (98%) 1777 (16%) 604(13%)
loo 1
Sequential Sequential Random Char Read Block Read Block Read
KB/s (9% CPU) KB/s (46 CPU) IO/s (46 CPU) 193 (98%) 625 (37%) 31 (22%) 253 (60%) 781 (18%) 32(14%) 995 (85%) 2023 (13%) 39 (5%)
HP 730
DECstation 5000 HP 730
q 0 80 U
82 MBh 1.28 MB/s 1.98 MB/s 1.86 MB/s
peak 46.3 scriptshour (2 scripts)
22% time spent in I/O (2 scripts)
DECstation 5000 HP 730
? 7 ; 20-
U r
50905 26% 20409 81%
IO Number of Concurrent Scripts
(C)
System I IOStones/second I Percent Time Swnl in I/O SPARCstation I + I 11002 I 61%
patterns which approximate the locality found in [44]. One process performs all the accesses-no U 0 parallelism is present. IOStone reports a single throughput result, IOS- tones per second (Fig.12). IOStone runs much faster when the system’s file cache is large enough to contain the small data space of the benchmark. Thus the Sprite DECstation, with a maximum file cache of 25 MB, runs IOStone 2 4 times faster than the SPARCstation or the HP 730.
3) ScientiJic: Andrew, SDM, IOStone, and Bonnie all target system development or workstation environments. Other application areas, such as scientific or supercom- puting code, have substantially different workload char- acteristics [38]. Typical scientific applications generally touch much more data and use much larger request sizes than workstation applications. To illustrate U0 performance for a supercomputing environment, we define two simple workloads: a large file read, in which we read a 100-MB file in 128-kB units, and a large file write, in which we write a 100-MB file in 128-kB units. In Fig. 13, we show results for our three system platforms.
VIII. CRITIQUE OF CURRENT BENCHMARKS In applying our list of benchmark goals from Section
V to current VO benchmarks, we see that there is much
System I Lame File Reads (MBh) I Large File Writes (MB/s) .%I MB/s I .64 MB/s SPARCstation I + I
Fig. 14. List of contacts for various benchmarks.
room for improvement. We show a qualitative evaluation of today’s U0 benchmarks in Fig. 15 and make the following observations:
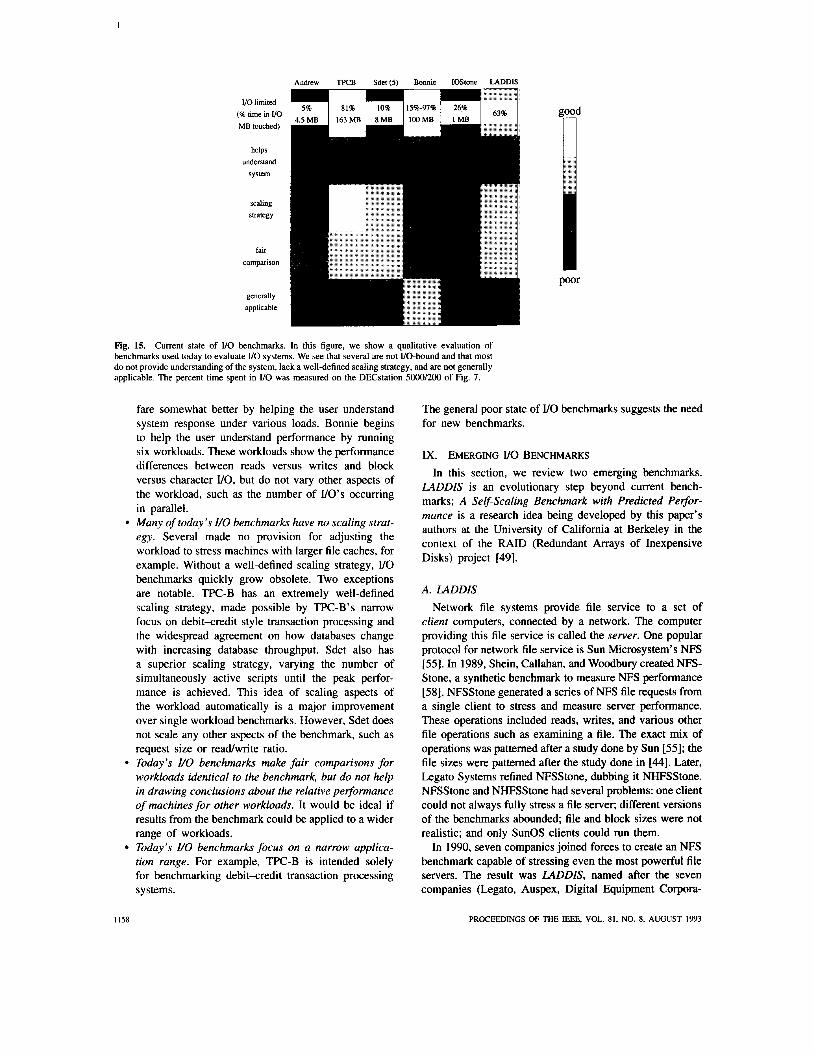
Many I/O benchmarks are not I/O-limited. On the DECstation 5000/200, Andrew, Sdet,2, and IOStone spend 25% or less of their time doing UO. Further, many of the benchmarks touch very little data. IOStone touches only 1 MB of user data; Andrew touches only 4.5 MB. The best of the group is Bonnie, but even Bonnie had some tests which were CPU-bound. Today’s I/O benchmarks do not help in understanding system performance. Andrew and IOStone give only a single bottom-line performance result. TPC-B and Sdet
2This refers to Sdet running at the peak throughput concurrency level of 5.
CHEN AND PATTERSON: STORAGE PERFORMANCE 1157
U 0 limited (5% time in VO MB touched)
helps understand
system
scaling strategy
fair comparison
generally applicable
Andrew TPCB Sdet(5) Bonnie IOStone LADDIS
Fig. 15. Current state of YO benchmarks. In this figure, we show a qualitative evaluation of benchmarks used today to evaluate YO systems. We see that several are not YO-bound and that most do not provide understanding of the system, lack a well-defined scaling strategy, and are not generally applicable. The percent time spent in YO was measured on the DECstation 5000/200 of Fig. 7.
e
b
e
1 I58
fare somewhat better by helping the user understand system response under various loads. Bonnie begins to help the user understand performance by running six workloads. These workloads show the performance differences between reads versus writes and block versus character VO, but do not vary other aspects of the workload, such as the number of VO’s occumng in parallel. Many of today’s I/O benchmarks have no scaling strat- egy. Several made no provision for adjusting the workload to stress machines with larger file caches, for example. Without a well-defined scaling strategy, YO benchmarks quickly grow obsolete. Two exceptions are notable. TPC-B has an extremely well-defined scaling strategy, made possible by TPC-B’s narrow focus on debit-credit style transaction processing and the widespread agreement on how databases change with increasing database throughput. Sdet also has a superior scaling strategy, varying the number of simultaneously active scripts until the peak perfor- mance is achieved. This idea of scaling aspects of the workload automatically is a major improvement over single workload benchmarks. However, Sdet does not scale any other aspects of the benchmark, such as request size or readwrite ratio. Today’s I/O benchmarks make fair comparisons for workloads identical to the benchmark, but do not help in drawing conclusions about the relative pe rformance of machines for other workloads. It would be ideal if results from the benchmark could be applied to a wider range of workloads. Today’s I/O benchmarks focus on a narrow applica- tion range. For example, TPC-B is intended solely for benchmarking debit-credit transaction processing systems.
good
P-r
The general poor state of VO benchmarks suggests the need for new benchmarks.
IX. EMERGING YO BENCHMARKS In this section, we review two emerging benchmarks.
LADDIS is an evolutionary step beyond current bench- marks; A Self-scaling Benchmark with Predicted Perfor- mance is a research idea being developed by this paper’s authors at the University of California at Berkeley in the context of the RAID (Redundant Arrays of Inexpensive Disks) project [49].
A. LADDIS Network file systems provide file service to a set of
client computers, connected by a network. The computer providing this file service is called the server. One popular protocol for network file service is Sun Microsystem’s NFS [ S I . In 1989, Shein, Callahan, and Woodbury created NFS- Stone, a synthetic benchmark to measure NFS performance [58]. NFSStone generated a series of NFS file requests from a single client to stress and measure server performance. These operations included reads, writes, and various other file operations such as examining a file. The exact mix of operations was patterned after a study done by Sun [55]; the file sizes were patterned after the study done in [U]. Later, Legato Systems refined NFSStone, dubbing it NHFSStone. NFSStone and NHFSStone had several problems: one client could not always fully stress a file server; different versions of the benchmarks abounded; file and block sizes were not realistic; and only SunOS clients could run them.
In 1990, seven companies joined forces to create an NFS benchmark capable of stressing even the most powerful file servers. The result was LADDIS, named after the seven companies (Legato, Auspex, Digital Equipment Corpora-
PROCEEDINGS OF THE IEEE, VOL. 81, NO. 8, AUGUST 1993
tion, Data General, Interphase, and Sun). LADDIS is based on NHFSStone but, unlike NHFSStone, runs on multiple, possibly heterogeneous, clients and networks [3 13, [43]. Like NHFSStone, LADDIS is a synthetic benchmark with a certain mix of operations. LADDIS is highly parame- terized-besides the percentage of each operation in the workload, LADDIS gives an evaluator the ability to change the number of clients issuing requests to the server, the rate at which each client issues requests, the total size of all files, the block size of VO requests, and the percentage of write requests that append to an existing file. LADDIS defines default values for all tunable parameters to make benchmark results standard and comparable. For example, by default, half of all YO requests are done in 8-kB blocks and half are done in fragments of 1, 2, or 4 kB.
LADDIS is quite similar to TPC-B in reporting philoso- phy. The preferred metric is a throughput (NFS operations per second) versus response time graph. As a more compact form, users may report the maximum throughput subject to an average response time constraint of 50 ms. Like TPC-B, LADDIS scales according to the reported throughput-for every 100 NFS operations per second of reported through- put, capacity must increase by 540 MB. LADDIS was released by SPEC in March of 1993 as the first part of the SPEC-SFS (System Level File Server) Suite of benchmarks.
B. A Self-scaling Benchmark with Predicted Pe formance In this section, we describe two new ideas in VO bench-
marks, proposed in more detail by this paper's authors in [7]. First, we describe a Self-scaling Benchmurk that automatically scales its workload depending on the perfor- mance of the system being measured. During evaluation, the benchmark automatically explores the workload space, searching for a relevant workload on which to base perfor- mance graphs.
Because the base workload resulting from the Self- Scaling Benchmark depends on the characteristics of each system, we lose the ability to directly compare performance results for multiple systems. We describe how to use predicted peformance to restore this ability. Predicted peformance uses the results of the Self-scaling Benchmark to estimate performance for unmeasured workloads. The ability to accurately estimate performance for arbitrary workloads yields several benefits. First, it allows fairer com- parisons to be drawn between machines for their intended use-today, users are forced to apply the relative perfor- mance from benchmarks that may be quite different from their actual workload. Second, the results can be applied to a much wider range of applications than today's benchmarks. Of course, the accuracy of the prediction determines how effectively prediction can be used to compare systems. We discuss the method and accuracy of prediction in Section
I ) A Self-Scaling Benchmark: The workload that the Self- Scaling Benchmark uses is characterized by five parame- ters. These parameters lead to the first-order performance effects in VO systems. See Fig.17 for examples of each parameter.
IX-B2.
uniqueBytes-the number of unique data bytes read or written in a workload; essentially the total size of the data. sizehlean-the average size of an VO request. We choose sizes from a normal Bernoulli distribution3 with a coefficient of variation equal to 1 . readFrac-the fraction of reads; the fraction of writes is 1 -readFrac. seqFrac-the fraction of requests that sequentially follow the prior request. For workloads with multiple processes, each process is given its own thread of addresses. processNum-the concurrency in the workload, that is, the number of processes simultaneously issuing VO.
In this paper, a workload refers to a user-level program with parameter values for each of the above five parameters. This program spawns and controls several processes if necessary.
The most important question in developing a synthetic workload is the question of representativeness [8]. A syn- thetic workload should have enough parameters such that its performance is close to that of an application with the same set of parameter value^.^ On the other hand, when workload models become too complex, users lose the ability to easily estimate the parameter values for their workload. Our five parameter workload model attempts to make a reasonable compromise between these two conflicting goals of simplicity and generality. Reference [7] gives a first- order verification that this synthetic workload model is general enough to capture the performance of interesting applications.
a ) Single-parameter graphs: Most current benchmarks report the performance for only a single workload. The better benchmarks report performance for multiple work- loads, usually in the form of a graph. TPC-B and Sdet, for example, report how performance varies with load. But even these better benchmarks do not show in general how performance depends on parameters such as request size or the mix of reads and writes.
The main output of the Self-scaling Benchmark is a set of performance graphs, one for each parameter (uniqueBytes, sizeMean, readFrac, processNum, and seqFrac) as in Fig. 17. While graphing one parameter, all other parameters remain fixed. The value at which a parameter is fixed while graphing other parameters is called the focal point for that parameter. The vector of all focal points is called thefocal vector. In Fig. 17, for example, the focal vector is (uniqueBytes = 12 and 42 MB, sizeMean = 20 kB, readFrac = 0.5, processNum = 1, seqFrac = 0.5). Hence, in Fig. 17(e), uniqueBytes is varied while the sizeMean = 20 kB, readFrac = 0.5, processNum = 1, and seqFrac = 0.5.
'This distribution of sizes can be particularly useful in representing multiple applications running simultaneously.
4Given the uncertain path of future computer development, it is im- possible to determine a priori all the possible parameters necessary to ensure representativeness. Even for current systems, it is possible to imagine VO workloads that interact with the system in such a way that no synthetic workload (short of a full trace) could duplicate that VO workload's performance.
CHEN AND PATTERSON: STORAGE PERFORMANCE I159

!!,v L. sizeMean
readFrac
Fig. 16. Workloads reported by a set of single parameter graphs. This figure illustrates the range of workloads reported by a set of single parameter graphs for a workload of three parameters.
Fig. 16 illustrates the workloads reported by one set of such graphs for a three-parameter workload space. Al- though these graphs show much more of the entire workload space than current benchmarks, they still show only single- parameter performance variations; they do not display de- pendencies between parameters. Unfortunately, completely exploring the entire five-dimensional workload space re- quires far too much time. For example, an orthogonal sampling of six points per dimension requires 65, almost 8OOO, points. On the Sprite DECstation, each workload takes approximately 10 min. to measure, thus 8OOO points would take almost 2 months to gather! In contrast, mea- suring six points for each graph of the five parameters requires only 30 points and 5 h. The usefulness of these single-parameter graphs depends entirely on how accurately they characterize the performance of the entire workload space. In the section on predicted performance we shall see that, for a wide range of U 0 systems, the shapes of these performance curves are relatively independent of the specific values of the other parameters.
The Self-scaling Benchmark scales by choosing different focal points for different systems. Two factors influence the choice of focal points. First, the benchmark should display a range of relevant workloads. Relevancy in turn involves two factors: the workloads must perform reasonably well, and the workloads must be practical. Second, the benchmark should adequately characterize the entire workload space with only a few graphs. Reference [7] gives more details as to how the benchmark chooses the focal points and the ranges of the graphs.
b) Examples: This section contains results from run- ning the Self-Scaling Benchmark on the SPARCstation 1+ and a DECStation 5000/200 described in Fig. 7.
Figure 17 shows results from the Self-scaling Bench- mark on a SPARCstation l+. The uniqueBytes values that characterized the two performance regions are 12 and 42 MB. Graphs (a)-(d) show the file cache performance region, measured with uniqueBytes = 12 MB. Graphs (0-(i) show the disk performance region, measured with uniqueBytes = 42 MB. We learn the following from the Self-Scaling Benchmark:
The effective file cache size is 21 MB. Applications that have a working set larger than 21 MB will go to disk frequently. Larger request sizes yield higher performance. This effect is more pronounced in the disk region than in
the file cache region. Reads are faster than writes, even when all the data fit in the file cache (Fig. 17(b)). Although the data fit in the file cache, writes still cause i-node changes to be written to disk periodically for reliability in case of a system crash. This additional overhead for writing causes writes to be slower than reads. Increasing concurrency does not improve performance. As expected, without parallelism in the disk system, workload parallelism is of little value. Sequentiality offers no benefit in the file cache region (Fig. 17(b)) but offers substantial benefit in the disk region (Fig. 17(a)).
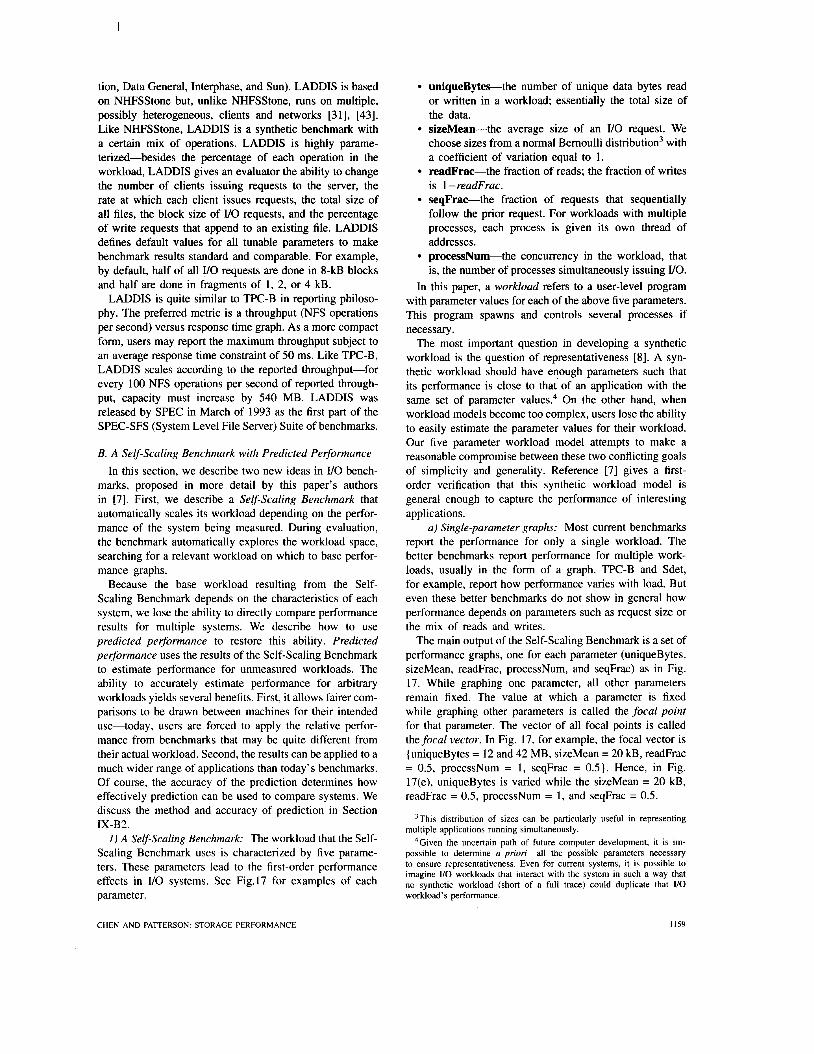
Figure 18 shows self-scaling benchmark results for the DECstation 5OOO/200. The uniqueBytes graph (Fig. 18(a)) shows three performance plateaus, uniqueBytes = 0 to 5 MB, uniqueBytes = 5 to 20 MB, and uniqueBytes > 20 MB. Thus the self-scaling benchmark gathers three sets of measurements: at uniqueBytes 2, 15, and 36 MB. The most interesting phenomenon involves readFrac (Fig. 18(b)).
In the first performance level (uniqueBytes = 2 MB), reads and writes are the same speed. At the next perfor- mance level (uniqueBytes = 15 MB), reads are much faster than writes. This is due to the effective write cache of Sprite's LFS being much smaller than the read cache, so reads are cached in this performance region while writes are not. The write cache of LFS is smaller because LFS limits the number of dirty cache blocks to avoid deadlock during cleaning. The effective file cache size for writes is only 5-8 MB, while for reads it is 20 MB [51].5 In contrast, when uniqueBytes is large enough to exercise the disk for both reads and writes, writes are faster than reads. This phenomenon is due to Sprite's LFS, which improves write performance by grouping multiple small writes into fewer large writes.
2) Predicted Performance: The Self-scaling Benchmark increases our understanding of a system and scales the workload to remain relevant. However, it complicates the task of comparing results from two systems. The problem is the benchmark may choose different workloads on which to measure each system. Also, though the output graphs from the Self-Scaling Benchmark apply to a wider range of applications than today's U 0 benchmarks, they stop short of applying to all workloads. In this section, we show how predicted performance solves these problems by enabling us to accurately estimate the U 0 performance for arbitrary workloads based on the performance of a small set of measured workloads (that is, those measured by the Self-Scaling Benchmark).
A straightforward approach for estimating performance for all possible workloads is to measure a comprehensive set of workloads. However, measuring all possible workloads is not feasible within reasonable time constraints. A more attractive approach is to use the graphs output by the Self-Scaling Benchmark (such as Fig. 17) to estimate
"e default limit was tuned for a machine with 128 MB of memory; in production use, this limit would be changed for the 32-MB system being tested.
1160 PROCEEDINGS OF THE IEEE, VOL. 81. NO. 8, AUGUST 1993

readFrac 3.0 1
3,0, sizeMean (KB)
A
f e
; 1.0-
i
r
Y 0 2.0-
(
0.0-
I I h r
h r ! 0 5 -
0 2 0 0 2 0 U U
1 0 4 -
I
0 U
e f b e e
! 10 ! 10
0 3 - ( ( ( M
B
)
; 0 2 -
) S )
01-
"." . 10 IN 0.0 0.5 I .r
sireMean (KB) readFrac
(a) (b)
seqFrac uniqueBytes (MB)
processNum 3.01
I .5 2.0 pmcessNum
I .o
(C)
0,7, sizeMean (KB)
0.5 I .o seqFrac
0.0 0 10 20 30 40 50 60 uniqueBytes (MB) -",,
(d) (e)
0.7 1 readFrac 0.7 1 processNum
0 6 0 6
t i s 0 5 r 0 5
e e 6 6
0 U 0 U
f 0 4 b 0 4
0 3 0 3
/ 0 2 / 0 2
) S s
)
0 1 01
00 00
Fig. 17. Results from a self-scaling benchmark when run on a SPARCstation I+. This figure shows results from the Self-Scaling Benchmark when run on a SPARCstation I+. The focal point for uniqueBytes is 12 MB in graphs (aHd) and 42 MB in graphs ( M i ) . For all graphs, the focal points for the other parameters is sizeMean = 20 kB, readFrac = 0.5, processNum = 1, seqFrac = 0.5. Increasing sizes improve performance, more so for disk accesses than file cache accesses (parts (a) and (0). Reads are faster than writes, even when data are in the file cache. This is because inodes must still go to disk. Sequentiality increases performance only for the disk region (part (i)).
0.0' I 10 IN lMxl
sizeMean (KB)
(0
seqFrac
0.6 0.71
0.0 0.5 I .o seqFrac
?%
(i)
performance for unmeasured workloads. This is similar in We estimate performance for unmeasured workloads concept to work done by Saavedra-Barrera, who predicts by assuming the shape of a performance curve for CPU performance by measuring the performance for a small one parameter is independent of the values of the set of FORTRAN operations [53]. other parameters. This assumption leads to an overall
CHEN AND PATTERSON: STORAGE PERFORMANCE 1161
uniqueBytes (MB)
'1
1 .o O J 0.0 0.5
0 I O 20 30 40 50 uniqueBytes (MB) Gv
(a)
Fig. 18. Selected results from Self-Scaling Benchmark when run on a DECstation 5000/200. In this figure, we show selected results from the Self-scaling Benchmark when run on a DECstation 5000/200. Graph (a) shows three plateaus in uniqueBytes, due to the different effective file cache sizes for reads and writes. The focal points chosen for uniqueBytes are 2, 15, and 36 MB. The focal points for the other parameters is sizeMean = 40 kB, readFrac = 0.5, processNum = 1, seqFrac = 0.5. Note in graph (b) how reads are much faster than writes at uniqueBytes 15 MB, slightly slower than writes at uniqueBytes 36 MB, and approximately the same speed at uniqueBytes 2 MB. These results helped us understand that, due to the default limit on the number of dirty file cache blocks allowed. the effective file cache size for writes was much smaller than the file cache size for reads.
readFrac @$
I Pf processNum s1 Sf S i z e M W
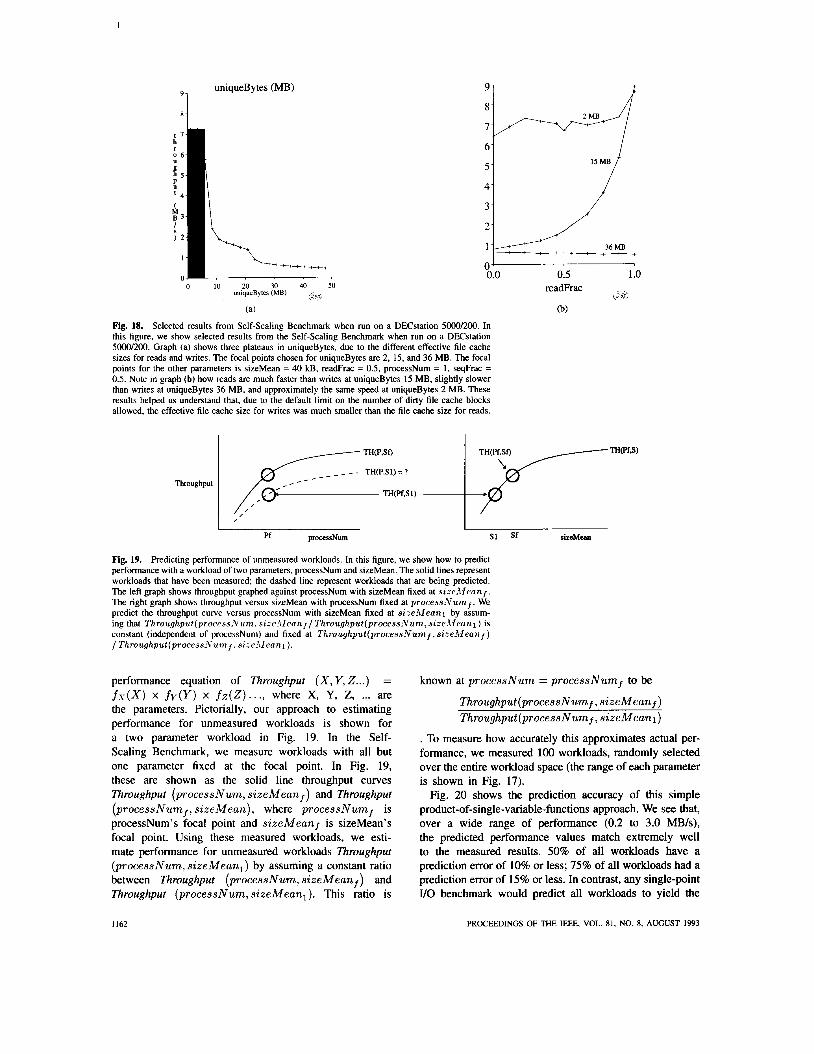
Fig. 19. Predicting performance of unmeasured workloads. In this figure, we show how to predict performance with a workload of two parameters, processNum and sizeMean. The solid lines represent workloads that have been measured; the dashed line represent workloads that are being predicted. The left graph shows throughput graphed against processNum with sizeMean fixed at s i z e i l f e a n f . The right graph shows throughput versus sizeMean with processNum fixed at processiVum f . We predict the throughput curve versus processNum with sizeMean fixed at sizeilfeanl by assum- ing that Throughput(process.Vuna. s i z e : l f e a n f / Throughput(pr0cessNum. skeilfeanl ) is constant (independent of processNum) and fixed at Throughput(processiVumf, sizeilfeanf ) / Throughput(process;Vuiiif. sizeAf ean 1 ).
performance equation of Throughput (X, Y, Z...) = f<y(X) x f y ( Y ) x fz(2) ..., where X, Y, Z, ... are the parameters. Pictorially, our approach to estimating performance for unmeasured workloads is shown for a two parameter workload in Fig. 19. In the Self- Scaling Benchmark, we measure workloads with all but one parameter fixed at the focal point. In Fig. 19, these are shown as the solid line throughput curves Throughput (process Num, sizeMean f ) and Throughput (processNumf, sizeMean), where processNumf is processNum's focal point and sizeMeanf is sizeMean's focal point. Using these measured workloads, we esti- mate performance for unmeasured workloads Throughput (processNum, sizeMeanl) by assuming a constant ratio between Throughput (processNum, sizeMeanf) and Throughput (processNum, sizeMean,). This ratio is
known at processNum = processNumf to be
Throughput (processNumf , sizeMeanf ) Throughput (processNumf , sizeMean1)
. To measure how accurately this approximates actual per- formance, we measured 100 workloads, randomly selected over the entire workload space (the range of each parameter is shown in Fig. 17).
Fig. 20 shows the prediction accuracy of this simple product-of-single-variable-functions approach. We see that, over a wide range of performance (0.2 to 3.0 MB/s), the predicted performance values match extremely well to the measured results. 50% of all workloads have a prediction error of 10% or less; 75% of all workloads had a prediction error of 15% or less. In contrast, any single-point VO benchmark would predict all workloads to yield the
I I62 PROCEEDINGS OF THE IEEE, VOL. 81, NO. 8, AUGUST 1993

Prediction Accuracy 3.0 1 /
bonnie
0.0 0.3 0.6 0.9 1.2 1.5 1.8 2.1 2.4 2.7 3.0 measured (MB/s)
Fig. 20. Evaluation of prediction accuracy for SPARCstation I + with 1 disk. This figure graphs the predicted performance against the actual (measured) performance for the SPARCstation in Fig. 17. Each point represents a single workload, with each parameter value randomly chosen from its entire range shown in Fig. 17. The closer the points lie to the solid line, the better the prediction accuracy. Median error is 10%. Performance for each workload ranges from 0.2 to 3.0 MBls. For comparison, we show the single-performance point predicted by Andrew, IOStone, and Bonnie (sequential block write), and Sdet as horizontal dashed lines. Clearly these single point benchmarks do not predict the performance of many workloads.
same performance. For example, Andrew’s workload and IOStone’s workload both yield performance of 1.25 MB/s, leading to a median prediction error of 50%. Bonnie’s sequential block write yields a performance of 0.32 MB/s, for a median prediction error of 65%. These are shown by the dashed lines in Fig. 20.
The accuracy of our predictions has two important rami- fications. First, it renders the graphs from the Self-Scaling Benchmark much more useful, since they can be used to estimate performance for other workloads. Second, it supports the assumption of shape independence; the shape of each graph in Fig. 17 is approximately independent of the values of the other parameters.
X. SUMMARY YO performance, long neglected by computer architects
and evaluators [ 181, is rapidly becoming an area of impor- tant research activity. As CPU and memory speed increases continue to outstrip VO speed increases, this trend will continue and accelerate. VO performance evaluation differs from other types of computer performance evaluation in several key ways:
The main metric in processor evaluation is speed, or its reciprocal, time. In contrast, VO evaluation considers many more factors-capacity, reliability, and several composite metrics such as throughput-response time graphs. Researchers have been developing CPU benchmarks for many years. In contrast, U 0 benchmarks have only
Fig. 21. Summary of median prediction errors. This table sum- marizes the prediction errors on all systems. “Enhanced Error” on all machines but the Convex refers to the prediction error on the sample of workloads not in the thrashing region between the file cache and disk locality regions. For the Convex, prediction error was most closely correlated with sizeMean, so enhanced error refers to points with sizes smaller than 300 kB. The last column in the table lists the inherent measurement error, which was measured by running the same set of random workloads twice and using one E n to “predict” performance of the other run.
recently begun to be of wider interest. As a result, VO benchmarks are not as mature as CPU benchmarks. VO performance, even more than CPU performance, depends critically on what workload is applied. Hence, the benchmarks evaluators use in measuring U0 per- formance is of primary importance. VO benchmarks must scale in order to remain relevant. Benchmarks generally require several years to become accepted. By this time, nonscaling benchmarks have been made nearly obsolete by the rapid increases in VO system capacity or other developments. Of the benchmarks described in this paper, TPC-B, Sdet, and LADDIS have the greatest chance of remaining relevant for many years due to how they scale the size of the benchmark according to the performance of the system.
Storage systems are improving rapidly in some areas. Disks and tape systems are improving in capacity/cost; disk arrays are improving the available data and YO throughput; file caching and solid-state disks are improving response times for cacheable data. Overall, however, further innova- tion is needed to keep up with the incredible gains made in CPU performance.
We have described a new approach to YO performance evaluation-the Self-scaling Benchmark with Predicted Performance. The Self-Scaling Benchmark scales automati- cally to current and future systems by scaling the workload to the system under test. It also gives insight on a machine’s performance characteristic by revealing its performance dependencies for each of five workload parameters.
Predicted performance restores the ability to compare two machines on the same workload lost in the Self-Scaling Benchmark. Further, it extends this ability to workloads that have not been measured by estimating performance based on the graphs from the Self-Scaling Benchmark. We have shown that this prediction is far more accurate over a wide range of workloads than any single point benchmark.
We hope this approach will help VO architects understand YO systems and will help direct their efforts in developing the next generation of storage systems.
REFERENCES
\
[ l ] G. M. Amdahl, “Validity of the single processor approach to achieving large scale computing capabilities,” in Proc. AFIPS 1967Spring Joint Computer Conj 30, Apr. 1967, pp. 483485.
CHEN AND PA’ITERSON: STORAGE PERFORMANCE 1163
[2] Anon et al., A measure of transaction processing power,” Datamation, vol. 31, no.7, pp. 112-118, Apr. 1985.
[3] National Science Foundation Workshop on Next Generation Secondary Storage Architecture. Bodega Bay, CA: Nat. Sci. Foundation, May 1989.
[4] C. Cassidy, “DEC’s ESE20 boosts performance,” DEC Profes- sional, pp. 102-110, May 1989.
[5] P. M. Chen and D. A. Patterson, “Maximizing performance in a striped disk array,” in Proc. 1990 Int. Symp. on Computer Architecture (Seattle, WA, May 1990). pp. 322-331.
[6] P. M. Chen, G. Gibson, R. H. Katz, and D. A. Patterson, “An evaluation of redundant arrays of disks using an Amdahl5890,” in Proc. 1990 ACM SIGMETRICS Con$ on Measurement and Modeling of Computer Systems (Boulder, CO, May 1990).
[7] P. M. Chen and D. A. Patterson, “A New approach to YO perfor- mance evaluation-Self-scaling YO benchmarks, predicted YO performance (conference version),” in Proc. 1993 ACM SIG- METRICS Con$ on Measurement and Modeling of Computer Systems (Santa Clara, CA, 1993).
[8] D. Ferrari, “On the foundations of artificial workload design,” in Proc. 1984 ACM SIGMETRICS Con$ on Measurement and Modeling of Computer Systems, 1984, pp. 8-14.
[9] J. A. Fine, T. E. Anderson, M. D. Dahlin, J. Frew, M. Olson, and D. A. Patterson, “Abstracts: A latency-hiding technique for high-capacity mass storage systems,” Sequoia Tech. Rep. 92/1 I , Univ. of California at Berkeley, Mar. 1992.
[ lo] S. Gaede, “Tools for research in computer workload character- ization,” in Experimental Computer Performance and Evalua- tion, D. Ferrari and M. Spadoni, Eds., 1981.
[ l l ] -, “A scaling technique for comparing interactive system capacities,” in 13th Int. Con$ on Management and Performance Evaluation of Computer Systems, 1982, pp. 6 2 4 7 , CMG 1982.
[12] P. P. Gelsinger, P. A. Gargini, G. H. Parker, and A. Y. C. Yu, “Microprocessors circa 2000,” IEEE Spectrum, vol. 26, pp. 43-47, Oct. 1989.
[13] G. A. Gibson, “Redundant disk arrays: Reliable, parallel sec- ondary storage,” Univ. of California at Berkeley, Computer Sci. Dept. Rep. 91/613; also available from MIT Press, 1992;‘
[ 141 G. A. Gibson, R. H. Patterson, and M. Satyanarayanan, Disk reads with DRAM latency,” presented at the 3rd Workshop on Workstation Operating Systems, Key Biscayne, FL, Apr. 1992.
[15] A. Hac, “A distributed algorithm for performance improvement through file replication, file migration, and process migration,” IEEE Trans. Software Eng., vol. 15, no.1 I , pp. 1459-1470, Nov. 1989.
[16] J. M. Harker, D. W. Brede, R. E. Pattison, G. R. Santana, and L. G. Taft, “A quarter centure of disk file innovation,” IBM .I. Res. Devel., vol. 25, 110.5, pp. 677489, Sept. 1981.
171 R. L. Henderson and A. Poston, “MSSII and RASH: A main- frame UNIX based mass storage system with a rapid access storage hierarchy file management system,” in Winter USENIX 1989, pp. 65-83, Jan. 1989.
181 J. L. Hennessy and D. A. Patterson, Computer Architecture: A Quantitative Approach. San Mateo, CA: Morgan Kaufmann Pub., 1990.
191 M. D. Hill, S. J. Eggers, J. R. Larus, G. S. Taylor, G. Adams, B. K. Bose, G. A. Gibson, P. M. Hansen, J. Keller, S. I. Kong, C. G. Lee, J. M. Pendleton, S. A. Ritchie, D. A. Wood, B. G. Zorn, P. N. Hilfinger, D. Hodges, R. H. Katz, J. K. Ousterhout, and D. A. Patterson, “Design decisions in SPUR,” IEEE Computer, vol. 19, no.11, Nov. 1986.
[20] M. Holland and G. Gibson, “Parity declustering for continuous operation in redundant disk arrays,” in Proc. 5th Int. Con$ on Architectural Support for Programming Languages and Opra- tiong Systems (ASPLOS-V), Oct. 1992, pp. 23-35.
[21] J. H. Howard, M. L. Kazar, S. G. Menees, D. A. Nichols, M. Satyanarayanan, R. N. Sidebotham, and M. J. West, “Scale and performance in a distributed file system,” ACM Trans. Comput. Syst., vol. 6, no.1, pp. 51-81, Feb. 1988.
[22] I. Hu, “Measuring file access patterns in UNIX,” in Proc. 1986 ACM SIGMETRICS Con$ on Measurement and Modeling of Computer Systems, 1986, pp. 15-20.
[23] IBM 0661 Disk Drive Product Description-Model 371, IBM, July 1989.
[24] 0. G. Johnson, “Three-dimensional wave equation computa- tions on vector computers,” Proc. IEEE, vol. 72, no. I , Jan. 1984.
1164
[25] A. L. Jones, “SSD is cheaper than DASD,” Storage Technology Corp. Tech. Rep., Oct. 1989.
[26] R. H. Katz, D. W. Gordon, and J. A. Tuttle, “Storage system metrics for evaluating disk m a y organizations,” Univ. of California at Berkeley, Computer Sci. Dept. Rep. 90/611, Dec. 1990.
[27] R. H. Katz, T. E. Anderson, J. K. Ousterhout, and D. A. Pat- terson, “Robo-line storage: Low latency, high capacity storage systems over geographically distributed networks,” Univ. of California at Berkeley, Computer Sci. Dept. Rep. 91/651, Sept. 1991.
[28] M. Y. Kim, “Synchronized disk inteleaving,” IEEE Trans. Compur., vol. C-35, pp. 978-988, Nov. 1986.
[29] E. K. Lee and R. H. Katz, “An analytic performance model of disk arrays and its applications,” Univ. of California at Berkeley, Computer Sci. Dept. Rep. 91/660, 1991.
[30] -, “Performance consequences of parity placement in disk arrays,’’ in Proc. 4th Int. Con$ on Architectural Support for Programming Languages and Operating Systems (ASPLOS-IV), Apr. 1991, pp. 190-199.
[31] J. Levitt, “Better benchmarks are brewing,” Unix Today!, Jan 1992.
[32] M. Livny, S. Khoshafian, and H. Boral. “Multi-disk manage- ment algorithms,” in Proc. 1987 ACM SIGMETRICS Con$ on Measurement and Modeling of Computer Systems, May 1987,
[33] K. J. McDonell, “Taking performance evaluation out of the stone age,” in Proc. Summer Usenix Tech. Con$ (Phoenix, AZ, June 1987), pp. 407417.
[34] J. Menon and M. Hartung, “The IBM 3990 Model 3 disk cache,” IBM Tech Rep. RI 5994 (59593), Dec. 1987.
[35] J. Menon and J. Kasson, “Methods for improved update per- formance of disk arrays,’’ in Proc. Hawaii Int. Con$ on System Sciences, July 1989.
[36] RSS-600 Rotary Storage System Product Information, Metrum, 1991.
[37] E. L. Miller, “File migration on the Cray Y-MP at the National Center for Atmospheric Research,” University of California at Berkeley, Computer Sci, Dept. Rep. 91/638, June 1991.
[38] E. L. Miller and R. H. Katz, “InpuVoutput behavior for su- percomputing applications,” in Proc. Supercomputing ’91, Nov.
[39] J. B. J. T. Liu, Ed., “RAID: A technology poised for explosive growth,” Montgomery Securities Rep. DJIA:2902, Dec. 1991.
[40] R. R. Muntz and J. C. S. Lui, “Performance analysis of disk arrays under failure,” in Proc. 16th Con$ on Very Large Data Bases, 1990, VLDB XVI.
[41] G. J. Myers, A. Y. C. Yu, and D. L. House, “Microprocessor technology trends,” Proc. IEEE, vol. 74,110.12, pp. 1605-1622, Dec. 1986.
[42] M. N. Nelson, B. B. Welch, and J. K. Ousterhout, “Caching in the Sprite network file system,” ACM Trans. Computer Syst., vol. 6, no.1, pp.134-154, Feb. 1988.
[43] B. Nelson, B. Lyon, M. Wittle, and B. Keith, “LADDIS-A multi-vendor and vendor-neutral NFS Benchmark,” presented at the UniForum Conf., Jan. 1992.
[U] J. K. Ousterhout, H. Da Costa, et al., “A trace-driven analysis of the UNIX 4.2 BSD file system,” Operating Syst. Rev., vol. 19, 110.5, pp. 15-24, Dec. 1985; also in Proc. 10th Symp. on Operating System Principles.
[45] J. K. Ousterhout, A. Cherenson, F. Douglis, and M. Nelson, “The Sprite network operating system,” IEEE Computer, vol. 21, 110.2, pp. 23-36, Feb. 1988.
[46] J. K. Ousterhout and F. Douglis, “Beating the YO bottleneck A case for log-structured file systems,” SIGOPS, vol. 23. no.1,
pp. 69-77.
1991, pp, 567-576.
pp. 11-28, J&. 1989. [47] J. K. Ousterhout, “Why aren’t operating systems getting faster
as fast as hardware?,” in Proc. USENIX Summer Conf, June 1990, pp. 247-256.
[48] A. Park and J. C. Becker, “IOStone: A synthetic file system benchmark,” Computer Archit. News, vol. 18, no. 2, pp. 45-52, June 1990.
[49] D. A. Patterson, G. Gibson, and R. H. Katz, “A case for redundant arrays of inexoensive disks (RAID),” in Int. Con$ on Management of Data (SIGMOD), June 1988, pp. 109-1 16.
[50] M. Rosenblum and J. K. Ousterhout, ‘The design and imple- mentation of a log-structured file system,” in Proc. 13th ACM Symp. on Operating Systems Principles, Oct. 1991.
PROCEEDINGS OF THE IEEE, VOL. SI , NO. 8. AUGUST 1993

M. Rosenblum, Sprite LFS write cache size, personal commu- nication, July 1992. SPEC SDM 1.0 Release Manual, System Performance Evalua- tion Cooperative, 1991. R. H. Saavedra-Barrera, A. J. Smith, and E. Miya, “Machine characterization based on an abstract high-level language ma- chine,” IEEE Trans. Comput., vol. 38, no. 12, pp. 1659-1679, Dec. 1989. K. Salem and H. Garcia-Molina, “Disk striping,” in Proc, 2nd Int. Con$ on Data Engineering, 1986, pp. 336342. R. Sandberg, D. Goldbert, S. Kleiman, D. Walsh, and B. Lyon, “Design and implementation of the Sun network filesystem,” presented at the Summer 1985 Usenix Conf., 1985. V. Scott, “Is standardization of benchmarks feasible?,” in Proc. BUSCON Conf (Long Beach, CA, Feb. 1990), pp. 139-147. M. Seltzer and M. Olson, “LIBTP: Portable, modular, transac- tions for UNIX,” in Proc USENIX Winter Tech. Conf 1992, Jan. 1992. B. Shein, M. Callahan, and P. Woodbuy, “NFSStone-A net- work file server performance benchmark, “ in Proc. USENIX Summer Tech. Conf 1989, pp. 269-275. A. J. Smith, “Sequentiality and prefetching in database sys- tems,” ACM Trans. Database Syst., vol. 3, no.3, pp. 223-247, 1978. -, “Analysis of long term file reference pattems for applica- tion of file migration algorithms,” IEEE Trans. Software Eng., vol. SE-7, no.4, pp. 403417, 1981. -, “Optimization of U 0 systems by cache disk and file migration: A summary,” Performance Evaluation, vol. 1, 110.3,
__ , “Disk cache-miss ratio analysis and design considera- tions,” ACM Trans. Comput. Syst., vol. 3, no.3, pp. 161-203, Aug. 1985. D. Stodolsky and G. A. Gibson, “Parity logging: Overcoming the small write problem in redundant disk arrays,” in P roc. I993 Int. Symp. on Computer Architecture, May 1993. TP C Benchmark A Standard Specijication, Transaction Process- ing Performance Council, Nov. 1989. TP C Benchmark B Standard Specijicarion, Transaction Process- ing Performance Council, Aug. 1990. E. Tan and B. Vermeulen, “Digital audio tape for data storage,” IEEE Spectrum, vol. 26, pp. 34-38, Oct. 1989. E. Thanhardt and G. Harano, “File migration in the NCAR mass storage system,” in Proc. 9th IEEE Symp. on Mass Storage Systems, Oct. 1988. B. Vermeulen, “Helical scan and DAT-A revolution in computer technology,” in Systems Design and Networks Con$ (SDNC), May 1989, pp. 79-86.
pp. 249-262, NOV. 1981.
Peter M. Chen received the B.S. degree in electrical engineering from Pennsylvania State University, University Park, in 1987 and the M.S. and Ph.D. degrees in computer science from the University of California at Berkeley in 1989 and 1992, respectively.
He is currently an Assistant Professor in the Department of Electrical Engineering and Com- puter Science at the University of Michigan at Ann Arbor. His research interests include computer architecture and operating systems and
focus on improving the performance, capacity, and reliability of computer storage systems.
David A. Patterson (Fellow, IEEE) has taught Computer Architecture at the University of Cal- ifornia at Berkeley since 1977. There, he led the design and implementation of RISC I. This re- search became the foundation of SPARC archi- tecture. He was also a leader of the Redundant Arrays of Inexpensive Disks (RAID) project, which led to high-performance U 0 systems from several companies. These projects resulted in the ACM Distinguished Disseration Awards. He is currently the holder of the campus-wide en-
dowed E.H. and M.E. Pardee Chair of Computer Science. He is also active in the Sequoia 2000 Project: an interdisciplinary effort among global change researchers, computer scientists, and engineers to develop a massive information storage and retrieval system that will enable scientists to understand and predict the impact of global change on our environment, such as global warming, ozone depletion, and deforestation. Also, he is a Corporate Fellow of Thinking Machines, Corp., and consults for TMC and Sun Microsystems. He won the ACM Outstanding Educator Award and the University of California’s Distinguished Teaching Award. His most recently published book, co-authored with J. Hennessey of Stanford University, is Computer Organization and Design: The Hardware/Sofrware Inte flare.
Dr. Patterson is a member of the National Academy of Engineering.
CHEN AND PATTERSON: STORAGE PERFORMANCE I I65