ispod district report - cumberland 11apr09
Upload: north-carolina-alliance-for-athletics-health-physical-education-recreation-and-dance-ncaahperd
Post on 23-Mar-2016
214 views
DESCRIPTION
IsPOD Data Report Fall 2010 % Needy ID School Name Grades 3-5 Grades 1-2 SPARK Trained? Using FG? 2010- 2011 ADM FG Response Rates # Staff Trained 2011 NC IsPOD Evaluation Conducted by NCAAHPERD/NC DPH All rights reserved. a. Average Daily Membership (ADM) for first month of the 2010-2011 school year.TRANSCRIPT

CUMBERLAND
COUNTY REPORT
The North Carolina Alliance for Athletics, Health, Physical Education, Recreation,and Dance (NCAAHPERD), launched In-school Prevention of Obesity
andDisease (IsPOD) in 2007. The initiative began with a grant from the NC Healthand Wellness Trust Fund and was expanded with grants from the Blue
CrossBlue Shield of North Carolina Foundation. The expansion to a state-wide programis supported by a $3.6 million grant from the Kate B. Reynolds Charitable
Trust.NCAAHPERD is engaged with a large network of health and physical educationgroups seeking greater opportunities for a healthier and more creative
NorthCarolina.
IsPOD Data
Report
Fall 2010
2011 NC IsPOD Evaluation
Conducted by NCAAHPERD/NC DPH All rights reserved.
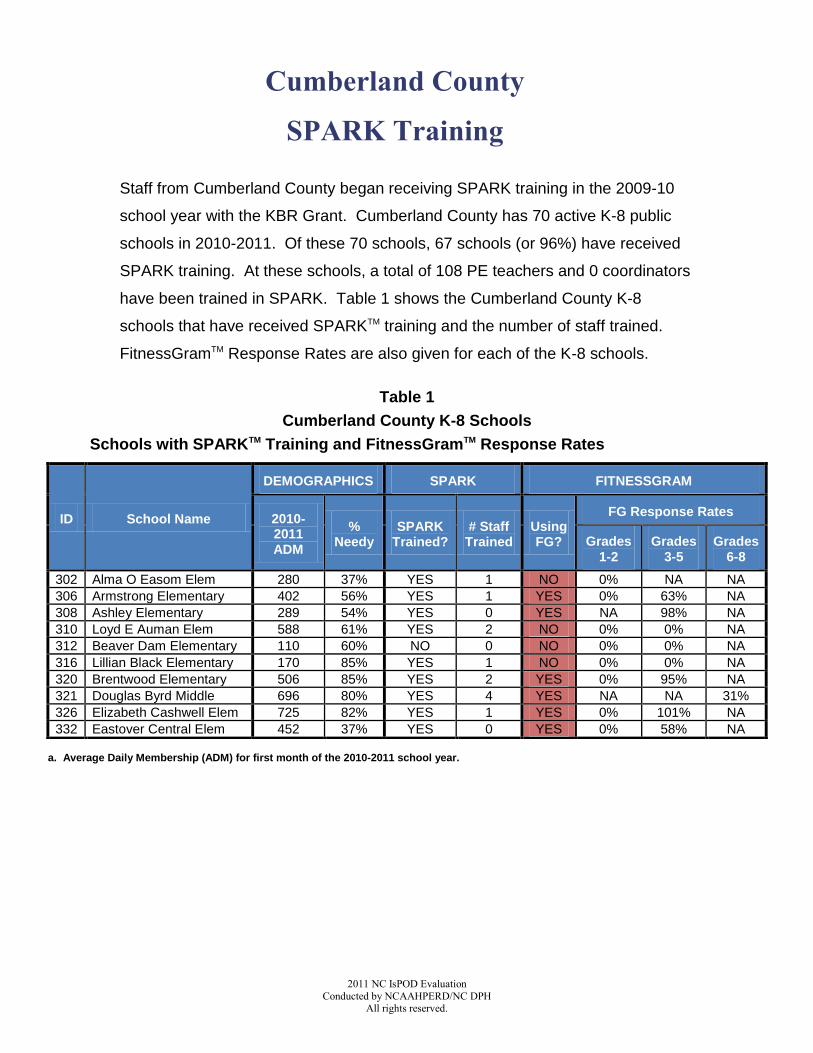
Cumberland County
SPARK Training
Staff from Cumberland County began receiving SPARK training in the 2009-10
school year with the KBR Grant. Cumberland County has 70 active K-8 public
schools in 2010-2011. Of these 70 schools, 67 schools (or 96%) have received
SPARK training. At these schools, a total of 108 PE teachers and 0 coordinators
have been trained in SPARK. Table 1 shows the Cumberland County K-8
schools that have received SPARKTM training and the number of staff trained.
FitnessGramTM Response Rates are also given for each of the K-8 schools.
Table 1
Cumberland County K-8 Schools
Schools with SPARKTM Training and FitnessGramTM Response Rates
a. Average Daily Membership (ADM) for first month of the 2010-2011 school year.
ID School Name
DEMOGRAPHICS SPARK FITNESSGRAM
2010-2011 ADM
% Needy
SPARK Trained?
# Staff Trained
Using FG?
FG Response Rates
Grades 1-2
Grades 3-5
Grades 6-8
302 Alma O Easom Elem 280 37% YES 1 NO 0% NA NA
306 Armstrong Elementary 402 56% YES 1 YES 0% 63% NA
308 Ashley Elementary 289 54% YES 0 YES NA 98% NA
310 Loyd E Auman Elem 588 61% YES 2 NO 0% 0% NA
312 Beaver Dam Elementary 110 60% NO 0 NO 0% 0% NA
316 Lillian Black Elementary 170 85% YES 1 NO 0% 0% NA
320 Brentwood Elementary 506 85% YES 2 YES 0% 95% NA
321 Douglas Byrd Middle 696 80% YES 4 YES NA NA 31%
326 Elizabeth Cashwell Elem 725 82% YES 1 YES 0% 101% NA
332 Eastover Central Elem 452 37% YES 0 YES 0% 58% NA
2011 NC IsPOD Evaluation Conducted by NCAAHPERD/NC DPH
All rights reserved.
2
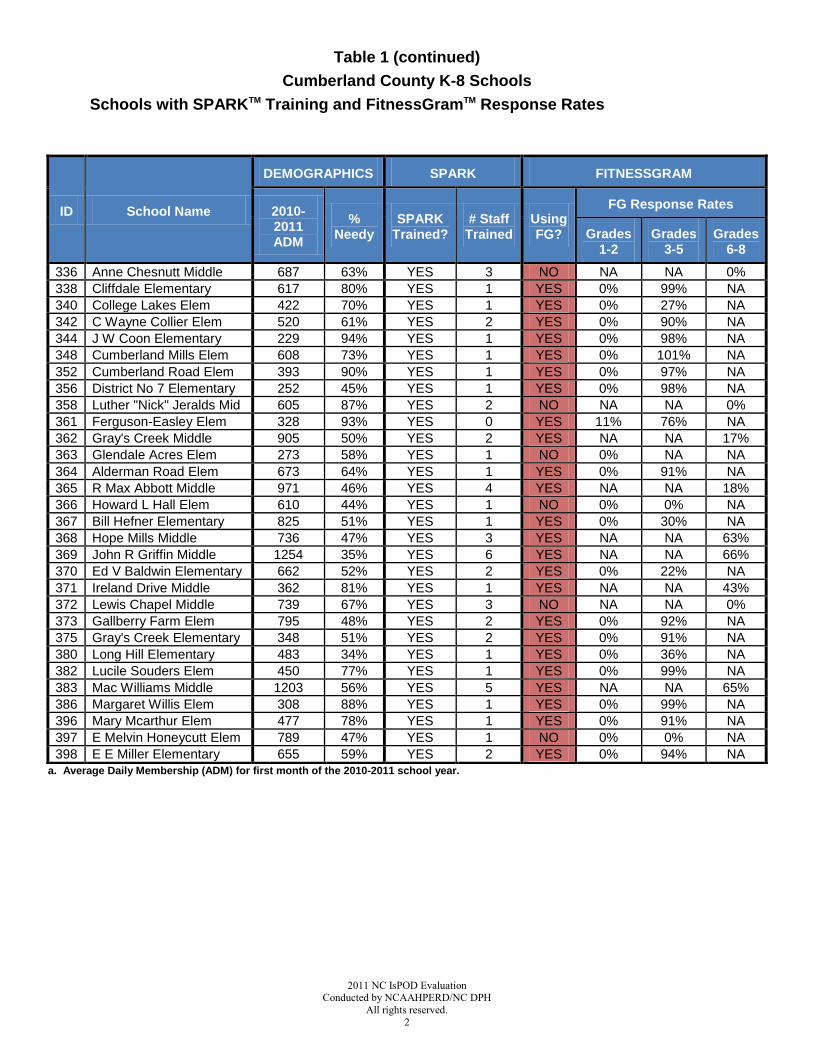
Table 1 (continued)
Cumberland County K-8 Schools
Schools with SPARKTM Training and FitnessGramTM Response Rates
a. Average Daily Membership (ADM) for first month of the 2010-2011 school year.
ID School Name
DEMOGRAPHICS SPARK FITNESSGRAM
2010-2011 ADM
% Needy
SPARK Trained?
# Staff Trained
Using FG?
FG Response Rates
Grades 1-2
Grades 3-5
Grades 6-8
336 Anne Chesnutt Middle 687 63% YES 3 NO NA NA 0%
338 Cliffdale Elementary 617 80% YES 1 YES 0% 99% NA
340 College Lakes Elem 422 70% YES 1 YES 0% 27% NA
342 C Wayne Collier Elem 520 61% YES 2 YES 0% 90% NA
344 J W Coon Elementary 229 94% YES 1 YES 0% 98% NA
348 Cumberland Mills Elem 608 73% YES 1 YES 0% 101% NA
352 Cumberland Road Elem 393 90% YES 1 YES 0% 97% NA
356 District No 7 Elementary 252 45% YES 1 YES 0% 98% NA
358 Luther "Nick" Jeralds Mid 605 87% YES 2 NO NA NA 0%
361 Ferguson-Easley Elem 328 93% YES 0 YES 11% 76% NA
362 Gray's Creek Middle 905 50% YES 2 YES NA NA 17%
363 Glendale Acres Elem 273 58% YES 1 NO 0% NA NA
364 Alderman Road Elem 673 64% YES 1 YES 0% 91% NA
365 R Max Abbott Middle 971 46% YES 4 YES NA NA 18%
366 Howard L Hall Elem 610 44% YES 1 NO 0% 0% NA
367 Bill Hefner Elementary 825 51% YES 1 YES 0% 30% NA
368 Hope Mills Middle 736 47% YES 3 YES NA NA 63%
369 John R Griffin Middle 1254 35% YES 6 YES NA NA 66%
370 Ed V Baldwin Elementary 662 52% YES 2 YES 0% 22% NA
371 Ireland Drive Middle 362 81% YES 1 YES NA NA 43%
372 Lewis Chapel Middle 739 67% YES 3 NO NA NA 0%
373 Gallberry Farm Elem 795 48% YES 2 YES 0% 92% NA
375 Gray's Creek Elementary 348 51% YES 2 YES 0% 91% NA
380 Long Hill Elementary 483 34% YES 1 YES 0% 36% NA
382 Lucile Souders Elem 450 77% YES 1 YES 0% 99% NA
383 Mac Williams Middle 1203 56% YES 5 YES NA NA 65%
386 Margaret Willis Elem 308 88% YES 1 YES 0% 99% NA
396 Mary Mcarthur Elem 477 78% YES 1 YES 0% 91% NA
397 E Melvin Honeycutt Elem 789 47% YES 1 NO 0% 0% NA
398 E E Miller Elementary 655 59% YES 2 YES 0% 94% NA
2010 NC IsPOD Evaluation Conducted by NCAAHPERD/NC DPH
All rights reserved.
3
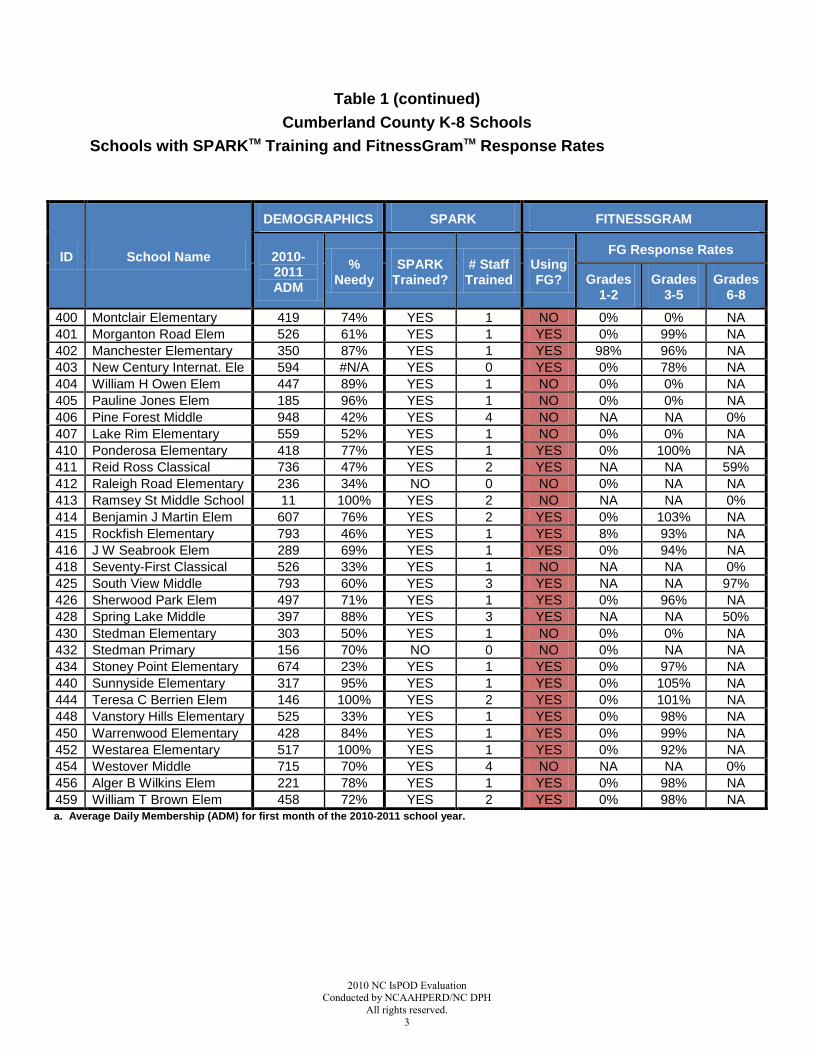
Table 1 (continued)
Cumberland County K-8 Schools
Schools with SPARKTM Training and FitnessGramTM Response Rates
a. Average Daily Membership (ADM) for first month of the 2010-2011 school year.
ID School Name
DEMOGRAPHICS SPARK FITNESSGRAM
2010-2011 ADM
% Needy
SPARK Trained?
# Staff Trained
Using FG?
FG Response Rates
Grades 1-2
Grades 3-5
Grades 6-8
400 Montclair Elementary 419 74% YES 1 NO 0% 0% NA
401 Morganton Road Elem 526 61% YES 1 YES 0% 99% NA
402 Manchester Elementary 350 87% YES 1 YES 98% 96% NA
403 New Century Internat. Ele 594 #N/A YES 0 YES 0% 78% NA
404 William H Owen Elem 447 89% YES 1 NO 0% 0% NA
405 Pauline Jones Elem 185 96% YES 1 NO 0% 0% NA
406 Pine Forest Middle 948 42% YES 4 NO NA NA 0%
407 Lake Rim Elementary 559 52% YES 1 NO 0% 0% NA
410 Ponderosa Elementary 418 77% YES 1 YES 0% 100% NA
411 Reid Ross Classical 736 47% YES 2 YES NA NA 59%
412 Raleigh Road Elementary 236 34% NO 0 NO 0% NA NA
413 Ramsey St Middle School 11 100% YES 2 NO NA NA 0%
414 Benjamin J Martin Elem 607 76% YES 2 YES 0% 103% NA
415 Rockfish Elementary 793 46% YES 1 YES 8% 93% NA
416 J W Seabrook Elem 289 69% YES 1 YES 0% 94% NA
418 Seventy-First Classical 526 33% YES 1 NO NA NA 0%
425 South View Middle 793 60% YES 3 YES NA NA 97%
426 Sherwood Park Elem 497 71% YES 1 YES 0% 96% NA
428 Spring Lake Middle 397 88% YES 3 YES NA NA 50%
430 Stedman Elementary 303 50% YES 1 NO 0% 0% NA
432 Stedman Primary 156 70% NO 0 NO 0% NA NA
434 Stoney Point Elementary 674 23% YES 1 YES 0% 97% NA
440 Sunnyside Elementary 317 95% YES 1 YES 0% 105% NA
444 Teresa C Berrien Elem 146 100% YES 2 YES 0% 101% NA
448 Vanstory Hills Elementary 525 33% YES 1 YES 0% 98% NA
450 Warrenwood Elementary 428 84% YES 1 YES 0% 99% NA
452 Westarea Elementary 517 100% YES 1 YES 0% 92% NA
454 Westover Middle 715 70% YES 4 NO NA NA 0%
456 Alger B Wilkins Elem 221 78% YES 1 YES 0% 98% NA
459 William T Brown Elem 458 72% YES 2 YES 0% 98% NA

2011 NC IsPOD Evaluation Conducted by NCAAHPERD/NC DPH
All rights reserved.
4
Cumberland County
FitnessGramTM Response Rates
In fall 2010, 49 of the Cumberland County K-8 schools, or 70%, conducted
FitnessGramTM assessments and submitted their data. Table 2 shows the
FitnessGramTM Response Rates by grade for all Cumberland County K-8 schools
combined.
Table 2
FitnessGram™ Response Rates
For 49 K-8 Schools in Cumberland County
Grade 2010-2011
Average Daily Membershipa.
FitnessGramTM Response Rate
Number of FitnessGramTM
Student Ids
Percent of ADM
1st 3699 51 1%
2nd 4123 102 2%
3rd 3906 2801 72%
4th 4123 2858 69%
5th 3947 2655 67%
6th 3984 1071 27%
7th 3921 1198 31%
8th 4045 1697 42%
Grades 1 - 8 31748 12433 39% a. Average Daily Membership (ADM) for first month of the 2010-2011 school year.

2010 NC IsPOD Evaluation Conducted by NCAAHPERD/NC DPH
All rights reserved.
5
Body Mass Index (BMI)
North Carolina
Fall 2010 Percent in Health Fitness Zone (HFZ)
FitnessGram™ Results for 579 NC K-8 Schools in 58 NC Districts
Grade
Percent in HFZ Counts in HFZ
Female Male All
Female Male All
Total FG
TM
Results N in HFZ
Total FG
TM
Results N in HFZ
Total FG
TM
Results N in HFZ
1st 60% 59% 59% 4567 2748 4768 2806 9335 5554
2nd 57% 59% 58% 5228 3003 5176 3030 10404 6033
3rd 55% 55% 55% 14701 8147 15387 8397 30088 16544
4th 54% 53% 53% 15209 8208 15858 8373 31067 16581
5th 51% 49% 50% 14996 7603 15616 7646 30612 15249
6th 50% 49% 50% 7632 3828 7491 3685 15123 7513
7th 52% 50% 51% 7010 3679 7179 3623 14189 7302
8th 55% 53% 54% 7190 3950 7172 3837 14362 7787
Total 54% 53% 53% 76533 41166 78647 41397 155180 82563
60
%
57
%
55
%
54
%
51
%
50
%
52
%
55
%59
%
59
%
55
%
53
%
49
%
49
%
50
% 53
%
0%
10%
20%
30%
40%
50%
60%
70%
80%
90%
100%
1st 2nd 3rd 4th 5th 6th 7th 8th
Perc
en
t in
HF
Z
Grade
Female Male

2011 NC IsPOD Evaluation Conducted by NCAAHPERD/NC DPH
All rights reserved.
6
Body Mass Index (BMI)
Cumberland County
Fall 2010 Percent in Healthy Fitness Zone (HFZ)
FitnessGram™ Results for 49 K-8 Schools in Cumberland County
Grade
Percent in HFZ Counts in HFZ
Female Male All
Female Male All
Total FG
TM
Results N in HFZ
Total FG
TM
Results N in HFZ
Total FG
TM
Results N in HFZ
1st 57% 61% 59% 23 13 23 14 46 27
2nd 42% 53% 47% 45 19 40 21 85 40
3rd 51% 53% 52% 1132 575 1129 604 2261 1179
4th 49% 48% 49% 1179 583 1243 600 2422 1183
5th 46% 45% 45% 1091 504 1173 522 2264 1026
6th 47% 51% 49% 427 199 428 220 855 419
7th 52% 48% 50% 527 276 597 286 1124 562
8th 55% 55% 55% 802 441 728 398 1530 839
Total 50% 50% 50% 5226 2610 5361 2665 10587 5275
57
%
42
%
51
%
49
%
46
%
47
% 52
% 55
%61
%
53
%
53
%
48
%
45
%
51
%
48
%
55
%
0%
10%
20%
30%
40%
50%
60%
70%
80%
90%
100%
1st 2nd 3rd 4th 5th 6th 7th 8th
Perc
en
t in
HF
Z
Grade
Female Male

2010 NC IsPOD Evaluation Conducted by NCAAHPERD/NC DPH
All rights reserved.
7
PACER
North Carolina
Fall 2010 Percent in Health Fitness Zone (HFZ)
FitnessGram™ Results for 579 NC K-8 Schools in 58 NC Districts
Grade
Percent in HFZ Counts in HFZ
Female Male All
Female Male All
Total FG
TM
Results N in HFZ
Total FG
TM
Results N in HFZ
Total FG
TM
Results N in HFZ
4th 96% 45% 70% 8911 8523 9343 4217 18254 12740
5th 91% 53% 72% 9378 8564 9541 5015 18919 13579
6th 71% 50% 60% 4434 3153 4670 2332 9104 5485
7th 64% 41% 52% 4124 2648 4554 1870 8678 4518
8th 43% 37% 40% 4282 1841 4867 1791 9149 3632
Total 79% 46% 62% 31129 24729 32975 15225 64104 39954
96
%
91
%
71
%
64
%
43
%
45
%
53
%
50
%
41
%
37
%
0%
10%
20%
30%
40%
50%
60%
70%
80%
90%
100%
4th 5th 6th 7th 8th
Perc
en
t in
HF
Z
Grade
Female Male

2011 NC IsPOD Evaluation Conducted by NCAAHPERD/NC DPH
All rights reserved.
8
PACER
Cumberland County
Fall 2010 Percent in Healthy Fitness Zone (HFZ)
FitnessGram™ Results for 49 K-8 Schools in Cumberland County
Grade
Percent in HFZ Counts in HFZ
Female Male All
Female Male All
Total FG
TM
Results N in HFZ
Total FG
TM
Results N in HFZ
Total FG
TM
Results N in HFZ
4th 90% 23% 56% 705 634 747 174 1452 808
5th 80% 30% 55% 713 573 730 222 1443 795
6th 77% 56% 67% 253 194 239 135 492 329
7th 65% 37% 50% 279 180 318 119 597 299
8th 42% 39% 40% 504 213 487 188 991 401
Total 73% 33% 53% 2454 1794 2521 838 4975 2632
90
%
80
%
77
%
65
%
42
%
23
%
30
%
56
%
37
%
39
%
0%
10%
20%
30%
40%
50%
60%
70%
80%
90%
100%
4th 5th 6th 7th 8th
Perc
en
t in
HF
Z
Grade
Female Male

2010 NC IsPOD Evaluation Conducted by NCAAHPERD/NC DPH
All rights reserved.
9
AEROBIC CAPACITY (VO2 MAX)
North Carolina
Fall 2010 Percent in Health Fitness Zone (HFZ)
FitnessGram™ Results for 579 NC K-8 Schools in 58 NC Districts
Grade
Percent in HFZ Counts in HFZ
Female Male All
Female Male All
Total FG
TM
Results N in HFZ
Total FG
TM
Results N in HFZ
Total FG
TM
Results N in HFZ
4th 75% 88% 82% 9312 6968 10261 9024 19573 15992
5th 68% 85% 77% 10121 6915 10886 9222 21007 16137
6th 60% 80% 70% 4261 2575 4407 3517 8668 6092
7th 58% 77% 68% 3914 2273 4417 3411 8331 5684
8th 57% 73% 65% 3859 2193 4371 3187 8230 5380
Total 66% 83% 75% 31467 20924 34342 28361 65809 49285
75
%
68
%
60
%
58
%
57
%
88
%
85
%
80
%
77
%
73
%
0%
10%
20%
30%
40%
50%
60%
70%
80%
90%
100%
4th 5th 6th 7th 8th
Perc
en
t in
HF
Z
Grade
Female Male

2011 NC IsPOD Evaluation Conducted by NCAAHPERD/NC DPH
All rights reserved.
10
AEROBIC CAPACITY (VO2 MAX)
Cumberland County
Fall 2010 Percent in Healthy Fitness Zone (HFZ)
FitnessGram™ Results for 49 K-8 Schools in Cumberland County
Grade
Percent in HFZ Counts in HFZ
Female Male All
Female Male All
Total FG
TM
Results N in HFZ
Total FG
TM
Results N in HFZ
Total FG
TM
Results N in HFZ
4th 70% 86% 78% 624 436 695 599 1319 1035
5th 65% 85% 76% 650 425 766 653 1416 1078
6th 57% 82% 70% 208 119 209 171 417 290
7th 61% 77% 70% 225 137 271 208 496 345
8th 55% 73% 64% 442 242 447 328 889 570
Total 63% 82% 73% 2149 1359 2388 1959 4537 3318
70
%
65
%
57
% 61
%
55
%
86
%
85
%
82
%
77
%
73
%
0%
10%
20%
30%
40%
50%
60%
70%
80%
90%
100%
4th 5th 6th 7th 8th
Perc
en
t in
HF
Z
Grade
Female Male

2010 NC IsPOD Evaluation Conducted by NCAAHPERD/NC DPH
All rights reserved.
11
CURL-UP
North Carolina
Fall 2010 Percent in Health Fitness Zone (HFZ)
FitnessGram™ Results for 579 NC K-8 Schools in 58 NC Districts
Grade
Percent in HFZ Counts in HFZ
Female Male All
Female Male All
Total FG
TM
Results N in HFZ
Total FG
TM
Results N in HFZ
Total FG
TM
Results N in HFZ
1st 76% 73% 74% 965 734 1006 734 1971 1468
2nd 77% 79% 78% 1502 1160 1477 1169 2979 2329
3rd 79% 80% 80% 15470 12228 16202 12995 31672 25223
4th 78% 80% 79% 15960 12491 16569 13180 32529 25671
5th 75% 78% 77% 15984 12059 16466 12870 32450 24929
6th 79% 84% 82% 8812 6993 8813 7428 17625 14421
7th 79% 86% 82% 8043 6330 8273 7086 16316 13416
8th 81% 85% 83% 8252 6655 8247 6974 16499 13629
Total 78% 81% 80% 74988 58650 77053 62436 152041 121086
76
%
77
%
79
%
78
%
75
% 79
%
79
%
81
%
73
%
79
%
80
%
80
%
78
% 84
%
86
%
85
%
0%
10%
20%
30%
40%
50%
60%
70%
80%
90%
100%
1st 2nd 3rd 4th 5th 6th 7th 8th
Perc
en
t in
HF
Z
Grade
Female Male

2011 NC IsPOD Evaluation Conducted by NCAAHPERD/NC DPH
All rights reserved.
12
CURL-UP
Cumberland County
Fall 2010 Percent in Healthy Fitness Zone (HFZ)
FitnessGram™ Results for 49 K-8 Schools in Cumberland County
Grade
Percent in HFZ Counts in HFZ
Female Male All
Female Male All
Total FG
TM
Results N in HFZ
Total FG
TM
Results N in HFZ
Total FG
TM
Results N in HFZ
1st NA NA NA 0 0 0 0 0 0
2nd 76% 88% 82% 51 39 51 45 102 84
3rd 77% 80% 78% 1275 980 1268 1011 2543 1991
4th 75% 78% 77% 1323 998 1387 1079 2710 2077
5th 71% 74% 73% 1198 847 1247 927 2445 1774
6th 92% 90% 91% 504 462 506 457 1010 919
7th 89% 92% 91% 536 477 594 547 1130 1024
8th 86% 89% 87% 796 684 722 640 1518 1324
Total 79% 81% 80% 5683 4487 5775 4706 11458 9193
76
%
77
%
75
%
71
%
92
%
89
%
86
%
88
%
80
%
78
%
74
%
90
%
92
%
89
%
0%
10%
20%
30%
40%
50%
60%
70%
80%
90%
100%
1st 2nd 3rd 4th 5th 6th 7th 8th
Perc
en
t in
HF
Z
Grade
Female Male

2010 NC IsPOD Evaluation Conducted by NCAAHPERD/NC DPH
All rights reserved.
13
PUSH-UP
North Carolina
Fall 2010 Percent in Health Fitness Zone (HFZ)
FitnessGram™ Results for 579 NC K-8 Schools in 58 NC Districts
Grade
Percent in HFZ Counts in HFZ
Female Male All
Female Male All
Total FG
TM
Results N in HFZ
Total FG
TM
Results N in HFZ
Total FG
TM
Results N in HFZ
1st 49% 60% 55% 913 449 955 570 1868 1019
2nd 56% 68% 62% 1340 748 1323 900 2663 1648
3rd 54% 68% 61% 14668 7913 15411 10458 30079 18371
4th 52% 68% 60% 15070 7821 15638 10696 30708 18517
5th 48% 66% 57% 15294 7278 15815 10395 31109 17673
6th 61% 74% 67% 8225 4984 8137 6021 16362 11005
7th 63% 73% 68% 7610 4783 7780 5704 15390 10487
8th 64% 68% 66% 7581 4814 7631 5192 15212 10006
Total 55% 69% 62% 70701 38790 72690 49936 143391 88726
49
%
56
%
54
%
52
%
48
%
61
%
63
%
64
%
60
%
68
%
68
%
68
%
66
%
74
%
73
%
68
%
0%
10%
20%
30%
40%
50%
60%
70%
80%
90%
100%
1st 2nd 3rd 4th 5th 6th 7th 8th
Perc
en
t in
HF
Z
Grade
Female Male

2011 NC IsPOD Evaluation Conducted by NCAAHPERD/NC DPH
All rights reserved.
14
PUSH-UP
Cumberland County
Fall 2010 Percent in Healthy Fitness Zone (HFZ)
FitnessGram™ Results for 49 K-8 Schools in Cumberland County
Grade
Percent in HFZ Counts in HFZ
Female Male All
Female Male All
Total FG
TM
Results N in HFZ
Total FG
TM
Results N in HFZ
Total FG
TM
Results N in HFZ
1st 63% 78% 71% 24 15 27 21 51 36
2nd 73% 86% 79% 51 37 51 44 102 81
3rd 49% 67% 58% 1235 611 1233 831 2468 1442
4th 46% 68% 57% 1264 581 1338 910 2602 1491
5th 42% 65% 54% 1161 490 1205 780 2366 1270
6th 63% 76% 69% 489 308 477 362 966 670
7th 59% 73% 67% 468 278 553 404 1021 682
8th 61% 71% 65% 686 416 622 440 1308 856
Total 51% 69% 60% 5378 2736 5506 3792 10884 6528
63
%
73
%
49
%
46
%
42
%
63
%
59
%
61
%
78
%
86
%
67
%
68
%
65
%
76
%
73
%
71
%
0%
10%
20%
30%
40%
50%
60%
70%
80%
90%
100%
1st 2nd 3rd 4th 5th 6th 7th 8th
Perc
en
t in
HF
Z
Grade
Female Male

2010 NC IsPOD Evaluation Conducted by NCAAHPERD/NC DPH
All rights reserved.
15
SIT AND REACH
North Carolina
Fall 2010 Percent in Health Fitness Zone (HFZ)
FitnessGram™ Results for 579 NC K-8 Schools in 58 NC Districts
Grade
Percent in HFZ Counts in HFZ
Female Male All
Female Male All
Total FG
TM
Results N in HFZ
Total FG
TM
Results N in HFZ
Total FG
TM
Results N in HFZ
1st 76% 75% 76% 739 565 792 597 1531 1162
2nd 71% 73% 72% 1198 854 1147 834 2345 1688
3rd 65% 65% 65% 13580 8848 14245 9265 27825 18113
4th 64% 61% 62% 14008 8914 14557 8894 28565 17808
5th 63% 61% 62% 14016 8778 14390 8720 28406 17498
6th 58% 60% 59% 7432 4329 7376 4446 14808 8775
7th 62% 58% 60% 6849 4233 6971 4076 13820 8309
8th 66% 61% 63% 6769 4466 6950 4243 13719 8709
Total 63% 62% 63% 64591 40987 66428 41075 131019 82062
76
%
71
%
65
%
64
%
63
%
58
% 62
% 66
%
75
%
73
%
65
%
61
%
61
%
60
%
58
%
61
%
0%
10%
20%
30%
40%
50%
60%
70%
80%
90%
100%
1st 2nd 3rd 4th 5th 6th 7th 8th
Perc
en
t in
HF
Z
Grade
Female Male

2011 NC IsPOD Evaluation Conducted by NCAAHPERD/NC DPH
All rights reserved.
16
SIT AND REACH
Cumberland County
Fall 2010 Percent in Healthy Fitness Zone (HFZ)
FitnessGram™ Results for 49 K-8 Schools in Cumberland County
Grade
Percent in HFZ Counts in HFZ
Female Male All
Female Male All
Total FG
TM
Results N in HFZ
Total FG
TM
Results N in HFZ
Total FG
TM
Results N in HFZ
1st NA NA NA 0 0 0 0 0 0
2nd 76% 66% 71% 51 39 50 33 101 72
3rd 56% 61% 59% 1203 677 1168 714 2371 1391
4th 59% 54% 57% 1218 720 1273 692 2491 1412
5th 55% 55% 55% 1104 604 1142 626 2246 1230
6th 27% 46% 37% 182 50 185 85 367 135
7th 32% 45% 39% 154 50 184 82 338 132
8th 43% 43% 43% 351 151 330 141 681 292
Total 54% 55% 54% 4263 2291 4332 2373 8595 4664
76
%
56
% 59
%
55
%
27
% 32
%
43
%
66
%
61
%
54
%
55
%
46
%
45
%
43
%
0%
10%
20%
30%
40%
50%
60%
70%
80%
90%
100%
1st 2nd 3rd 4th 5th 6th 7th 8th
Perc
en
t in
HF
Z
Grade
Female Male

2010 NC IsPOD Evaluation Conducted by NCAAHPERD/NC DPH
All rights reserved.
17
TRUNK LIFT
North Carolina
Fall 2010 Percent in Health Fitness Zone (HFZ)
FitnessGram™ Results for 579 NC K-8 Schools in 58 NC Districts
Grade
Percent in HFZ Counts in HFZ
Female Male All
Female Male All
Total FG
TM
Results N in HFZ
Total FG
TM
Results N in HFZ
Total FG
TM
Results N in HFZ
1st 84% 79% 82% 950 799 960 761 1910 1560
2nd 85% 83% 84% 1398 1184 1349 1113 2747 2297
3rd 88% 87% 87% 14810 13027 15557 13474 30367 26501
4th 89% 86% 87% 15237 13546 15857 13572 31094 27118
5th 74% 70% 72% 15609 11565 16015 11169 31624 22734
6th 80% 78% 79% 8282 6608 8178 6411 16460 13019
7th 79% 79% 79% 7715 6111 7764 6111 15479 12222
8th 81% 79% 80% 7663 6232 7805 6187 15468 12419
Total 82% 80% 81% 71664 59072 73485 58798 145149 117870
84
%
85
% 88
%
89
%
74
% 80
%
79
%
81
%
79
% 83
% 87
%
86
%
70
%
78
%
79
%
79
%
0%
10%
20%
30%
40%
50%
60%
70%
80%
90%
100%
1st 2nd 3rd 4th 5th 6th 7th 8th
Perc
en
t in
HF
Z
Grade
Female Male

2011 NC IsPOD Evaluation Conducted by NCAAHPERD/NC DPH
All rights reserved.
18
TRUNK LIFT
Cumberland County
Fall 2010 Percent in Healthy Fitness Zone (HFZ)
FitnessGram™ Results for 49 K-8 Schools in Cumberland County
Grade
Percent in HFZ Counts in HFZ
Female Male All
Female Male All
Total FG
TM
Results N in HFZ
Total FG
TM
Results N in HFZ
Total FG
TM
Results N in HFZ
1st NA NA NA 0 0 0 0 0 0
2nd 82% 84% 83% 51 42 51 43 102 85
3rd 85% 85% 85% 1301 1100 1282 1084 2583 2184
4th 84% 81% 82% 1274 1069 1361 1100 2635 2169
5th 68% 65% 67% 1202 818 1223 795 2425 1613
6th 85% 91% 88% 448 383 456 417 904 800
7th 88% 84% 86% 478 420 555 468 1033 888
8th 84% 85% 84% 657 550 577 492 1234 1042
Total 81% 80% 80% 5411 4382 5505 4399 10916 8781
82
%
85
%
84
%
68
%
85
%
88
%
84
%
84
%
85
%
81
%
65
%
91
%
84
%
85
%
0%
10%
20%
30%
40%
50%
60%
70%
80%
90%
100%
1st 2nd 3rd 4th 5th 6th 7th 8th
Perc
en
t in
HF
Z
Grade
Female Male