is the time allocated to review patent applications
TRANSCRIPT

1
Is the Time Allocated to Review Patent Applications Inducing Examiners to Grant Invalid
Patents?: Evidence from Micro-Level Application Data
Michael D. Frakes and Melissa F. Wasserman∗
We explore how examiner behavior is altered by the time allocated for reviewing patent
applications. Insufficient examination time may hamper examiner search and rejection efforts,
leaving examiners more inclined to grant invalid applications. To test this prediction, we use
application-level data to trace the behavior of individual examiners over the course of a series of
promotions that carry with them reductions in examination-time allocations. We find evidence
demonstrating that such promotions are associated with reductions in examination scrutiny and
increases in granting tendencies, as well as evidence that those additional patents being issued
on the margin are of below-average quality.
Evidence suggests that patents play an important role in both promoting innovative activity
and shaping the direction of technological growth (Moser, 2004). In recent years, however, the
patent system has come under voracious criticism (Burk & Lemley, 2009). Critiques of the
system has largely coalesced around one charge: the U.S. Patent and Trademark Office (Patent
Office or Agency) is issuing too many invalid patents—i.e., patents on inventions that fail to
∗ Frakes: Associate Professor of Law, Northwestern University School of Law; Faculty Research Fellow, National Bureau of
Economic Research; Fellow, Northwestern Institute for Policy Research (e-mail: [email protected]). Wasserman:
Associate Professor of Law; Richard and Anne Stockton Faculty Scholar; & Richard W. and Marie L. Corman Scholar,
University of Illinois College of Law. The work was funded in part by University of Illinois at Urbana Champaign Research
Board, Award 12088 and the Cornell Institute for the Social Sciences Small Grant Award. We are grateful to Matt Berry at the
National Center for Supercomputing Applications at the University of Illinois for collecting data from the Patent Office’s PAIR
database. We are grateful to Alberto Galasso for providing data on pairwise citations and for providing helpful comments. We
are likewise grateful to Bhaven Sampat for providing data on examiner-driven citations. We thank Kevin Collins, Rochelle
Dreyfuss, John Golden, Wendy Gordon, Paul Heald, Scott Hemphill, Mark Lemley, Ronald Mann, Alan Marco, Peter Molk, Lisa
Ouellette, Jim Poterba, Arti Rai, Saurabh Vishnubhakat, Heidi Williams, and participants at the 14th Annual Intellectual Property
Scholar Conference, the Big Ten Untenured Conference, the Northwestern Law School Profs Talk, the 3rd Annual Empirical
Patent Law Conference, the Georgetown Law and Economics Workshop, the Northwestern Institute for Policy Research
Workshop, the 9th Annual Conference on Empirical Legal Studies, Patent Statistics for Decision Makers 2014, Tilburg Law and
Economics Workshop, Works-in-Progress Intellectual Property, American Law and Economics Association 2015 Annual
Meeting, Eighth Annual Searle Center Conference on Innovation Economics, 2015 Yale/Stanford/Harvard Junior Faculty Forum,
faculty workshops at University of Texas School of Law, Indiana University Maurer School of Law, and the Washington
University in St. Louis for useful comments.

2
meet the patentability requirements (Jaffe & Lerner, 2004). In board terms, a Pat6ent Office that
is routinely granting patents on inventions that are already known or represent only a trivial
advancement over current scientific understanding will tend to burden society with the
deadweight losses associated with monopoly protection without reaping the benefits of spurred
innovation (Nordhaus 1969). In addition, invalidly issued patents can be utilized by
nonpracticing entities or “patent trolls” to opportunistically extract licensing fees from
innovators, while also stunting follow-on discoveries in markets characterized by cumulative
innovation (Scotchmer 1991, Sampat and Williams 2014, Galasso and Schankerman 2014).
Although commentators have suggested a plethora of reasons as to why the Agency may be
biased towards allowing patents, there exists little compelling empirical evidence that any
particular feature of the Patent Office actually induces the Agency to over-grant patents.1 Absent
such evidence, policymakers are provided with little guidance as to how to address the root
causes of the patent quality crisis. This paper begins to rectify this deficiency by addressing one
feature of the Patent Office that scholars have identified as likely to influence an examiner’s
decision to grant a patent: the time allotted to review a patent application (Jaffe and Lerner,
2004). Because patent applications are presumed to comply with the statutory patentability
requirements when filed, the burden of proving unpatentability rests with the Agency. That is, a
patent examiner who fails to explicitly set forth reasons as to why the application fails to meet
the patentability standards must grant the patent. To the extent that examiners are given
insufficient examination time, one might expect them to conduct limited reviews of applications,
leaving them in a weaker position to identify proper bases of rejections and thereby leaving them
in a position where they must grant patents at elevated rates in light of this legal presumption of
1 See, however, Frakes and Wasserman (2013, 2015), which explore how the Patent Office’s fee schedule, along with the
Office’s inability to finally reject a patent application, creates an incentive for a financially constrained agency to allow
additional patents.

3
validity. Much anecdotal evidence has been put forth to suggest that patent examiners indeed
face binding examination time constraints, implicating such concerns.2
To more comprehensively test this simple hypothesis and challenge this anecdotal sentiment,
we rely upon the fact that examination times decrease upon certain types of examiner promotion.
Our basic empirical strategy is to follow individual examiners throughout the course of their
careers and to track the evolution of their examination behavior—including their granting rates—
as they experience promotions that diminish the amount of examination time at their disposal.
Bolstering our ability to separate the effect of allocated examination time from other factors that
may change generally upon promotion is the fact that examiner promotions and pay raises come
in several varieties, some of which bear on examination times and some of which do not. Our
identification strategy is further strengthened by the fact that the promotions of interest do not
transpire lock-step with increases in years of experience, allowing us to decouple an experience
effect from a promotion-of-interest effect, combined with the fact that applications are generally
randomly assigned to examiners within technology groups.
To execute this empirical strategy, we estimate examiner fixed-effects specifications using
novel, micro-level data on over 1 million patent applications disposed of between 2002 and
2012, merged with rich, examiner roster data received from the Patent Office pursuant to a series
of Freedom of Information Act requests (FOIA). Our results suggest that as an examiner is
given less time to review an application, the less active she becomes in searching for prior art,
the less likely she becomes to make obviousness rejections (which are especially time-intensive
2 In an August 2010 report commissioned by the Patent Office to reassess the schedule by which they set examination-
time expectations (which we obtained pursuant to a Freedom of Information Act Request), the Manhattan Strategy Group stated
the following:
Examiners consistently expressed the need for additional time. This was stated mostly in concern to not being able to
do a high-quality examination and to avoid taking short-cuts. As one examiner in [Technology Center] 1700
explained, “when you add it up its not enough time to do a proper job on a case.” A junior examiner expressed a
similar sentiment, stating that “rather than doing what I feel is ultimately right, I’m essentially fighting for my life.”
4
exercises), and the more likely she becomes to grant the patent. Under the assumption that
patent examiners who are allocated sufficient time to review applications will, on average, make
the correct patentability determinations, our results suggest that the time allotments may be
inducing patent examiners to grant invalid patents on the margin. Supporting the view that these
marginal patents may be of questionable quality / validity, we find that examination-time-
reducing promotions are associated with a reduction in the frequency by which the inventors of
U.S. issued patents are likewise successful in securing patent protection at the European Patent
Office and the Japan Patent Office—two agencies following essentially similar patentability
requirements but that expend greater resources per application than the U.S. Patent Office.
At first blush, it may not be surprising that the level of scrutiny afforded applications may, at
some point, fall as allocated examination time becomes sufficiently strained. Importantly, our
findings demonstrate that this is not merely a hypothetical scenario but instead that examiners
appear to be operating at the point where time constraints indeed bind. That is, our results
suggest that current reductions in time allocations upon promotion are hampering the ability of
examiners to fully evaluate the merits of the given applications and thus ensure that only
meritorious applications are granted.3 Moreover, we demonstrate that the magnitude of the
resulting impact on examiner granting tendencies is substantial. As examination time is cut
roughly in half (i.e., as an examiner rises from GS-7 to GS-14 along the General Schedule scale,
3 Temporal limits placed upon workers to complete specific tasks are naturally related to production targets enforced
over specified measurement periods. Indeed, as discussed below and in the Online Appendix, the Patent Office’s time allocations
are effectuated via an examination quota system that is monitored bi-weekly and at quarter ends. Though our discussion focuses
on the behavior of patent examiners at the U.S. Patent Office, the analysis contributes to a broader literature in personnel
economics and human resource management on the productivity consequences of workload expectations and quotas and on the
timing associated with measuring employee output. Notable examples of such studies include Asch (1990), Oyer (1998), Courty
and Marshke (2004), Larkin (2014), and Chan (2015 a). The present investigation into the effects of time constraints on patent
examiner behavior is likewise related to research bearing on the distortions in worker behaviors that may arise in connection with
the time constraints that workers—e.g., physicians—face near the ends of scheduled shifts. See, for example, Chan (2015 b).
More broadly, this analysis is related to research on the distortionary effects of objective performance measures (Baker, Gibbons,
and Murphy, 1994).

5
controlling for changes in years of experience), our findings suggest that grant rates rise by as
much as 10 to 19 percentage points, or by roughly 15 to 28 percent.4
Despite a substantial literature in economics bearing on the patent system,5 the administrative
process by which patent rights are initially established has received scant attention. To date,
only a handful of studies have explored the dynamics of the Patent Office, primarily by
investigating the role of examiner heterogeneity in explaining the outcomes of the patenting
process (Cockburn, Kortum, & Stern, 2003; Lichtman, 2004; Mann, 2014). These
groundbreaking studies raise concerns of an inefficient and inequitable Patent Office,
demonstrating that application outcomes are largely a function of the examiners that applicants
randomly receive. However, these studies fail to explore arguably the most important outcome
of this process—whether the examiner granted the patent—while also failing to examine whether
a particular feature of the Patent Office influenced the examiner’s behavior.
Lemley and Sampat (2012) arguably come closest to filling this gap in the literature,
estimating a monotonically increasing relationship between years of examiner experience and
examiner grant rates. Given the natural connection between experience and promotion, their
analysis, as they note, likely captures some aspects of the impact of allotted examination time on
grant rates; though, absent data on examiner promotions, they are unable to decouple an
experience effect from an examination-time-allotment effect. Moreover, their analysis is largely
cross-sectional in nature (observing 10,000 patent applications filed in January 2001), hindering
their ability to distinguish between the effect of experience itself from either an examiner cohort
4 Notably, our findings also challenge the widely held belief that decreasing patent examiner attrition is vital to
increasing patent quality (Jaffe & Lerner, 2004). 5 This literature has ranged from analyses on how to value patent rights (Pakes, 1986; Jaffe et al., 1993; Harhoff et al.,
1999; Hall et al., 2005), to studies exploring the effect of patents on innovation (Mansfield, 1986; Griliches, 1990; Cohen et al.,
2000), to research on the ways in which patents are used and enforced once granted (Lanjouw and Lerner, 1997), among other
investigations.

6
effect or an examiner tenure effect. By tracking individual examiners over the course of a ten-
year period, our fixed-effects specifications are able to overcome these concerns. While our
focus is on understanding the impact of reductions in allocated examination time and not
necessarily on the independent impacts of examiner experience, we note that the imposition of
examiner fixed effects produces an inverse-U shape in the relationship between grant rates and
experience, as opposed to the monotonically increasing relationship documented in Lemley and
Sampat (2012). In other specifications that are in the spirit of a regression-discontinuity design,
we find evidence suggestive of a strictly negative influence of experience (in years) on grant
rates, combined with discrete jumps in grant rates upon the relevant promotions.
In the next section, we provide a background on the patent examination process and discuss
our theoretical predictions. In Sections II and III, we describe our data and empirical
methodology, respectively. Section IV presents results from our examiner fixed-effects analysis.
Finally, Section V concludes.
I. BACKGROUND AND THEORY
A. Description of Examination Process
Every patent application filed with the Patent Office contains a specification, which describes
the invention, and a set of claims that defines the metes and bounds of the legal rights the
applicant is seeking. Moreover, to satisfy applicants’ duty of candor under U.S. law, patent
applications typically disclose to the Agency “prior art,” that is previous patents, patent
applications, or other publications, that are material to the patentability of the relevant invention.
Before an application enters examination, it is routed to an Art Unit, a group of eight to fifteen
patent examiners who review applications in the same technological field. Upon arrival, the
Supervisory Patent Examiner (SPE) of that Art Unit randomly assigns the application to a

7
specific examiner. Occasionally, SPEs make non-random assignments, but in those instances,
they do so not based on any characteristic that would affect the patentability of the application
but instead, for instance, on an examiner’s backlog of applications (Lemley & Sampat, 2012).6
The assigned examiner assesses the patentability of the invention based on the criteria outlined
in the Patent Act. Without making any reference to prior art, an examiner can deny a patent on
the grounds that the claimed invention does not involve statutory subject matter (35 U.S.C. §
101), that the invention is not useful (35 U.S.C. §101) or that the application fails to satisfy the
disclosure requirements (35 U.S.C. § 112). In contrast, two other grounds for rejection—i.e.,
lack of novelty (35 U.S.C. § 102) and obviousness (35 U.S.C. § 103)—require the examiner to
make a comparison of the claimed invention with the background art already known to the
public. Before making this assessment, the examiner conducts her own prior art search to
supplement that disclosed by the patent applicant. Because lack-of-novelty and obviousness
rejections require this delicate prior art comparison (and underlying search), they are typically
viewed as being more time consuming to perform than non-art-based rejections. Obviousness
rejections are especially time intensive in this regard, even relative to novelty rejections. While
novelty assessments require that examiners determine whether the claimed invention is covered
by a single prior publication or patent, an obviousness determination requires an examiner to
start with a prior art reference that covers only a portion of the invention and then piece together
additional references or rely upon what is known to one of ordinary skill in the art in order to
determine whether it would be “obvious” to modify any one of the cited prior art references to
achieve the claimed invention.
6 We conducted a series of telephone interviews with former SPEs to confirm these details of patent examination
assignment. Our interviews further substantiated that SPEs do not make any substantive evaluation of an application before
assigning it to a particular examiner.

8
After assessing the patentability of the claims, an examiner composes a “first office action”
letter to the applicant that accepts or rejects them. Although some applications are allowed in
their entirety upon first examination, more frequently, some or all of the claims fail to meet at
least one of the patentability requirements, as the examiner will detail in the first office action
letter. The applicant then responds by amending the claims or disputing the rejection. After the
response, a patent examiner may issue a final rejection or allow the patent to issue.7
B. Examination-Time Allocations
A number of scholars have surmised that the time constraints facing patent examiners in
assessing the patentability of claims are partly responsible for the Patent Office allowing too
many invalid patents (Jaffe & Lerner, 2004; Lemley, 2001; Lemley and Sampat 2012).
Although it may take several years from filing a patent application for an applicant to receive a
final patentability decision from the Patent Office, on average, an examiner spends only nineteen
hours reviewing an application, including reading the patent application, searching for prior art,
comparing the prior art with the patent application, writing a rejection, responding to the patent
applicant’s arguments, and often conducting an interview with the applicant’s attorney (Frakes &
Wasserman, 2014). If, over these hours, examiners are unable to conduct a sufficient search of
prior art and determine and articulate a proper basis of rejection in the relevant office action
report, they are expected, under the law, to allow applications. In light of this legal presumption
of validity, one might predict that a further tightening of time constraints will only cut the
underlying search and evaluation period even shorter and cause examiners to error even further
7 After receiving a final rejection, an aggrieved patent applicant can restart the examination process by filing a
continuation application, appeal the denied application to Patent Trial and Appeal Board, or abandon the application altogether.
9
on the side of allowing additional patents on the margin that might have otherwise been rejected
if given sufficient time.8
As explained in greater detail in the Online Appendix, the Patent Office sets expectations
regarding the amount of time examiners should spend on applications.9 The number of hours
allocated for review depends on both the technological field in which the examiner is working
and on her position in the general schedule (GS) pay scale. A patent examiner in a more
complex field is provided more hours to review an application than an examiner of the same
grade who is working in a less complex field. The higher the pay grade of an examiner within a
technology area the fewer number of hours the Patent Office extends to that examiner. A
promotion to each subsequent pay grade is roughly equated to a ten to fifteen percent decrease in
the number of allocated examination hours.
To demonstrate the degree to which time allocations scale with GS-level changes, we present
in Table 1 the examination time expectations facing a patent examiner working in one of the
most complex fields, artificial intelligence, and one of the least complex fields, compound tools.
8 That is, the underlying legal landscape leads to a simple prediction that time constraints will produce a bias towards
granting, as opposed to producing symmetrical noise in the examination process. We acknowledge the possibility that certain
examiners may decline to follow this legal presumption of validity when faced with time pressures and simply write up an ill-
conceived and vague rejection. However, it is perhaps unlikely that reductions in the total amount of time allocated for the
review process will incentivize non-compliant but nonetheless time-constrained examiners to issue more rejections of this
particular nature. Mainly, it is important to acknowledge that preparing a notice of allowance (which essentially requires no
justification) is still less time intensive to produce than even a vaguely worded and weak rejection. Furthermore, to the extent
that examiners were to issue easily overcome rejections in non-final office actions, they might have little hope of dispensing with
the application with finality; rather they would perhaps merely be inviting applicants to articulate proper responses, an event that
will only require additional time outlays on the examiners’ part at a future date. Finally, there may be reason to doubt why
examiners would be inclined to disregard the legal presumption of validity in the first place and thus be motivated to issue
rejections of this vague and weak variety. Such behaviors may be scrutinized during the evaluation processes they are put
through at times. Moreover, rejections of this nature may more easily invite appeals by applicants, events that may likewise lead
to certain repercussions for the associated examiners. All told, we predict that time constraints will cause examiners to error on
the side of allowing more patents, as opposed to erring in both directions. 9 These time allotments have largely remained unchanged since 1976. The Patent Office has created new patent
classifications as a result of new and emerging technology. Once the Agency has set the time allotments for a new technology
these allocations also have largely remained unchanged. In 2010, however, the Patent Office increased the time allotments for
every application by two hours.
10
As demonstrated by this table, examiners operating at GS-level 14 are expected to review the
same patent in approximately half that time of examiners operating at GS-level 7.
TABLE 1: EXAMINATION HOURS ALLOCATED TO EXAMINER AS A FUNCTION OF GS-LEVEL
(1) (2)
GS-level Compound Tools Artificial
Intelligence
GS-7 19.7 45.1
GS-9 17.3 39.5
GS-11 15.3 35.1
GS-12 13.8 31.6
GS-13 12.0 27.5
GS-13, partial signatory 11.0 25.3
GS-14 10.2 23.4
C. Promotion Process
Patent examiners are hired at different pay grades (GS-5, GS-7, GS-9, GS-11 or GS-12)
depending upon their educational background and prior experience. Promotions at low pay
grades typically (though not always) occur within a year for examiners that meet their workload
expectations with few errors. An examiner’s error rate is calculated by reviewing some subset of
the examiner’s work product to see if, for instance, the examiner fails to include all grounds of
rejections that should have been made or if she includes unreasonable rejections. In contrast,
promotions at the high pay grades (GS-12, 13, and 14) often require more time, as they generally
involve the completion of additional testing or programs.10
While we contend that the most significant change associated with a promotion that bears on
the examiner’s decision to grant a patent application is the time allocated to review an
10 For instance, to be eligible for a GS-13 promotion, examiners must demonstrate legal competency by successfully
complete training courses and passing written tests on subjects such as patent law, practice, and procedure.

11
application, there is, upon promotion within GS-13 and to GS-14, also a change in the scrutiny of
their work. Examiners at pay grades GS-13 and below must have their decisions reviewed by an
examiner that has “full signatory authority.”11 Patent examiners at pay grades GS-13 may begin
to work towards obtaining such authority by undergoing an evaluation period, which upon
successful completion will result in a promotion to a patent examiner with “partial signatory
authority.” A GS-13 partial signatory promotion, though not associated with a change in the GS
level, does entail a decrease in the examination time allotted to the promoted examiner and
provides that examiner the ability to sign off independently on first office actions. Upon
completing a second period of evaluation, a GS-13 partial-signatory patent examiner can be
promoted to GS-14, a promotion which provides the examiner with full signatory authority or the
right to sign off on all aspects of an application independently. The fact that variations in
scrutiny of this nature do not occur upon all examination-time-reducing promotions is an
important component to our identification strategy, as discussed in Section IV below.12
To our knowledge, nothing else changes upon GS-level promotions that would affect the
manner in which examiners conduct their examination. For instance, the basic structure of
overtime and bonuses remains constant upon GS-level promotions as does the ways in which
examiners earn work credits, in which event one would not expect examiners to face enhanced
financial incentives to grant patents (to the extent that they ever face such incentives) upon
promotions to higher grade levels. We confirmed that GS-level promotions are not associated
11 Even though these “junior” examiners do most of the work on the application they are listed as secondary examiners on
the application. 12 Although the determinants of GS-13 partial-signatory and GS-14 promotions are similar to lower level promotions—
meet workload expectations with few errors—the evaluation period is more formalized with these higher-level promotions. That
is, unlike lower-level promotions, examiners who wish to be eligible for signatory authority must affirmatively agree to
participate in an evaluation period in which a larger portion of their work product is reviewed for clear errors than if they had not
agreed to participate in the signatory authority program.
12
with such changes through our review of examiner compensation materials made available by
the Patent Office and through our interviews with former SPEs.
D. Hypothesis
We assume that, when given sufficient time, examiners will conduct their examination
practices in line with proper patentability standards. However, binding time constraints may
force examiners of this otherwise competent disposition to decrease the degree to which they
search prior art, decrease their ability to extend meaningful obviousness rejections and thus
increase the propensity by which they grant patents. We surmise that examiner promotions of
the variety that decrease the amount of time expected to review applications will only tighten
these constraints and intensify such outcomes.
II. DATA
Most prior investigations into the determinants of examiner behavior have explored only
issued patents (for example, Cockburn, Kortum, and Stern, 2003). Among other things, a
sampling frame of that nature is insufficient to capture arguably the most important decision that
an examiner must make: whether or not to grant the given patent application. Moreover, when
prior studies have considered application-level data, they have done so only with respect to a
subset of applications at one snapshot in time,13 which is insufficient to account for sources of
examiner heterogeneity that may bias the analysis. To overcome these deficiencies and to
facilitate a rich examiner-fixed-effects design, we collected individual application data from the
Patent Office’s Patent Application Information Retrieval (PAIR) database on all 1.4 million
utility patent applications that were filed on or after March, 2001 and that reached a final
13 For example, Lemley and Sampat (2012) consider only 10,000 applications filed in January of 2001.

13
disposition—i.e., excluding ongoing applications—by July 2012. The Online Appendix provides
more specifics regarding the construction of this sample.
Though especially rich in content, the PAIR database is not readily suitable for a
comprehensive, machine-readable analysis of granting practices considering that the data is
divided into separate webpages for each individual application, with each webpage providing
information via numerous tab delimited and portable document format (pdf) files. Because of
the nontrivial nature of this data collection we utilized the National Center for Supercomputing
Applications at the University of Illinois to amass and coordinate information contained across
the 1+ million different webpages. Specifically, we collected information on the status of the
application as well as other information about the prosecution process, including, among others,
the patent examiner charged with reviewing the application and the basis of any rejection
associated with the application (e.g., obviousness).
Critical to our analysis is determining the experience (in years) and the GS-level for each of
the 9,000 examiners represented in our analytical file. For these purposes, we match the
examiner field in the PAIR data with the two sets of examiner rosters received pursuant to
separate FOIA requests, one of which dates back to 1992 to facilitate the identification of
experienced examiners at the beginning of our sample. We describe these rosters and this
matching process (including our handling of “fuzzy” name matches) in greater detail in the
Online Appendix. We likewise provide a breakdown in the Online Appendix of the percentage
of applications reviewed by examiners in each of the relevant GS-levels and experience groups
considered below. The greatest percentages are accounted for by the higher GS-levels (GS-level
12+) considering that examiners spend considerably more time at such ranges. Finally, we treat
the individual who did the majority of work on the application as the examiner charged with

14
reviewing that application: (1) the non-signatory examiner, when both a non-signatory and an
examiner with signatory authority are associated with an application, or (2) the signatory
examiner, when only one examiner is associated with an application.
For each application in our sample, we relate examiner characteristics, including their pay
grade and experience level, to whether or not the application was granted, our key outcome of
interest. All told, 68 percent of the applications disposed of over this time period were granted
(see Table 2).14 To form our second set of outcome measures, we determine whether the given
application had at least one claim rejected during examination based on each of the following
statutory bases: § 101 (lack of patentable subject matter, lack of utility, double patenting), § 102
(lack of novelty), § 103 (obvious), and § 112 (failure to meet the disclosure requirements). To
the best of our knowledge, we are the first to report the bases of rejections for any substantial
sample of patent applications.15 Details regarding the process utilized to collect the rejection-
type data can be found in the Online Appendix. The likelihood that a given application received
each of the indicated types of rejections in the sample are as follows: (1) 11 percent, § 101; (2)
56 percent, § 102; (3) 72 percent, § 103; and (4) 35 percent, § 112.
To proxy for how intensively examiners are searching for prior art, we focus on the sample of
patents issued over the above-specified time period (as distinct from the sample of applications
over this time period) and collect information on the share of prior art references listed in each
14 Continuation applications, as distinct from the now more common RCEs, are counted as a rejection / abandonment of
the original application and the filing of a new application within the PAIR database (RCEs, which keep the same serial number
and stay with the same examiner, are not treated as new applications). Accordingly, this 68 percent rate does not necessarily
capture the percentage of original applications that are ultimately allowed considering that some continuation applications may
successfully issue. It is important to note that this is merely a classification issue—i.e., do these events contribute or not
contribute to the Patent Office’s grant rate? Our focus is largely on exploring the relationship between the grant rate, however it
is defined, and certain characteristics of the examiners. 15 Cotropia, et al., 2013, however, have previously reported rejection data for 1,554 patents issued in 2007.

15
issued patent that emanate from the examiner rather than the applicant.16 Previous investigations
have reported that examiners are more likely to rely upon prior art they discovered during their
own search, rather than art disclosed by an applicant, to reject a patent application (Cotropia,
Lemley, and Sampat, 2013).
TABLE 2. SUMMARY STATISTICS
Incidence of Granted Patent 0.678
(0.467)
Incidence of Any Obviousness Rejection 0.717
(0.450)
Share of Rejections based on Obviousness 0.454
(0.283)
Share of Prior Art Citations Originating from Examiner 0.546
(0.369)
Incidence of U.S. Patent being Allowed by both EPO and JPO (among Patent
Family Sample)
0.442
(0.497)
Incidence of U.S. Patent being Allowed by EPO (among Patent Family
Sample)
0.604
(0.490)
Incidence of U.S. Patent being Allowed by JPO (among Patent Family
Sample)
0.637
(0.481)
Incidence of Large-Entity Applicant 0.734
(0.442)
Incidence of Foreign Priority (at EPO or JPO) 0.086
(0.280)
Statistics are from the collection of applications in the Patent Office’s s PAIR database that
reached a final disposition and that were published in the PAIR records between March, 2001
and July, 2012. Statistics bearing on EPO and JPO allowance rates are from the subset of
patents that were granted out of this initial set of applications and whose applicant’s likewise
sought patent protection at the EPO and JPO.
A final set of outcome measures considered in the analysis below is meant to reflect on the
quality of the patents issued by the Patent Office. As explained in Section IV, we assess these
outcomes by looking at a set of inventions that sought protection at each of the U.S. Patent
16 This measure includes patent and non-patent prior art (and foreign prior art), though the results presented below are
robust to just focusing on patent prior art. Several studies have used the share of references listed in an issued patent originating
from the applicant or examiner as a proxy for the extent to which the party in question (examiner or applicant) searched the prior
art (Lemley and Sampat, 2012; Sampat, 2010; Alcacer et al., 2009).
16
Office, the European Patent Office (EPO) and the Japan Patent Office (JPO) and observe
whether patents issued in the U.S. were allowed or rejected at the EPO and/or JPO. We obtained
this information using the Triadic Patent Family database maintained by the Organization for
Economic Co-operation and Development.
III. METHODOLOGY
To explore how patent examination practices change upon promotions that leave examiners
with less examination time, we estimate the following:
�������� = � +�� +�� + ��� + ������� +����������
+ ������ + ��� (1)
where a indexes the individual application, i indexes the individual examiner, k indexes the
technology associated with the application and t indexes the year in which the application is
disposed of by the examiner. GRANTaikt indicates whether or not the given application was
allowed by the examiner. Year fixed effects are captured by ��. GSit represents a set of dummy
variables capturing the incidence of the examiner assigned to the underlying application falling
into each of the general schedule (GS) pay-grade levels. GSit also includes separate categories
for GS-13 without partial signatory authority and GS-13 with partial signatory authority,
considering that this unique within-GS-level promotion likewise carries with it reductions in
examination-time expectations. The ability to draw upon a within-GS-level change in the time
allotment extended to examiners provides us with an opportunity to challenge the argument that
the analysis may be purely driven by factors changing with GS-level promotions other than
examination time allocations.
17
Furthermore, included in some specifications, EXPERit captures a set of dummy variables for
the incidence of the relevant examiner falling into a range of experience-level categories (0-1
years, 2-3 years, etc.), where experience is signified by the number of years (in 2-year bins) at
the time of the application’s disposition that the relevant examiner has been with the Patent
Office. In other specifications, as discussed in detail in Section IV, we nest experience within
GS-level categories and thus create dummy variables capturing a series of experience categories
within each GS-level. In a robustness check, we include a set of technology-by-year fixed
effects, ��� (using the 37 technology subcategories set forth in Hall et al., 2001), to alleviate
concerns that examiners may be reassigned to different technologies as they ascend to higher
pay-grades and that such reallocation schemes may change over time (e.g., with fluctuating
economic conditions).17 Other specifications include various individual characteristics of the
applications, ����, including the entity size status of the applicant (large versus small), the
length of time being the filing and the disposition of the application (and its square), and the
foreign priority status of the application (previous filings at the EPO and JPO).
Importantly, a set of examiner fixed effects are captured by ��. Such fixed effects help address
concerns that more experienced examiners and higher GS-level examiners are fundamentally
different from their more junior counterparts, for reasons beyond mere differences in seniority
and promotion levels—e.g., concerns that examiners who have reached higher grade levels and
thus who have been successful in attaining promotions may be those with a stronger inherent
17 We aggregate to the Hall et al. subcategory level (37 groups) in forming these technology-by-year fixed effects—as
opposed to using the much finer grained U.S. Patent Office “classes” (over 500 groups)—for computational ease. These
technology-year fixed effects also address concerns that the Patent Office may execute more promotions during times in which
application filings are elevated in particular technologies, events that may also impact observed grant rates. We alternatively
alleviate this concern in Column 2 of Table 3 by estimating specifications that include technology-year-specific filing counts as a
control while using the finer-grained Patent Office classes as the basis for technology groupings. In this alternative specification,
we also include Patent Office class fixed effects to account for fixed differences across such groups. As demonstrated by
Column 2, the inclusion of class fixed effects and class-year filing counts leads to virtually no change in the estimated
coefficients of the grade level dummies.

18
disposition towards granting in the first place, along with concerns that more experienced
examiners may also differ from less experienced examiners simply because they elected to stay
at the Patent Office.
IV. RESULTS
A. Grant-Rate Analysis
1. Primary Results
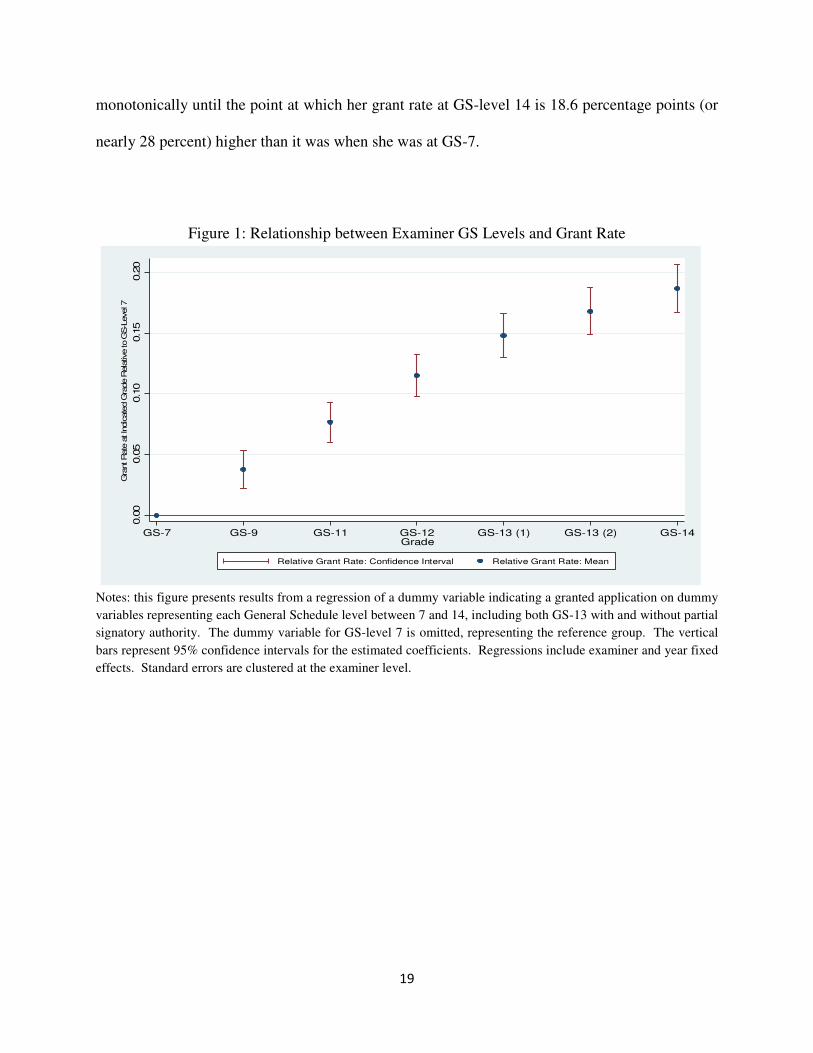
We begin our exploration into the effects of allotted examination time—as identified by the
occurrence of certain examiner promotions—by plotting the evolution of grant rates observed
over the course of a given examiner’s career as they rise in the ranks. More specifically, in
Figure 1, we plot results from a regression of the incidence of an application being granted on a
set of dummy variables capturing each of the relevant examiner pay grades, in addition to a set of
year fixed effects and examiner fixed effects (see Column 1 of Table 3 for the tabular regression
results underlying this figure).18 Figure 1 suggests that the grant rates increase with each grade-
level promotion, including increases as given examiners initially ascend to GS-level 13 and
subsequently ascend to GS-level 13 with partial signatory authority. We find that as an examiner
moves from GS-level 7 to GS-level 9, they increase their grant rates by 3.8 percentage points (or
by roughly 6 percent). As the examiner ascends even higher in ranks and thus as the examiner
receives less and less time to review her applications, this increase in grant rates continues
18 Standard errors are clustered at the examiner level to account for autocorrelation over time in examiner-specific
residuals. In unreported regressions, we also cluster at the NBER technology sub-category level (37 technologies). Estimated
standard errors only rise slightly in this instance—e.g., from 0.009 on average throughout Column 1 of Table 2 to 0.010 on
average throughout that Column. Given computational considerations in light of the over-1-million observations and nearly
9,000 examiner fixed effects, we elect to estimate linear probability models throughout. We note, however, that the pattern of
results we present are virtually unchanged when we instead take a 10-percent random sub-sample of examiners and estimate
conditional logit specifications (available upon request from the authors).
19
monotonically until the point at which her grant rate at GS-level 14 is 18.6 percentage points (or
nearly 28 percent) higher than it was when she was at GS-7.
Figure 1: Relationship between Examiner GS Levels and Grant Rate
Notes: this figure presents results from a regression of a dummy variable indicating a granted application on dummy
variables representing each General Schedule level between 7 and 14, including both GS-13 with and without partial
signatory authority. The dummy variable for GS-level 7 is omitted, representing the reference group. The vertical
bars represent 95% confidence intervals for the estimated coefficients. Regressions include examiner and year fixed
effects. Standard errors are clustered at the examiner level.
0.0
00.0
50.1
00.1
50.2
0
Gra
nt R
ate
at In
dic
ate
d G
rade R
ela
tive to G
S-L
evel 7
GS-7 GS-9 GS-11 GS-12 GS-13 (1) GS-13 (2) GS-14Grade
Relative Grant Rate: Confidence Interval Relative Grant Rate: Mean

20
TABLE 3. RELATIONSHIP BETWEEN GRANT RATES AND EXPERIENCE AND GRADE LEVELS OF
THE ASSOCIATED PATENT EXAMINER
(1) (2) (3) (4) (5) (6)
Omitted: GS-7 (omitted:
GS-11)
GS-9 0.038***
(0.008)
0.036***
(0.008)
0.026***
(0.007)
0.036***
(0.008)
0.017
(0.020) -
GS-11 0.077***
(0.008)
0.076***
(0.008)
0.033***
(0.008)
0.072***
(0.008)
0.026
(0.020) -
GS-12 0.115***
(0.009)
0.112***
(0.009)
0.049***
(0.009)
0.104***
(0.008)
0.060***
(0.023)
0.031***
(0.005)
GS-13 0.148***
(0.009)
0.141***
(0.009)
0.066***
(0.010)
0.127***
(0.009)
0.068**
(0.025)
0.062***
(0.007)
GS-13 (with partial
signatory authority)
0.168***
(0.010)
0.159***
(0.010)
0.084***
(0.011)
0.149***
(0.010)
0.076***
(0.027)
0.083***
(0.009)
GS-14 0.186***
(0.010)
0.177***
(0.010)
0.103***
(0.011)
0.165***
(0.010)
0.104***
(0.031)
0.097***
(0.011)
Omitted: 0-1 Years Experience
2-3 Years Experience - - 0.073***
(0.004) - - -
4-5 Years Experience - - 0.077***
(0.006) - - -
6-7 Years Experience - - 0.072***
(0.007) - - -
8-9 Years Experience - - 0.057***
(0.009) - - -
10-11 Years
Experience - -
0.045***
(0.010) - - -
12-13 Years
Experience - -
0.027**
(0.012) - - -
14+ Years Experience - - -0.001
(0.015) - - -
N 1158689 1158689 1158689 990940 48936 274285
Examiner and Year
Fixed Effects? YES YES YES YES YES YES
Patent Office Class
Fixed Effects? NO YES NO NO NO NO
Application Controls
and Technology-by-
Year Fixed Effects?
NO NO NO YES NO NO
Balanced Sample of
Examiners from
GS-7 to GS-14?
NO NO NO NO YES NO
Balanced Sample of
Examiners from
GS-11 to GS-14
NO NO NO NO NO YES
* significant at 10%; ** significant at 5%; *** significant at 1%. Standard errors are reported in parentheses and
are clustered to correct for autocorrelation within given examiners over time. Each observation is a given
application from the PAIR database that reached a final disposition and that was published in the PAIR records
between March, 2001 and July, 2012. The specification in Column 5 includes applications only from those
examiners that started the sample period at GS-7 and ascended to at least GS-14 over the sample period. The
specification in Column 6 includes applications only from those examiners that started the sample period at GS-11
and below and ascended to at least GS-14 over the sample period, focusing only those applications that they
disposed of while at GS-11 through GS-14. Technology-by-year effects are based on the 37 Hall et al. (2001)
technology sub-categories, while the technology fixed effects used in Column 2 are based on Patent Office
Classes. Column 2 also includes technology class-year-specific application filing counts as a covariate.

21
Essential to our analysis is the separation of the effects stemming from grade-level promotions
and from the acquisition of additional years of experience within the Agency. Note from the
outset that while such events naturally correlate with each other, they do not do so perfectly.
That is, examiners do not always receive promotions lockstep with experience, allowing us to
separately identify these forces. This is especially true from GS-12 onwards when examiners
begin to routinely spend multiple years (to varying degrees) at the respective grade.19 By
including year fixed effects in a specification with examiner fixed effects, this initial
specification is identifying the impacts of GS-level changes while accounting for the influence of
individual examiners moving across experience levels (in year increments). This observation
stems from the well-known point (Heckman and Robb 1985) that age (experience) effects have
become determined when one has estimated both year effects and cohort effects (which derive
from individual effects).20 However, we acknowledge that this initial specification does not
allow us to distinguish the contribution of year effects from experience effects. In certain
specifications estimated below, we take further steps to achieve this separation (see below).
Examiner behavior may change over time under a range of theories. For instance, with more
years of experience, examiners may become better at identifying allowable subject matter. On
the other hand, it could be the case that examiners simply lessen their scrutiny as time goes by in
the Patent Office due to an increased tendency to shirk. To the extent that any such stories are
even present in the first place—which we address more directly below—the above findings
demonstrate a distinct jump in grant rates that occurs upon GS-level promotion independent of
any pattern of grant rates that examiners exhibit over time itself. Considering that the key
19 Over 75 percent of examiners who have reached the stage of GS-level 14 stay at that grade level over a year, with over
20 percent staying for at least 8 years. On the other hand, only 16 percent of examiners who have been at GS-level 7 stay at that
grade beyond 1 year. 20 Behind this problem is the identity: calendar year = year of birth (cohort) + age.
22
channel by which the act of promotion may theoretically impact subsequent examination
behavior stems from its effect on the time allotted for examination (as discussed above), these
results provide greater confidence that (1) time constraints may be binding on examiners and (2)
that tightening such constraints may leave examiners with less time to adequately challenge the
patentability of applications.21 We further support this contention below with even richer
methods of decoupling experience from promotions and with investigations into examiner search
efforts and rejection patterns. Beforehand, however, we briefly discuss the relationship that we
nonetheless estimate between grant rates and an increase in examiner experience in years.
2. Experience Effects
Though our focus is mainly on examination time allocations, it would be of interest to identify
the effects of experience independently in order to more fully evaluate the determinants of
examiner behavior. As above, it is not possible to distinguish year effects from annual
experience effects in specifications that include individual examiner intercepts, absent additional
normalization restrictions on the parameterization of the year or experience effects that break the
identity between them. In our primary approach to isolating the independent impacts of
experience, we estimate specifications that achieve the necessary restrictions by specifying
21 We acknowledge that some examiners may attempt to increase their chances of promotion by granting more
permissively as a general matter of course, either because such behavior may facilitate the processing of a greater number of
applications or in light of the financial interests of the Agency in over-granting patents (Frakes and Wasserman 2013). Our fixed
effects methodology is designed to place inherent granting tendencies aside—including those stemming from promotion-seeking
behavior—and instead focus on within-examiner changes in behaviors over the course of a career. For a story of this nature to
explain the results, it would have to be the case that promotion-seeking behavior elevates in intensity upon each promotion.
Cutting against this latter theory are the drops in grant rates that we observe within particular GS levels over time, as we discuss
below.

23
examiner experience dummies into two-year blocks—i.e., 0-1 years of experience, 2-3 years of
experience, etc.22
In Column 3 of Table 3, we present results from this attempt to separately estimate GS-level,
year and experience effects, where we focus on presenting the GS-level and experience dummy
coefficients, leaving year effects as a nuisance control. In Figure 2, we plot the estimated
coefficients of the experience group dummies from this specification, finding an inverse-U
relationship between examiner experience (in years) and grant rates. Grant rates do increase by
close to 8 percentage points as an examiner moves from 0-1 to 2-3 years of experience. The
grant rate effectively stays at this level through 5 years of experience and thereafter begins to
fall, until the point at which the grant rate at 14+ years of experience is identical to the 0-1 year
experience level.
These U-shaped experience findings build upon Lemley and Sampat’s (2012) prior observation
that grant rates increase monotonically with experience in years. Lemley and Sampat
acknowledge the possibility that the monotonic relationship they estimate does not represent a
true experience effect at all but instead captures either the promotion-related time-allocation
story of focus in our analysis or an alternative story of selective retention—i.e., a tenure effect in
which those senior examiners that elect to stay at the Patent Office differ fundamentally from
22 By specifying experience groups in this manner, it is no longer the case that experience dummies would be perfectly
collinear with year dummies as would be the case with both yearly experience group dummies and year effects. For instance,
consider a set of applications reviewed in 2002 by some examiners who began with the Patent Office in 1997 and others who
began in 1996, among a much richer sample of applications covering multiple years and cohorts. How can we attribute the
information from these particular applications to an estimation of cohort, year and experience effects across this broader sample?
By creating a group comprising those with 5-6 years of experience and using these observations to contribute to an estimation of
the intercept for this group, we retain the ability to contribute information to separately identify a 1996 cohort effect and a 1997
cohort effect. With enough statistical power, having broken this identity, one can identify the separate influence of each such
mechanism. See de Ree and Alessie (2011) for a discussion as to how specifying age effects in blocks breaks the age + cohort =
year identity. We note that this approach is not without consequence, since we are implicitly assuming that experience effects
follow a grouping of this nature—i.e., that 5-year experience examiners and 6-year experience examiners are alike. We note,
however, that our results generalize to alternative normalization restrictions, including the use of 3- or 4-year experience bins or
to the use of a 0-1 year experience bin along with yearly experience dummies thereafter. In each case, we continue to document
an inverse-U pattern (results available upon request).

24
those that leave the office earlier. Lacking data on examiner GS levels and observing only a
cross section of applications at a point in time, Lemley and Sampat are unable to fully rule out
these possibilities, though, they do include some examiner tenure controls to alleviate selective
retention concerns. Though not emphasized in their analysis, the cross-sectional sampling frame
also leaves them unable to separate the effect of gaining experience in years—a true experience
effect—from an examiner cohort effect, where this latter influence captures fundamental
differences in examination behavior (perhaps due to initial training or cultural idiosyncrasies)
among those who began their careers with the Patent Office in different calendar years.23
By controlling for examiner GS levels and individual examiner effects, we are, unlike the prior
literature, able to target the association between examiner experience and grant rates while
accounting for cohort, tenure and promotion-related effects. In the Online Appendix, we
demonstrate that the monotonic relationship between experience and grant rates documented by
Lemley and Sampat is likely driven by the promotion-related time-allocation effects (depicted in
Figure 1) and by examiner cohort effects—that is, all else equal, inherent granting tendencies
have fallen with subsequent examiner cohorts (beginning with high grant rates for those starting
in the 1990s). Once controlling for these other influences, experience effects themselves appear
to follow the inverse-U shape depicted in Figure 2.
23 After all, if, for instance, one only studies applications filed in 2001 and observes that those with 8 years of experience
have higher grant rates than those with 2 years of experience, it is difficult to determine whether that finding is attributable to the
act of gaining 6 additional years of experience or from the fact that those who started working for the Patent Office in the early
1990s have higher inherent granting tendencies relative to those starting in the late 1990s—e.g., due to difference in initial hiring
conditions over such periods and due to the importance of initial conditions in developing enduring practice styles.

25
Figure 2: Relationship between Examiner Experience Groups and Grant Rate, Controlling for
GS Level
Notes: this figure presents results from a regression of a dummy variable indicating a granted application on dummy
variables representing each General Schedule level between 7 and 14, including both GS-13 with and without partial
signatory authority, along with dummy variables representing the incidence of 8 different experience (in years)
groups. This figure presents the coefficients of the experience group dummies only. The vertical bars represent
95% confidence intervals for the estimated coefficients. Regressions include examiner and year fixed effects.
Standard errors are clustered at the examiner level.
3. Within-Grade Experience Effects
In this sub-section, we take an alternative approach to separating grade-level effects from
experience effects. Instead of simply estimating the overall impacts of being at the Patent Office
for a given number of years, we nest experience years within grade levels. In other words, we
estimate specifications that include a series of dummy variables capturing the presence of
specific years within specific grade levels—e.g., 0-1 years in GS-13, 2-3 years in GS-13, 0-1
years in GS-14, 2-3 years in GS-14 etc. This approach allows us to more comprehensively
-0.0
50.0
00.0
50.1
0
Gra
nt R
ate
at In
dic
ate
d G
roup R
ela
tive to
First Experience G
roup
0-1 Yrs 2-3 Yrs 4-5 Yrs 6-7 Yrs 8-9 Yrs 10-11 Yrs 12-13 Yrs 14+ Yrs
Group
Relative Grant Rate: Confidence Interval Relative Grant Rate: Mean

26
follow the course of a hypothetical examiner over the various stages of a career and thus better
visualize the independent and discontinuous impacts of examination-time-reducing promotions.
For this analysis, we focus only on those examiners in GS-12 and above considering that the
majority (though not all) of those within lower grade levels achieve promotions within their first
year at those grades, providing little ability to reliably track the evolution of grant rates over
years while at GS-7, 9 or 11.
Figure 3: Relationship between Grant Rate and Increases in Experience Years within Distinct
Grade Levels
Notes: In the specification underlying this figure, we regress a dummy variable indicating a granted application on a series of dummy variables capturing specific experience years within each grade level, beginning at GS-level 12. We track examiners for 1-2, 3-4, 5-6, 7-8 and 9+ years within GS level 12 and then the same within each of GS-level 13 without signatory authority, GS-level 13 with signatory authority and, finally, GS-level 14. Specifications include both examiner and year fixed effects. Standard errors are clustered at the examiner level.
Figure 3 plots the results of this exercise, presenting the coefficients of each of these separate
dummy variables, with the 0-1 year period at GS-12 serving as the omitted reference group. The
-0.1
0-0
.05
0.0
00.0
50.1
00.1
5
Gra
nt R
ate
at In
dic
ate
d G
rade/E
xperience
Gro
up R
ela
tive to G
S-L
evel 12 / 1
st
Year G
roup
GS-12 GS-13 (1) GS-13(2) GS-14
Grade Level / Experience Group (2-Year Incrementswithin each Level)
Relative Grant Rate: Confidence Interval Relative Grant Rate: Mean

27
results only further solidify the contention that examination practices change upon the
occurrence of career events that are associated with reductions in the time allocated to
examiners. Upon each such promotion, the observed grant rate jumps. Importantly, these
promotion-level increases do not appear to be mere reflections of continuing trends in grant rates
over the duration of an examiner’s tenure at the specific grades, which might otherwise suggest a
simple experience-level story or which might otherwise suggest a selection story in which the
Patent Office elects to promote examiners at points in time in which the examiners begin to grant
at elevated rates.24 Consider, for instance, GS-level 14, a level in which examiners spend on
average 4.5 years upon reaching. While the grant rate jumps distinctly once one enters this GS
level (to a degree that is 8 percentage points higher than the reference period), the grant rate
actually begins to fall thereafter. In the period represented by her 9th year and beyond at GS-14,
her grant rate is over 5 percentage points below the initial GS-14 grant rate. If the grant rate had
incrementally continued to rise over such years, especially at levels commensurate with those
experienced upon grade level changes, it would instill less confidence in an interpretation of the
results as emanating from reductions in the amount of time at the disposal of examiners.
24 In the Online Appendix, we provide even further support against the possibility that the Patent Office elects to promote
given examiners once their grant rates hit certain elevated points, a possibility that could otherwise explain the initial findings in
Figure 1. Specifically, we find that those examiners that are promoted quickly within the Agency—and whose work appears to
be most valued by the Patent Office—actually have lower inherent grant rates relative to those who rise more slowly in the ranks.
28
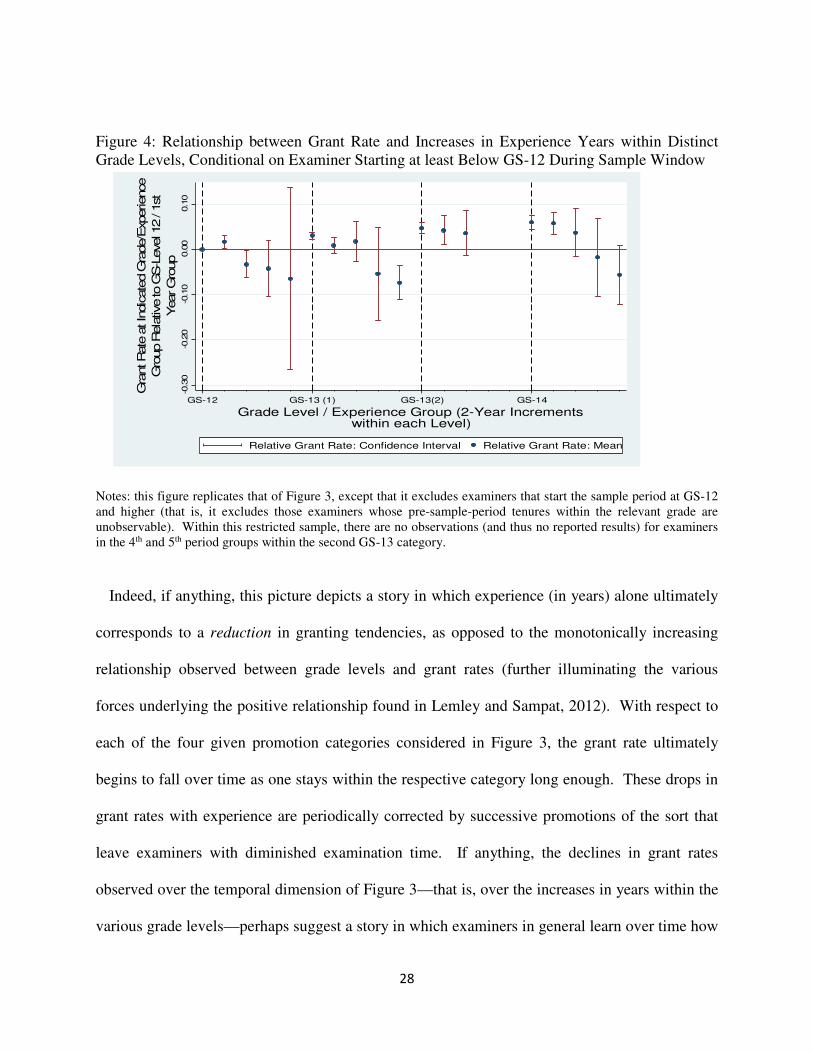
Figure 4: Relationship between Grant Rate and Increases in Experience Years within Distinct Grade Levels, Conditional on Examiner Starting at least Below GS-12 During Sample Window
Notes: this figure replicates that of Figure 3, except that it excludes examiners that start the sample period at GS-12 and higher (that is, it excludes those examiners whose pre-sample-period tenures within the relevant grade are unobservable). Within this restricted sample, there are no observations (and thus no reported results) for examiners in the 4th and 5th period groups within the second GS-13 category.
Indeed, if anything, this picture depicts a story in which experience (in years) alone ultimately
corresponds to a reduction in granting tendencies, as opposed to the monotonically increasing
relationship observed between grade levels and grant rates (further illuminating the various
forces underlying the positive relationship found in Lemley and Sampat, 2012). With respect to
each of the four given promotion categories considered in Figure 3, the grant rate ultimately
begins to fall over time as one stays within the respective category long enough. These drops in
grant rates with experience are periodically corrected by successive promotions of the sort that
leave examiners with diminished examination time. If anything, the declines in grant rates
observed over the temporal dimension of Figure 3—that is, over the increases in years within the
various grade levels—perhaps suggest a story in which examiners in general learn over time how
-0.3
0-0
.20
-0.1
00.0
00.1
0
Gra
nt Rate
at In
dicate
d G
rade/E
xperience
Gro
up R
ela
tive to G
S-L
evel 12 / 1
st
Year G
roup
GS-12 GS-13 (1) GS-13(2) GS-14
Grade Level / Experience Group (2-Year Incrementswithin each Level)
Relative Grant Rate: Confidence Interval Relative Grant Rate: Mean

29
to form more effective bases of rejection (thus contributing to falling grant rates), only to have
this learning process interrupted by occasional promotions that diminish the amount of time they
have to derive such rejections (thus re-elevating grant rates).
In discussing Figure 3, it also bears mentioning that examiners may continue to receive salary
increases throughout their tenure at each GS-level. The presence of such alternative types of
promotions—that is, within-GS-level increases in salary that are tied only to experience—are
further helpful for our analysis in providing support against an argument that the findings set
forth in Figure 1 are attributable merely to any increases in income associated with GS-level
promotions (if that were the case, grant rates would tend to rise throughout all of Figure 3).25
4. Caveats
To be sure, our identification of GS-level effects as distinct from experience effects in Figure 1
and Table 3 is drawn from the experiences of those examiners that happen to stay within those
GS levels for some time before being promoted. For low GS levels, this group of examiners is
more select. It is unclear whether such local findings generalize to the quick risers within the
Agency. Nonetheless, the same pattern of grant-rate increases upon promotion is present as we
proceed to higher and higher grade levels, where it is more common for examiners to spend
multiple years within given GS levels, lending some confidence to a more general story.
Similar concerns arise for the case of the within-GS-level declines in grant rates over time
observed in Figure 3. After all, only a small minority of examiners at GS-12 and 13 stay at those
grades over the full course of years depicted. Perhaps the most conservative way to interpret our
results is that with respect to at least some examiners—that is, those that happen to achieve
25 Examiners are promoted to different “steps”—e.g., Step 1 at GS-12, Step 2 at GS-12, etc. These step promotions
generally transpire with increases in experience over time, as distinct from merit based promotions, and generally entail a
meaningful increase in salary level. For instance, a GS-level 14 at “Step 5” is paid $128,941 while a GS-level 14 at Step 10 is
paid $147,900.

30
promotions relatively more slowly—the effects of increased temporal experience on grant rates
appears to generally be negative. For those other examiners that experience early promotions
more rapidly, it is difficult to say what role experience plays as distinct from GS-level changes
during these early years. Nonetheless, such quick risers at least stay for a long time at GS-14 at
which point their grant rates do indeed fall with more years of experience.
5. Sample Balance
A related concern stems from the sample imbalance in the above specifications. Take Figure 1
for instance. Though examiners in our sample experience on average nearly 4 of the 7 possible
promotions depicted in this figure and though the relevant GS-level coefficients are identified by
actual within-examiner changes in grade levels for at least some subset of examiners (as opposed
to across-examiner comparisons), the underlying specification does not follow all examiners
throughout each of the indicated grade levels. Nonetheless, in Columns 5 and 6 of Table 3, we
present results of a balanced-sample analog of Column 1/Figure 1 in which we follow a more
select group of examiners that experience each of the indicated promotions. The findings
parallel those presented above.
Figure 3 poses similar concerns insofar as some examiners are entering the sample period
during the course of the trajectory envisioned by this figure. In Figure 4, we arguably achieve
better balance by estimating a similar specification but conditioning on those examiners that
enter the sample period at least below GS-12, allowing us to observe how examiners proceed
along the pathway inherent in Figure 3 as they enter the GS-12+ range from the outset. In the
Online Appendix, we present results from yet additional specifications that aim to achieve
sample balance in tracing examiner behavior throughout the course of their careers.

31
6. Other Robustness Checks and Alternative Specifications
Covariates and Technology Effects. We further challenge the above grant-rate results through
a range of additional robustness exercises. For instance, we demonstrate in Column 4 of Table 3
that the above findings remain nearly unchanged when we include certain application-level
controls (indicated in Section III above), along with the inclusion of technology-by-year fixed
effects (Column 4 of Table 3). Further, in the Online Appendix, we estimate specifications
identical to that underlying Figure 1 separately for each of the 37 different Hall et al. (2001)
technology sub-categories. This exercise demonstrates that the increase in grant rates associated
with the promotions of interest manifests itself in each of the 37 different technologies (as
opposed to being driven by a small subset of technologies).26 As such, time constraints appear to
be binding across the board within the Agency.
Falsification Exercise. In Table A9 of the Online Appendix, we conduct a falsification test in
which we estimate the relationship between the promotions of interest and two characteristics of
the underlying application with respect to which the examiner has no ability to alter (and with
respect to which we have data): (1) whether or not the incoming application was previously filed
with the EPO and JPO and (2) whether or not the applicant is a large or small entity (as such
terms are used by the Patent Office to set application fees). We find no meaningful or
statistically significant changes in foreign priority rates as examiners ascend grade levels. From
GS-level 11 onwards, we find that the incidence of a large-entity applicant remains virtually flat
26 With respect to a few of those 37 groups, grant rates initially fall after the first promotion but then rise thereafter. Of
course, in those latter instances, the grant rates are still rising over the range where the methodology can best separate a time
allocation effect from an experience in years effect. Bear in mind that differences across technologies in the need for
examination hours (because of differences in underlying levels of complexity of the art) are already reflected in the allocation
schedules. This fact makes it difficult to form ex ante predictions that promotion-related tightening of time constraints will have
greater impacts in some technologies relative to others. We also caution that little should be drawn from the observation of
declining grant rates upon early promotions in those few instances where it is observed considering that the affected
technologies—e.g., Drugs—are generally complex fields where the vast majority of examiners enter the affected Art Units at GS-
11 or 12.

32
(with only a minor increase in this incidence as examiners move from GS-7 to GS-9 and then
from GS-9 to GS-11). These results lend further confidence to the contention that applications
are randomly sorted, especially in the grade levels of most interest for our analysis (where it
becomes easier to separate experience effects from grade-level effects).
GS-15 Examiners. For the reasons set forth in the Online Appendix, we exclude those few
applications examined by GS-15 examiners from the primary analysis (< 3 percent of all
applications). While published, official records regarding the scaling of time allotments upon
promotions suggest that GS-15 examiners should be given even less time than GS-14 examiners
to review applications, the examiner-level time allotment information we received from the
Patent Office suggested that this may not be the case for many of the GS-15 examiners. In spite
of this discrepancy, we estimate specifications in the Online Appendix that include these GS-15-
examined applications and assume that GS-15 examiners are indeed given less time for review,
as the official schedules suggest they should. As demonstrated by Figures A5 and A6, we
continue to estimate the same pattern of results with this inclusion.27
B. Analysis of Rejection Patterns
1. Obviousness
A key prediction set forth above is that examiners will begin to perform fewer and fewer
rejections based on the argument that the proposed claims are obvious—an especially time
intensive analysis—upon the occurrence of promotions that leave them with less and less
allocated examination time. We now attempt to illuminate the above grant-rate findings by
27 The Online Appendix presents results of certain additional robustness checks, including, among others, the estimation
of specifications that control for the incidence of a request-for-continued examination (RCE) associated with the application,
which is a device used by applicants to continue the examination process in the face of an examiner’s final rejection.
33
testing this secondary hypothesis and exploring the effects of promotions on the incidence of
obviousness rejections among the underlying applications.
One limitation of the data that we collected for this analysis, as novel as it is, is that we simply
capture the incidence of any obviousness rejection without knowing the full force of such
rejection. Does it simply cover one claim or many claims? Is it easy to overcome or difficult?
Such questions cannot be adequately resolved with the data collected. With this limitation in
mind, we first take an approach where we do not view obviousness rejections in an absolute
sense, but instead specify the dependent variable as the ratio of obviousness rejections to total
rejections, more specifically the incidence of an obviousness rejection divided by the sum of the
incidence of the following types of rejections: obviousness, lack of novelty, lack of patentable
subject matter/utility, and failure to satisfy the disclosure requirements. Though each of the
variables underlying this ratio suffer from the above limitation, this measure at least provides us
with a sense of the relative effort spent on obviousness rejections. In Columns 1 and 2 of Table
4, we replicate the basic specifications estimated in Table 3 but use this obviousness share
measure as the dependent variable. The results depict a monotonically strengthening decline in
this obviousness rejection share upon the promotions of interest, suggesting a story in which
examiners begin to spend less and less of their efforts on time-intensive obviousness analyses
upon promotions that leave them with less and less time at their disposal.28
28 Figures A10-A12 of the Online Appendix plots trends over GS-level increases in the incidence of each type of rejection
separately, further illuminating the pattern of results presented in Column 1 of Table 4.

34
TABLE 4. RELATIONSHIP BETWEEN EXAMINATION SCRUTINY METRICS AND GRADE AND
EXPERIENCE LEVELS OF ASSOCIATED EXAMINERS
(1) (2) (3) (4)
SHARE OF REJECTIONS BASED
ON OBVIOUSNESS
SHARE OF PRIOR ART
CITATIONS FROM EXAMINER
Omitted: GS-7
GS-9 -0.001
(0.004)
-0.000
(0.004)
0.004
(0.007)
0.002
(0.006)
GS-11 -0.006*
(0.004)
-0.004
(0.004)
-0.009
(0.007)
-0.003
(0.007)
GS-12 -0.024***
(0.004)
-0.020***
(0.005)
-0.027***
(0.007)
-0.012*
(0.007)
GS-13 -0.028***
(0.005)
-0.024***
(0.005)
-0.038***
(0.007)
-0.013*
(0.008)
GS-13 (with partial signatory
authority)
-0.035***
(0.005)
-0.031***
(0.005)
-0.048***
(0.008)
-0.018**
(0.008)
GS-14 -0.050***
(0.005)
-0.046***
(0.006)
-0.051***
(0.008)
-0.020**
(0.008)
Omitted: 0-1 Years Experience
2-3 Years Experience - -0.007***
(0.002) -
-0.018***
(0.004)
4-5 Years Experience - -0.006*
(0.004) -
-0.035***
(0.005)
6-7 Years Experience - -0.007
(0.005) -
-0.045***
(0.007)
8-9 Years Experience - -0.010*
(0.006) -
-0.043***
(0.008)
10-11 Years
Experience -
-0.009
(0.007) -
-0.039***
(0.010)
12-13 Years
Experience -
-0.010
(0.009) -
-0.034***
(0.011)
14+ Years Experience - -0.009
(0.010)
-0.018
(0.014)
N 884857 884857 643838 643838
* significant at 10%; ** significant at 5%; *** significant at 1%. Standard errors are reported in
parentheses and are clustered to correct for autocorrelation within given examiners over time. Each
observation in Columns 1 and 2 is a given application from the PAIR database that reached a final
disposition and that was published in the PAIR records between March, 2001 and July, 2012. Each
observation in Columns 3 and 4 is from a subset of those applications that culminate in an issued
patent.

35
Figure 5: Relationship between Share of Rejections based on Obviousness and Increases in
Experience Years within Distinct Grade Levels
Notes: this figure replicates that of Figure 3 except that it replaces the incidence of an application being granted with the share of rejections for the application constituting an obviousness rejection as the dependent variable.
Figure 6: Relationship between Incidence of any Obviousness Rejection and Increases in
Experience Years within Distinct Grade Levels
Notes: this figure replicates that of Figure 3 except that it replaces the incidence of an application being granted with the incidence of an application experiencig an obviousness rejection as the dependent variable.
-0.1
0-0
.05
0.0
00.0
50.1
0
Obviousness R
ejection S
hare
at In
dicate
d
Gra
de/E
xperience G
roup R
elative to
GS-L
evel 12 / 1
st Year Gro
up
GS-12 GS-13 (1) GS-13(2) GS-14
Grade Level / Experience Group (2-Year Incrementswithin each Level)
Obviousness Rejection Share: Confidence Interval Obviousness Rejection Share: Mean
-0.05
0.00
0.05
0.10
0.15
Obviousn
ess Rejection R
ate at Indicated
Gra
de/E
xperience G
roup R
elative
to
GS-L
evel 12 / 1st Year Gro
up
GS-12 GS-13 (1) GS-13(2) GS-14
Grade Level / Experience Group (2-Year Incrementswithin each Level)
Obviousness Rejection Rate: Confidence Interval Obviousness Rejection Rate: Mean

36
In Figure 5, we follow the approach of Figure 3 and track how the share of obviousness
rejections evolves as an examiner increases in tenure over time within particular grades.
Complementing the observation in Figure 3 of jumps in grant rates upon promotions, we observe
corresponding drops at such moments in obviousness rejection efforts. Further complementing
Figure 3, which demonstrates a general trend to decrease grant rates over time within given grade
levels, Figure 5 likewise demonstrates a corresponding tendency over the time dimension to
increase the share of obviousness rejections. As before, this may be consistent with a learning
story in which examiners get better and better at forming obviousness determinations over time.
Periodically, however, examiners will experience promotions that cut short the time they have to
make such rejections, at which moments, the rates by which they are able to form obviousness
rejections fall back down. We note that examiners may experience a learning curve with respect
to other types of rejections as well (e.g., novelty). The obviousness share measure employed in
Figure 5 effectively normalizes the analysis by any such general rejection-learning trends,
focusing instead on the relative degree of obviousness scrutiny. In Figure 6, we attempt to
explore this learning-disruption story in a more absolute sense and replace the obviousness
rejection share as the dependent variable with the incidence of any obviousness rejection itself.
The results depict an even starker increase in rejection behavior over time followed by large
drops upon examination-time-reducing promotions.
2. Implications of Obviousness Analysis for Grant-Rate Findings
As discussed in Section I, once an examiner reaches the second GS-13 classification and GS-
level 14, she attains more authority of her own to sign off on decisions, thus representing a
decline in the level of scrutiny placed on her by her superiors. One may be concerned that the
increase in grant rates observed upon promotion in Figure 1 are merely a reflection of this
37
lightening of scrutiny. The fact that this pattern of increasing granting tendencies occurs over
earlier promotions, which do not come with the formal extension of greater authority and less
oversight, lends support to the idea that the documented pattern of results may not simply arise
from changes in the degree of oversight. We acknowledge, however, the possibility of informal
lightening of scrutiny as examiners are promoted at earlier grades. That is, supervisors may
lessen the extent they review an examiner’s work as she gets promoted from GS-7 through GS-
13, even though there is no formal policy by the Patent Office to do so. If this occurs, our results
would still hold but their interpretation would differ. Examiners may grant more patents upon
promotion not because they become more time constrained but instead because the work is
subject to less review, enabling examiners to increasingly shirk their responsibilities.
Nevertheless, one may take our findings as being more consistent with increasing time
constraints rather than a lightening of scrutiny for several reasons. First, as implied by Table 4
and Figure 5 and as shown more explicitly by Figures A10-A12 in the Online Appendix, we find
that the basis of rejection that falls the most upon grade-level changes—both in terms of
consistency and magnitude—relates to the obviousness of the application. In other words, the
reductions in rejections that may correspond to the observed increase in application allowances
are those that are most sensitive to the amount of time allocated to examiners. With respect to
the other rejection types—i.e., § 101 rejections (utility/patentable subject matter), § 112
rejections (written description/enablement/definiteness) and § 102 rejections (novelty)—we
actually do not observe a decline in grant rates upon the promotions of interest at all (only a
leveling out). Ultimately, if examiners are truly shirking work upon promotion, it is less clear
why obviousness rejections would receive the emphasis of their reduced attention. The observed
pattern is arguably more consistent with time-management developments.

38
Second, consider our results in Figure 3 and 4, which suggest that an examiner’s grant rate
initially increases upon promotion and then falls with each additional year an examiner spends at
the grade level in question. If these findings were driven by a lightening of informal scrutiny,
supervisors would arguably have to lessen their review of an examiner’s work immediately upon
promotion but then slowly increase their review as the examiner garners more experience within
a particular grade level. This is perhaps less plausible than the binding time constraint
explanation—i.e., an examiner’s grant rate increase upon promotion and then gradually
decreases as she learns to adjust to her new time allocation.
C. Investigation of Prior Art Citations
To further illuminate whether the above patterns of rising grant rates and falling obviousness
rejections upon the relevant promotions are indeed a reflection of reduced examination effort
stemming from binding examination-time constraints, we next estimate the relationship between
GS-level promotions and the share of total prior-art citations listed in the final patent that are
provided by the examiner as opposed to the applicant, a proxy (even if crude) for the search
effort of the examiner. In Columns 3 and 4 of Table 4, we estimate this relationship over the full
sample of patents issued between 2002 and 2012. This specification is, of course, somewhat
compromised by the fact that it relies only on issued patents, the incidence of which we already
know (as above) is likely to increase upon the promotions of interest, leading to possible
selection concerns. With this caveat in mind, we note that the findings parallel those of the
obviousness-rejection analysis above.

39
TABLE 5. RELATIONSHIP BETWEEN ALLOWANCE RATE AT EPO AND JPO AND U.S. EXAMINER
GRADE AND EXPERIENCE LEVELS, AMONG SET OF U.S. PATENTS LIKEWISE SEEKING
PROTECTION AT EPO AND JPO
(1) (2) (3)
INCIDENCE OF
ALLOWANCE
AT BOTH EPO
AND JPO
INCIDENCE OF
ALLOWANCE
AT EPO
INCIDENCE OF
ALLOWANCE
AT JPO
Omitted: GS-7
GS-9 -0.024
(0.018)
-0.030*
(0.018)
-0.019
(0.017)
GS-11 -0.048***
(0.019)
-0.048***
(0.018)
-0.031*
(0.017)
GS-12 -0.056***
(0.019)
-0.057***
(0.018)
-0.033*
(0.018)
GS-13 -0.063***
(0.020)
-0.059***
(0.019)
-0.042**
(0.019)
GS-13 (with partial signatory authority) -0.065***
(0.020)
-0.061***
(0.020)
-0.040**
(0.020)
GS-14 -0.070***
(0.021)
-0.063***
(0.020)
-0.048**
(0.02)
Omitted: 0-1 Years Experience
2-3 Years Experience 0.010
(0.009)
0.007
(0.010)
0.029**
(0.009)
4-5 Years Experience 0.022*
(0.013)
0.015
(0.013)
0.029**
(0.012)
6-7 Years Experience 0.024
(0.016)
0.020
(0.016)
0.034**
(0.015)
8-9 Years Experience 0.025
(0.020)
0.023
(0.019)
0.037**
(0.019)
10-11 Years
Experience
0.029
(0.024)
0.024
(0.023)
0.039*
(0.023)
12-13 Years
Experience
0.029
(0.028)
0.023
(0.027)
0.041
(0.026)
14+ Years Experience 0.016
(0.034)
0.022
(0.032)
0.023
(0.033)
N 172103 172103 172103
* significant at 10%; ** significant at 5%; *** significant at 1%. Standard errors are reported in
parentheses and are clustered to correct for autocorrelation within given examiners over time.
Each observation is from the sample of applications that (1) were filed after March, 2001 and (2)
that reached a final disposition and that were published in the PAIR records between March, 2001
and July, 2012. The sample is further restricted to those applications that actually culminated in a
patent grant and whose underlying inventors also sought patent protection at the JPO and EPO.
40
D. Assessment of Marginal Nature of Increased Grants
The analysis above suggests that, as time constraints tighten, examiners will grant some
patents that they might have otherwise rejected if given sufficient time. Assuming an otherwise
competent examination process, these additional patent grants should be of marginally
questionable validity—i.e., they should fail to satisfy a proper application of patentability
standards. It is inherently difficult to systematically assess the underlying legal validity of each
of the patents issued in our sample. Nonetheless, to test this prediction, we rely upon the fact
that many U.S. applicants likewise file for patent protection with the European Patent Office
(EPO) and the Japan Patent Office (JPO), two offices that are known to invest substantially more
resources per application in the examination process, while having essentially similar
patentability standards (Picard and van Pottelsberghe de la Potterie, 2011). Accordingly, we
consider the sample of issued patents in which the relevant U.S. applicant likewise sought
protection at the EPO and the JPO and follow Jaffe and Lerner (2004) and Lemley and Sampat
(2012) in using outcomes at these foreign offices as a benchmark—albeit an imperfect one—to
assess what the outcome at the U.S. Patent Office would have been (at least generally speaking)
if the U.S. examiners were to be given more time and resources to determine the patentability of
the relevant invention.
For these purposes, we note that it is not possible to pinpoint the exact marginal patents that
are issued as a result of binding time constraints. Nonetheless, with the above (admittedly,
rough) proxy for validity in mind, one can arguably identify the quality of such marginal patents
by looking at the full sample of patents that were issued in the U.S. and that sought protection in
the EPO and the JPO and then estimating how the mean incidence of such patents likewise being

41
granted by the EPO (and/or JPO) changes as examiners experience the examination-time-
reducing promotions of interest. The above analysis demonstrated that the pool of issued patents
will rise upon such promotions. To the extent that average quality levels among the set of issued
patents fall upon these events, it must be the case that the marginal patents being issued as a
result of these promotions are of an increasingly below-average level of quality (Frakes 2013).29
In Table 5, we test for the presence of falling mean rates upon promotion for the indicated
patent quality metric. Consistent with expectations, we indeed estimate monotonically
(generally) declining patterns of this nature, suggestive of marginal patent issuances of
weakening validity. Relative to the patents issued at GS-7, the patents issued at GS-14 are 7
percentage-points—or roughly 16 percent—less likely to be allowed by both the EPO and the
JPO (when using success at both foreign offices to signify the strongest benchmark of quality).
Whether or not those additional patent grants arising from such promotions have truly crossed
the invalidity threshold, the evidence suggests that they are at least of a more questionable nature
than the typical issuance.
V. DISCUSSION AND CONCLUSION
A. Summary and Magnitude of Findings
Our analysis finds that as examiners are given less time to review applications upon certain
types of promotions, the less prior art they cite, the less likely they are to make time-consuming
obviousness rejections, and the more likely they are to grant patents. Moreover, our evidence
suggests that these marginally issued patents are of weaker-than-average quality. These findings
demonstrate that a factor other than the true patentability of applications may be a determinant of
granting decisions and may be pushing grant rates upwards. All else equal, they thus support the
29 After all, if one adds some object to an existing set of objects and the average value of the overall set of objects falls, it
must be case that the object added on the margin is of below-average value.

42
general sentiment that the Patent Office may be biased towards allowing patents. Of course, all
else is not necessarily equal and we cannot say definitively that the net effect of all features of
the Patent Office pushes in this direction. Nonetheless, we stress that the feature that we do
emphasize in this analysis is one that may meaningfully alter the granting landscape of the
Agency. Combining the estimated impacts of GS-level changes on grant rates depicted in
Column 1 of Table 3 with the distribution of applications examined across the various grade
levels, as depicted in Column 1 of Table A1 in the Online Appendix, our analysis implies that if
all examiners were allocated as many hours as are extended to GS-7 examiners, the Patent
Office’s overall grant rate would fall by roughly 14 percentage points, or nearly 20 percent.30
Based on the number of annual disposals by the patent office in recent years, this would amount
to approximately 40,000-45,000 fewer issued patents per year.
To facilitate an alternative interpretation of the magnitude of the above findings, Table A7 in
the Online Appendix presents results from an examiner fixed effects specification that likewise
draws upon promotion-related changes in time allocations but that replaces the grade level
dummy variables with a single variable for the number of hours allocated to the application at
hand (and that includes Patent Office class dummies to account for fixed differences in hour
allotments across classes). This exercise suggests that a doubling of the amount of hours given
to all examiners is associated with a 9 to 24 percentage point (or a 13 to 34 percent) reduction in
the grant rate, representing roughly 40,000-100,000 fewer patents being issued each year.
B. Quality / Production Tradeoff
30 For example, roughly 35 percent of applications are disposed of by GS-14 examiners, whom we have estimated to grant
at a nearly 19 percentage-point (or 28 percent) higher rate than GS-7 examiners, accounting fully for examiner heterogeneity.
This implies that if, those applications disposed of by GS-14 examiners were granted at the same rate applied by GS-7 examiners,
the Agency would experience a reduction in its grant rate of roughly 7 percentage points (=0.19*0.35) or by roughly 10 percent
(0.28*0.35). Extending this exercise to the remaining grades and aggregating the amounts delivers the indicated 20 percent
effect.

43
1. Basic Framework
Of course, increasing the number of hours allotted to examiners in such a manner would not be
without consequence. To understand the tradeoffs at play here, consider a Patent Office with the
following objective function:
! = ∑ #�$%&� , ' −)�*
+;
where xt is the number of applications processed by the Agency at time t, gt is the rate by which
the Agency grants applications at time t and ) is the rate by which the Agency would grant
applications if given sufficient time to properly follow the patentability standards. First, we
assume that V’(xt) > 0—i.e., that the Patent Office’s utility is enhanced the greater it is able to
satisfy its obligation to process incoming applications. It could of course decline to satisfy all
such obligations immediately and review some applications at a later date; however, pursuant to
the above objective function, the Patent Office will discount a delayed review (*+�. That is, we
assume that the Agency values a timely review of all incoming applications. Long patent delays,
after all, can postpone the deployment of valuable inventions to the marketplace and increase
uncertainty surrounding the rights of potential patents, which in turn limit a company’s ability to
license or engage in related activity. Moreover, to the extent future inventions are based on prior
ones, a backlog of patent applications may deter cumulative innovation.31
As theorized above (and as supported by the empirical analysis), ' −) increases as the time
allocated to review an individual application in year t, at, decreases. In other words, time
constraints lead to a bias in the Patent Office’s granting practices.32 Moreover, we assume that
the Agency disvalues the presence of any such bias—i.e., V’(' −)) < 0. As stated in our
31 Based on these costs, one study has estimated that an additional year of patent pendency could cost the global economy
close to 12 billion dollars (London Economics 2010). 32 In light of our focus in this paper on determinants of a pro-granting bias and in light of our theoretical predictions of
such a bias, we only consider the situation where ' ≥)—that is, where grant rates may be set higher than the unbiased rate.

44
introductory remarks, the granting of invalid patents on the margin may stunt follow-on
innovation and impose related harms on society.
Finally, it is critical to note that the Patent Office will maximize this objective function subject
to a resource constraint that must be satisfied at each time period (according to a fixed budget,
R): � ≥ athtxt, ∀/, where ht equals the cost per hour of examination time to the Agency. It is
beyond the scope of this paper to evaluate whether the Agency is properly optimizing its
constrained objectives with its choice over how many hours to allocate to each individual
application; rather, we simply set forth this structure in order to demonstrate the trade-offs
associated with this choice. The Patent Office may increase the amount of time, a, allocated to
review given applications in an attempt to reduce its grant bias—i.e., bring gt closer to )—and
thereby increase its utility, V. However, to the extent that the budget constraint binds (and in
light of the fixed R), it can be readily shown that an increase in a in period t must come at the
expense of a reduction in the amount of applications processed in period t, x, a development that
would, in turn, inhibit the objectives of the Patent Office and result in the above specified harms
associated with delayed examinations.33
As such, the Agency’s choice over how many hours to extend to examiners implicates a
possible tradeoff between the benefits of improved patent quality and the harms of reduced
examination capacity. Our empirical analysis suggests that the above specified budget constraint
may indeed be binding and that this tradeoff is presently in action. However, the above analysis
does not necessarily demonstrate that the way in which the Patent Office executes this tradeoff is
suboptimal given its budgetary limitations. Of course, to the extent that the Agency overly
favors examination capacity concerns in performing this calculus (beyond the weight that may be
applied to such concerns by a social planner), which is possible given that application throughput 33 In the case of a binding budget constraint, $ = Rt/(atht), in which case d(xt)/d(at) < 0.

45
(and associated backlog) is a more highly visible and easily measured feature of the Agency
relative to the quality of its review (Holmstrom and Milgrom, 1991), the Patent Office’s
execution of this tradeoff may indeed deviate from optimality—i.e., it may be setting
examination time allotments insufficiently low.34
2. Examiner Heterogeneity in Productivity
Figure 3 suggests that examiners may undergo productivity gains as they accumulate
experience over time within the Patent Office. That is, for a given time allotment, a, examiners
may be able to bring gt closer to ) as they spend more time at the Agency. With these gains in
mind, the Agency may desire to set different time allocations for examiners with different levels
of productivity (e.g., provide less time to examiners with experience).35 The above framework
can be readily extended to account for examiner heterogeneity along such lines, such that the
Patent Office will maximize
! = ∑ ∑ #�$0%&� , '0 −)�*
+0 ;
s.t.
� ≥ ∑ 10$0ℎ00 , ∀/
where m signifies different productivity groups. In the unitary examiner framework set forth
above, increases in application throughput, x, could only come at the expense of driving grant
rates above their unbiased point, ) (i.e., at the expense of quality), when constraints bind. If all
examiners experienced productivity gains, one might expect to observe a relaxation of the budget
34 In its own annual reports, the Patent Office’s rhetoric suggests an especially strong emphasis on promoting examination
throughput. In its 2008 Performance and Accountability Report, the Patent Office stated that its “biggest challenge” is to
decrease its patent pendency (the time between the filing of an application and the receipt of a substantive communication from
the Agency) and to decrease the backlog of applications awaiting review (United States Patent and Trademark Office, 2008).
Moreover, the Office of Inspector General recently issued a report concluding that the Patent Office’s policies in place to review
the quality of patent examiner decisions were largely ineffective. (Office of Inspector General, 2015). 35 While the Patent Office does not necessarily make such adjustments over years of experience itself, they do, as
discussed above, time-allocation adjustments upon certain specified promotions.

46
constraint and a resulting first order condition in which examination quality is marginally less
compromised—i.e., a reduction in grant rates. If only some examiners experience productivity
gains, the Patent Office may experience similar relief and set time allocations such that its
overall grant rate goes down. However, without knowing more about the structure of the Patent
Office’s objective function, it is difficult to predict how any such desired quality improvements
will be split among the different productivity types. For instance, to the extent the Agency
places significant value on horizontal application equity, it may try to adjust time allotments in a
way that still leaves '0 −) similar across different examiner types, m—i.e., in a way that
leaves an applicant’s outcome unaffected by the examiner she randomly receives.
We leave it for future research to assess the optimality of the particular relationship between
examination time-allocation adjustments and grant rates that we observe in Figure 1.
Nonetheless, we emphasize that the relationship we do observe is, interestingly, one in which
grant rates increase strongly as examiners experience time-allocation adjustments associated
with productivity gains. To the extent that the solution to this maximization problem is one in
which grant rates are either expected to fall with time-allocation adjustments upon seniority or
stay roughly flat—which, again, might be desirable in the event that we place sufficient value on
horizontal equity—these results would suggest that the present examination time schedule is not
calibrated optimally (or equitably) to reflect actual productivity improvements.36
C. Ex-Ante / Ex-Post Investment in Quality
One feature of the patent system arguably missing from the framework set forth above is the
judiciary. If examiners are given less time, a, to review applications, examiners may begin to
issue legally invalid patents on the margin (pushing g above )�. As above, this may benefit
36 Cockburn, Kortum, and Stern (2003) and Lemley and Sampat (2012) each suggested that the findings of substantial
examination heterogeneity raised concerns over the equity of the examination process, suggesting than an applicant’s outcome
with the process comes down to a luck of the draw with respect to which examiner she is randomly assigned.
47
welfare to the extent it allows the Agency to process more applications on a limited budget; but it
may be detrimental to the extent it results in the issuance of invalid patents. However, the
welfare losses associated with such issuances may not be as large as originally envisioned to the
extent the courts may subsequently correct this outcome and invalidate these patents (albeit with
a delay). Of course, this legal backdrop is not without welfare consequences of its own.
Litigation, when it arises, carries substantial administrative expenses, lawyer fees, and related
costs.
As such, given that both the Patent Office and the courts assess the patentability of claimed
inventions, the tradeoffs at play here take on yet another dimension: the balance in society’s
utilization of these two institutions to apply the patentability standards. Any such analysis will
likely involve an assessment of the relative administrative expenses associated with these
separate systems. Though far more expensive on a per-unit basis, litigation ultimately arises in
the case of a small fraction of those applications before the Patent Office. Consider the decision
to increase the amount of examination time given to examiners. Though carrying added payroll
expenses, this policy decision may decrease the number of invalid patents that the Agency issues
and potentially reduce the number of lawsuits moving forward (and associated litigation
expenses). Making particular assumptions about the various parameters in play with this
analysis—e.g., the costs of litigation, the costs of examination, the frequency of litigation, etc.—
Lemley (2001) suggests that increasing the hours to review applications may not be cost
effective. The present analysis affords us an opportunity to revisit Lemley’s claim. In the
Online Appendix, we apply certain conservative assumptions and perform a back-of-the-
envelope calculation—supported by novel estimates of the reduction in legal challenges that may
result from increasing examination hours—demonstrating that the savings in future litigation

48
costs associated with giving all examiners the amount of time given to GS-7 examiners more
than outweigh the added payroll expenses to the Patent Office.
At the least, this exercise supports the relevance of the Patent Office in this larger welfare
calculus. That is, the presence of the courts and the fact that they are invoked in rare and
important cases may not render inconsequential the decision as to how many examination hours
to extend to patent examiners.
REFERENCES
Alcacer, Juan, Michelle Gittelman, and Bhaven Sampat, “Applicant and Examiner Citations to
Patents: An Exploration and Overview,” Research Policy (2009), 415–427.
Asch, Beth J., “Do Incentives Matter? The Case of Navy Recruiters,” Industrial and Labor
Relations Review 43 (1990), 89S-106S.
Baker, George, Robert Gibbons, and Kevin Murphy, “Subjective performance measures in
optimal incentive contracts,” Quarterly Journal of Economics, 109 (1994), 1125–1156.
Burk, Dan and Mark A. Lemley, The Patent Crisis and How the Courts Can Solve It (2009).
Chan, David, “Teamwork and Moral Hazard: Evidence from the Emergency Department,”
Journal of Political Economy, forthcoming (2015 a).
Chan, David, “The Efficiency of Slacking Off: Evidence from the Emergency Department,”
mimeo, Stanford University (2015 b).
Cockburn, I., S. Korum, and S. Stern, “Are All Patent Examiners Equal? Examiners, Patent
Characteristics, and Litigation Outcomes,” in W. M. Cohen and S.A. Merril (Eds.),
Patents in Knowledge-Based Economy (Washington, DC: National Academies Press,
2003).

49
Cohen, Wesley M., Richard R. Nelson, and John P. Walsh, “Protecting Their Intellectual Assets:
Appropriability Conditions and Why U.S. Manufacturing Firms Patent (or Not),” NBER
working paper 7552 (2000).
Cotropia, Christopher, Mark Lemley, and Bhaven Sampat, “Do Applicant Patent Citations
Matter?”, Research Policy, 42 (2013), 844–54.
Courty, Pascal and Gerald Marshke, “An Empirical Investigation of Gaming Responses to
Performance Incentives,” Journal of Labor Economics, 22 (2004), 23-56.
de Ree, Joppe, and Rob Alessie, “Life Satisfaction and Age: Dealing with Underidentification in
Age-Period-Cohort Models,” Social Science and Medicine, 73 (2011), 177–82.
Frakes, Michael D. "The Impact of Medical Liability Standards on Regional Variations in
Physician Behavior: Evidence from the Adoption of National-Standard Rules." American
Economic Review, 103(1) (2013), 257-76.
Frakes, Michael D. and Melissa F. Wasserman, “Does Agency Funding Affect Decisionmaking?:
An Empirical Assessment of the PTO’s Granting Patterns,” Vanderbilt Law Review,
(2013), 67–147.
Frakes, Michael D. and Melissa F. Wasserman, “The Failed Promise of User Fees: Empirical
Evidence from the United States Patent and Trademark Office,” Journal of Empirical
Legal Studies, 11(4) (2014), 602-36.
Frakes, Michael D. and Melissa F. Wasserman, “Does the U.S. Patent and Trademark Office
Grant Too Many Bad Patents?: Evidence from a Quasi-Experiment,” Stanford Law
Review, 67(3) (2015), .
Galasso, Alberto and Mark Schankerman. “Patents and Cumulative Innovation: Causal
Evidence from the Courts,” Quarterly Journal of Economics, forthcoming (2014).
50
Griliches, Zvi, “Patent Statistics as Economic Indicators: A Survey,” Journal of Economic
Literature, 28 (1990), 1661–1707.
Hall, B. H., A. Jaffe, and M. Trajtenberg, “The NBER Patent Citations Data File: Lessons,
Insights and Methodological Tools,” NBER Working Paper 8498 (2001).
Hall, B. H., A. Jaffe, and M. Trajtenberg, “Market Value and Patent Citations,” Rand Journal of
Economics, 36 (2005), 613-76.
Harhoff, D., F. Narin, F. M. Scherer and K. Vopel, “Citation Frequency and the Value of
Patented Innovation,” Review of Economics and Statistics, 81 (1999), 511–515.
Heckman, J. and Robb, R, “Using Longitudinal Data to Estimate Age, Period and Cohort Effects
in Earnings Equations,” pp. 137-150 in WM. Mason and SE. Fienberg (eds.) Cohort
Analysis in Social Research: Beyond the Identification Problem, Springer-Verlag: New
York (1985).
Holmstrom, Bengt, and Paul Milgrom, “Multitask Principal-Agent Analyses: Incentive
Contracts, Asset Ownership, and Job Design.” Journal of Law, Economics, and
Organization 7 (2) (1991), 201-228.
Jaffe, A. B., M. Trajtenberg, and R. Henderson, “Geographic Localization of Knowledge
Spillovers as Evidence by Patent Citations,” The Quarterly Journal of Economics, 108
(1993), 577–598.
Jaffe, A. B. and Josh Lerner, Innovation and Its Discontents: How our Broken Patent System is
Endangering Innovation and Progress, and What to Do about It (Princeton, NJ: Princeton
University Press, 2004).
Larkin, Ian, “The Cost of High-Powered Incentives: Employee Gaming in Enterprise Software
Sales,” Journal of Labor Economics, 32 (2014), 199-227.

51
Lanjouw, Jean O. and Josh Lerner, “The Enforcement of Intellectual Property Rights: A Survey
of the Empirical Literature,” NBER working paper 6296 (1997).
Lemley, Mark A. and Bhaven Sampat, “Examiner Characteristics and Patent Office Outcomes,”
The Review of Economics and Statistics, (2012), 817–827.
Lemley, Mark A., “Rational Ignorance at the Patent Office,” Northwestern University Law
Review, (2001), 1495–1532.
Lichtman, Douglas, “Rethinking Prosecution History Estoppel,” University of Chicago Law
Review, (2004), 151–82.
London Economics, “Economic Study on Patent Backlogs and System of Mutual Recognition:
Final Report to the Intellectual property Office,” available at http://www.ipo.gov.uk/p-
backlog-report.pdf. (2010).
Mann, Ronald, “The Idiosyncrasy of Patent Examiners: Effects of Experience and Attrition,”
Texas Law Review, (2014), 2149–76.
Mansfield, Edwin, “Patents and Innovation: An Empirical Study,” Management Science, 32
(1986), 173–181.
Moser, Petra, “How Do Patent Laws Influence Innovation? Evidence from Nineteenth-Century
World’s Fair,” American Economics Review, (2004), 1214–1236.
Nordhaus, William, Invention, Growth, and Welfare (Cambridge, MA: MIT Press, 1969).
Office of Inspector General, USPTO Needs to Strengthen Patent Quality Assurance Practices,
Final Report No. OIG-15-026-A (2015).
Oyer, Paul, “Fiscal Year Ends and Nonlinear Incentive Contracts: The Effect on Business
Seasonality,” Quarterly Journal of Economics, 113 (1998), 149-185.

52
Pakes, Ariel, “Patents as Options: Some Estimates of the Value of Holding European Patent
Stocks,” Econometrica, 54 (1986), 755–784.
Picard, Pierre M., and Bruno van Pottelsberghe de la Potterie, “Patent Office Governance and
Patent System Quality,” CEPR Discussion Paper No. DP8338 (2011).
Sampat, Bhaven, “When Do Applicants Search for Prior Art?” Journal of Law and Economics
53 (2010), 399–416.
Sampat, Bhaven and Heidi L. Williams, “How do Patents Affect Follow-on Innovation?
Evidence from the Human Genome,” available athttp://economics.mit.edu/files/9778
(2014).
Scotchmer, Suzanne, “Standing on the Shoulder of Giants: Cumulative Research and the Patent
Law,” Journal of Economic Perspectives, 5 (1991), 29–41.
United States Patent and Trademark Office, “Performance and Accountability Report for Fiscal
Year 2008,” (2008), available at: http://www.uspto.gov/about/stratplan/ar/USPTOFY2008
PAR.pdf.

1
ONLINE APPENDIX TO
IS THE TIME ALLOCATED TO REVIEW PATENT
APPLICATIONS INDUCING EXAMINERS TO GRANT
INVALID PATENTS?: EVIDENCE FROM MICRO-LEVEL
APPLICATION DATA
A. Background on Patent Examiner Workload Expectations
Examiners are generally expected to meet certain workload goals, whereby they are
expected to attain a certain number of credits, often referred to as “counts”. Credits,
however, have historically been earned only upon the issuance of a first office action
and at final disposal, which occurs when a patent application is allowed by the examiner
or abandoned by the applicant (often after receipt of a final rejection or in anticipation
of such a rejection).1 By setting expectations regarding the number of credits examiners
should attain, the Patent Office contemporaneously sets expectations regarding the
amount of time examiners should spend on applications.2 The number of expected
hours allocated to review a patent application depends on both the technological field
in which the examiner is working and on her position in the general schedule (GS) pay
scale. A patent examiner in a more complex field is allocated more hours to review an
application than an examiner of the same grade who is working in a less complex field.
1 Since 2010 examiners can also earn partial credits for final office actions and examiner-initiated interviews with the patent applicant or her attorney. Under either system, a patent examiner earns a maximum of two credits per patent application examined. While examiners are free to average these time allotments over their caseload, they are strongly encouraged to meet their credit quota on a biweekly basis. Examiner’s performance appraisal plan (PAP) was also modified in 2010 in order to better align patent examiner incentives with those of the agency. These modifications were largely uniform across examiner pay grade, with the exception of SPEs (GS-15) who PAP changes differed from those of GS-5 through GS-14 patent examiners. 2 These time allotments have largely remained unchanged since 1976. The Patent Office has created new patent classifications as a result of new and emerging technology. Once the Agency has set the time allotments for a new technology these allocations also have largely remained unchanged. In 2010, however, the Patent Office increased the time allotments for every application by two hours.

2
The higher the pay grade of an examiner within a technology area the fewer number of
hours the Patent Office allocates to earn two credited work units.
B. Background on Collection of Rejection Types in USPTO PAIR Data
Through reading of a number of office actions in the PTO PAIR data, we identified the
following phrases that were either (1) likely to be associated with the examiner rejecting
a claim as failing to meet the patentability standards, (2) likely to be associated with the
examiner objecting to the form of the claim (as distinguished from its substance), (3)
likely to be associated with an examiner objecting to other aspect of the application or
making additional requirements of the patentee (e.g., objection to drawings, objection
to the abstract, restriction requirement, etc.). To be clear, the focus of this article is
claim rejections not objections. However, for completeness we reproduce the list of
phrases we searched, including phrases that are directed only at identifying objections,
below.
rejected under; rejected are under; rejected as unpatentable; as being
unpatentable; rejected as failing to define; objected to; election of species;
fails to define a statutory; antecedent basis; new title is required; title of the
application will; notice to comply; part of paper; prior art made of record and;
rejected as being based; rejected as being directed; rejected on the ground;
restriction to one of the fol; restriction is required under; status identifiers; fail
to meet; fail to comply; fail to contain; fail to provide; fail to identify; fail to
include; do not comply with; not in accordance with; cannot be patented;
defective because; non‐compliant because; renders the claim indefinite; not of
sufficient quality; filed after the issue fee was; filed after publication; drawings
in compliance with; declaration is missing; are not consistent; is not a proper
submission; not include a support; claim rejections; this is a provisional
obvious; because it is unsigned; not filed a certified copy; is non‐responsive;
required to furnish; introduce new matter; not contain a concise explan; the
following omission; request for information; requirement for information;
abstract exceeds 150 words; elect a single disclosed spec; elect disclosed
species; not properly annotated; not signed by an; not authorized to sign; not
been submitted; not appear to be relevant to; non‐elected subject matter in;
terminal disclaimer needs to; associate poa are no longer; include common
ownership as; other copending United States; application conflict with cla;
contain every element of cla; believed to interfere; has not been met; not

3
indicated the appropria; contain(s) every element of; claimed invention is
differe; contains every element of cl; declaration in compliance wi; does not
have publication da; do not have corresponding pa; filed well after the applica;
list of all patents. Publica; notice of non‐compliant amen; reference relevant to
the ex; required information for the; requires that the summary of; restriction
is hereby require; the appropriate statement ac; Website is not considered a.
After compiling this list of phrases we then searched for approximate matches to each
of the above listed phrases in office actions. Once such a match was identified we
captured (or excerpted) the matched phrase and a small amount of surrounding text
(approximately the sentence that contained the phrase). After this list of excerpts was
compiled, we wrote a simple program that allowed us to perform an iterative procedure
to match an excerpt containing a phrase listed above to a specific rejection type (e.g.,
101, 102, 103, etc.) or objection type (e.g., 37 C.F.R. 1.121(d)). The program began by
displaying all excerpts containing a phrase listed above that had not yet been assigned
to a rejection or objection type. By inspection of this list, we choose a string of text
(e.g., “35 USC 103”) appearing in at least one excerpt that ought to be associated with a
particular rejection type (e.g., obviousness). We then identified all excerpts containing
an exact match of the string of text that also contained a match to the same phrase
listed above and assign each of them to the identified rejection or objection type. That
is, each time we matched rejection or objection type to an excerpt we did so for only for
that group of excerpts containing the same above‐listed phrase (e.g., “rejected under,”
“rejected are under,” etc.). We continued this iterative process until there were no
more unassigned excerpts.
B. Supplementary Notes Regard Data Collection
Our sample includes all 1,956,493 utility applications that were filed on or after March
2001 and were published in the PAIR database by July 2012.3 By the end of 2012, 49
3 In November 2000, there was a change in the law that required newly filed patent applications to be published 18 months after they were filed. 35 U.S.C. § 122(b). Applicants abandoned within the first 18 months of filing, Id. § 122(b)(2)(A)(i) and applications wherein the applicant filed a special exemption to maintain confidentiality are exempted from this requirement, Id. § 122(b)(2)(B)(i). Such applications are thus absent from the PAIR database. When some or all of an applicant’s claims are not allowed by the Patent Office, the aggrieved party will sometimes file a continuation application. This application is given a new serial number and may be assigned to a different examiner. Continuation applications are treated as unique applications in the PAIR database. A related and now far more commonly used device, known as a Request for a Continued Examination (RCE), does not receive a new application serial number and effectively allows
4
percent of these applications had resulted in patents, 25 percent were not patented
because they had been abandoned by the applicant,4 and the remainder were still
pending. Applicants may elect to abandon their applications when they are unable to
overcome an examiner’s rejection or for other business‐related reasons. Our study
focuses on the 1.4 million utility applications filed from 2001 onwards that received a
final disposition—those that were granted of abandoned—by July, 2012.
Critical to our analysis is determining the experience (in years) and the GS‐level for each
of the 9,000 examiners represented in our sample. For these purposes, we match the
examiner field in the PAIR data with the two sets of examiner rosters received pursuant
to separate FOIA requests. In order to calculate the relevant examiner’s experience, we
take the difference between the year at the time of disposal of the application and the
first year at which the examiner joined the Patent Office, as determined by observing
when each examiner was first represented in annual examiner lists that we received
from the Patent Office. To ensure that this approach accurately captures the experience
of long‐tenure examiners, we began collecting these annual rosters in 1992—that is,
nearly ten years prior to the commencement of our sample period. Naturally, this
cannot ensure complete precision in the experience assignment given that some
examiners may have joined the Patent Office long before 1992 (making it difficult to
distinguish between 10‐year examiners and 20‐year examiners for those applications
disposed of in 2002). To alleviate these final censoring concerns, we simply focus the
empirical analysis on those examiners who joined the Office in 1993 and beyond,
though the results are entirely robust to disregarding this restriction (available upon
request). On average, this restricted set of examiners stays at the Patent Office for
roughly 6.8 years with roughly 25 percent of such examiners staying at least 10 years.
Pursuant to a second FOIA request, we received an additional set of annual rosters from
2001 to 2012 indicating the GS level associated with each examiner on staff over those
years. Furthermore, a third and final FOIA request allowed us to determine whether GS‐
an aggrieved applicant to keep the application on the examiner’s docket for further prosecution. RCEs are not treated as new, unique filings in the PAIR database; rather, they are treated as a continuation in the prosecution of original applications. 4 A small portion of these applications were actually abandoned after being allowed by the examiner.

5
13 examiners did or did not have partial signatory authority at that time, a distinction, as
above, that bears on the hours allocated to the examiner for review. 5
The examiner field in PAIR had a number of typographical errors and variations in the
spelling or formatting of names, complicating efforts to perform the above matches. To
overcome this difficulty, we utilized the reclink Stata module, a “fuzzy” matching
program designed to deal with variations in names over time (e.g., inclusions of full
middle names versus middle initials, name changes upon marriage, etc.). Having
performed this match, we then ensured the creation of a stable set of examiner field
effects. All told, our analytical file contained roughly 9,000 examiners.
In Columns 1 of Table A1, we set forth the percentage of applications in our sample that
are disposed of by examiners in each of the relevant GS‐levels and experience groups.
Examiners spend considerably more time in higher GS ranges, especially GS‐level 14,
thus accounting for the higher percentage of applications associated with high GS‐level
examiners. Also contributing to the relatively weaker presence of GS‐levels 7 and 9 in
the data is the fact that many examiners (nearly 1/3 of new examiners) begin at GS‐level
11. In Column 2, we further illuminate this breakdown by taking all of the examiner
rosters over the 2002–2012 period and indicating what percentage of these total
examiner years were represented by examiners in the various GS‐level and experience
categories. For the reasons just discussed, this representation also tends to be
weighted near the higher GS ranges.
Finally, we exclude those few applications—roughly 3 percent of the raw sample—
examined by individuals at GS‐15 given uncertainty over the examination time allocated
to those reaching this final, largely supervisory level from our sample. Published time
allocation schedules suggest that GS‐15 examiners should receive 67 or 71 percent of
the time extended to their GS‐12 counterparts. However, the specific time allocation
amounts that we received from the PTO for each GS‐15 examiner in our sample differ
markedly and erratically from this generally published schedule.6 In any event, as
5 There were slight inconsistencies in the treatment of within-year promotions between the examiner roster data employed above and the secondary roster of GS-13 examiners we received pursuant to our second FOIA request. That is, many of those examiners receiving this within-GS-13 promotion were registered as doing so during the year in which our primary roster indicated that they ascended to GS-level 14. We give priority to the timings of promotions set forth in this secondary data source. 6 Hoping that the difference in time allotments to GS-15 examiners would provide another within-GS-level degree of variation, we filed an additional FOIA request with the PTO asking for the specific examination-time allotments associated with each GS-15 examiner, for each year from

6
demonstrated by this Online Appendix, our results are robust to likewise tracking
changes in grant rates upon the ascension to GS‐15.
TABLE A1: REPRESENTATION OF GS-LEVEL AND EXPERIENCE GROUPS
(1) (2)
GS-level & Experience Group
Percentage of Applications Disposed of by Examiner in
Indicated Group (%)
Percentage of Total Examiner Years
Spent in Indicated Group Between
2002 and 2012 (%)
GS-7 1.8 5.0 GS-9 5.7 9.9
GS-11 9.9 12.2 GS-12 15.4 15.2 GS-13 19.7 17.2
GS-13, partial signatory 13.5 10.3 GS-14 33.9 30.2
0-1 Years 10.5 19.8 2-3 Years 18.8 19.2 4-5 Years 20.0 15.8 6-7 Years 16.2 11.6 8-9 Years 13.4 7.6
10-11 Years 10.2 8.5 12-13 Years 6.4 6.7 14+ Years 4.2 10.8
On a final note, we exclude 2001 from our analytical sample, since the PAIR database
only began collecting application data for filings commencing in March of 2001, leaving
very few final dispositions of such applications in 2001 and thus leaving us with a weak
2002-2012. The provided data, however, list the majority of such GS-15 examiners as having the same amount of time allocated to GS-12 and GS-13 examiners, as opposed to the anticipated 67 percent and 71 percent values. In the Online Appendix, we estimate specifications that treat all GS-15 examiners alike under the assumption, as expected from their published schedule, that GS-15 examiners would receive even less time than their GS-14 counterparts. However, the uncertainties in the data received pursuant to this final FOIA request leaves us inclined to treat this as a supplementary exercise only.

7
ability to assess the determinants of granting decisions at such time (after all, patent
prosecution durations are generally longer than a year). Similarly, we note that only 0.2
percent of the original sample were examined by GS‐5 examiners. Given such a small
level of representation, we exclude these applications from the analysis, though again
we note that this exclusion is of little significance to our findings.
C. Ex‐Ante Investments in the PTO vs. Ex‐Post Investments in Litigation
Both the Patent Office and the courts are tasked with the job of applying the
patentability standards and assessing the validity of inventions seeking patent
protection. Some have proposed that investing greater resources at the Patent Office—
e.g., more examination hours—is less cost effective than simply allowing the courts to
correct the issuance of an invalid patent (Lemley, 2001). The present analysis affords us
an opportunity to provide some back‐of‐the‐envelope calculations that may illuminate
this ex‐ante / ex‐post debate. For these purposes, we compare the increase in
expenditures at the Patent Office associated with increasing examination hours by a
certain specified amount with the decrease in litigation expenses that may ensue from
such an investment as a result of the invalidation of weak patents at the Patent Office
(as opposed to letting them issue at the Patent Office and be challenged at the courts).
To guide this discussion, consider the simulation contemplated in the paper: giving all
patent examiners the same amount of examination time extended to GS‐7 examiners.
Based on the results from Table 3 and the numbers provided in Table A1 and assuming
300,000 application disposals per year, we predict that an expansion in hours of this
nature would lead to roughly 40,000 fewer patents being issued each year. Based on
the calculations in Table A2, we predict that this expansion in hours will cost the Patent
Office roughly $130 million in additional salary expenses.
How much litigation expense will this investment in additional hours subsequently save
in return? The results of our main exercises (as supported by the marginal quality
analysis set forth in Table 4) may suggest that the additional patents being issued on the
margin as a result of binding time constraints may be of questionable validity. To the
extent that these marginal patents continue to be issued under current time allotments,
they may indeed generate additional litigation expenses to the extent that their
questionable validity invites legal challenge. Hence, it is possible that such expenses can
be avoided to the extent that such patents are not issued by the Patent Office in the
first place. It is of course unfounded to assume that all litigation can be circumvented
by investing more at the Patent Office (or to assume, in the first place, that the litigation

8
system is able to effectively target the marginal patents in question). The presence and
extent of any litigation consequences are empirical questions.
To confront these questions, we have collected information on the litigation outcomes
associated with the applications considered in our sample using data obtained from the
Lex Machina database. Primarily, for each individual application, we have collected
information on the number of times any patent resulting from that application has been
asserted in litigation. With this information, we estimate specifications allowing us to
determine the relationship between the grade level of the examiner and the number of
times the relevant application is ultimately asserted at court. Increases in grade levels
may lead to more litigation in two ways: (1) somewhat mechanically, the greater
number of patents issued as a result of grade level changes (per the main analysis of the
paper) will lead to a greater probability of litigation to the extent that only issued
patents can be the subject of litigation in the first place and (2) to the extent that the
additional patents being issued on the margin as a result of the increased time pressures
are of more questionable validity, such marginal patents will invite greater legal
challenge. Since our goal is to understand how giving all examiners GS‐7 hours may lead
to a reduction in overall litigation (to match such gains against the extra payroll
expenditures calculated above), we attempt to capture both such mechanisms by
estimating the relationship between grade levels and mean numbers of patent cases
associated with the claimed inventions using the sample of applications as the base. In
alternative specifications (Columns 4‐6 of Table A3), we estimate this relationship using
only the sample of issued patents—similar to the JPO and EPO specifications in the
text—allowing us to target the second mechanism in particular (the marginal validity
component).7
Since patents are very rarely litigated (only 7,000 of the issued patents in our PAIR
sample were asserted over the time frame of our analysis) and since cases only
materialize a discrete number of times, we elect to approach this analysis from a count‐
based perspective and estimate negative binomial regressions of the number of times
an individual application is ever asserted at court on the grade level of the associated
patent examiner. With over a million observations and close to 9,000 examiners in our
sample, it is beyond our computational means to include examiner fixed effects in this
7 That is, considering that the number of issued patents increases with GS levels of the
examiners, if the mean number of future cases increases among the set of issued patents as GS
levels increase, it would tend to suggest that the patents being issued on the margin as a result
of GS‐level increases are generating greater litigation than the average patent issuance.

9
specification; nonetheless, we have included the following controls in an attempt to
capture most of the concerns that motivated the examiner fixed effects specifications
estimated throughout the paper: year fixed effects, examiner cohort fixed effects based
upon the first year of entry with the Patent Office, examiner experience group
dummies, examiner tenure group dummies based on total length of time with the
Patent Office, and technology fixed effects. As demonstrated elsewhere in this
Appendix, the inclusion of such controls in the grant rate specifications leads to results
that are nearly identical to examiner fixed effects specifications in that context.
We present the results of this exercise in Table A3. As predicted, we find that as the
grade levels associated with the underlying applications increase so does the mean
frequency by which such applications ultimately lead to litigation. Relative to when an
examiner was at GS‐7, applications reviewed by examiners at GS‐14 are litigated at a
roughly 107 percent higher rate (Column 3). The results from Columns 4‐6 likewise
suggest that these effects may indeed partially be a response to the second mechanism
identified above—that is, the results from Columns 4‐6 imply that those patents being
issued on the margin in connection with GS‐level changes are, as expected, more likely
to be asserted in court relative to the average issued patent.
With these estimates, we then perform a simulation analysis in Table A4 similar to that
in A2 in which we predict the reduction in patent litigation expenses that may result
from giving all examiners the number of hours extended to GS‐7 examiners. For these
purposes we use information on the cost of patent litigation from the American
Intellectual Property Law Association (AIPLA), capturing costs associated with: outside
and local counsel; paralegal services; travel and living expenses; fees and costs for court
reporters, copies, couriers, exhibit preparation, analytical testing, expert witnesses, and
similar expenses. We stress that the estimated litigation costs savings presented here
are likely underestimates. Importantly, the litigation expenses used are one‐sided
only—that is, we are only using costs associated with defending a suit, thereby omitting
costs associated with the parties asserting the underlying patents (though we suggest
what the total savings would be assuming that plaintiff costs match those of the
defense). Further, the results are likely underestimates to the extent we are only using
costs associated with bringing cases to the end of the discovery stage of trial. Those
cases that see trials through to judgments naturally garner much greater expenses. The
AIPLA data reports costs separately for cases in with different degrees of money in
controversy: less than a $1 million, $1 to $10 million, $10 to $25 million and over $25
million. As Table A4 presents, even when we take the most conservative approach here,
the amount of money saved through future litigation by giving all examiners GS‐7 hours

10
($161 million) is greater that the additional payroll expenses calculated in Table A3. The
net savings are likely to be even greater when we account for the fact that many cases
fall into different bins of the amount in controversy and when we account for the
litigation costs associated with asserting litigation (see Column 5 of Table A4) and for
the fact that some cases proceed beyond discovery. Moreover, this simple back‐of‐the‐
envelope comparison is just focusing on direct costs: payroll expenses at the Patent
Office versus litigation expenses down the road. The net benefits of eliminating more
invalid patents early in the process by investing more resources at the Patent Office are
likely to be even larger should one quantify the additional social benefits that might
come from such developments—e.g., the avoidance of impediments to cumulative
innovation in the period of time prior to when a court may have invalidated the invalid
patent anyway.
TABLE A2: SIMULATED INCREASE IN PAYROLL EXPENSES ASSOCIATED WITH GIVING
ALL EXAMINERS THE NUMBER OF HOURS ALLOCATED TO GS-7 EXAMINERS FOR ONE
YEAR OF APPLICATIONS
(1) (2) (3) (4) (5)
GS-level
Number of Annual
Dispositions by Examiners
Mean Number of Hours Assigned
Extra Hours
Needed to Give GS-7 Hours
Examiner Pay Per
Hour
Extra Costs to Giving GS-
7 Hours
GS-7 5,400 27.54 0 18.82 0 GS-9 17,100 23.91 62,073 23.02 $1,428,920
GS-11 29,700 21.28 185,922 27.86 $5,179,787 GS-12 46,200 19.20 385,308 33.39 $12,865,434 GS-13 59,100 16.66 643,008 39.70 $25,527,418
GS-13, partial signatory
40,500 15.46 489,240 39.70 $19,422,828
GS-14 101,700 14.09 1,367,865 46.92 $64,180,226 Total 300,000 - 3,133,416 $128,604,613
Notes: This table assumes that the Patent Office disposes of 300,000 applications each year (where each request for a continued examination—RCE—does not constitute a new disposal). This amount is consistent with the most recent information available on the Patent Office’s current aggregate disposal counts. The distribution of dispositions per grade levels follows Table A1. The mean number of hours per grade is calculated over the whole PAIR sample after assigning hour allotments to each application in the PAIR database based on the associated patent class and examiner grade level. The examiner pay per hour assumes that the examiner is at Step 5 within the relevant grade and is based on the 2015 payscale.
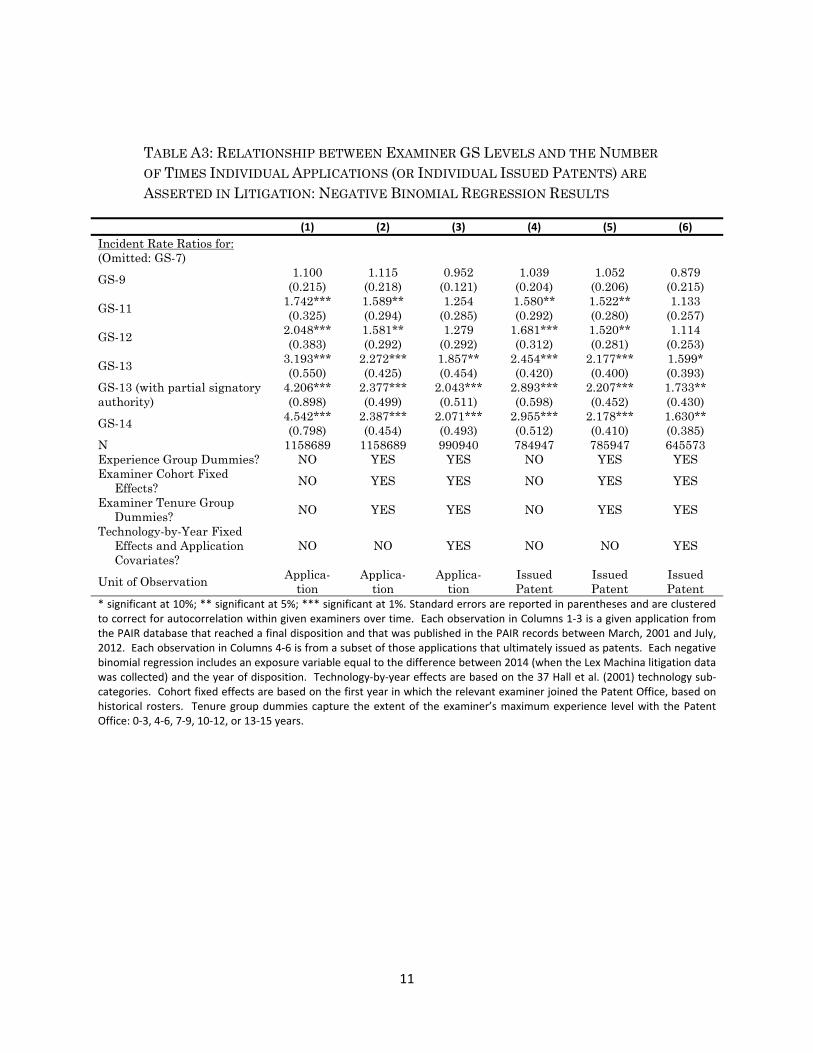
11
TABLE A3: RELATIONSHIP BETWEEN EXAMINER GS LEVELS AND THE NUMBER
OF TIMES INDIVIDUAL APPLICATIONS (OR INDIVIDUAL ISSUED PATENTS) ARE
ASSERTED IN LITIGATION: NEGATIVE BINOMIAL REGRESSION RESULTS
(1) (2) (3) (4) (5) (6)
Incident Rate Ratios for: (Omitted: GS-7)
GS-9 1.100 (0.215)
1.115 (0.218)
0.952 (0.121)
1.039 (0.204)
1.052 (0.206)
0.879 (0.215)
GS-11 1.742*** (0.325)
1.589** (0.294)
1.254 (0.285)
1.580** (0.292)
1.522** (0.280)
1.133 (0.257)
GS-12 2.048*** (0.383)
1.581** (0.292)
1.279 (0.292)
1.681*** (0.312)
1.520** (0.281)
1.114 (0.253)
GS-13 3.193*** (0.550)
2.272*** (0.425)
1.857** (0.454)
2.454*** (0.420)
2.177*** (0.400)
1.599* (0.393)
GS-13 (with partial signatory authority)
4.206*** (0.898)
2.377*** (0.499)
2.043*** (0.511)
2.893*** (0.598)
2.207*** (0.452)
1.733** (0.430)
GS-14 4.542*** (0.798)
2.387*** (0.454)
2.071*** (0.493)
2.955*** (0.512)
2.178*** (0.410)
1.630** (0.385)
N 1158689 1158689 990940 784947 785947 645573 Experience Group Dummies? NO YES YES NO YES YES Examiner Cohort Fixed Effects?
NO YES YES NO YES YES
Examiner Tenure Group Dummies? NO YES YES NO YES YES
Technology-by-Year Fixed Effects and Application Covariates?
NO NO YES NO NO YES
Unit of Observation Applica-tion
Applica-tion
Applica-tion
Issued Patent
Issued Patent
Issued Patent
* significant at 10%; ** significant at 5%; *** significant at 1%. Standard errors are reported in parentheses and are clustered to correct for autocorrelation within given examiners over time. Each observation in Columns 1‐3 is a given application from the PAIR database that reached a final disposition and that was published in the PAIR records between March, 2001 and July, 2012. Each observation in Columns 4‐6 is from a subset of those applications that ultimately issued as patents. Each negative binomial regression includes an exposure variable equal to the difference between 2014 (when the Lex Machina litigation data was collected) and the year of disposition. Technology‐by‐year effects are based on the 37 Hall et al. (2001) technology sub‐categories. Cohort fixed effects are based on the first year in which the relevant examiner joined the Patent Office, based on historical rosters. Tenure group dummies capture the extent of the examiner’s maximum experience level with the Patent Office: 0‐3, 4‐6, 7‐9, 10‐12, or 13‐15 years.

12
TABLE A4: SIMULATED REDUCTION IN LITIGATION EXPENSES ASSOCIATED WITH GIVING
ALL EXAMINERS THE NUMBER OF HOURS ALLOCATED TO GS-7 EXAMINERS FOR ONE
YEAR OF APPLICATIONS (ASSUMING CASES END IN DISCOVERY AND AMOUNTS IN
CONTROVERSY < $1 MM)
(1) (2) (3) (4) (5)
Decrease (Increase) in
Future Litigation
Costs:
GS-level
Number of Annual
Dispositions by
Examiners
Decrease in Number of
Patent Cases per
Application
Decrease (Increase) in
Future Number of
Application-Case Pairs
Defense Costs Only
Defense and Plaintiff
Costs (Assuming
Equal)
GS-7 5,400 0 0 0 0 GS-9 17,100 (0.0002) (2.662) ($522,560) ($1,045,120)
GS-11 29,700 0.0008 24.467 $4,802,743 $9,605,486 GS-12 46,200 0.0009 41.805 $8,206,262 $16,412,524 GS-13 59,100 0.0028 164.269 $32,245,382 $64,490,764 GS-13, partial signato
ry
40,500 0.0034 137.002 $26,892,957 $53,785,914
GS-14 101,700 0.0035 353.263 $69,344,121 $138,688,242 Total 300,000 - 718.144 $160,597,488 $321,194,976
Notes: This table assumes that the Patent Office disposes of 300,000 applications each year (where each request for a continued examination—RCE—does not constitute a new disposal). This amount if consistent with the most recent information available on the Patent Office’s current aggregate disposal counts. The distribution of dispositions per grade levels follows Table A1. Figures in Column 2 are derived from the incident rate ratio results from Table A3 and account for the mean number of cases per application among GS-7 examiners. Litigation expense information is from the 2013 Annual Survey of the American Intellectual Property Law Association (AIPLA). Results from Columns 2 and 3 determine the reduction in application-case pairs, as distinct from the number of cases themselves, considering that patent cases generally have multiple patents at issue in each case. Litigation costs from the AIPLA, which are reported on a per case basis, are thus scaled by the mean number of patents per case (2.37), which we obtained from Ashtor et al. (2014).

13
D. Examiner Experience Analysis
.TABLE A5. RELATIONSHIP BETWEEN GRANT RATES AND EXPERIENCE LEVELS OF THE ASSOCIATED PATENT EXAMINER, INCLUDING YEAR EFFECTS, COHORT
EFFECTS AND TENURE EFFECTS
(1) (2) (3) (4) (5)
Omitted: 0-1 Years Experience
2-3 Years Experience 0.120*** (0.005)
0.124*** (0.006)
0.094*** (0.006)
0.090*** (0.005)
0.073*** (0.004)
4-5 Years Experience 0.187*** (0.006)
0.185*** (0.007)
0.119*** (0.009)
0.102*** (0.007)
0.077*** (0.006)
6-7 Years Experience 0.247*** (0.006)
0.233*** (0.009)
0.135*** (0.014)
0.100*** (0.009)
0.072*** (0.007)
8-9 Years Experience 0.281*** (0.007)
0.264*** (0.010)
0.136*** (0.019)
0.088*** (0.012)
0.057*** (0.009)
10-11 Years Experience
0.306*** (0.007)
0.292*** (0.012)
0.135*** (0.024)
0.079*** (0.015)
0.045*** (0.010)
12-13 Years Experience
0.324*** (0.008)
0.316*** (0.014)
0.124*** (0.030)
0.061*** (0.019)
0.027** (0.012)
14+ Years Experience 0.335*** (0.011)
0.344*** (0.017)
0.107*** (0.037)
0.033 (0.024)
-0.001 (0.015)
N 1170869 1170869 1170869 1158689 1158689 Year Fixed Effects? (Year of Disposition)
YES YES YES YES YES
Examination Tenure (Max Experience) Group Dummies?
NO YES YES YES NO
Examiner Cohort Dummies? (First Year at Patent Office)
NO NO YES YES NO
Examiner GS Level Dummies? NO NO NO YES YES
Examiner Fixed Effects? NO NO NO NO YES
* significant at 10%; ** significant at 5%; *** significant at 1%. Standard errors are reported in parentheses and are clustered to correct for autocorrelation within given examiners over time. Each observation is a given application from the PAIR database that reached a final disposition and that was published in the PAIR records between March, 2001 and July, 2012. Examiner tenure effects are organized in the following groups: 0‐3 years, 4‐ 6 years, 7‐10 years, 11‐13 years, or 14‐15 years.
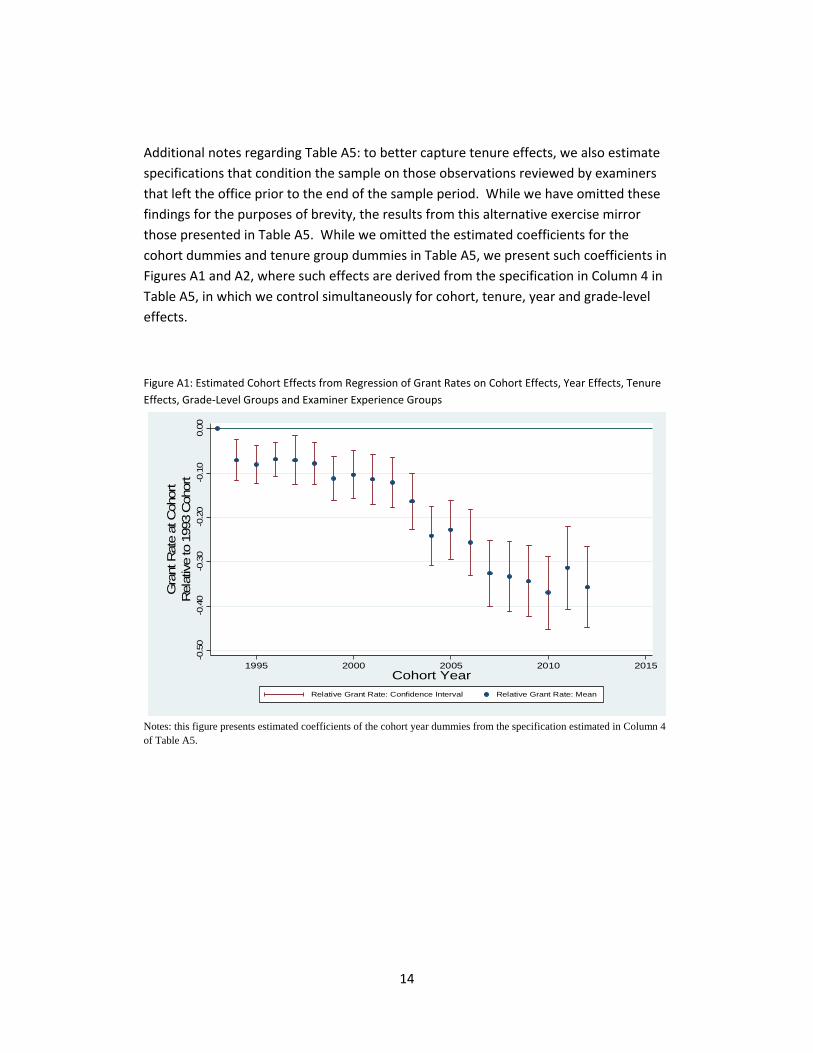
14
Additional notes regarding Table A5: to better capture tenure effects, we also estimate
specifications that condition the sample on those observations reviewed by examiners
that left the office prior to the end of the sample period. While we have omitted these
findings for the purposes of brevity, the results from this alternative exercise mirror
those presented in Table A5. While we omitted the estimated coefficients for the
cohort dummies and tenure group dummies in Table A5, we present such coefficients in
Figures A1 and A2, where such effects are derived from the specification in Column 4 in
Table A5, in which we control simultaneously for cohort, tenure, year and grade‐level
effects.
Figure A1: Estimated Cohort Effects from Regression of Grant Rates on Cohort Effects, Year Effects, Tenure
Effects, Grade‐Level Groups and Examiner Experience Groups
Notes: this figure presents estimated coefficients of the cohort year dummies from the specification estimated in Column 4 of Table A5.
-0.5
0-0
.40
-0.3
0-0
.20
-0.1
00.0
0
Gra
nt R
ate
at C
ohor
tR
elat
ive
to 1
993
Coh
ort
1995 2000 2005 2010 2015Cohort Year
Relative Grant Rate: Confidence Interval Relative Grant Rate: Mean

15
Figure A2: Estimated Tenure Effects from Regression of Grant Rates on Cohort Effects, Year Effects, Tenure
Effects, Grade‐Level Groups and Examiner Experience Groups
Notes: this figure presents estimated coefficients of the tenure group dummies from the specification estimated in Column 4 of Table A5.
-0.0
6-0
.04
-0.0
20.0
00.0
20.0
4
Gra
nt R
ate
at T
enure
Gro
upR
elat
ive
to 0
-3 Y
ear Ten
ure
Gro
up
0-3 Years 4-6 Years 7-9 Years 10-12 Years 13-15 Years 16+ YearsTenure Group (Total Years of Experience)
Relative Grant Rate: Confidence Interval Relative Grant Rate: Mean

16
E. Additional Robustness Checks
Examination Duration Imbalance. Given that we only observe applications filed after
March 2001, one may also be concerned that applications reaching a final disposition in
the early years in the sample will be disproportionately comprised of quicker moving
applications, whereas those observed in the later years in the sample represent a richer
mix of quick‐ and slow‐moving applications. This may be of consequence considering
that prosecution durations may impact grant rates due to the higher likelihood of
applicants abandoning their applications during long durations. However, an increased
incidence of longer‐duration prosecution periods later in the sample does not
necessarily confound the above analysis considering (1) the imposition of year fixed
effects to capture any general trends in granting practices over the sample, (2) that we
observe overlapping cohorts of examiners, in which event examiners are moving among
each of the various grade (and experience) levels during every year of the sample and
(3) that controls are available for the time between filing and disposition of each
application. Nonetheless, to more comprehensively address any inconsistency in the set
of applications under investigation, we also estimate an alternative specification in
which we begin the period of observation in 2004 and confine the sample of
applications to those that are disposed of within a three‐year period. By focusing only
on applications of limited prosecution duration, we ensure consistency in the relative
mix of application durations observed.8 In Figure A3, we demonstrate that the above
results are likewise robust to this alternative sampling approach.
8 Of course, imposing this duration limitation forces us to exclude 2002 and 2003 as there will be few applications disposed of in these years that fall near the 3-year duration mark, despite the fact that we would observe more of such applications in the later sample years, which could otherwise undercut the balancing impulse of this exercise.

17
Figure A3: Relationship between Examiner GS‐Level and Grant Rates, Restricted
Duration‐Window Approach
Notes: this figure presents estimated coefficients of a regression of the incidence of the application being granted on a set of dummy variables capturing the incidence of the relevant examiner falling into each general schedule pay grade. This figure also includes year fixed effects and examiner fixed effects. The sample is limited to those applications that reach a disposition within three years from filing and that were filed in 2004 and beyond. Standard errors are clustered at the examiner level.
0.0
00.0
50.1
00.1
5G
rant
Rat
e at
Indi
cate
d G
rade
Rel
ativ
e to
GS-L
evel
7
GS-7 GS-9 GS-11 GS-12 GS-13 (1) GS-13 (2) GS-14Grade
Relative Grant Rate: Confidence Interval Relative Grant Rate: Mean

18
RCE Controls. As demonstrated by Figure A4, the results are also robust to the inclusion
of a control for the incidence of a request‐for‐continued examination (RCE) associated
with the application, which is a device used by applicants to continue the examination
process in the face of an examiner’s final rejection. Given the tendency of RCEs to
prolong the examination process, it is not surprising that the percentage of an
examiner’s dispositions that involve an RCE filing will grow with experience. With this in
mind, one may be concerned that grant rates may rise with experience and/or
promotions given the possibility that continuation devices such as RCE filings increase
the ultimate chances that the underlying application will be allowed. Alleviating this
concern, we find that the estimated pattern of results persists (though with slightly
smaller magnitudes) when controlling for the incidence of an RCE filing in the underlying
application and, alternatively, when conditioning the analysis on those applications
without an RCE filing. The results remain essentially unchanged with alternative
parameterizations of these RCE controls (available upon request), including those that
count the total number of RCEs employed (as distinct from the incidence of any RCE
presence) and those that include separate dummy variables capturing different bins of
RCE counts.
Figure A4: Relationship between Examiner GS‐Level and Grant Rates, Controlling for the
Incidence of a Request for Continued Examination
Notes: the specification underlying this figure replicates that of Figure 1, except that it includes a control for the incidence of the application undergoing at least one Request for Continued Examination.
0.0
00.0
50.1
00.1
5
Gra
nt R
ate
at In
dica
ted
Gra
de R
elat
ive
to G
S-L
evel
7
GS-7 GS-9 GS-11 GS-12 GS-13 (1) GS-13 (2) GS-14Grade
Relative Grant Rate: Confidence Interval Relative Grant Rate: Mean

19
Additional Robustness Checks on Specifications that Nest Experience Years within Grade
Levels
Figure A5: Relationship between Grant Rates and Experience Years within Distinct Grade Levels, Including
GS‐15
Notes: this figure replicates that of Figure 3 in the text except that it includes examiners at GS-15.
Figure A6: Relationship between Grant Rates and Experience Years within Distinct Grade Levels, Including GS‐15 and Conditional on Examiner Starting at least Below GS‐12 During Sample Window
Notes: this figure replicates that of Figure A5 except that it excludes examiners that start the sample period at GS-12 and higher (that is, it excludes those examiners whose pre-sample-period tenures within the relevant grade are unobservable). Within this restricted sample, there are no observations (and thus no reported results) for examiners in the 4th and 5th period groups within the second GS-13 category.
-0.10
-0.05
0.00
0.05
0.10
0.15
Gra
nt Rate
at In
dica
ted G
rade/
Exp
erie
nce
Gro
up
Relativ
e to
GS-L
evel 1
2 / 1
st Y
ear Gro
up
GS-12 GS-13 (1) GS-13(2) GS-14 GS-15Grade Level / Experience Group (2-Year Increments within each Level)
Relative Grant Rate: Confidence Interval Relative Grant Rate: Mean
-0.30
-0.20
-0.10
0.00
0.10
0.20
Gra
nt Rate
at In
dica
ted G
rade/
Exp
erie
nce
Gro
up
Relativ
e to
GS-L
evel 1
2 / 1
st Y
ear Gro
up
GS-12 GS-13 (1) GS-13(2) GS-14 GS-15Grade Level / Experience Group (2-Year Increments within each Level)
Relative Grant Rate: Confidence Interval Relative Grant Rate: Mean
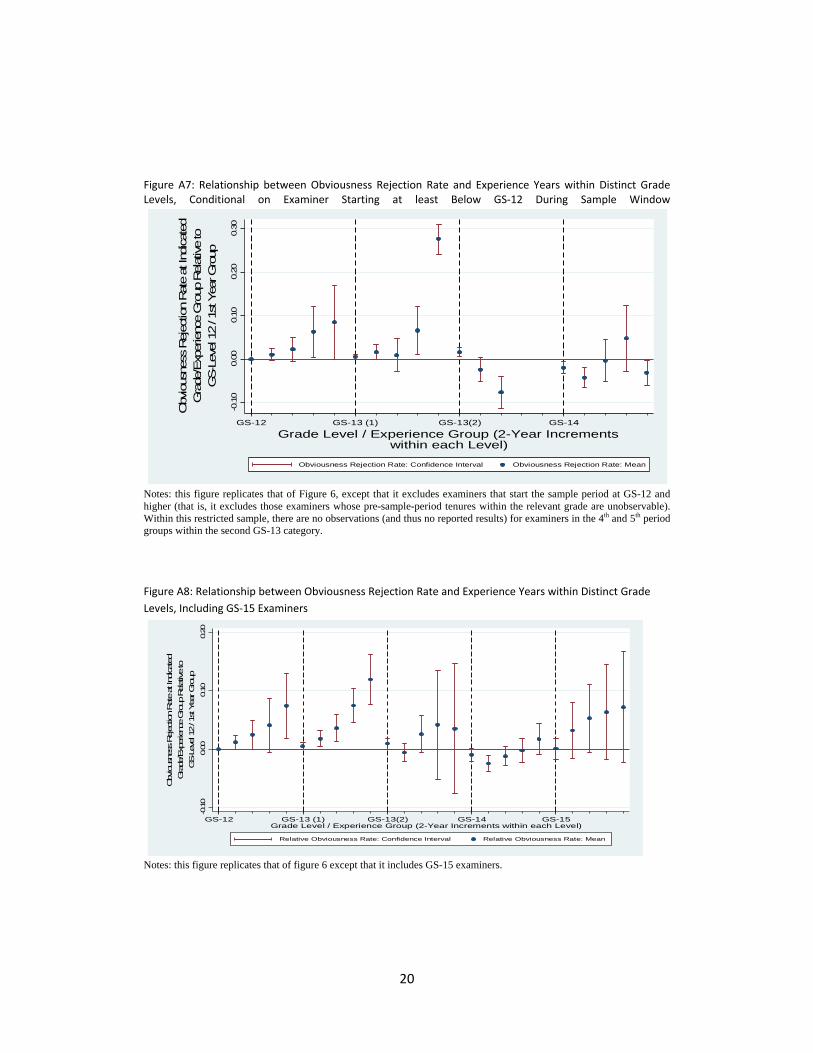
20
Figure A7: Relationship between Obviousness Rejection Rate and Experience Years within Distinct Grade Levels, Conditional on Examiner Starting at least Below GS‐12 During Sample Window
Notes: this figure replicates that of Figure 6, except that it excludes examiners that start the sample period at GS-12 and higher (that is, it excludes those examiners whose pre-sample-period tenures within the relevant grade are unobservable). Within this restricted sample, there are no observations (and thus no reported results) for examiners in the 4th and 5th period groups within the second GS-13 category.
Figure A8: Relationship between Obviousness Rejection Rate and Experience Years within Distinct Grade
Levels, Including GS‐15 Examiners
Notes: this figure replicates that of figure 6 except that it includes GS-15 examiners.
-0.1
00.0
00.1
00.2
00.3
0
Obv
ious
ness
Rej
ectio
n Rat
e at
Indi
cate
dG
rade
/Exp
erienc
e G
roup
Relat
ive
toG
S-L
evel
12
/ 1st Y
ear G
roup
GS-12 GS-13 (1) GS-13(2) GS-14
Grade Level / Experience Group (2-Year Incrementswithin each Level)
Obviousness Rejection Rate: Confidence Interval Obviousness Rejection Rate: Mean
-0.10
0.00
0.10
0.20
Obvious
ness
Rejection R
ate at Ind
icated
Gra
de/Exp
erie
nce Gro
up R
elativ
e to
GS-L
evel 12 / 1st Y
ear Gro
up
GS-12 GS-13 (1) GS-13(2) GS-14 GS-15Grade Level / Experience Group (2-Year Increments within each Level)
Relative Obviousness Rate: Confidence Interval Relative Obviousness Rate: Mean

21
Figure A9: Relationship between Obviousness Rejection Rate and Experience Years within Distinct Grade
Levels, Including GS‐15 and Conditional on Examiner Starting at least Below GS‐12 During Sample Window
Notes: this figure replicates that of Figure A8, except that it excludes examiners that start the sample period at GS-12 and higher (that is, it excludes those examiners whose pre-sample-period tenures within the relevant grade are unobservable). Within this restricted sample, there are no observations (and thus no reported results) for examiners in the 4th and 5th period groups within the second GS-13 category.
-0.20
0.00
0.20
0.40
0.60
Obvious
ness
Rejection R
ate
at Ind
icate
d
Gra
de/
Exp
erie
nce
Gro
up R
elativ
e to
GS-L
evel 1
2 / 1
st Y
ear Gro
up
GS-12 GS-13 (1) GS-13(2) GS-14 GS-15Grade Level / Experience Group (2-Year Increments within each Level)
Relative Obviousness Rate: Confidence Interval Relative Obviousness Rate: Mean

22
Graphs of Relationship between Each Rejection Type and GS‐Level
Figure A10: Relationship between Incidence of each of Section 101, Section 102, Section 103 and Section 112 Rejections and Examiner GS‐Level (Percentage Results)
Notes: each line represents the estimated mean coefficients of a separate regression of the incidence of the indicated rejection type on set of dummy variables capturing the incidence of the relevant examiner falling into each general schedule pay grade. Coefficients are scaled by the mean incidence of each rejection type to facilitate an interpretation of this trend in percentage terms. This figure also includes year fixed effects and examiner fixed effects.
Figure A11: Relationship between Incidence of each of Section 101, Section 102, Section 103 and Section 112 Rejections and Examiner GS‐Level (Percentage Results), Controlling for Application Characteristics and Technology‐by‐Year Fixed Effects
Notes: this figure replicates that of Figure A10, but it includes controls for application entity size, prosecution duration (and its square), and foreign priority, along with a full set of technology-by-year fixed effects.
0.1
.2.3
.4.5
Relev
ant R
ejec
tion
Rat
e at
Indica
ted
Gra
de R
elativ
e to
GS-L
evel 7
GS-7 GS-9 GS-11 GS-12 GS-13 (1) GS-13 (2) GS-14Grade
Section_101 Section_102
Section_112 Section_103
0.0
5.1
.15
.2.2
5
Releva
nt R
ejection R
ate
at I
ndicate
d Gra
de R
elat
ive
to G
S-L
evel 7
GS-7 GS-9 GS-11 GS-12 GS-13 (1) GS-13 (2) GS-14Grade
Section_101 Section_102
Section_112 Section_103
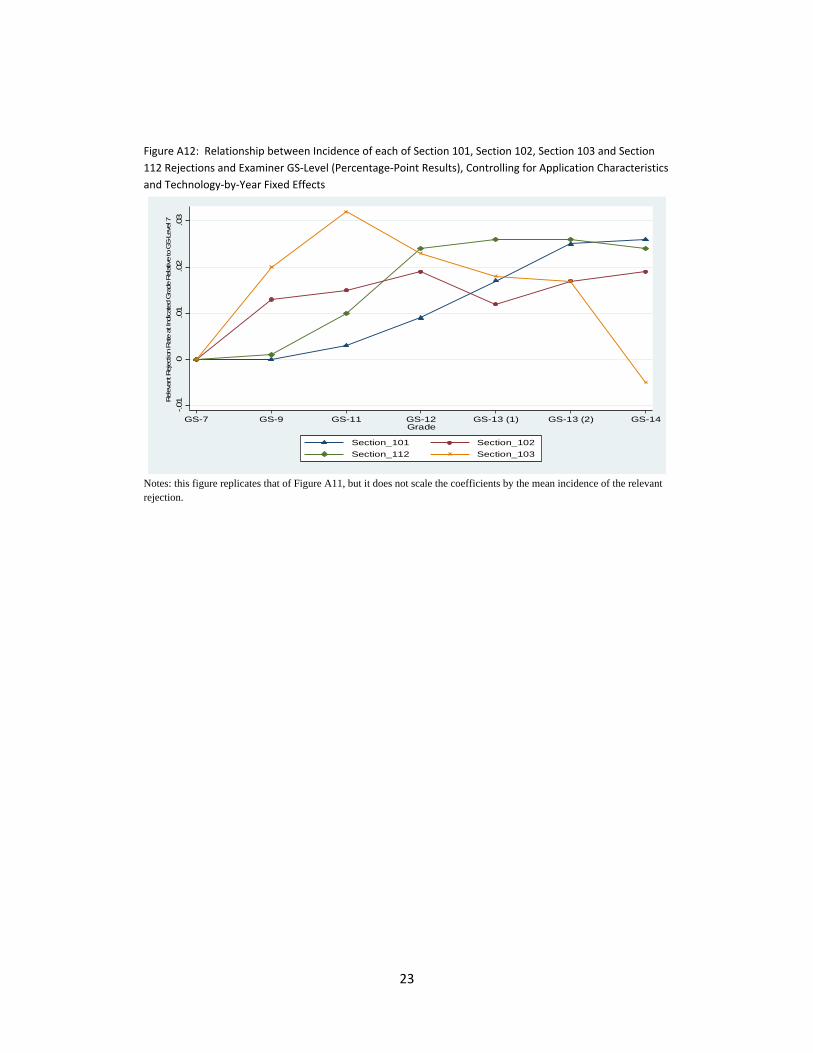
23
Figure A12: Relationship between Incidence of each of Section 101, Section 102, Section 103 and Section
112 Rejections and Examiner GS‐Level (Percentage‐Point Results), Controlling for Application Characteristics
and Technology‐by‐Year Fixed Effects
Notes: this figure replicates that of Figure A11, but it does not scale the coefficients by the mean incidence of the relevant rejection.
-.01
0.0
1.0
2.0
3
Rele
vant R
ejec
tion R
ate a
t Ind
icat
ed G
rade
Rel
ative to
GS-L
eve
l 7
GS-7 GS-9 GS-11 GS-12 GS-13 (1) GS-13 (2) GS-14Grade
Section_101 Section_102
Section_112 Section_103

24
Prior Art Citation Figures
Figure A13: Relationship between Number of Applicant‐Provided Citations in Final Patents (Logged) and
Examiner GS‐Level
Notes: this figure presents estimated coefficients of a regression of the number of applicant-provided citations (logged) on a set of dummy variables capturing the incidence of the relevant examiner falling into each general schedule pay grade. This figure also includes year fixed effects and examiner fixed effects. Standard errors are clustered at the examiner level.
Figure A14: Relationship between Number of Examiner‐Provided Citations in Final Patents (Logged) and
Examiner GS‐Level
Notes: this figure replicates that of Figure A13 except that the dependent variable is the number of examiner-provided citations (logged).
-0.10
0.00
0.10
0.20
0.30
Num
ber of A
pplic
ant
-Orig
inating
Prior
Art C
itatio
ns a
t Ind
icated G
rade
Relativ
e to
GS-L
evel 7
, Lo
gge
d
GS-7 GS-9 GS-11 GS-12 GS-13 (1) GS-13 (2) GS-14Grade
Relative Applicant Prior Art Citations: Confidence Interval Relative Applicant Prior Art Citations: Mean
-0.05
0.00
0.05
0.10
0.15
Number
of Exa
miner-Orig
inating
Prio
r Art C
itatio
ns at In
dicated
Gra
de
Relativ
e to
GS-L
evel 7
, Lo
gge
d
GS-7 GS-9 GS-11 GS-12 GS-13 (1) GS-13 (2) GS-14Grade
Relative Examiner Prior Art Citations: Confidence Interval Relative Examiner Prior Art Citations: Mean

25
Treatment of Examiners who Leave Agency and Return
We note that 5 percent of the examiners in our sample left the Agency at some point
only to return at a later point in time. With the possibility that this hiatus from the
Agency may disrupt the learning / interruption story hypothesized in the text, we
estimate alternative specifications that simply drop these examiners. The results are
virtually identical in this alternative specification (results available upon request from
the authors).
Balanced Sample Analysis (Cont’d)
Estimating balanced‐sample counterparts to Figure 3 (which follows examiners over the course of years within grade levels from GS‐12 to GS‐14) is tricky insofar as it is not possible to follow individual examiners over the entire course of many years set forth in the figure given that (1) we are only following examiners over a 10‐year period, as opposed to the longer period implicitly depicted in Figure 3 and (2) it is rare to find an examiner that stayed for a long period of time in every single grade. In Figure 4, we take a step in the direction of achieving better balance by focusing only on those examiners that at least stared the sample period prior to GS‐12. As such, Figure 4 avoids drawing information from examiners that start our sample in the middle of the hypothetical trajectory set forth in the figure. In Figure A15, we take this one step further and condition the analysis on those examiners that at least start prior to GS‐12 and that at least ascend to GS‐14 during our sample window. The pattern previously demonstrated of declines in grant rates over the temporal dimension to this graph and of jumps in grant rates upon promotion is generally maintained over this restricted sample.

26
Figure A15: Relationship between Grant Rate and Increases in Experience Years within Distinct Grade Levels, Conditional on Examiner Starting at least Below GS‐12 and Rising to GS‐14 During Sample Window
Notes: this figure replicates that of Figure 4, except that it further conditions the sample to those applications reviewed by examiners that are observed to rise all the way to GS-14 over the sample period. As stated in the text, one of the concerns with Figure 3 is that there are a limited number of examiners that stay at least 7 years within grades 12, 13 (without signatory authority) and 13 (with signatory authority) that it may be difficult to generalize from the experiences of these examiners to predict what would happen if we forced all examiners (including those that rise in the ranks quickly) to stay that long within each grade. What is more common, however, is that those who at least rise to GS‐14 will wind up staying at that level for many years. This motivates an alternative balanced sample approach. In Table A6, we focus on those examiners that (1) at least rise to GS‐14 from a lower grade during the sample period, (2) that at least stay at GS‐14 for 4 years during the sample period and (3) that at least took 4 years during the sample to rise to GS‐14. We then take an event‐study approach in which we estimate how their grant rate changes in the period approaching the jump to GS‐14 and the period following this promotion. Rather than only looking at the four years leading up to GS‐14 while staying within GS‐13 (with signatory authority)—among those who stay at GS‐13(2) that long—this alternative approach simply follows examiners over the four preceding years regardless of what pre‐GS‐14 grade they were in that time. Taking the former approach would simply be too restrictive to be of much generalized insight. Again, while it is very common for examiners to spend many years at GS‐14 once they reach that level (which we are trying to take advantage of with this balanced approach), there is much variation in how fast or slow they take to get to GS‐14 itself.
-0.1
00.0
00.1
00.2
0
Gra
nt R
ate
at In
dica
ted
Gra
de/E
xper
ienc
eG
roup
Rel
ative
to G
S-L
evel 1
2 / 1
st
Yea
r G
roup
GS-12 GS-13 (1) GS-13(2) GS-14
Grade Level / Experience Group (2-Year Incrementswithin each Level)
Relative Grant Rate: Confidence Interval Relative Grant Rate: Mean

27
Consistent with expectations and with Figure 3, we observe a distinct jump in the grant rates (relative to the grant rate in the preceding periods) upon the promotion to GS‐14. Though the lagged coefficients are statistically insignificant, the point estimates suggest a subsequent decline in grant rates thereafter, consistent with Figure 3. Note that The coefficient represented in each row represents the mean change in the grant rate as an examiner moves into the indicated time period relative to the grant rate prevailing in the prior time period (in other words, the coefficients should not be interpreted as the cumulative effect of the indicated time period relative to the omitted time period), where time is measured with reference to years prior to and subsequent to a GS‐14 promotion.
TABLE A6: EVENT STUDY ANALYSIS OF GRANT RATES IN THE YEARS
PRECEDING AND FOLLOWING THE PROMOTION TO GS-14
(1) (2)
(Omitted: 4+ Years Prior to GS-14 Promotion)
2-4 Years Prior to GS-14 Promotion -0.016** (0.006)
-0.010* (0.006)
0-2 Years Prior to GS-14 Promotion -0.005 (0.006)
-0.004 (0.006)
0-2 Years Following GS-14 Promotion 0.018*** (0.005)
0.018*** (0.005)
2-4 Years Following GS-14 Promotion -0.006 (0.005)
-0.007 (0.005)
4+ Years Following GS-14 Promotion -0.005 (0.007)
-0.009 (0.007)
N 145169 138811 Sample restriction: minimum years of observation of examiners prior to GS-14 promotion
4 4
Sample restriction: minimum years of observation of examiners following GS-14 promotion
4 4
Technology-by-Year Fixed Effects and Application Covariates? NO YES
* significant at 10%; ** significant at 5%; *** significant at 1%. Standard errors are reported in parentheses and are clustered to correct for autocorrelation within given examiners over time. The specification underlying this Table focuses on those applications reviewed by examiners that we observe being promoted to GS‐14 during the sample and that stay at GS‐14 for at least 4 years during the sample period. With this sample, we then regress the incidence of the application being granted on a series of lead and lag indicators for the timing of the associated examiners GS‐14 status (along with examiner and year fixed effects). The coefficient represented in each row represents the mean change in the grant rate as an examiner moves into the indicated time period relative to the grant rate prevailing in the prior time period, where time is measured with reference to years prior to and subsequent to a GS‐14 promotion.

28
Figure A16: Relationship between Grade Levels and Grant Rates by Technology
0.2
.4.6
GS-7 GS-9 GS-11 GS-12 GS-13 (1) GS-13 (2) GS-14Grade
Agriculture, Food, Textiles
0.0
5.1
.15
.2
GS-7 GS-9 GS-11 GS-12 GS-13 (1) GS-13 (2) GS-14Grade
Coating
0.1
.2.3
GS-7 GS-9 GS-11 GS-12 GS-13 (1) GS-13 (2) GS-14Grade
Gas-.
050
.05
.1
GS-7 GS-9 GS-11 GS-12 GS-13 (1) GS-13 (2) GS-14Grade
Organic Compounds
-.05
0.0
5.1
.15
.2
GS-7 GS-9 GS-11 GS-12 GS-13 (1) GS-13 (2) GS-14Grade
Resins
0.0
5.1
.15
GS-7 GS-9 GS-11 GS-12 GS-13 (1) GS-13 (2) GS-14Grade
Miscellaneous Chemical
0.0
5.1
.15
.2
GS-7 GS-9 GS-11 GS-12 GS-13 (1) GS-13 (2) GS-14Grade
Communications
0.0
5.1
.15
.2.2
5
GS-7 GS-9 GS-11 GS-12 GS-13 (1) GS-13 (2) GS-14Grade
Comp. Hardware & Software
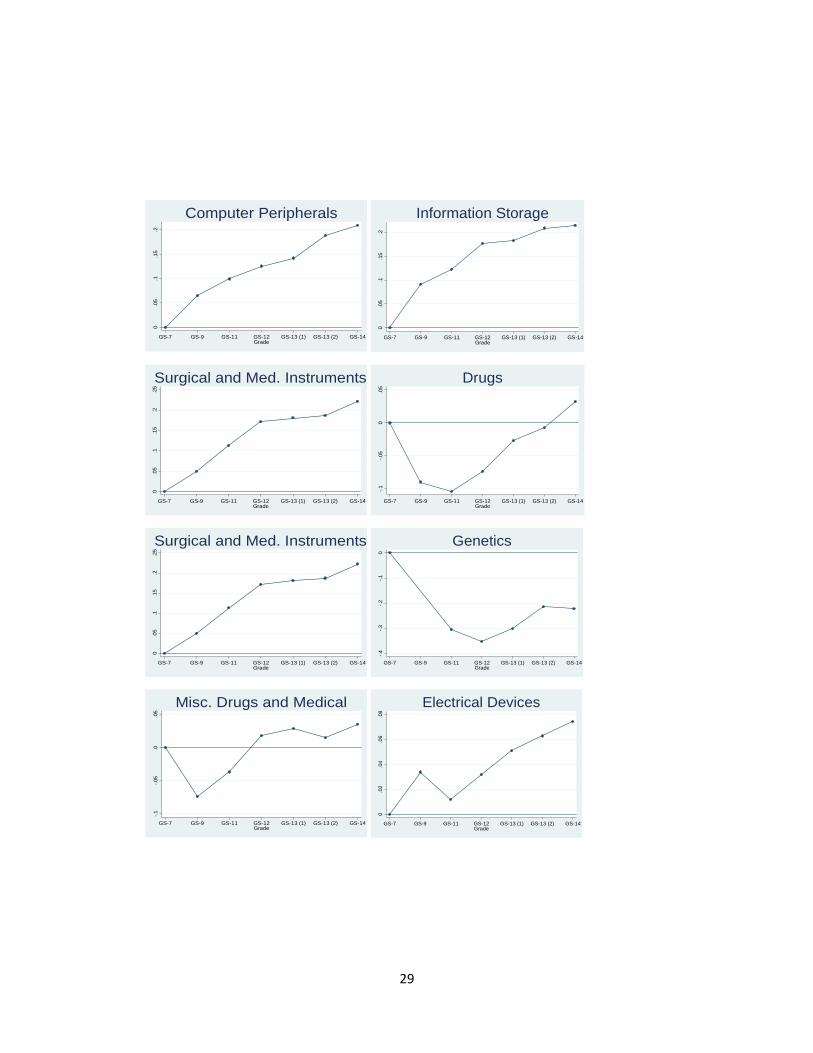
29
0.0
5.1
.15
.2
GS-7 GS-9 GS-11 GS-12 GS-13 (1) GS-13 (2) GS-14Grade
Computer Peripherals
0.0
5.1
.15
.2
GS-7 GS-9 GS-11 GS-12 GS-13 (1) GS-13 (2) GS-14Grade
Information Storage
0.0
5.1
.15
.2.2
5
GS-7 GS-9 GS-11 GS-12 GS-13 (1) GS-13 (2) GS-14Grade
Surgical and Med. Instruments-.
1-.
050
.05
GS-7 GS-9 GS-11 GS-12 GS-13 (1) GS-13 (2) GS-14Grade
Drugs
0.0
5.1
.15
.2.2
5
GS-7 GS-9 GS-11 GS-12 GS-13 (1) GS-13 (2) GS-14Grade
Surgical and Med. Instruments
-.4
-.3
-.2
-.1
0
GS-7 GS-9 GS-11 GS-12 GS-13 (1) GS-13 (2) GS-14Grade
Genetics
-.1
-.05
0.0
5
GS-7 GS-9 GS-11 GS-12 GS-13 (1) GS-13 (2) GS-14Grade
Misc. Drugs and Medical
0.0
2.0
4.0
6.0
8
GS-7 GS-9 GS-11 GS-12 GS-13 (1) GS-13 (2) GS-14Grade
Electrical Devices
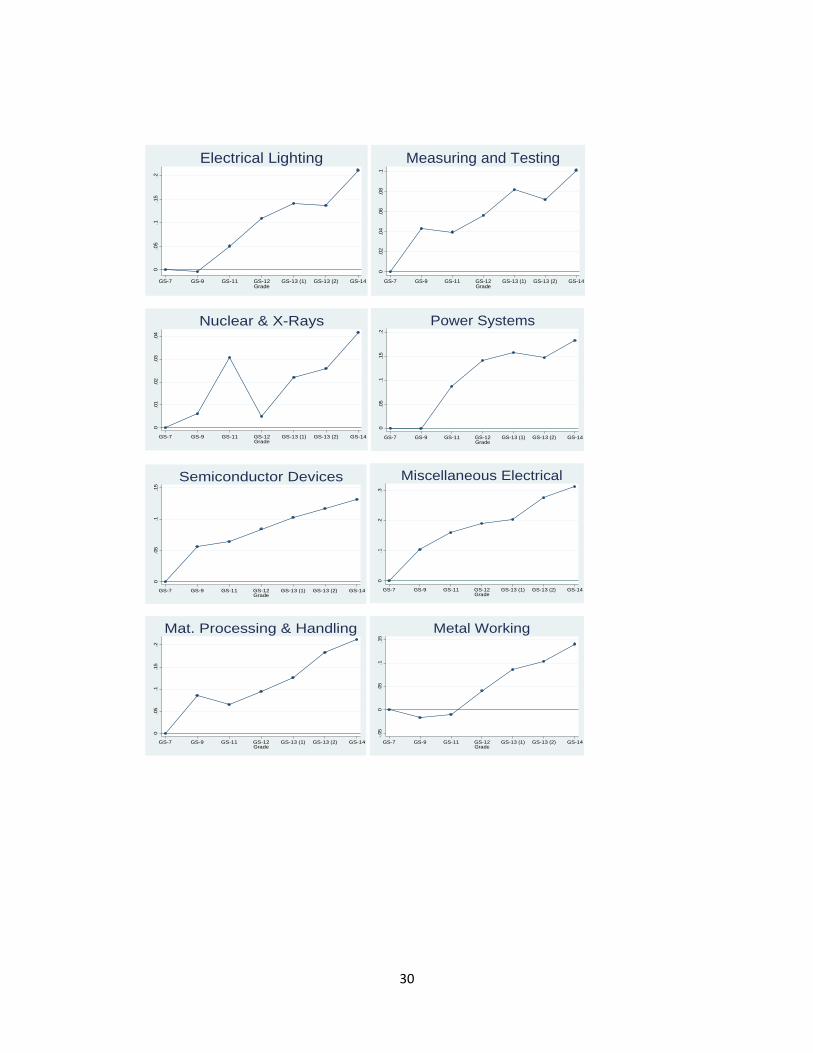
30
0.0
5.1
.15
.2
GS-7 GS-9 GS-11 GS-12 GS-13 (1) GS-13 (2) GS-14Grade
Electrical Lighting
0.0
2.0
4.0
6.0
8.1
GS-7 GS-9 GS-11 GS-12 GS-13 (1) GS-13 (2) GS-14Grade
Measuring and Testing0
.01
.02
.03
.04
GS-7 GS-9 GS-11 GS-12 GS-13 (1) GS-13 (2) GS-14Grade
Nuclear & X-Rays
0.0
5.1
.15
.2
GS-7 GS-9 GS-11 GS-12 GS-13 (1) GS-13 (2) GS-14Grade
Power Systems
0.0
5.1
.15
GS-7 GS-9 GS-11 GS-12 GS-13 (1) GS-13 (2) GS-14Grade
Semiconductor Devices
0.1
.2.3
GS-7 GS-9 GS-11 GS-12 GS-13 (1) GS-13 (2) GS-14Grade
Miscellaneous Electrical
0.0
5.1
.15
.2
GS-7 GS-9 GS-11 GS-12 GS-13 (1) GS-13 (2) GS-14Grade
Mat. Processing & Handling
-.05
0.0
5.1
.15
GS-7 GS-9 GS-11 GS-12 GS-13 (1) GS-13 (2) GS-14Grade
Metal Working

31
-.05
0.0
5.1
.15
GS-7 GS-9 GS-11 GS-12 GS-13 (1) GS-13 (2) GS-14Grade
Motor, Engines, Parts
0.0
5.1
.15
.2
GS-7 GS-9 GS-11 GS-12 GS-13 (1) GS-13 (2) GS-14Grade
Optics-.
2-.
15-.1
-.05
0
GS-7 GS-9 GS-11 GS-12 GS-13 (1) GS-13 (2) GS-14Grade
Transportation
-.1
-.05
0.0
5.1
GS-7 GS-9 GS-11 GS-12 GS-13 (1) GS-13 (2) GS-14Grade
Miscellaneous Mechanical
0.0
5.1
.15
GS-7 GS-9 GS-11 GS-12 GS-13 (1) GS-13 (2) GS-14Grade
Agriculture, Husbandry, Food
0.0
5.1
.15
.2.2
5
GS-7 GS-9 GS-11 GS-12 GS-13 (1) GS-13 (2) GS-14Grade
Amusement Devices
-.1
-.05
0.0
5.1
.15
GS-7 GS-9 GS-11 GS-12 GS-13 (1) GS-13 (2) GS-14Grade
Apparel and Textiles
0.0
5.1
.15
.2.2
5
GS-7 GS-9 GS-11 GS-12 GS-13 (1) GS-13 (2) GS-14Grade
Earth Working and Wells

32
Notes: each figure replicates that of Figure 1 except focusing separately on applications within the indicated
technology. Technology delineations follow the 37 Hall et al. (2001) sub-categories.
0.1
.2.3
GS-7 GS-9 GS-11 GS-12 GS-13 (1) GS-13 (2) GS-14Grade
Furniture and House Fixtures
0.0
5.1
.15
.2.2
5
GS-7 GS-9 GS-11 GS-12 GS-13 (1) GS-13 (2) GS-14Grade
Heating0
.1.2
.3
GS-7 GS-9 GS-11 GS-12 GS-13 (1) GS-13 (2) GS-14Grade
Pipes and Joints
-.05
0.0
5.1
.15
GS-7 GS-9 GS-11 GS-12 GS-13 (1) GS-13 (2) GS-14Grade
Receptacles
0.0
5.1
.15
.2
GS-7 GS-9 GS-11 GS-12 GS-13 (1) GS-13 (2) GS-14Grade
Miscellaneous Other

33
Hours-specific Interpretation of Results
TABLE A7. RELATIONSHIP BETWEEN GRANT RATES AND ALLOCATED EXAMINATION HOURS
(1) (3) (4) (5)
Allocated Examination Hours -0.0060*** (0.0004)
-0.0136*** (0.0006)
-0.0097*** (0.0006)
-0.0047*** (0.0005)
N 1158588 1158599 990889 990889 Examiner and Year Fixed Effects? YES YES YES YES
PTO Class Fixed Effects? NO YES YES NO Application Covariates? NO NO YES YES Technology-by-Year Fixed Effects? NO NO NO YES
* significant at 10%; ** significant at 5%; *** significant at 1%. Standard errors are reported in parentheses and are clustered to correct for autocorrelation within given examiners over time. Each observation is a given application from the PAIR database that reached a final disposition and that was published in the PAIR records between March, 2001 and July, 2012. Application covariates in this table include the incidence of a large entity applicant and the incidence of the filing of a Request for Continued Examination in connection with the application. Technology‐by‐year effects are based on the 37 Hall et al. (2001) technology sub‐categories. The allocated examination hours scheduled (which is a function of the PTO class of the application and the grade level of the examiner) was obtained from the PTO pursuant to a FOIA request.
Additional notes regarding Table A7: Time allotments are a function of both the grade
level of the examiner and the technology of the application. Table 3 in the text is meant
to capture fluctuations in one of these measures—that is, to capture the influence of
changing grade levels on grant rates. Of course, it is important in that initial analysis to
include technology dummies to account for the possibility that examiners will start
reviewing different technologies following promotions. Table 3 approaches this using
both fine‐grained dummies for each Patent Office Class and the more aggregated
technology subcategories (37 groups) delineated by Hall et al. (2001). In this hours
specification, we likewise endeavor to draw upon differences in grade levels of the
associated examiners to capture variation in examination hours, benefiting from the fact
that applications are randomly assigned across examiners of different grades.9 In the
case of the present table, however, it is arguably more critical to use the more fine‐
grained PTO classification on which hour‐allotments are based in order to isolate the
9 Any attempt to identify the effects of time allocation changes by drawing upon examiners switching across PTO Classes would be confounded by the difficulty in separating the time allocation effect and fixed differences in grant rates that may arise from technology effects more generally.

34
influence of promotions on time allotments (given the direct linking between PTO Class
and hour allotments). As such, the columns of greater interest here are Columns 2 and
3 which include PTO class dummies. The findings from these columns suggest that an
increase of one hour in the amount of time allocated to review an application is
associated with a 0.5 to 1.4 percentage point reduction in the grant rate. Considering a
mean hours allocation across the applications in the analytical sample of roughly 17
hours, these results suggest that a doubling of examination hours—a benchmark used
by Lemley (2001) to evaluate the merits of investing more in Patent Office examination
resources—would lead to a 9 to 24 percentage‐point decrease in the grant rate, or a
roughly 13 to 34 percent decline.
One concern with this approach is the linear treatment of any time allocation
effects. The main approaches taken in the paper, which specific the relationship
between grant rates and a series of grade level dummies, are more flexible and non‐
parametric in nature.
Treatment of Switching of Examiners during Applications.
The PAIR dataset, allows us to identify, for each application, the dates upon
which the application was docketed to an examiner, even if there are multiple docketing
events over the course of a single application. In over 70 percent of the applications
within this file, the records do not indicate any such docketing event after the period of
time in which the first office action on the merits has taken place. In other words, a
majority of time, the initial examiner sees the application through to its completion.
There is often more than one “docketing” record in the period prior to the completion
of the first office action, though our interviews with examiners suggest that these initial
recordings may capture a separate docketing with the Art Unit itself and then with the
ultimate examiner. To be clear, the fact that a minority of applications experience a
switch in examiners between the first office action and the final disposal of the
application is not overly problematic for our analysis. When an examiner takes over an
application from a prior examiner (e.g., upon their departure from the Agency), the new
examiner will still receive a “count” for bringing the application to its disposal.
Considering that examiners face expectations over how many counts to process in a
specified period of time, the new examiner is still subject to time pressures in
completing the task of reviewing the application in question. Importantly, the degree
of these time pressures will vary depending on the GS‐level of the examiner, which we
seek to capture in our specifications. Nonetheless, in Figure A17, we present results

35
from an alternative specification in which we focus only on those applications in which
there is no indication of an examiner replacement following the first office action.
Figure A17: Relationship between Examiner GS‐Level and Grant Rates, Excluding Applications with Examiner
Replacements
Notes: this figure replicates that of Figure 1 except that it focuses only on the 775,091 applications within our sample in which the examiner completing the first office action was the same examiner completing the disposition of the application.
Alternative Treatments of Time
The primary specifications capture the time at which the examiner reviews applications with reference to the time of disposition of the application in question. In the minority of cases in which the examiner producing the disposal differed from the examiner completing the first office action, this approach will ensure that we capture the time period in which the new examiner is exerting her efforts. For those situations in which the examiners stay with the same application to its completion, this approach will still ensure that we capture the period of time in which the examiner is exerting substantial effort on reviewing the application. In Figure A18, we take an alternative approach in which we set year fixed effects and merge examiner roster information with each application based on the time of the first office action. The pattern of results is robust to this alternative approach. Since times of first office action are naturally before times of disposition, this alternative approach may assign lower GS levels to some
0.00
0.05
0.10
0.15
Gra
nt R
ate at Indicated G
rade R
elativ
e to G
S-L
eve
l 7
GS-7 GS-9 GS-11 GS-12 GS-13 (1) GS-13 (2) GS-14Grade
Relative Grant Rate: Confidence Interval Relative Grant Rate: Mean

36
applications relative to the primary specifications—in those cases where the promotion occurs throughout the course of the application. As such, one might expect that this approach will attenuate any observed increases in grant rates upon promotion (relative to the primary results), to the extent that such promotions are not actually registered in the empirical specification. Consistent with these expectations, though the same pattern of results is observed with this alternative approach, the magnitude of the observed rise in grant rates upon GS-level changes is smaller in this alternative approach relative to the primary specifications. One can perhaps view these results as a lower bound estimate when these timing considerations in mind and the results presented in the text as upper bound estimates. We note that the full pattern of results—e.g., Figure 3—are likewise robust to this alternative timing (full results available upon request). We further note that, since we are merging examiner roster information to the PAIR database based on the moment of the first office action, the specification underlying this Figure focuses only on those applications in which the examiner completing the first office action is the same examiner producing the disposition, though the results are essentially identical when we make no such restriction. Finally, the results are also similar to Figure A18 when we assign time based on the moment of initial filing or initial docketing, even though such moments may be prior to the time when the examiner actually commences examination.

37
Figure A_18: Relationship between Examiner GS‐Levels and Grant Rates, Assigning Time Based on the
Moment of the First Office Action and Excluding Applications with Examiner Replacements
Notes: this figure replicates that of Figure 1 except that it assigns year effects and matches examiner roster information to the PAIR database based on the moment of completion of the first office action on the merits, while focusing only on the applications within our sample in which the examiner completing the first office action was the same examiner completing the disposition of the application.
0.0
00.0
50.1
0
Gra
nt R
ate
at In
dica
ted
Gra
de R
elat
ive
to G
S-L
evel
7
GS-7 GS-9 GS-11 GS-12 GS-13 (1) GS-13 (2) GS-14Grade
Relative Grant Rate: Confidence Interval Relative Grant Rate: Mean

38
Grant Rates of Fast vs. Slow Risers
A simple observation of Figure 1 may lead to an endogeneity concern that the Patent Office is simply extending promotions once a given examiner’s grant rates rise to a certain level. Figure 3 alleviates this concern by showing that grant rates are not increasing over time within each grade level. To take matters further, we also seek to explore the inherent granting tendencies of those who are promoted quickly within the Patent Office versus those who rise more slowly. For these purposes we focus on assessing promotion speed in the post-GS-11 range, where examiners began to spend more varied periods of time with each grade level. We look at those examiners that we can observe in our sample as starting below GS-12 and that rose to GS-14. We then group this set of examiners into different bins depending on how quickly it took them to rise from GS-12 to GS-14. Column 1 of Table A8 compares the overall mean grants observed across these groups over the sample period. The slow risers actually grant at substantially higher rates relative to the fast risers, easing the above-stated concern. In Columns 2, we rule out that this observation can otherwise be explained by general year trends in the data. In Columns 3 and 4, we add yet additional controls, including, among others, the GS-level of the examiners. Since the goal of this exercise is to capture the inherent granting differences across these groups, it may benefit to account for the year-by-year change in other factors that also explain observed granting behaviors—e.g., time allocations. The coefficients of the slow-rising category fall in magnitude as we add these additional controls, leaving us with statistically insignificant differences in grant rates across the various speed groups. Nonetheless, the point estimates continue to suggest that fast risers grant at lower rates relative to the slow risers. At the least, this exercise does not find strong evidence suggestive of a story in which examiners are promoted for having demonstrated elevated granting behaviors.

39
TABLE A8: RELATIONSHIP BETWEEN GRANT RATES AND SPEED BY WHICH EXAMINERS
ASCEND FROM GS-12 TO GS-14, AMONG EXAMINERS STARTING AT LEAST BELOW GS-12 AND RISING TO GS-14 DURING SAMPLE WINDOW
Speed in Rising from GS-
12 to GS-14 (1) (2) (3) (4)
Omitted Category: Fast Risers (Within 3 Years)
Slower Risers (4-7 Years) 0.014 (0.014)
0.021 (0.013)
0.018 (0.012)
0.009 (0.014)
Slowest Risers (8+ Years) 0.124*** (0.272)
0.116*** (0.027)
0.050* (0.027)
0.037 (0.029)
N 292020 292020 291333 291333 Year Effects? NO YES YES YES
GS-Level and Experience Effects?
NO NO YES YES
Cohort Effects and Tenure Effects (Total Years at
Agency)? NO NO NO YES
* significant at 10%; ** significant at 5%; *** significant at 1%. Standard errors are reported in parentheses and are clustered to correct for autocorrelation within given examiners over time.
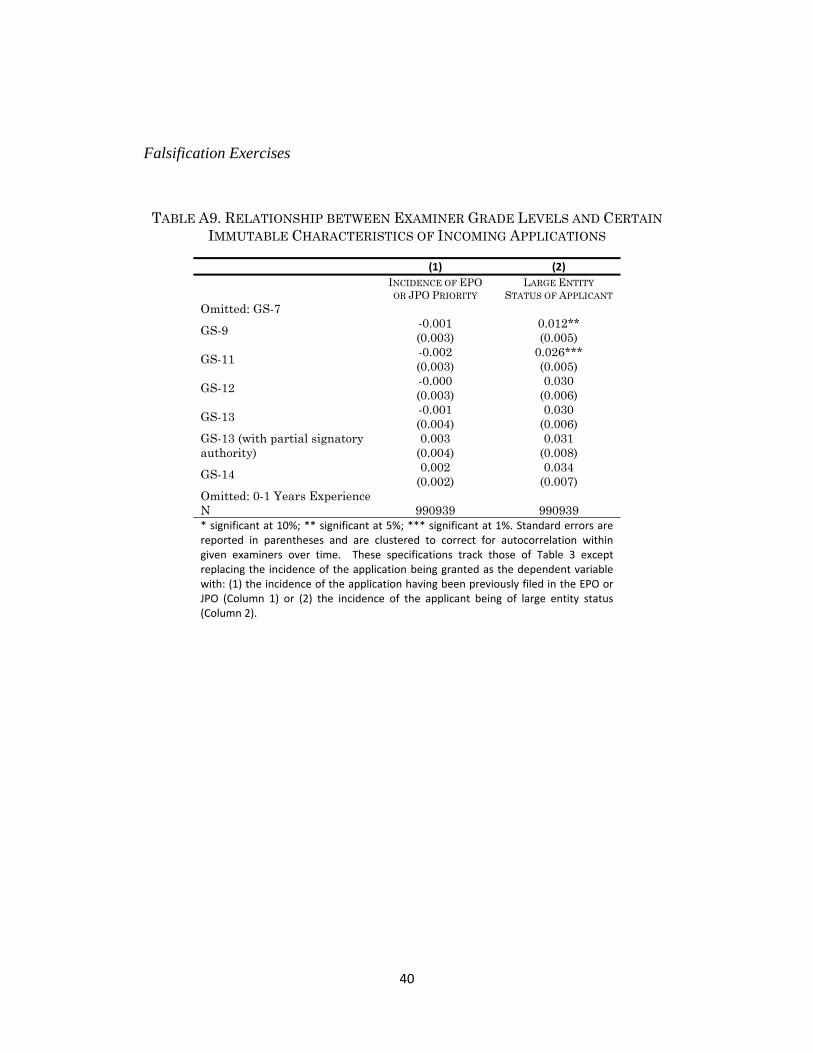
40
Falsification Exercises
TABLE A9. RELATIONSHIP BETWEEN EXAMINER GRADE LEVELS AND CERTAIN IMMUTABLE CHARACTERISTICS OF INCOMING APPLICATIONS
(1) (2)
INCIDENCE OF EPO OR JPO PRIORITY
LARGE ENTITY STATUS OF APPLICANT
Omitted: GS-7
GS-9 -0.001 (0.003)
0.012** (0.005)
GS-11 -0.002 (0.003)
0.026*** (0.005)
GS-12 -0.000 (0.003)
0.030 (0.006)
GS-13 -0.001 (0.004)
0.030 (0.006)
GS-13 (with partial signatory authority)
0.003 (0.004)
0.031 (0.008)
GS-14 0.002 (0.002)
0.034 (0.007)
Omitted: 0-1 Years Experience N 990939 990939 * significant at 10%; ** significant at 5%; *** significant at 1%. Standard errors are reported in parentheses and are clustered to correct for autocorrelation within given examiners over time. These specifications track those of Table 3 except replacing the incidence of the application being granted as the dependent variable with: (1) the incidence of the application having been previously filed in the EPO or JPO (Column 1) or (2) the incidence of the applicant being of large entity status (Column 2).
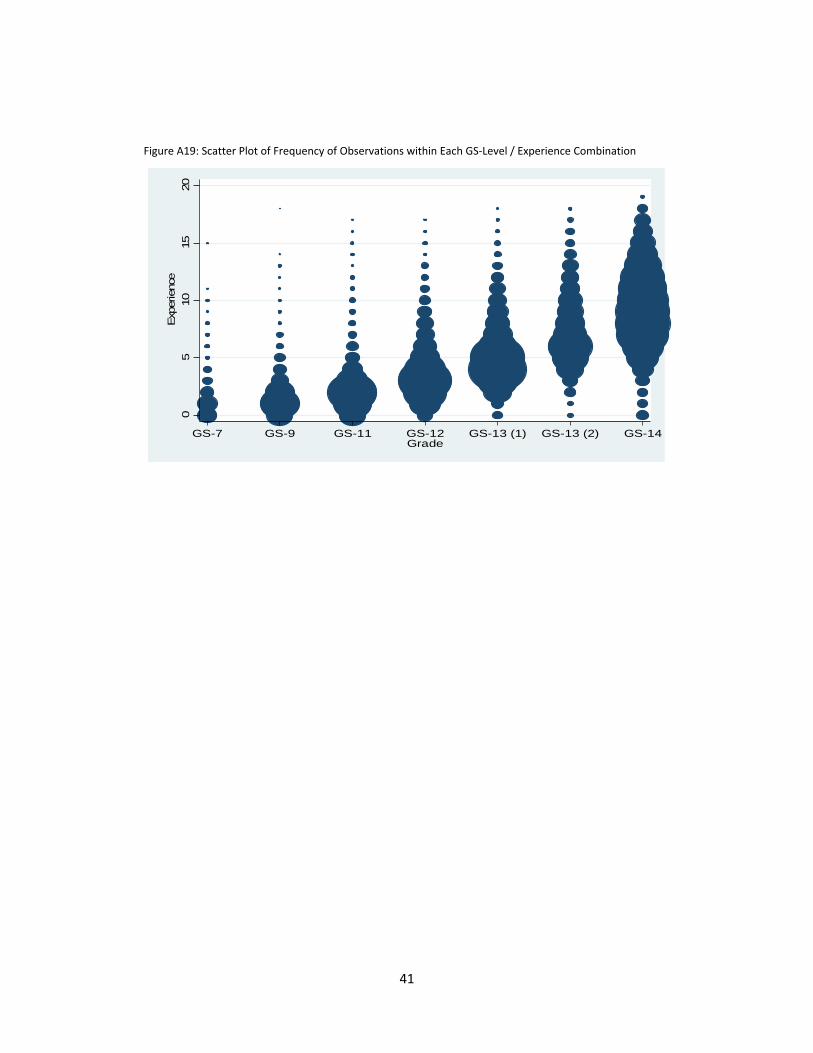
41
Figure A19: Scatter Plot of Frequency of Observations within Each GS‐Level / Experience Combination
05
10
15
20
Exp
erie
nce
GS-7 GS-9 GS-11 GS-12 GS-13 (1) GS-13 (2) GS-14Grade