is status quo bias explained by anchoring? evidence from ... · evguenia winschel, and philipp...
TRANSCRIPT
Is Status Quo Bias Explained by Anchoring?
Evidence from Survey Experiments ∗
Andreas Bernecker †
University of Mannheim
First Version: September 2011
This Version: March 31, 2014
Abstract
In a seminal paper, Samuelson and Zeckhauser (1988) have shown that people stick tothe status quo more frequently than predicted by standard economic theory and labeledthis phenomenon “status quo bias”. This paper uses large survey experiments withinthe classroom and the German Internet Panel (GIP) with more than 1,500 respondentsto improve our understanding of why people actually exhibit this behavior. Is it due tosome form of economic reasoning or to cognitive causes? One of the most prominentexplanations in the literature is “anchoring”. This cognitive misperception leads peopleto make judgments that are biased towards initially presented values. The results indeedsuggest that anchoring alone (as opposed to explanations based on economic reasoning)can cause one half of the whole effect referred to as status quo bias. To my knowledge, thisis the first paper to quantitatively disentangle anchoring from other explanations of statusquo bias. My results have implications for the design of surveys and experiments.
Key words: Status Quo Bias, Anchoring, Surveys, Stated Preferences, Captcha
JEL Codes: C83, C90, D03, D81
∗For helpful comments and discussions at different stages of this project, I thank Gerard van den Berg,Christine Binzel, Pierre Boyer, Dennis Boywitt, Dirk Engelmann, Jana Friedrichsen, Hans Peter Gruner, ZohalHessami, Dan Houser, Eckhard Janeba, Tom Krebs, Florian Misch, Jorg Oechssler, Henrik Orzen, AlexanderPaul, Stefan Penczynski, Alex Roomets, Christoph Vanberg, Roland Vaubel, Johannes Voget, Klaus Walde,Evguenia Winschel, and Philipp Zahn. I further thank seminar participants at the 2012 Mainz InternationalBehavioral Economics Workshop, at the 2012 European Conference of the Economic Science Association, at the2012 Heidelberg Mannheim Experimental Economics Workshop, and at the University of Mannheim, the teamsof GIP and GESIS, and the many pretesters of the surveys. All errors are my own. Funding by the DFG throughSFB 884 is gratefully acknowledged.†Department of Economics and Collaborative Research Center “Political Economy of Reforms” (SFB 884),
University of Mannheim, Germany. E-Mail: [email protected].

1 Introduction
In a seminal paper, Samuelson and Zeckhauser (1988) used several survey experiments and
field studies to show that people stick to the status quo choice or policy more frequently than
predicted by standard economic theory. Everyday examples are returning to the same vacation
spot each year or the incumbency advantage in politics. One example investigated by Samuelson
and Zeckhauser (1988) is the following: In a survey experiment, they put respondents into the
hypothetical role of a commissioner distributing water between a town and farmers during a dry
period by choosing one out of ten different options where one of the options was framed as status
quo. They found that in treatments where a more farmers-friendly distribution was framed as
the status quo respondents actually chose a more farmers-friendly option, with a town-friendly
status quo respondents chose a town-friendly option. They labelled this behavior “status quo
bias” and outlined several possible explaining theories for it – ranging from rational ones based
on economic reasoning such as transition cost to cognitive misperceptions such as anchoring.
However, their paper remains silent about how to disentangle the different explanations. The
purpose of this paper is to use survey experiments to improve our understanding of why people
overly stick to the status quo and to empirically disentangle different explanations of status
quo bias. More specifically, I aim to show how quantitatively important anchoring is as an
explanation.
Anchoring describes the phenomenon that people’s judgments are biased towards initially
presented values. Tversky and Kahneman (1974) were among the first to analyze anchoring.
They had people turn a wheel of fortune with numbers from 0 to 100 that was manipulated
to show only the numbers 10 or 65 as result (as an “anchor”) and asked them afterwards to
estimate the number of African countries in the United Nations. People in the anchor 10 group
gave a median estimate of 25, people in the anchor 65 group gave a median estimate of 45.
Another very prominent illustration of the anchoring effect was given by Ariely et al. (2003):
They asked people for the last two digits of their social security number1 (as an “anchor”) and
presented them a bottle of wine afterwards. Then they asked if people would be willing to pay
more or less than the just stated (social security number digits) number in dollars for the wine.
They also asked for the exact maximum willingness to pay in a follow-up question. Surprisingly,
it turns out that there is a very robust positive correlation between the social security number
digits and the willingness to pay for the wine.2 Anchoring might therefore be a very relevant
factor contributing to status quo bias, especially when numbers are involved like in several
examples presented by Samuelson and Zeckhauser (1988). In short, anchoring is a “cognitive
misperception” that is seen by Samuelson and Zeckhauser (1988) as “the best explanation” of
status quo bias (p. 41).
This paper aims at disentangling anchoring from economic reasoning causes of status quo
bias and also at making a first step towards quantifying the anchoring effect in relation to
them. Although status quo bias and anchoring are ubiquitous phenomena to analyze, I restrict
attention to survey questions as a natural application in this study. Opinion polls via surveys
1The first ones to use social security numbers in a similar context were Chapman and Johnson (1999).2This result has, for example, recently been replicated by Bergman et al. (2010) and contested by Fudenberg
et al. (2012) and Maniadis et al. (2014).
2

are one of the main devices in representative democracies to get to know citizens’ preferences
for wide ranges of topics. Besides, survey data find increasing use in economics (e.g. Alesina
et al. (2014)) and surveys are well suited for implementing large-scale experiments (e.g. Cruces
et al. (2013)). To my best knowledge, this is the first study to isolate and quantify anchoring
from other causes of status quo bias in stated preferences.3 For that purpose, large survey
experiments asking for repondents’ policy preferences have been conducted.
Better understanding the relevance of anchoring in shaping status quo bias is an interesting
endeavor for at least three reasons: First, we really need to understand better why people
overly want to stick to the status quo at a very general level. Is it due to cognitive causes or
some form of economic reasoning? – If people typically have good reasons for not wanting to
change the status quo or have at least seriously thought about it, then politicians may in the
end simply have to accept it. However, if it turns out that people always pick the status quo
just because of cognitive anchoring and do not really think about the issue at hand at all, it
may in fact be a worthwhile political endeavour to try to convince voters that more political
reforms may actually be beneficial. Better understanding the causes of status quo bias can in
that sense inform politics and the general public about how to optimally deal with status quo
bias in politics and elsewhere.
Second, we need to know a lot more about how status quo bias and anchoring affect survey
answers in particular. Billions of dollars are spent on surveys where people are asked for
preferences and often to give numbers also (Carson and Groves (2007)). Surveys dominate
marketing and influence politics. How seriously should we take such surveys? – In case anchoring
and purely cognitive effects dominate respondents’ decisions, surveys should be considered a
less informative tool compared to a situation where economic and rational reasoning determine
respondents’ answers. My results can also be used to draw some lessons about future survey
design.
Third, regarding the relevance of anchoring in particular, we need to understand better how
non-economists react to numbers. Anchoring occurs in a wide range of different situations (see
Fehr and Tyran (2008), Beggs and Graddy (2009), or Fujiwara et al. (2013)). This paper is
one of the few analyzing anchoring in a representative sample outside of the laboratory or the
classroom. If we do not know enough about how people treat numbers, we misinterpret our
results. – Suppose it turns out that the size of the anchoring effect is typically negligible, then
we may not have to worry too much. But in case one finds that anchoring is a relevant force, one
may have to rethink some results in the literature, particularly in experimental economics and
any other discipline relying on surveys and experiments. Let me give an example to be more
specific. In public good financing experiments presenting people the number of what others
contribute on average and subsequently observing that people stick to that number themselves
may in fact be due to conformity, i.e. people wanting to follow the reference point set by others.
And often such behaviour is indeed interpreted as evidence of “conformity” (e.g. Alpizar et al.
(2008)). However, if anchoring is relevant, people just take the number they are informed about
and do in fact not think about the public good payment. In that case, it would be misleading
3Anchoring as such has been quantified before. Early examples are Jacowitz and Kahneman (1995) and Greenet al. (1998). But these approaches are not applicable to policy preferences and do also not allow for disentanglinganchoring from other effects.
3

to call this action resulting from a cognitive misperception “conformity”. Thus, learning about
how quantitatively important anchoring is can inform us about the validity of parts of the
research in experimental economics and about how future research designs should be modified.
The experimental approach implemented in this study relies on a split sample survey
design, i.e. different respondents get different versions of the surveys. The survey treatments
developed for disentangling anchoring from other potential causes of status quo bias are based
on Samuelson and Zeckhauser (1988). I complement their approach by adding an anchoring
treatment. This anchoring treatment very much follows the social security number design
implemented by Ariely et al. (2003). It allows me to identify the anchoring effect and to quantify
its relevance relative to other causes of status quo bias. The surveys have all been conducted
in 2012. In sum, more than 1,500 respondents took part. The main survey has been conducted
online and is representative of the German population. For comparison, a smaller survey has
been conducted paper-based in the classroom with only students taking part. The policy topic
of application for the preferences surveys were different areas of public spending in Germany.
The results suggest that anchoring alone can cause one half of the whole phenomenon referred
to as status quo bias. This indeed supports Samuelson and Zeckhauser (1988) who suspect
anchoring to play a dominant role in explaining status quo bias. When designing future surveys
and experiments, the potential prevalence of strong anchoring effects should therefore definitely
be taken into account. It also seems to be a good idea not to blindly trust status quo bias in
voters’ stated policy preferences too much.
Apart from the literature on status quo bias and anchoring, this paper also relates to
stated preferences research. So far, this literature has however focused more on strategic and
hypothetical biases and on the willingness to pay versus willingness to accept difference. See,
for example, Cummings et al. (1995), Cummings et al. (1997), Cummings and Taylor (1999),
List (2001), Plott and Zeiler (2005), or Plott and Zeiler (2007). My study also relates to the
fairly recent literature on default effects and nudges. Anchoring may in some instances be
the explanation for why nudging actually works. A very prominent example is the strand of
literature starting with Madrian and Shea (2001). They exploited a rule change regarding 401(k)
saving plans in the US and found that a relevant share of participants starting saving under the
new regime kept both the default contribution rate and the default fund allocation, although in
fact only very few had chosen this rate and allocation before the rule change (with no default
being in place).4 Anchoring might be a very relevant explanation in this case. Finally, there is
also a political economy literature trying to understand on a more aggregate level why people
want to stick with the status quo so often. The most famous example probably is Fernandez
and Rodrik (1991).
The next section gives a short overview of potential explanations of status quo bias. Section
3 then introduces the design and survey instruments used. Results are discussed in Section 4,
an extension is covered in Section 5. Section 6 concludes.
4The importance of default settings has also been shown, for example, in Johnson and Goldstein (2003),Thaler and Benartzi (2004) or Messer et al. (2007).
4
2 Explanations of Status Quo Bias
Anchoring as the favorite explanation of status quo bias brought forward by Samuelson and
Zeckhauser (1988) is discussed in the Introduction. See Furnham and Boo (2011) for a literature
review on anchoring. On a deeper psychological level, there are different explanations for
anchoring itself as an empirical phenomenon. Two important ones are “insufficient adjustment”
and “selective accessibility”. The first one hypothesizes that when people are asked to provide
a quantitative answer they use an initially given number as a starting point (be it reasonable
or not) and adjust it only partially until a more or less reasonable value (in the eyes of the
respondent and depending on the circumstances) is reached.5 The second explanation states
that the anchor activates selected knowledge about the number that is to be given or estimated
that fits the anchor value and therefore biases responses towards the anchor.6 See Epley
(2004) for an overview regarding these two main explanations of anchoring. Following the
approach to behavioral economics outlined by Matthew Rabin, the present study is however
not concerned with psychologically explaining anchoring as such, but with investigating to what
degree anchoring and other factors can help explaining economic behavior (cf. Rabin (2013), p.
617).
A lot of other possible explanations of status quo bias – apart from anchoring – have
been brought forward. Samuelson and Zeckhauser (1988) categorize them into psychological
commitment explanations and rational explanations. For nice overviews focusing on
psychologocial explanations, see Anderson (2003) or Eidelman and Crandall (2009). Among
the psychological commitment explanations Samuelson and Zeckhauser (1988) mention inter
alia sunk costs, regret avoidance, and the drive for consistency. The sunk cost explanation relies
on the theory that many people are inclined to keep the status quo since they already invested
a lot of resources into it. The concept of regret avoidance is closely related and describes the
theory that people feel worse after a bad outcome they caused through a new action compared
to an equally bad outcome that resulted from doing nothing (i.e. keeping the status quo) since
they feel more personally responsible in the first case. The drive for consistency theory implies
that people stick to their past decisions to minimize cognitive dissonance regarding their self-
perception. All these explanations of psychological commitment in some way or another rely
on people already having made a decision in the past. They are “turned off” in my survey
experiments by choosing policy preferences as topic. Arguably, in politics no single individual
is solely responsible for past or present decisions. If we find status quo bias being present in the
area of policy preferences, channels working through psychological commitment should therefore
not be relevant.7 Samuelson and Zeckhauser (1988) mention loss aversion as another possible
explanation rooted in psychology. The idea is that the status quo serves as a reference point
with possible losses from deviating from it looming larger than possible gains (cf. Tversky and
5See Epley and Gilovich (2001), Epley and Gilovich (2006) or Epley and Gilovich (2010). In the contingentvaluation literature the anchoring effect is usually labelled “starting point bias”, see Green et al. (1998) for anexample analyzing anchoring in contingent valuation.
6See Mussweiler and Strack (2001).7Regarding policy preferences, an individual may still decide to stick to the status quo since this is what the
majority decided. But this is an active decision that requires yet another reason that determines the decision tofollow the majority (such as too high cost of analysis on the individual level). Such causes of status quo bias arecovered in the following paragraph.
5

Kahneman (1991) or Hartman et al. (1991)). But even in examples where there is no framing
in terms of gains and losses they do find strong evidence for status quo bias and conclude that
loss aversion can therefore not be the most relevant explanation. Therefore, also in the policy
preferences survey used for this paper, there is no framing in terms of gains and losses.
The second important branch of explanations outlined in Samuelson and Zeckhauser (1988)
are the rational ones. They mention transition costs, uncertainty, and costs of search or analysis.
Transition costs refer to the simple fact that it might not be possible to change to a new status
quo for free. Uncertainty might play a role when people do not have enough information about
the possible options and/or are risk-averse. If people are uncertain about the process of changing
the status quo itself, trade uncertainty might also be relevant (cf. Engelmann and Hollard
(2010)). Costs of searching for and analyzing alternatives to the status quo might be especially
relevant when people do not want to invest too much energy in thinking about the decision to
be made (cf. Madrian and Shea (2001) or Anderson (2003)). All these explanations are rational
in the sense that the individual really thinks about the choice at hand; if the individual sticks to
the status quo it does so motivationally and based on some form of economic reasoning. This is
in clear contrast to anchoring as possible psychological cause of status quo bias which is better
described as cognitive misperception. A worthwhile first step towards disentangling different
causes of status quo bias therefore is to separate anchoring as a purely cognitive explanation
from the remaining ones which can be rooted in economic reasoning.
3 Method
This section first describes the experimental design, then its application to survey questions,
and finally the surveys implemented for this study.
3.1 Design
A simplified model on how to estimate the anchoring effect’s share in contributing to the overall
status quo bias effect is depicted in Figure 1. The figure shows hypothetical distributions
of people’s statements across three different experimental treatment groups. The example
application is a policy survey asking for people’s bliss points in public per capita spending
for environmental protection. A split sample design needs to be used, i.e. each respondent gets
to answer only one of the three different survey versions. Let us suppose that respondents in
the first group, the No Info Group, are asked for their policy bliss point without being given
any information on the level of the policy status quo. The solid horizontal line represents the
hypothesized distribution of stated policy bliss points within this group. For simplicity, let us
assume it is uniform.
The second group, the Status Quo Group, is asked for bliss points for the very same policy
as the No Info Group, but also gets informed about the status quo level of the policy. Let us
assume it is equal to 5. If status quo bias is an empirically relevant phenomenon, one should
expect the distribution of policy bliss points in this group to be more concentrated around 5 than
in the No Info Group. This is what the line consisting of long dashes and having a maximum at
5 schematically depicts: A lot more respondents give policy bliss points close to the status quo
6

Figure 1: Back of Envelope Estimate of Relative Strength of Anchoring
in the Status Quo Group compared to the No Info Group. One can even give a rough estimate
of the status quo bias effect if one agrees on what “close to the status quo” in fact means. For
example, let us suppose that everything in between 4.5 and 5.5 is considered close to the status
quo. The range of policy bliss points close to the status quo is then marked by vertical dotted
lines. Thus, area A represents the number of respondents in the No Info Group that give policy
bliss points close to 5. For the Status Quo Group, in contrast, respondents close to the status
quo are covered by the area A + B + C. The absolute status quo bias effect thus amounts to
B +C, i.e. the difference by which the number of respondents close to the status quo increases
when switching from the No Info to the Status Quo Group.
Several different causes may be at work jointly in contributing to the overall status quo bias.
The present study is concerned with identifying the relevance of the anchoring effect relative to
other causes. Let us now suppose that we can construct a design for a third treatment group,
the Anchoring Group, where respondents are asked for their policy bliss points as before, but
where by design only anchoring can result in respondents overly stating policy bliss points close
to 5. If anchoring is indeed causal for a part, but not all of the whole status quo bias, the
resulting distribution could look similar to the one depicted by short dashes in the figure, i.e.
being concentrated around 5 as well, but less so than in the Status Quo Group. The part of
status quo bias caused by anchoring would be represented by area B. Area B being seen relative
to C would give an indication of how relatively relevant anchoring is in explaining status quo
bias.
However, one would go too far by saying that B/(B + C) exactly represents the share of
status quo bias that is caused by anchoring. For that statement to be true, one would need a
linearity assumption stating that anchoring does not interact with any other causes of status
quo bias that might be at work in the Status Quo Group besides anchoring, but instead simply
7

adds up to their effects. This is an assumption I am unable to prove and unwilling to make.
What can be said, however, is that rational or economic reasoning can by design not account
for bunching at 5 in the Anchoring Group and, thus, that anchoring as a purely cognitive
misperception can alone produce a B/(B + C) share of the whole status quo bias effect. This
gives quite a good first idea on whether anchoring is a relevant factor in explaining status quo
bias or not.
The next subsection details how treatments for the three different groups can be designed
for the case of policy preferences surveys. Status quo bias is not restricted to survey answers.
It is relevant in a wide range of situations where humans make decisions in the presence of a
status quo. Nevertheless, it is constructive to follow the example of Samuelson and Zeckhauser
(1988) and to use survey experiments as a controlled environment to learn more about this
effect. That does not imply that I expect the relevance of my results to be restricted to surveys.
3.2 Application to Survey Questions
For illustration purposes, let us stick for the moment to the environmental protection spending
example. I come back to the different topics covered in my survey experiments in the next
subsection. Screenshots of the original survey instruments that were used in the field are
contained in the Appendix.
Using a split sample design, one needs survey treatments for respondents in the No Info
Group, the Status Quo Group, and the Anchoring Group. The No Info Group treatment just
has to introduce the topic and to ask for the respondent’s policy bliss point:
Question A: The German state has taken several measures to protect the environment. In
your opinion, how much money should the German state spend on such measures per capita
and year?
The treatment for the Status Quo Group additionally contains information on the status
quo:
Question A: The German state has taken several measures to protect the environment. It
spends around 41 Euros per capita and year on such measures. In your opinion, should the
German state spend on such measures per capita and year less than 41 Euros, 41 Euros, or
more than 41 Euros?
In the online surveys, the order of the three choice options in Question A is randomized. If
a respondent in the Status Quo Group chooses the “more” or the “less” option, she is asked for
her exact bliss point in a follow-up question:8
Question B: How much money should the German state spend on such measures per capita
and year?
Note that the Status Quo Group survey treatment looks similar to the original
8An alternative would be to skip the choice question and to directly ask for the exact amount. However, reallife survey questions typically have the choice question in between. Besides, the anchoring literature from whichI borrow the anchoring treatment also uses a choice question. I therefore follow their formulation.
8

water commissioner survey question by Samuelson and Zeckhauser (1988) presented in the
Introduction. The main difference is that 41 Euros is the actual status quo in German
environmental protection spending and that this question could easily be asked in a real policy
preferences survey in Germany. Such surveys asking for people’s bliss points in certain policy
domains while also telling them about the current status quo are very common. Typically
they look a lot like the question presented here and could for example also ask for people’s
preferred marginal income tax rate for the very rich, the average retirement age in a society, or
the monetary benefit level of a typical welfare recipient. Note that all survey questions refer to
the German case since all the survey experiments have been conducted in Germany.
If status quo bias is relevant, more respondents will give answers close to the status quo
in the Status Quo Group version of the survey than in the No Info Group version presented
before, although both versions actually ask for the very same thing. This is due to different
effects adding up or interacting in more complicated ways to the whole phenomenon labeled
status quo bias. The aim is to disentangle the power of anchoring as a cognitive misperception
from the remaining other effects contributing to status quo bias such as economic reasoning.
When answering the Status Quo Group survey version, respondents are presumably influenced
by the number 41 since it represents the status quo policy that is in place (delivering relevant
economic information), but also since it is a number (which can serve as a cognitive anchor).
If respondents state that their preferred spending level is 41 Euros, we do not know if they
want the current policy to stay in place (for possibly motivational reasons based on economic
thinking) or if they simply anchored to the 41 as a number for purely cognitive reasons.
Comparisons between the answers to the No Info Group and the Status Quo Group enables
one to measure the whole effect of status quo bias. To get an estimate of what part of this whole
effect anchoring alone can produce, the Anchoring Group answers a third version of the survey.
This anchoring treatment needs to present respondents with a random number to anchor to
without telling them anything about the status quo (to “turn off” any other channels through
which status quo bias may work as well). If many respondents in the Anchoring Group stick
close to the (now random) number in the survey question, this must be due to anchoring. For
this purpose, I keep the structure of the question similar to the versions before, but adopt at
the same time the anchoring treatment of Ariely et al. (2003). They use people’s social security
numbers as random anchors. Since people in Germany do not know their social security number
by heart, I use phone numbers instead:
Question A: Please enter the last two digits of your phone number (landline, alternatively
mobile) into the box provided below.
In the following question, the computer replaces [XX] by the digits the respondent provided
in Question A.
Question B: You gave number [XX] as response to the previous question. The German state
has taken several measures to protect the environment. In your opinion, should the German
state spend on such measures per capita and year less than [XX], [XX], or more than [XX]
Euros?
9

In the online surveys, the order of the three choice options in Question B is randomized. If
a respondent in the Anchoring Group chooses the “more” or the “less” option, she is asked for
her exact bliss point in a follow-up question:
Question C: How much money should the German state spend on such measures per capita
and year?
If many respondents’ policy bliss point in the Anchoring Group is close to their phone
number, this must be due to anchoring to the number. As explained in Figure 1, comparing the
share of respondents sticking close to the number between Anchoring and Status Quo Group
then allows to get an idea about how relevant anchoring is in contributing to status quo bias.
Overall, the design of the three versions of the survey thus closely follows the original status
quo bias analysis format by Samuelson and Zeckhauser (1988), the anchoring analysis format
by Ariely et al. (2003), and the way real life policy survey questions typically look like.
One potential concern with my survey design for the Status Quo and the Anchoring Group
could be that a lot of respondent simply pick the (exactly) “41 Euros” or the (exactly) “[XX]
Euros” because they seem to be “easy answers”. However, there are four arguments against this
potential concern. First, respondents may not anticipate that they will be asked for the exact
amount in a follow-up question in case they pick the “more” or “less” option. In that case all
three options are “equally easy”. Second, this study is interested in comparisons across different
survey treatments. If the just described potential problem occurs to the same degree in both
the Status Quo and the Anchoring Group it poses no problem since the effects “cancel out”
via the comparison. Third, even if one assumes the problem to be stronger in the anchoring
treatment, e.g. because of its non-everyday structure, Epley and Gilovich (2001) have shown
that this type of problem is weakest in the case of anchors that are generated by respondents
themselves (which is the case with phone numbers respondents give themselves). Fourth, and
most important, results are similar when excluding all respondents who took the “41 Euros” in
the Status Quo or the “[XX] Euros” in the Anchoring Group.
3.3 The Surveys
The experimental design described in the previous subsection was implemented in three different
surveys. Table 1 gives a short overview. All surveys in principle followed the same basic structure
with No Info Group, Status Quo Group, and Anchoring Group. In some cases, there were some
additional treatments and checks included. I come back to this in the Extension Section. For
simplification, for the most part of the Results Section the focus is on data from Survey 3 since
results are very similar across all three surveys.
Table 1: Overview of Surveys
Survey 1 Survey 2 Survey 3
Field Time Jun/Jul 2012 Sep 2012 Nov 2012Field Mode GIP (online) Classroom (offline) GIP (online)Observations 296 176 1081Policy Topic Environment Performing Arts Performing Arts
10

Two out of the three surveys were conducted online using the German Internet Panel (GIP)
based at the University of Mannheim and funded by the German Science Foundation. One of
its main goals is “to collect micro data on the feasibility of political and economic reforms”.9
The GIP is anonymous and the first online true probability sample in Germany. Although GIP
surveys are conducted online, the recruiting is done offline and is representative. Participants
without computer and/or internet access (or lacking the relevant experience) are provided with
infrastructure and help. There is a payment of 4 Euros per completed survey, plus a bonus for
completing all 5 to 6 surveys in a year. Since the anchoring studies mentioned above (including
Ariely et al. (2003)) took place either in the classroom or in the laboratory, my study can on
top of its original purpose also be seen as the first “field test” of this kind of anchoring in the
sense that the subject pool is a representative sample of an entire population.
For comparison reasons, one of the three surveys has been conducted paper-based in the
classroom. The sample consisted of second-year undergraduate students taking intermediate
microeconomics exercise sessions (in German) at the University of Mannheim. Students were
told that the survey was part of a “scientific project”, that participation was voluntary and
anonymous, and that the results of the project would be presented in one future exercise session.
All the students participated and filled out the questionnaire. Students were not aware of the
fact that there were different versions of the questionnaire and had also been asked to work on
the questionnaire alone. Any communication was forbidden while filling out the sheet of paper.
The filling-out process was monitored. The classroom survey allows to check whether results
regarding status quo bias and anchoring are different for this very specific sample of respondents
compared to the population-representative surveys. Respondents in the classroom survey have
all passed the highest possible high school degree in Germany (qualifying for entering university),
are on average considerably younger, and have on average a background of two semesters training
in economics and mathematics at the University of Mannheim.
4 Results
This section first presents evidence for status quo bias in people’s policy preferences. The
second part shows that people are prone to anchoring to random numbers when stating policy
preferences. The third part analyzes how quantitatively relevant anchoring is in contributing
to status quo bias.
4.1 Evidence of Status Quo Bias
Figure 2 comparatively shows the distribution of respondents’ stated policy bliss points in the
No Info and the Status Quo Group of Survey 3. Although both groups are in fact asked for the
very same thing (their policy bliss point regarding public per capita spending in Euros on the
performing arts in Germany), informing one group about the status quo (but not the other)
results in large differences across the distributions of answers: One can immediately tell that in
the No Info Group 0, 50, and 100 seem prominent magnitudes to pick, whereas in the Status
9For more information on the GIP, you can visit reforms.uni-mannheim.de (choose “Internet Panel” in themenu).
11

Quo Group the most striking observation clearly is that as much as 40% of all respondents give
a response equal to 33 or at least very close to it. They had been informed that 33 is the status
quo policy. Thus, respondents are heavily influenced by knowing about the status quo or not.
Status quo bias is strong.
Figure 2: Status Quo Bias in Policy Preferences
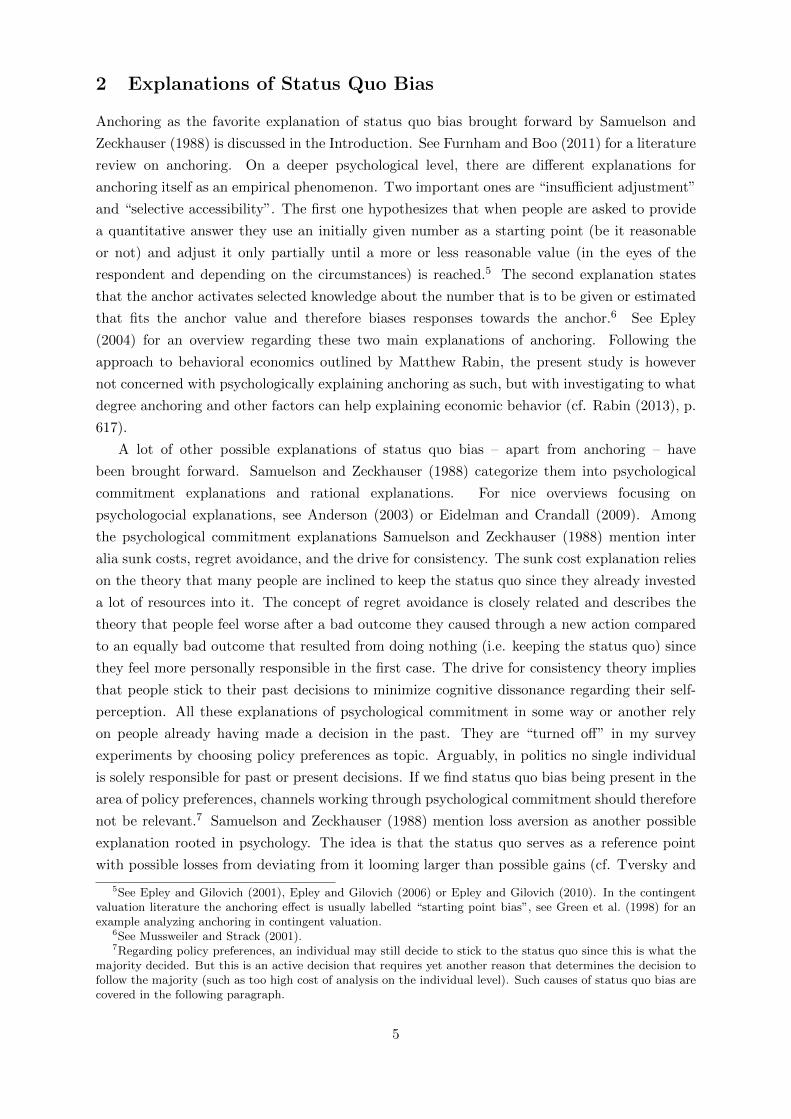
It is also evident from the figure that answers in the No Info Group are more dispersed
than in the Status Quo Group. This observation further supports the conclusion that status
quo bias is at work and is confirmed by looking at some summary statistics of the bliss point
distributions across the two groups. For this, see Table 2. While the range of given answers is 0
to 699 in the No Info Group, it shrinks to 0 to only 75 in the Status Quo Group. The standard
deviation of answers is more than seven times higher in the No Info Group than in the Status
Quo Group. Finally, the mean policy bliss point is around 64 in the No Info Group, but exactly
equal to the status quo, i.e. 33, in the Status Quo Group. Thus, informing respondents about
the status quo has enormous effects on the answers they give. The clearest evidence of status
quo bias is that almost one half of all respondents give policy bliss points equal or very close to
the status quo if they get informed about it. Results are very similar for the other surveys.
12
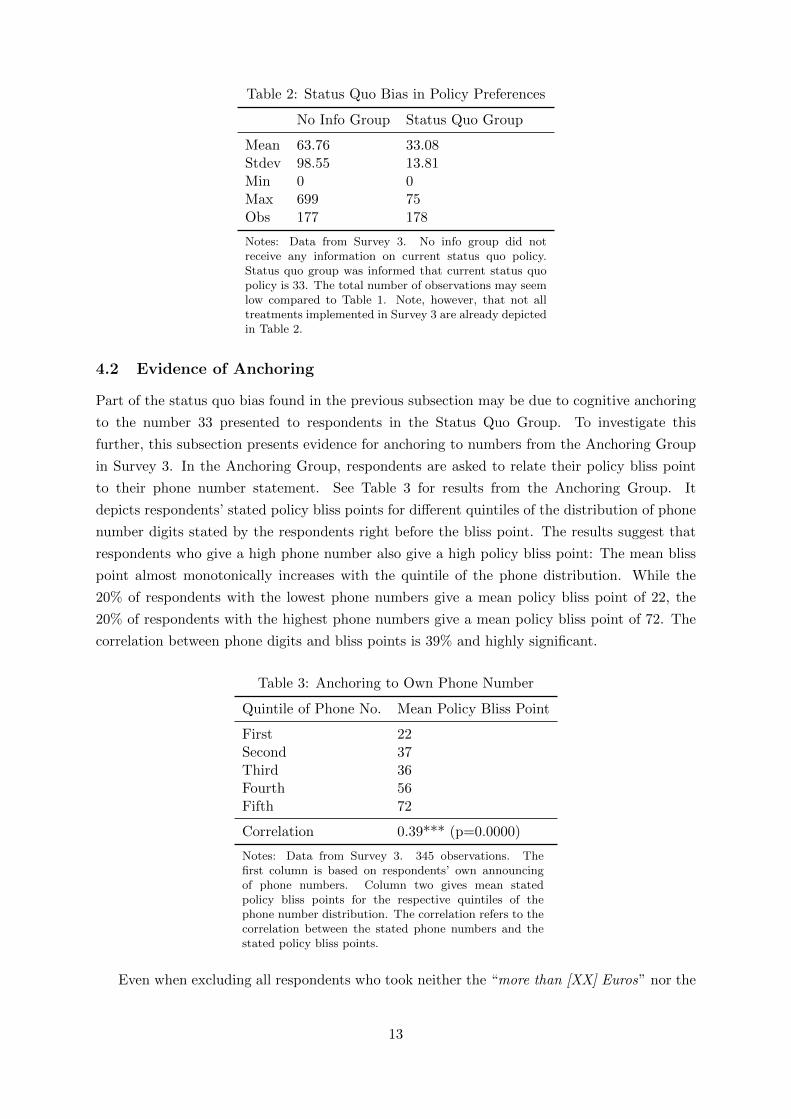
Table 2: Status Quo Bias in Policy Preferences
No Info Group Status Quo Group
Mean 63.76 33.08Stdev 98.55 13.81Min 0 0Max 699 75Obs 177 178
Notes: Data from Survey 3. No info group did notreceive any information on current status quo policy.Status quo group was informed that current status quopolicy is 33. The total number of observations may seemlow compared to Table 1. Note, however, that not alltreatments implemented in Survey 3 are already depictedin Table 2.
4.2 Evidence of Anchoring
Part of the status quo bias found in the previous subsection may be due to cognitive anchoring
to the number 33 presented to respondents in the Status Quo Group. To investigate this
further, this subsection presents evidence for anchoring to numbers from the Anchoring Group
in Survey 3. In the Anchoring Group, respondents are asked to relate their policy bliss point
to their phone number statement. See Table 3 for results from the Anchoring Group. It
depicts respondents’ stated policy bliss points for different quintiles of the distribution of phone
number digits stated by the respondents right before the bliss point. The results suggest that
respondents who give a high phone number also give a high policy bliss point: The mean bliss
point almost monotonically increases with the quintile of the phone distribution. While the
20% of respondents with the lowest phone numbers give a mean policy bliss point of 22, the
20% of respondents with the highest phone numbers give a mean policy bliss point of 72. The
correlation between phone digits and bliss points is 39% and highly significant.
Table 3: Anchoring to Own Phone Number
Quintile of Phone No. Mean Policy Bliss Point
First 22Second 37Third 36Fourth 56Fifth 72
Correlation 0.39*** (p=0.0000)
Notes: Data from Survey 3. 345 observations. Thefirst column is based on respondents’ own announcingof phone numbers. Column two gives mean statedpolicy bliss points for the respective quintiles of thephone number distribution. The correlation refers to thecorrelation between the stated phone numbers and thestated policy bliss points.
Even when excluding all respondents who took neither the “more than [XX] Euros” nor the
13

“less than [XX] Euros’ ’, but the “[XX] Euros” option, the anchoring correlation is still 33%
and highly significant (p=0.0000). Results are very similar for the other surveys. For example,
also in Survey 2 where all respondents were highly educated university students having been
trained in economics and mathematics the phone anchoring correlation is 37% and significant
at any conventional level.
Thus, we can conclude: People with a high phone number (high anchor) want high per capita
spending on the arts, while people with a low phone number (low anchor) want low spending.
People take their own phone number as a relevant anchor when answering the policy question.
Anchoring is very relevant. This finding is completely in line with the results of Ariely et al.
(2003) who show that people with a larger social security number state a higher willingness to
pay for the same bottle of wine.
The next subsection details how the experimental design can be exploited to investigate how
much of the status quo bias detected before is due to such anchoring.
4.3 Explaining Status Quo Bias by Anchoring
A first step in analyzing how quantitatively important anchoring is in causing status quo bias is
to compare between the Status Quo and the Anchoring Group the shares of respondents giving
policy bliss points within a certain “closeness” band around the status quo or anchor. In both
groups, respondents get a number to anchor to, be it the status quo or a phone number. In the
Status Quo Group, respondents may besides anchoring to the number also give a policy bliss
point close the status quo number for other potential reasons of status quo bias (such as based
on economic reasoning). If one accepts the share of respondents staying close to the status quo
as a measure of the total status quo bias effect, one is able to estimate the share of this effect
that is due to anchoring by comparing it to the share of respondents staying close to the phone
number in the Anchoring Group (where all other channels possibly causing status quo bias are
turned off).
Table 4: Anchoring Can Cause up to 50% of Status Quo Bias
Band aroundRespondents fraction within band:
Chi square Relative strengthanchor/status quo No Info Anchoring Status Quo p-value anchoring effect
1% 0.000 0.135 0.376 0.000 0.3595% 0.000 0.141 0.376 0.000 0.37510% 0.045 0.156 0.416 0.000 0.30020% 0.045 0.207 0.416 0.000 0.43730% 0.056 0.305 0.556 0.000 0.49850% 0.107 0.443 0.652 0.000 0.617
Notes: Data from Survey 3. 689 observations (sum of observations analyzed separately in Tables 2 and 3).Column one gives the +/- range by which a respondent’s stated policy bliss point can deviate from theanchor (Anchoring Group) respectively status quo (No Info and Status Quo Groups) to still be consideredclose. For example, 13.5% of respondents in the Anchoring Group stay within a +/- 1% range of theanchor. Column four gives the p-value of a chi square test checking whether the fraction of respondentswithin the band is equal across the three groups. The last column gives a rough estimate of the strengthof the anchoring effect relative to the status quo bias by calculating: (fraction anchoring - fraction no info)/ (fraction status quo - fraction non info).
14

Since it is not a priori clear what “staying close” means, Table 4 provides such an analysis
for bands of different ranges from +/-1% up to +/-50%. For example, being in a 1% band
means that the answer given to the question was at maximum 1% larger and at minimum
1% smaller than the number given in the question (be it the status quo policy or the phone
anchor). One can see that in the Anchoring Group between 13.5 and 44.3% of all respondents
(depending on the defintion of “staying close”) give a policy bliss point that is close to their
phone number statement. In the Status Quo Group, between 37.6 and 65.2% of respondents
give a policy bliss point that is close to the status quo of 33. Table 4 also presents p-values of
chi square tests showing that the shares of respondents sticking close to the number are indeed
statistically different across the different treatment groups. The final column of Table 4 – in line
with the design presented in Figure 1 – provides back of the envelope estimates of the relative
importance of the anchoring effect in contributing to the overall status quo bias effect. They
show that according to Survey 3 data cognitive anchoring alone can produce between 30 and
61.7% of the whole effect referred to as status quo bias. Analyzing the data from the other
surveys gives the same picture. See the Appendix for the results.
Table 5: Regressing Distance from Anchor/Status Quo on Group Indicator
Dep. Variable: Distance from Anchor/Status Quo
Constant 56.198 ***(6.500)
Status Quo -46.552 ***(6.541)
Anchoring -26.979 ***(6.709)
Observations 689R squared 0.106
Notes: Data from Survey 3. OLS regression. 689 observations (sum of observationsanalyzed separately in Tables 2 and 3). Dependent variable is the absolute distanceof the respondent’s stated policy bliss point from the anchor (anchoring group) or thestatus quo (no info and status quo group). Status Quo and Anchoring are dummiesindicating to which group a respondent had been randomly assigned to. The no infogroup serves as the baseline. Robust standard errors in parentheses. *** p <0.01, **p <0.05, * p <0.1.
Table 5 offers a more formal analysis by regressing the respondents’ distances between
policy bliss point and number (status quo or anchor) on treatment group indicators. The No
Info Group serves as a baseline, i.e. the mean distance between the status quo of 33 and policy
bliss points stated by respondents in the No Info Group is about 56.2. The coefficients for both
other groups are significantly negative, i.e. providing respondents with the actual status quo
or asking them to relate the bliss point to their phone number both pushes them closer to the
number. Being informed about the status quo policy reduces the distance to the status quo
by about 46.6 to a mean distance of about 56.2 − 46.6 = 9.6 only. This is again illustrative
of status quo bias. Being a respondent in the Anchoring Group reduces the distance from the
relevant number by only 27 resulting in a mean distance of 56.2 − 27 = 29.2. Comparing the
15

coefficients of the treatment group indicators suggests that about 27/46.2 = 58.4% of status
quo bias can be produced by anchoring alone based on this distance analysis. This magnitude
is very much in line with the estimates obtained in Table 4 based on an analysis of shares of
respondents within certain closeness bands.
Thus, the estimates show across the different surveys and across different methods of analysis
that anchoring alone can produce about one half of the whole effect referred to as status quo
bias. Although the results are fairly consistent across the survey experiments, one may question
the external validity of the result since all presented survey experiments are based on asking
common people about detailed policy issues such as per capita spending on environmental
protection. One could argue anchoring to be particularly strong in this case since many people
may not have the slightest clue about what a potential range of reasonable answers could be.
I want to alleviate such concerns by bringing up three points: First, the used survey questions
follow very much real life survey questions. Thus, even if they were particularly prone to
anchoring by non-experts, so would be real life surveys. In that sense, my results would still
be informative for real life applications. Second, Bateman et al. (1997) have shown that people
show about the same degree of uncertainty regarding preferences in the case of more common
goods compared to less common goods. This fits the findings by Jacowitz and Kahneman (1995)
and Fujiwara et al. (2013) showing that experts are in fact not less prone to anchoring than
non-experts. Third, in some of the experimental surveys, I can control for the experience of
the respondents, e.g. by asking respondents how much money they typically spend per year on
visiting stage performances before asking them about their bliss point regarding public spending
on the performing arts. My results are similar when controlling for such experience.
5 Extension: The Limits of Anchoring
The results in the previous section show that anchoring as a cognitive misperception can explain
up to 50% of status quo bias. If anchoring has such strong effects, the question arises whether
policy preferences may also be influenced by any random number even if it is not connected
to the policy preferences question at all. In the previous design, respondents in the Anchoring
Group were explicitly asked to relate their policy bliss points to their phone number statements.
This subsection explores an extension treatment to the previous design that tests whether
respondents also anchor when they are presented a random number on the way without being
actively asked to consider it when answering the subsequent policy preferences question. The
psychological literature refers to this special type of anchoring as “basic anchoring”. Results
on basic anchoring have been mixed so far and seem to depend on the circumstances. While
Wilson et al. (1996), Mussweiler and Englich (2005), and Critcher and Gilovich (2008) find
basic anchoring effects, Brewer and Chapman (2002), for example, do not.
To design a basic anchoring treatment, one needs to present respondents a number (to
potentially anchor to) without giving them the slightest hint that there could be a relation to
the subsequent policy preferences question. This turns out not to be too straightforward if one
does not want to lie to people and also not to make them suspicious. I decided to use a “captcha”
for that purpose. Captchas are “Completely Automated Public Turing tests to tell Computers
16

Figure 3: A Typical Captcha.
and Humans Apart” and known to everybody using the internet (see von Ahn et al. (2003), von
Ahn et al. (2008), or Rao and Reiley (2012)). Figure 3 shows you a typical example.10 Robots
or programs are often used to misuse websites, but are often unable to complete captchas.
Captchas are therefore used as a security device deciding whether the entity using a website is
human or not. Since such captchas are by now very common, I can use a captcha respondents
have to answer in a question right before the policy question to potentially get an anchor into
respondents’ minds without creating suspicion. See Figure 4 for a captcha adapted for my
purposes. Respondents are asked to enter the random number the computer shows them into
the box provided.
Figure 4: An “anchor 39” captcha.
10The example is taken from the following website that explains how to create a captcha:http://dotnetslackers.com/articles/aspnet/Creating-a-CAPTCHA-generating-ActionResult.aspx (March 18,2014).
17

To test whether including such basic anchors has any effects on respondents’ stated policy
bliss points, Survey 3 contained an additional treatment group (Basic Anchoring Group).
Respondents in this group first had to answer a captcha question like the one shown in
Figure 4. The computer randomly showed either an anchor 33, an anchor 66, or an anchor 99
captcha. Afterwards, they were presented with exactly the same policy preferences question as
respondents in the No Info Group. See the Appendix for detailed screenshots and explanations
of the original survey questions. The results in Table 6 show that respondents in the Basic
Anchoring Group do in fact not anchor to the captcha numbers at all: Independently of the
captcha number being shown to them, in all three groups respondents’ stated mean policy bliss
points are almost the same. There is no evidence of any correlation between the stated policy
bliss points and the captcha numbers. Respondents do thus not exhibit basic anchoring.
Table 6: No Anchoring to Captchas
Captcha Mean Policy Bliss Point
33 72.8566 70.4399 69.62
Correlation -0.01 (p=0.8361)
Notes: Data from Survey 3. 349 observations.Column one presents the captcha number to befilled in by respondents in the respective group.Column two gives the mean stated policy blisspoints for each captcha group. The correlationrefers to the correlation between captcha numbersand stated policy bliss points.
Since real life survey questions do in fact actively ask for a comparison of the number given
in the question (e.g. the status quo) to the respondent’s bliss point, the Anchoring Group
design (with phone numbers) is the appropriate one to estimate anchoring’s relative effect in
contributing to status quo bias. The previous section has shown that this relative effect is
strong. Nevertheless, it may seem assuring that results from the Basic Anchoring Group show
that, although anchoring can be strong, people are not necessarily prone to taking any random
number not related to the question at hand at all as relevant information when answering it.
6 Conclusion
Status quo bias is an ubiquitous phenomenon. However, little is known about which factors can
explain it. This study uses large survey experiments within the classroom and the representative
German Internet Panel (GIP) to disentangle anchoring as a cognitive misperception from
explanations based on economic reasoning such as transition cost. The result is that about
one half of status quo bias can be caused by anchoring alone. This clearly supports the claim
by Samuelson and Zeckhauser (1988) that anchoring is the “best explanation” of status quo
bias. One lesson to be learnt from that could be not to take huge status quo bias in voters’
stated policy preferences politically too seriously. Another implication is that anchoring as an
empirical phenomenon should be taken into account when designing future experiments and
18

surveys, in particular when presenting people with numbers. An extension analysis relying on
the usage of captchas as basic anchors however reveals that fears people could systematically
anchor to any random number that has no connection to the issue at hand at all would be
exaggerated.
References
Alesina, A., P. Giuliano, and N. Nunn (2014). On the origins of gender roles: Women and the
plough. The Quarterly Journal of Economics forthcoming.
Alpizar, F., F. Carlsson, and O. Johansson-Stenman (2008). Anonymity, reciprocity, and
conformity: Evidence from voluntary contributions to a national park in costa rica. Journal
of Public Economics 92 (5–6), 1047 – 1060.
Anderson, C. J. (2003). The psychology of doing nothing: Forms of decision avoidance result
from reason and emotion. Psychological Bulletin Vol 129(1), 139–166.
Ariely, D., G. Loewenstein, and D. Prelec (2003). ”coherent arbitrariness”: Stable demand
curves without stable preferences. The Quarterly Journal of Economics 118 (1), pp. 73–105.
Bateman, I., A. Munro, B. Rhodes, C. Starmer, and R. Sugden (1997). A test of the theory of
reference-dependent preferences. The Quarterly Journal of Economics 112 (2), 479–505.
Beggs, A. and K. Graddy (2009). Anchoring effects: Evidence from art auctions. The American
Economic Review 99 (3), pp. 1027–1039.
Bergman, O., T. Ellingsen, M. Johannesson, and C. Svensson (2010). Anchoring and cognitive
ability. Economics Letters 107 (1), 66 – 68.
Brewer, N. T. and G. B. Chapman (2002). The fragile basic anchoring effect. Journal of
Behavioral Decision Making 15 (1), 65–77.
Carson, R. and T. Groves (2007). Incentive and informational properties of preference questions.
Environmental and Resource Economics 37, 181–210.
Chapman, G. B. and E. J. Johnson (1999). Anchoring, activation, and the construction of
values. Organizational Behavior and Human Decision Processes 79 (2), 115 – 153.
Critcher, C. R. and T. Gilovich (2008). Incidental environmental anchors. Journal of Behavioral
Decision Making 21 (3), 241–251.
Cruces, G., R. Perez-Truglia, and M. Tetaz (2013). Biased perceptions of income distribution
and preferences for redistribution: Evidence from a survey experiment. Journal of Public
Economics 98 (0), 100 – 112.
Cummings, R. G., S. Elliott, G. W. Harrison, and J. Murphy (1997). Are hypothetical referenda
incentive compatible? Journal of Political Economy 105 (3), pp. 609–621.
19

Cummings, R. G., G. W. Harrison, and E. E. Rutstrom (1995). Homegrown values and
hypothetical surveys: Is the dichotomous choice approach incentive-compatible? The
American Economic Review 85 (1), pp. 260–266.
Cummings, R. G. and L. O. Taylor (1999). Unbiased value estimates for environmental
goods: A cheap talk design for the contingent valuation method. The American Economic
Review 89 (3), pp. 649–665.
Eidelman, S. and C. Crandall (2009). On the psychological advantage of the status quo. In
J. T. Jost, A. C. Kay, and H. Thorisdottir (Eds.), Social and psychological bases of ideology
and system justification, pp. 85–106. New York, NY: Oxford University Press.
Engelmann, D. and G. Hollard (2010). Reconsidering the effect of market experience on the
”endowment effect”. Econometrica 78 (6), 2005–2019.
Epley, N. (2004). A tale of tuned decks? anchoring as adjustment and anchoring as activation. In
D. J. Koehler and N. Harvey (Eds.), Blackwell Handbook of Judgement and Decision Making,
pp. 240–56. Malden, MA: Blackwell Pub.
Epley, N. and T. Gilovich (2001). Putting adjustment back in the anchoring and adjustment
heuristic: Differential processing of self-generated and experimenter-provided anchors.
Psychological Science 12 (5), 391–396.
Epley, N. and T. Gilovich (2006). The anchoring-and-adjustment heuristic. Psychological
Science 17 (4), 311–318.
Epley, N. and T. Gilovich (2010). Anchoring unbound. Journal of Consumer Psychology 20 (1),
20 – 24.
Fehr, E. and J.-R. Tyran (2008). Limited rationality and strategic interaction: The impact of
the strategic environment on nominal inertia. Econometrica 76 (2), pp. 353–394.
Fernandez, R. and D. Rodrik (1991). Resistance to reform: Status quo bias in the presence of
individual- specific uncertainty. The American Economic Review 81 (5), pp. 1146–1155.
Fudenberg, D., D. K. Levine, and Z. Maniadis (2012). On the robustness of anchoring effects
in wtp and wta experiments. American Economic Journal: Microeconomics 4 (2), 131–45.
Fujiwara, I., H. Ichiue, Y. Nakazono, and Y. Shigemi (2013). Financial markets forecasts
revisited: Are they rational, stubborn or jumpy? Economics Letters 118 (3), 526 – 530.
Furnham, A. and H. C. Boo (2011). A literature review of the anchoring effect. The Journal of
Socio-Economics 40 (1), 35 – 42.
Green, D., K. E. Jacowitz, D. Kahneman, and D. McFadden (1998). Referendum contingent
valuation, anchoring, and willingness to pay for public goods. Resource and Energy
Economics 20 (2), 85 – 116.
20
Hartman, R. S., M. J. Doane, and C.-K. Woo (1991). Consumer rationality and the status quo.
The Quarterly Journal of Economics 106 (1), pp. 141–162.
Jacowitz, K. E. and D. Kahneman (1995). Measures of anchoring in estimation tasks.
Personality and Social Psychology Bulletin 21 (11), 1161–1166.
Johnson, E. J. and D. Goldstein (2003). Do defaults save lives? Science 302 (5649), 1338–1339.
List, J. A. (2001). Do explicit warnings eliminate the hypothetical bias in elicitation procedures?
evidence from field auctions for sportscards. The American Economic Review 91 (5), pp.
1498–1507.
Madrian, B. C. and D. F. Shea (2001). The power of suggestion: Inertia in 401(k) participation
and savings behavior. The Quarterly Journal of Economics 116 (4), pp. 1149–1187.
Maniadis, Z., F. Tufano, and J. A. List (2014). One swallow doesn’t make a summer: New
evidence on anchoring effects. American Economic Review 104 (1), 277–90.
Messer, K. D., H. Zarghamee, H. M. Kaiser, and W. D. Schulze (2007). New hope
for the voluntary contributions mechanism: The effects of context. Journal of Public
Economics 91 (9), 1783 – 1799.
Mussweiler, T. and B. Englich (2005). Subliminal anchoring: Judgmental consequences and
underlying mechanisms. Organizational Behavior and Human Decision Processes 98 (2), 133
– 143.
Mussweiler, T. and F. Strack (2001). The semantics of anchoring. Organizational Behavior and
Human Decision Processes 86 (2), 234 – 255.
Plott, C. R. and K. Zeiler (2005). The willingness to pay-willingness to accept gap, the
”endowment effect,” subject misconceptions, and experimental procedures for eliciting
valuations. The American Economic Review 95 (3), pp. 530–545.
Plott, C. R. and K. Zeiler (2007). Exchange asymmetries incorrectly interpreted as evidence of
endowment effect theory and prospect theory? The American Economic Review 97 (4), pp.
1449–1466.
Rabin, M. (2013). An approach to incorporating psychology into economics. The American
Economic Review 103 (3), 617–622.
Rao, J. M. and D. H. Reiley (2012). The economics of spam. Journal of Economic
Perspectives 26 (3), 87–110.
Samuelson, W. and R. Zeckhauser (1988). Status quo bias in decision making. Journal of Risk
and Uncertainty 1, 7–59.
Thaler, R. H. and S. Benartzi (2004). Save more tomorrow�: Using behavioral economics to
increase employee saving. Journal of Political Economy 112 (S1), pp. S164–S187.
21

Tversky, A. and D. Kahneman (1974). Judgment under uncertainty: Heuristics and biases.
Science 185 (4157), 1124–1131.
Tversky, A. and D. Kahneman (1991). Loss aversion in riskless choice: A reference-dependent
model. The Quarterly Journal of Economics 106 (4), pp. 1039–1061.
von Ahn, L., B. Maurer, C. McMillen, D. Abraham, and M. Blum (2008). recaptcha: Human-
based character recognition via web security measures. Science 321 (5895), 1465–1468.
von Ahn, L. V., M. Blum, N. J. Hopper, and J. Langford (2003). Captcha: using hard ai
problems for security. In Proceedings of the 22nd international conference on Theory and
applications of cryptographic techniques, EUROCRYPT’03, Berlin, Heidelberg, pp. 294–311.
Springer-Verlag.
Wilson, T. D., C. E. Houston, K. M. Etling, and N. Brekke (1996). A new look at
anchoring effects: Basic anchoring and its antecedents. Journal of Experimental Psychology:
General 125(4), 387–402.
A Strength of Anchoring in Surveys 1 and 2
Table 7: Anchoring Can Cause up to 50% of Status Quo Bias (Survey 1)
Band aroundRespondents fraction within band:
Chi square Relative strengthanchor/status quo No Info Anchoring Status Quo p-value anchoring effect
1% 0.000 0.231 0.485 0.000 0.4765% 0.030 0.246 0.515 0.000 0.44510% 0.030 0.262 0.545 0.000 0.44920% 0.030 0.292 0.576 0.000 0.48030% 0.152 0.385 0.636 0.000 0.48150% 0.152 0.508 0.727 0.000 0.619
Notes: Data from Survey 1. 131 observations. Column one gives the +/- range by which a respondent’sstated policy bliss point can deviate from the anchor (anchoring group) respectively status quo (no info andstatus quo group) to still be considered close. For example, 23.1% of respondents in the anchoring groupstay within a +/- 1% range of the anchor. Column four gives the p-value of a chi square test checkingwhether the fraction of respondents within the band is equal across the three groups. The last columngives a rough estimate of the strength of the anchoring effect relative to the status quo bias by calculating:(fraction anchoring - fraction no info) / (fraction status quo - fraction non info).
22

Table 8: Anchoring Can Cause up to 50% of Status Quo Bias (Survey 2)
Band aroundRespondents fraction within band:
Chi square Relative strengthanchor/status quo No Info Anchoring Status Quo p-value anchoring effect
1% 0.017 0.121 0.351 0.000 0.3115% 0.017 0.138 0.351 0.000 0.36310% 0.033 0.172 0.368 0.000 0.41520% 0.033 0.224 0.404 0.000 0.51530% 0.067 0.310 0.596 0.000 0.46050% 0.117 0.466 0.667 0.000 0.634
Notes: Data from Survey 2. 171 observations. Column one gives the +/- range by which a respondent’sstated policy bliss point can deviate from the anchor (anchoring group) respectively status quo (no info andstatus quo group) to still be considered close. For example, 12.1% of respondents in the anchoring groupstay within a +/- 1% range of the anchor. Column four gives the p-value of a chi square test checkingwhether the fraction of respondents within the band is equal across the three groups. The last columngives a rough estimate of the strength of the anchoring effect relative to the status quo bias by calculating:(fraction anchoring - fraction no info) / (fraction status quo - fraction non info).
B Description of Original Survey Instruments
For a short overview of the different surveys, see Table 1.
B.1 Survey 1
The survey versions for the five groups of Survey 1 are presented one after another: No InfoGroup, Status Quo Group, Status Quo No Choice Group, Anchoring Group, Captcha Group.
Respondents in the No Info Group received a screen directly asking about their policy blisspoints without being given any information on the current status quo policy. See Figure 5 for ascreenshot of the original survey question (in German). The screen said: “The German state hastaken several measures to protect the environment. In your opinion, how much money shouldthe German state spend on such measures per capita and year? Please enter your answer intothe box provided.” On the right-hand side of the box it said “Euros per capita and year”.
Figure 5: Survey 1: No Info Group
Respondents in the Status Quo Group received information about the current status quopolicy. See Figure 6 for screenshots of the original survey questions (in German). The firstscreen said: “The German state has taken several measures to protect the environment. Itspends around 41 Euros per capita and year on such measures. In your opinion, the Germanstate should spend on such measures per capita and year... To answer this question chooseone of the three answering options.” The answering options were: “more than 41 Euros”, “less
23

than 41 Euros”, “41 Euros”. The order of the different answering options was randomizedacross respondents. If respondents chose either the “more” or the “less” option, the secondscreen popped up asking for the exact amount: “In your opinion, how much money should theGerman state spend on such measures per capita and year? Please enter your answer into thebox provided.” On the right-hand side of the box it said “Euros per capita and year”.
Figure 6: Survey 1: Status Quo Group
Respondents in the Status Quo No Choice Group received information about the currentstatus quo policy. In contrast to the Status Quo Group, they did not receive a screen with threechoice options first, but were directly asked for their exact policy bliss point. See Figure 7 fora screenshot of the original survey question (in German). The screen said: “The German statehas taken several measures to protect the environment. It spends around 41 Euros per capitaand year on such measures. In your opinion, how much money should the German state spendon such measures per capita and year? Please enter your answer into the box provided.” Onthe right-hand side of the box it said “Euros per capita and year”.
Figure 7: Survey 1: Status Quo No Choice Group
24

Respondents in the Anchoring Group first were asked to provide some digits of their phonenumber and then to put their policy bliss point into perspective to it without receiving anyinformation on the current status quo policy. See Figure 8 for screenshots of the original surveyquestions (in German). The first screen said: “Please enter the last three digits of your phonenumber (landline, alternatively mobile) into the box provided below. Please enter your answerinto the box provided.” On the second screen it said: “You gave number “[the respondent’sanswer to the previous question was inserted here by the computer]” as response to the previousquestion. The German state has taken several measures to protect the environment. In youropinion, the German state should spend on such measures per capita and year... To answerthis question choose one of the three answering options.” The answering options were: “morethan “[the respondent’s answer to the previous question was inserted here by the computer]”Euros”, “less than “[the respondent’s answer to the previous question was inserted here by thecomputer]” Euros”, ““[the respondent’s answer to the previous question was inserted here bythe computer]” Euros”. The order of the different answering options was randomized acrossrespondents. If respondents chose either the “more” or the “less” option, a third screen poppedup asking for the exact amount: “In your opinion, how much money should the German statespend on such measures per capita and year? Please enter your answer into the box provided.”On the right-hand side of the box it said “Euros per capita and year”.
Figure 8: Survey 1: Anchoring Group
Respondents in the Captcha Group were first shown a captcha test and then asked for
25

their policy bliss points. See Figure 9 for screenshots of the original survey questions (inGerman). The first screen said: “The computer now shows you a random number.” Thecomputer randomly showed one out of three pictures depicting 11, 39, or 390 according to theprobability distribution 25%-50%-25%. “Please enter this number into the box provided below.Then procede to the next question. Please enter your answer into the box provided.” Thesecond screen said: “The German state has taken several measures to protect the environment.In your opinion, how much money should the German state spend on such measures per capitaand year? Please enter your answer into the box provided.” On the right-hand side of the boxit said “Euros per capita and year”.
Figure 9: Survey 1: Captcha Group
Some questions unrelated to this project (also by other researchers) chosen by the Board ofthe GIP followed.
B.2 Survey 2
The survey versions for the three groups of Survey 2 are presented one after another: No InfoGroup, Status Quo Group, Anchoring Group.
Respondents in the No Info Group were first asked about their gender and then abouttheir policy bliss point without receiving any information on the current status quo policy. SeeFigure 10 for the original questionnaire (in German). It said:
“Anonymous Questionnaire. Question A: What is your gender? Male or Female? QuestionB: In Germany, various types of stage performances are publicly subsidized. Among theseare performances at playhouses such as plays, operas, children and youth theater, concerts,dances, musicals, operettas, and puppet plays. Besides, stage performances of private theaters,independent orchestras, festivals, and radio orchestras are also publicly subsidized in Germany.
26
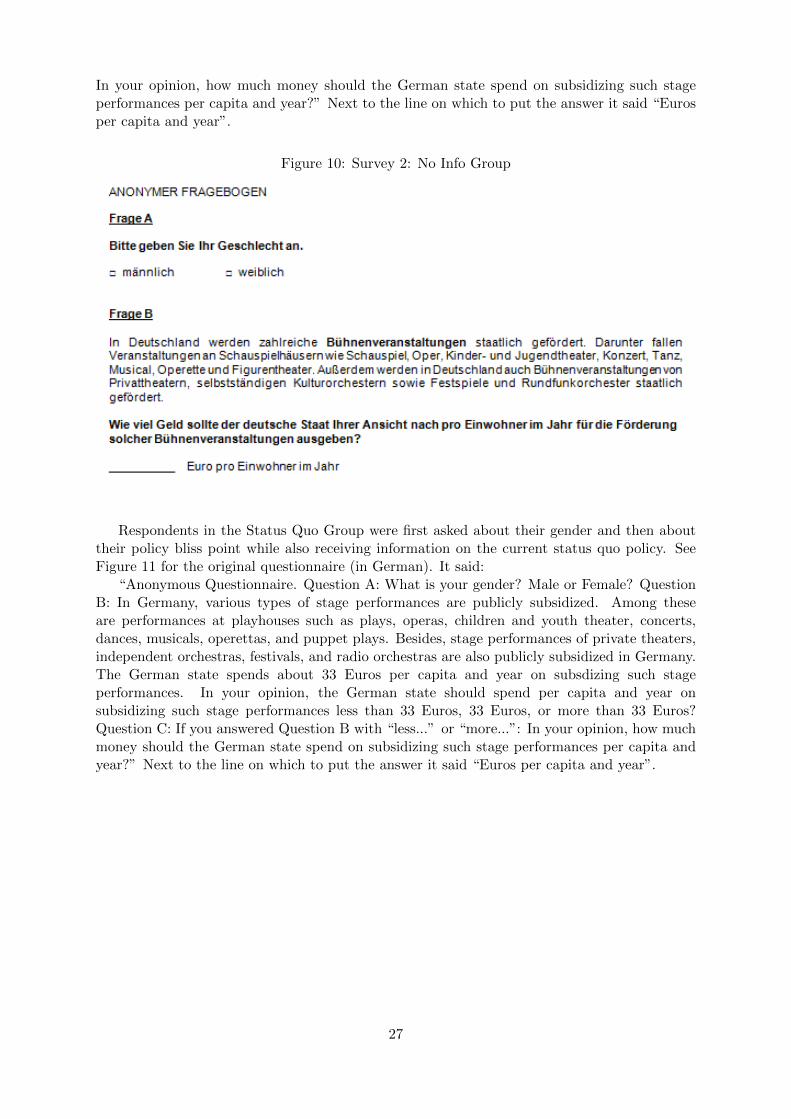
In your opinion, how much money should the German state spend on subsidizing such stageperformances per capita and year?” Next to the line on which to put the answer it said “Eurosper capita and year”.
Figure 10: Survey 2: No Info Group
Respondents in the Status Quo Group were first asked about their gender and then abouttheir policy bliss point while also receiving information on the current status quo policy. SeeFigure 11 for the original questionnaire (in German). It said:
“Anonymous Questionnaire. Question A: What is your gender? Male or Female? QuestionB: In Germany, various types of stage performances are publicly subsidized. Among theseare performances at playhouses such as plays, operas, children and youth theater, concerts,dances, musicals, operettas, and puppet plays. Besides, stage performances of private theaters,independent orchestras, festivals, and radio orchestras are also publicly subsidized in Germany.The German state spends about 33 Euros per capita and year on subsdizing such stageperformances. In your opinion, the German state should spend per capita and year onsubsidizing such stage performances less than 33 Euros, 33 Euros, or more than 33 Euros?Question C: If you answered Question B with “less...” or “more...”: In your opinion, how muchmoney should the German state spend on subsidizing such stage performances per capita andyear?” Next to the line on which to put the answer it said “Euros per capita and year”.
27

Figure 11: Survey 2: Status Quo Group
Respondents in the Anchoring Group were first asked about their gender, then to give digitsof a phone number, and then about their policy bliss point without receiving any informationon the current status quo policy. See Figure 12 for the original questionnaire (in German). Itsaid:
“Anonymous Questionnaire. Question A: What is your gender? Male or Female? QuestionB: Please enter the last two digits of your phone number (landline, alternatively mobile) intothe box provided below. Question C: In Germany, various types of stage performances arepublicly subsidized. Among these are performances at playhouses such as plays, operas, childrenand youth theater, concerts, dances, musicals, operettas, and puppet plays. Besides, stageperformances of private theaters, independent orchestras, festivals, and radio orchestras arealso publicly subsidized in Germany. Now consider the two-digit number you put into thebox in Question B. In your opinion, the German state should spend per capita and year onsubsidizing such stage performances less than that number in Euros, exactly that number inEuros, or more than that number in Euros? Question C: If you answered Question C with“less...” or “more...”: In your opinion, how much money should the German state spend onsubsidizing such stage performances per capita and year?” Next to the line on which to put theanswer it said “Euros per capita and year”.
28

Figure 12: Survey 2: Anchoring Group
In all three versions some questions unrelated to this project followed.
B.3 Survey 3
The survey versions for the four groups of Survey 3 are presented one after another: No InfoGroup, Status Quo Group, Anchoring Group (i.e. phone anchor), Basic Anchoring Group (i.e.captcha anchor). The introductory screen was the same across all four versions (first screen ineach of Figures 13, 14, 15, and 16). It said: “Part 2 of 4 [the other survey parts belongedto other research projects by other researchers]: Performances on German Stages. In Germany,various types of stage performances are publicly subsidized. Among these are performancesat playhouses such as plays, operas, children and youth theater, concerts, dances, musicals,operettas, and puppet plays. Besides, stage performances of private theaters, independentorchestras, festivals, and radio orchestras are also publicly subsidized in Germany. In subsequentquestions all these performances will shortly be called “stage performance”. We are particularly
29

interested in your personal valuation of these stage performances and your attitude towards thembeing publicly subsidized. It is totally irrelevant for answering the questions if you yourself goto such stage performances are not. We are interested in your opinion in any case!”
Respondents in the No Info Group were directly asked about their policy bliss point withoutbeing given any information on the current status quo policy. See Figure 13 for screenshotsof the original survey questions (in German). The second screen said: “In your opinion, howmuch money should the German state spend on subsidizing such stage performances per capitaand year? Please give the amount in whole Euros.” On the right-hand side of the box it said“Euros per capita and year”.
Figure 13: Survey 3: No Info Group
Respondents in the Status Quo Group received information on the current status quo policyand were then asked about their policy bliss point. See Figure 14 for screenshots of the originalsurvey questions (in German). The second screen said: “The German state spends about 33Euros per capita and year on subsidizing such stage performances. In your opinion, the Germanstate should spend per capita and year on such stage performances more than 33 Euros, exactly33 Euros, or less than 33 Euros?” The order of the different answering options was randomizedacross respondents. If the respondent answered “more” or “less”, a third screen asking for theexact amount popped up: “In your opinion, how much money should the German state spendon subsidizing such stage performances per capita and year? Please give the amount in wholeEuros.” On the right-hand side of the box it said “Euros per capita and year”.
30
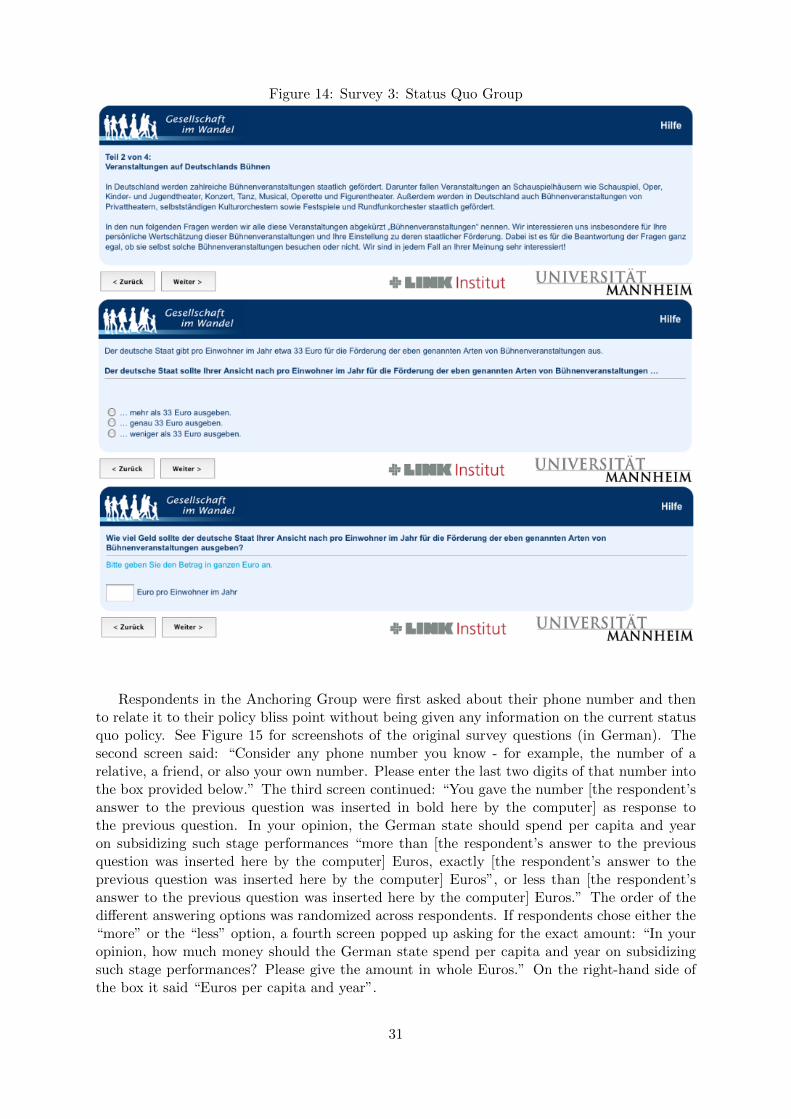
Figure 14: Survey 3: Status Quo Group
Respondents in the Anchoring Group were first asked about their phone number and thento relate it to their policy bliss point without being given any information on the current statusquo policy. See Figure 15 for screenshots of the original survey questions (in German). Thesecond screen said: “Consider any phone number you know - for example, the number of arelative, a friend, or also your own number. Please enter the last two digits of that number intothe box provided below.” The third screen continued: “You gave the number [the respondent’sanswer to the previous question was inserted in bold here by the computer] as response tothe previous question. In your opinion, the German state should spend per capita and yearon subsidizing such stage performances “more than [the respondent’s answer to the previousquestion was inserted here by the computer] Euros, exactly [the respondent’s answer to theprevious question was inserted here by the computer] Euros”, or less than [the respondent’sanswer to the previous question was inserted here by the computer] Euros.” The order of thedifferent answering options was randomized across respondents. If respondents chose either the“more” or the “less” option, a fourth screen popped up asking for the exact amount: “In youropinion, how much money should the German state spend per capita and year on subsidizingsuch stage performances? Please give the amount in whole Euros.” On the right-hand side ofthe box it said “Euros per capita and year”.
31

Figure 15: Survey 3: Anchoring Group
32

Respondents in the Captcha Group were first asked to complete a captcha question andthen about their policy bliss point without being given any information on the current statusquo policy. See Figure 16 for screenshots of the original survey questions (in German). Thesecond screen said: “The computer now shows you a random number.” The computer randomlyshowed one out of three pictures depicting 33, 66, or 99 according to the probability distribution66.66%-16.66%-16.66%. “Please enter this number into the box provided below. Then continueto the next question.” The third screen said: “In your opinion, how much money should theGerman state spend per capita and year on subsidizing such stage performances?” On theright-hand side of the box it said “Euros per capita and year”.
Figure 16: Survey 3: Captcha Group
Some questions unrelated to this project (also by other researchers) chosen by the Board ofthe GIP followed.
33