is it time to rethink teacher pensions in maryland?
TRANSCRIPT
Is It Time To Rethink Teacher Pensions In Maryland?
• • •
BY MICHAEL PODGURSKYDepartment of Economics
University of Missouri – Columbia
• • •
PUBLISHED BYThe Abell Foundation
111 S. Calvert Street, Suite 2300Baltimore, Maryland 21202
www.abell.org
In Cooperation With The Maryland Public Policy Institute
N O V E M B E R 2 0 0 6
....
....
....
....
....
....
....
....
....
....
....
....
....
....
....
....
....
....
....
....
.... Executive Summary ......................................................................................1
Introduction..................................................................................................3
How Defined Benefit and Defined Contribution Teacher Pensions Work ............................................5
Comparing Teacher Pension Plans ..............................................................7
Pension Plans, Teacher Retention, and Workforce Quality.......................15
Conclusion ..................................................................................................19
About the Author ........................................................................................21
References ..................................................................................................23
Endnotes .....................................................................................................25
Appendix A ..................................................................................................27
Contents


....
....
....
....
....
....
....
....
....
....
....
....
....
....
....
....
....
....
....
....
....
teacher pensions 1
Executive Summary
The 2006 legislative session in Maryland witnessed a major debate about the adequacyof teacher pensions. Advocates of increases in teacher pensions argued that the state’sdefined benefit plan was the “worst in the nation” and was hampering the recruitmentand retention of teachers. They also argued that Maryland was losing experiencedteachers to Pennsylvania, which purportedly had a more generous pension plan.
Such debates are not unique to Maryland. Many states are struggling to financeunder-funded teacher pension systems as well as recruit and retain a high-qualityteaching workforce. Thus a careful examination of the Maryland debate holds lessonsfor other states.
This paper compares Maryland’s former (prior to Spring, 2006) teacher pensionsystem to those in Pennsylvania and several other states. On the basis of simplereplacement rates, the former Maryland state plan was the lowest in the nation.However, such a simple comparison ignores other important facets of state plans:
• Maryland teachers are in the federal Social Security system, while teachers inmany other states are not. When Social Security benefits are included, Maryland’stotal retirement benefits compare much more favorably to those in other states.
• The teacher contribution rate in Maryland was very low relative to other states’,including Pennsylvania, which may be attractive for many young teachers.
• The cost-of-living adjustment in Maryland is more generous and reliable than inmany other states, including Pennsylvania.
• Compared to other states, the Maryland system provided more income up frontand less in later years. When the lifetime flow of income for a hypothetical teacherin five states is computed using standard financial methods, lifetime earnings inMaryland were not obviously out of line with lifetime earnings in other states.
As importantly, evidence from teacher labor market data does not suggest that teacherretention or quality is worse in Maryland than in Pennsylvania.
Increased state spending on defined benefit pension plans like Maryland’s is unlikelyto be a cost-efficient way to staff classrooms with qualified teachers. Given the highmobility of public school teachers, education policy makers should consider providingteachers with a defined contribution alternative to the current system – a plan thatwould “travel with” mobile teachers. Defined contribution plans predominate inprofessional labor markets in the private sector and in higher education.

2 teacher pensions
....
....
....
....
....
....
....
....
....
....
....
....
....
....
....
....
....
....
....
....
....“With school systems in much of the state facing teacher shortages,
the pension enhancements will be a recruitment and retentiontool, [MSTA President Foerster] said.
‘I believe that the human resource offices around the state havebeen waiting for this improvement and you can be sure that theyare going to be out there using this as a factor when they are tryingto recruit.’”
Montgomery Gazette, April 7, 2006
“‘We have a very poor teacher pension system, and it does affectour ability to retain and attract good teachers,’ said Del. MurrayD. Levy (D. Charles)”
Washington Post, December 18, 2005
“Their message arrives in more than 20,000 e-mails, in 60-secondradio spots airing statewide and in the busloads of educators whocome to lobby in Annapolis: Maryland teachers want betterretirement benefits, and they want to make a deal this electionyear, when the state’s wallet is fat.”
Washington Post, January 23, 2006

....
....
....
....
....
....
....
....
....
....
....
....
....
....
....
....
....
....
....
....
....
teacher pensions 3
School districts are under growing pressure to raise student achievement and narrowachievement gaps. In addition, the federal No Child Left Behind (NCLB) Act requires“highly qualified” teachers in core academic subjects in every public classroom. Schooldistricts that employ uncertified or emergency certified teachers may lose significantfederal funds. At the same time, school districts must cope with significant increases inemployee benefit costs. The sharp rise in health insurance costs is well documented.Less well known are the large unfunded liabilities for teacher pension plans. Almost allpublic school teachers in the United States are covered by traditional defined benefitpension plans, and states are under growing fiscal pressure to keep these traditionalpension systems afloat. Unfunded liabilities and demands for expanded retireebenefits are crowding out other spending for public schools.1 States and schooldistricts must determine how their limited compensation dollars can yield the highesteducational returns.
The 2006 Maryland legislative session illustrated the legislative challenges in this area.Legislators faced strong pressures from teacher unions and other education employeeorganizations to increase spending on the teacher pension system. Legislators weretold that the Maryland teacher pension system was the “worst in the nation,”hampering teacher recruitment. Unfavorable comparisons were made to Pennsylvania,where benefit rates were purportedly much higher. As a result of strong lobbyingpressures, the legislature allocated an additional $120 million to fund pension benefitincreases, retroactively raising benefit levels for recent retirees, and substantiallyincreasing teacher contribution rates – in effect payroll tax increases – for schooldistricts and current teachers.
In this paper, I examine claims regarding the former Maryland pension plan, inparticular its “competitiveness” and evidence on its effect on teacher recruitment andretention. While I focus on a system that has been replaced, the questions thatconfronted legislators in Maryland in 2006 are similar to those faced by legislators inmany other states. The 2006 Maryland debate represents the tip of a larger publicpolicy iceberg.2
Introduction


....
....
....
....
....
....
....
....
....
....
....
....
....
....
....
....
....
....
....
....
....
teacher pensions 5
Public school teachers are almost universally covered by traditional “defined benefit”(DB) pension systems. Such plans were the norm in both the public and privatesector until recent decades, but the private sector has largely moved to definedcontribution (DC) plans, particularly for professionals. In a DB system, the employerhas an obligation to provide a regular retirement check to employees who haveretired. Employee and employer contributions go into a fund that is supposed to beactuarially sound: at any point in time there is supposed to be enough money in thefund to pay for all current and future liabilities, although this is rarely the case. Moststates’ teacher pension systems have large unfunded liabilities (NASRA, 2006).
Typically, a DB teacher pension plan requires contributions from both teachers andemployers. During the 2005-06 school year, Maryland teachers contributed 2 percentof their pay, and school districts paid 9.35 percent, for a total of 11.35 percent.
GLOSSARY
Defined Benefit Pension Plan. A plan that guarantees a fixed paymentupon retirement based on a formula combining years of service with salaryprior to retirement. At any point in time, teacher pension plans are supposedto have sufficient assets to cover the payments of current retirees as well asaccrued liabilities for current employees.
Defined Contribution Pension Plan. In this plan the employer does notguarantee the employee a fixed payment upon retirement. Rather, theemployer agrees to contribute a fixed payment into an individual retirementfund for the employee while he is employed. The employee has some choiceas to how these funds are invested. If she quits before retirement age, thefund is portable and travels with the employee.
Teachers become eligible for a full pension based on a combination of age and yearsof service. In both Maryland and Pennsylvania, teachers are eligible for full pension if they reach the age of 62 or have 35 years of service at any age. In fact, under nearlyall state teacher pension systems, teachers can retire at any age – often in their mid-fifties – if they have put in the requisite years of service (usually 30-35).3 In the Social Security system, by contrast, employees face reduced payments if they retirebefore age 65.
How Defined Benefit and Defined ContributionTeacher Pensions Work

6 teacher pensions
....
....
....
....
....
....
....
....
....
....
....
....
....
....
....
....
....
....
....
....
....Benefits at retirement are usually determined by a formula of the following sort:
Annual Benefit = (years of service) x (final average salary) x M,
where final average salary is the average of the last several years of salary and M is aproportion. Under the old formula, Maryland teachers earned 1.4 percent for eachyear of teaching service.4 Thus, a teacher with 30 years experience would havereceived the following annual pension:
Annual Benefit = 30 x $60,000 x .014 = $25,200.
The Maryland multiplier of 1.4 percent was quite a bit below Pennsylvania’s (2.5percent) – a point emphasized by the Maryland teacher unions in their lobbyingcampaign.
In a defined contribution (DC) plan – now the norm in the private sector (EBRI,2006) – the employer merely agrees to contribute a fixed amount annually to aretirement account for an employee. For example, a common arrangement is for theemployer to contribute 5 percent of an employee’s salary and match employeecontributions up to an additional 5 percent. These contributions go into a retirementaccount solely for that employee. If the employee quits, the fund goes with her. Theemployer is under no obligation to provide a specific payment to the employee at thetime of retirement.
DC plans are particularly attractive for professionals who tend to change employersfrequently or who go into self-employment and back. Not surprisingly, given theirrelatively high rates of professional mobility, DC plans (predominately TIAA-CREF)tend to be the norm in public and private higher education institutions.
....
....
....
....
....
....
....
....
....
....
....
....
....
....
....
....
....
....
....
....
....
teacher pensions 7
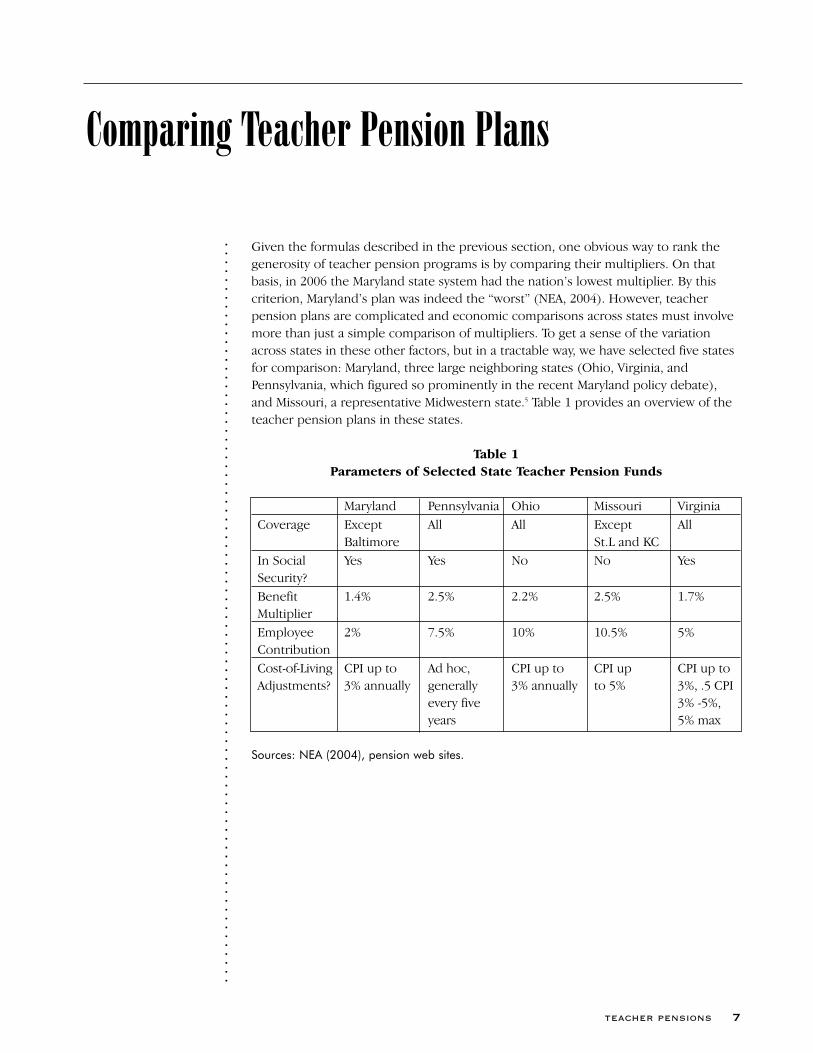
Given the formulas described in the previous section, one obvious way to rank thegenerosity of teacher pension programs is by comparing their multipliers. On thatbasis, in 2006 the Maryland state system had the nation’s lowest multiplier. By thiscriterion, Maryland’s plan was indeed the “worst” (NEA, 2004). However, teacherpension plans are complicated and economic comparisons across states must involvemore than just a simple comparison of multipliers. To get a sense of the variationacross states in these other factors, but in a tractable way, we have selected five statesfor comparison: Maryland, three large neighboring states (Ohio, Virginia, andPennsylvania, which figured so prominently in the recent Maryland policy debate),and Missouri, a representative Midwestern state.5 Table 1 provides an overview of theteacher pension plans in these states.
Table 1Parameters of Selected State Teacher Pension Funds
Maryland Pennsylvania Ohio Missouri VirginiaCoverage Except All All Except All
Baltimore St.L and KCIn Social Yes Yes No No YesSecurity?Benefit 1.4% 2.5% 2.2% 2.5% 1.7%MultiplierEmployee 2% 7.5% 10% 10.5% 5%ContributionCost-of-Living CPI up to Ad hoc, CPI up to CPI up CPI up to Adjustments? 3% annually generally 3% annually to 5% 3%, .5 CPI
every five 3% -5%,years 5% max
Sources: NEA (2004), pension web sites.
Comparing Teacher Pension Plans

8 teacher pensions
....
....
....
....
....
....
....
....
....
....
....
....
....
....
....
....
....
....
....
....
....Figure 1 shows the effect of the multipliers in Table 1 on actual pensions. For each
state, the left bar shows the pension for a teacher with a final average salary of$60,000 and 30 years’ teaching experience. Consistent with its “worst in the nation”label, Maryland ranked last among the five states, with a pension ($25,200) well belowthe other states’.
Figure 1Teacher Pension Benefits in Five States
Source: Calculations by author based on NEA (2004). Annual benefit for a teacher with finalaverage salary of $60,000 and 30 years of teaching experience. Left (solid) bars are statepensions only. Right (striped) bars include Social Security benefits.
However, ranking programs solely on the basis of their multipliers does not tell usthe whole story about how the systems compare. There are several other variablesthat must be considered in judging the attractiveness of a state teacher retirementsystem. These include Social Security coverage, teacher contributions, and cost ofliving adjustments.
$25,200
$30,600
$39,600
$45,000 $45,000
$42,642
$48,042
$39,600
$62,442
$45,000
$0
$10,000
$20,000
$30,000
$40,000
$50,000
$60,000
$70,000
MD VA OH PA MO

....
....
....
....
....
....
....
....
....
....
....
....
....
....
....
....
....
....
....
....
....
teacher pensions 9
Social Security Coverage
Maryland teachers are covered by the federal Social Security system along with thestate pension plan. Public school teachers in many other states are not. State and localemployees were originally excluded from the Social Security system when it was setup in 1935. Congress amended the Act in 1950 to permit states to arrange voluntaryentry of some or all state and local employees to enroll in the system. Some statesand districts chose to do so and some did not. (Mitchell et al., 2001). The result is acomplicated mosaic. In fourteen states few or none of the public school teachers arecovered by the federal Social Security system. For example, in Missouri, the teachersin the Kansas City and St. Louis school districts are in the Social Security system andhave their own separate pension funds. Teachers in the remaining 520 schooldistricts, roughly 90 percent of public school teachers in the state, are in a statepension fund and are not covered by Social Security. In Ohio no public schoolteachers are covered by Social Security.6 In Pennsylvania and Maryland, all teachers arein the Social Security system.
Obviously, as compared to teachers who are not in the Social Security system,teachers in the federal system do not require as large a payment from a state ordistrict pension plan to attain a given level of income upon retirement. Notsurprisingly, then, the benefit formulas of pension plans in which teachers are in theSocial Security system are generally lower than those for teachers who are not in thesystem. The two states that do not participate in Social Security, Missouri and Ohio,have the highest multipliers (2.2 and 2.5 percent respectively). Two states in SocialSecurity, Virginia and Maryland, have lower multipliers (1.7 and 1.4 percent).Pennsylvania is an outlier in this regard with both a high multiplier and Social Securitycoverage.
The second, striped set of bars in Figure 1 combines the state teacher pension withan estimate of Social Security benefits in our five states. Here we have computed theSocial Security benefit for a teacher retiring with 30 years’ experience and a $60,000salary (under a reasonable set of assumptions about salary growth over her career)and added it to the state pension benefit. Of course, the height of the two bars isidentical for Missouri and Ohio. Clearly, adding Social Security benefits substantiallyimproves the comparison between Maryland and the other states. Maryland is nowahead of Ohio and has approximate parity with Missouri. Since the dollar value of theSocial Security benefit is the same in all states, the proportionate gap betweenMaryland and Pennsylvania and Virginia is narrowed as well.

10 teacher pensions
....
....
....
....
....
....
....
....
....
....
....
....
....
....
....
....
....
....
....
....
....Teacher Contribution Rates
In all of our five states, as in most other states, teachers must contribute to thepension fund. Teacher contribution rates vary widely between states, but aregenerally higher in states not covered by Social Security. For example, the teachercontribution rate is 10 percent in Ohio and 10.5 percent in Missouri. Newly hiredteachers in Pennsylvania contribute 7.5 percent to their pension fund, whereas in theMaryland state system the contribution rate was just 2 percent – one of the lowestrates among the states. Of course, for teachers in the Social Security system, statepension contribution rates are in addition to the 6.2 percent federal payrolldeduction.
This variation in contribution rates produces significant variation in take-home payamong teachers with identical salaries in different states. We ignore state and localtaxes and imagine a teacher with starting pay of $35,000. Salaries grow relativelyquickly in the early stages of a teacher’s career for three reasons. First, teachersreceive automatic increases for seniority in salary schedules. Second, these salaryschedules reward Masters degrees, which teachers typically earn in their first decadeon the job. Finally, annual across-the-board pay increases inflate salaries at all pointsof the salary grid. As a result of these three factors, it is not unreasonable to assume a6 percent annual growth rate in a teacher’s salary over her first ten years on the job.
Figure 2 shows total estimated state pension contributions by a teacher in her firstdecade on the job in our five states assuming a 6 percent annual growth rate in salary.That is, the figure shows how much income is deducted from the paychecks of theseyoung teachers for their pensions. The left bar shows the simple sum ofcontributions over the first ten years of work. The right bar shows the same total, butwith contributions earning a 5 percent return. Cumulated over the first decade of ateacher’s career, differences between states are substantial. While retirementpayments differ considerably between the states, so do contributions young teachersmake to receive them. These are resources that might have been used to purchase ahome or make other family investments.

....
....
....
....
....
....
....
....
....
....
....
....
....
....
....
....
....
....
....
....
....
teacher pensions 11
Figure 2Value of Pension Contributions During First Ten Years of Employment
Source: Calculations by author. Teacher contributions only. Assumes $35,000 starting payand 6 percent nominal growth in salary over ten years. Left bar is the simple total. Right barassumes compound growth at 5 percent annual interest.
Thus, Maryland teachers receive a smaller (future) pension but have more take-homepay in their early years on the job. Pennsylvania teachers have less take-home pay inearly years and a larger pension at retirement. Other states fall in between.
In effect, Maryland and Pennsylvania offer teachers two different streams of payments– one front-loaded and the other back-loaded. Is there a summary way to comparethe two? In economics and finance the standard way to compare a flow of paymentsover time is to compute a discounted present value (DPV). Given an assumed interest(discount) rate, DPV tells us how much money would be needed right now to yield astream of future payments of the type observed. It reflects the fact that dollars in thefuture are worth less than dollars now. The interest or “discount rate” reflects thetime preferences of the teacher. A teacher who strongly prefers “cash now” will have ahigh discount rate. For example, to be willing to part with $100 now, she mightrequire $110 next year, implying a discount rate of 10 percent. A teacher who is morefuture-oriented will have a lower discount rate.7
$9,227
$23,066
$34,600
$46,133$48,439
$11,337
$28,342
$42,513
$56,684
$59,518
$0
$10,000
$20,000
$30,000
$40,000
$50,000
$60,000
$70,000
MD VA PA OH MO

12 teacher pensions
....
....
....
....
....
....
....
....
....
....
....
....
....
....
....
....
....
....
....
....
....Figure 3 shows the DPV of the earnings streams for our five states at two different
discount rates, reflecting different rates of time preference. At a low discount rate (3percent), the DPV of the MD payment stream ($1.17 million) is below that of all theother states. However, for teachers with a discount rate of 5 percent, the “cash upfront” structure of the Maryland system looks more and more attractive. At a 5percent discount rate, a Maryland teacher’s total discounted earnings is slightly lowerthan in Pennsylvania, but is higher than in the other three states.
Figure 3Discounted Present Value of Net Earnings and Pension Benefits
Source: Author’s calculations. Simulation assumes a beginning teacher salary of $35,000that rises by 2 percent each year. Zero inflation. Retirement after 35 years. Full pensionpayment until age 78.
These simulations assume that a teacher works for 35 years and then retires, all inone state. However, the turnover rate of teachers, particularly in their early years ofteaching, is quite high. National survey data from the National Center for EducationStatistics suggest that the exit rate from the profession is roughly 8 percent annually(although some of these are temporary exits, U.S. Department of Education, 2004).Thus, a more accurate estimate of the true value of these pensions to a young workerought to take account of the high likelihood that a new teacher will exit theprofession before she retires – a fairly complicated evaluation we have not

....
....
....
....
....
....
....
....
....
....
....
....
....
....
....
....
....
....
....
....
....
teacher pensions 13
undertaken here. However, one thing is clear. As the probability of actually collectinga pension drops, the Maryland pay-pension package becomes relatively moreattractive.
In sum, until 2006 Maryland provided a payment stream with more income up frontand less in retirement. Pennsylvania provided one with less income up front and amore generous pension. How a young teacher values this depends upon her rate oftime preference and how long she plans to remain in the profession. At even amodest discount rate or a conservative rate of exit, the gap in DPV between Marylandand other states is small.
Cost-of-Living Adjustment
The formulas described in the previous section fix teacher pensions as a fraction of ateacher’s final average salary that retirees (and their surviving spouses) are eligible toreceive for the rest of their lives. With inflation, of course, such defined benefitpayments shrink in value over time. Since teachers retire young, are predominantlyfemale, and on the whole tend to be healthier than the general workforce, they canexpect to collect their pensions for many years. For example, a teacher retiring at age55 (or her spouse) might expect to collect a pension payment for three decades orlonger. Clearly, if the payment is fixed in dollars at the time of retirement, its realvalue may be substantially eroded by three decades of inflation.
Thus, cost-of-living (COL) adjustments are an important feature of defined benefitplans. In this regard, the Maryland scheme is attractive. Each year teachersautomatically receive a COL adjustment of up to 3 percent (with a cumulative cap of80 percent). Pennsylvania, by contrast, has no automatic COL adjustment. Indeed, the“Retiree’s Handbook” on the Pennsylvania teacher pension fund’s web site containsthis sobering disclaimer:
The most frequently asked question is, “When will I receive a cost-of-living increase?” PSERS does not determine when a COL adjustmentshould be granted, nor do we determine the amount or terms of theincrease. The Pennsylvania Legislature determines all COLadjustment increases for PSERS retirees.
On average, a COL adjustment is enacted every 4-5 years. While thisis the average, it is no guarantee that it will always occur with thisfrequency.
Pennsylvania State Employee’s Retirement System. The RetiredMember’s Handbook. Publication 9775 (June, 2006).http://www.psers.state.pa.us/publications/rethb/rethb2006/COLA.htm

14 teacher pensions
....
....
....
....
....
....
....
....
....
....
....
....
....
....
....
....
....
....
....
....
....The DPV simulations in the previous section implicitly assumed that the pension
payments were fully indexed against inflation. However, now there is an additionalelement that we need to consider in computing the value of these pension plans –uncertainty about the real value of the Pennsylvania pension.8 This is a comparisonthat favors Maryland.
In addition, a four- or five-year COL adjustment, even if complete and certain,imposes considerable welfare loss as compared to an annual adjustment likeMaryland’s. Table 2 illustrates this point. Here we assume a 3 percent inflation rateand pensions starting at $30,000. Maryland adjusts its pension each year.Pennsylvania, by contrast, only adjusts every four years. As a result, as compared toMaryland retirees, the Pennsylvania retirees have uncompensated losses thatcumulate during the intervening years. Over the nine-year cycle illustrated in Table 2,the Pennsylvania retirees suffer a cumulative loss of $10,283 in inflation-adjusteddollars as a result of the lagged COL adjustment.
Table 2Real Income Losses Arising from Timing of COL
Adjustments in Maryland and Pennsylvania
COL RealYear Factor Maryland Pennsylvania Loss
1 1.000 $30,000 $30,000 $02 1.030 $30,000 $29,126 -$8743 1.061 $30,000 $28,278 -$1,7224 1.093 $30,000 $27,454 -$2,5461 1.000 $30,000 $30,000 $02 1.030 $30,000 $29,126 -$8743 1.061 $30,000 $28,278 -$1,7224 1.093 $30,000 $27,454 -$2,5461 1.000 $30,000 $30,000 $0
Cumulative Real Loss -$10,283
Source: Author’s calculations. Calculation assumes a 3 percent annualinflation rate. MD adjusts pensions each year whereas PA adjusts onlyevery four years.
....
....
....
....
....
....
....
....
....
....
....
....
....
....
....
....
....
....
....
....
....
teacher pensions 15
An economic argument in favor of defined benefit pension systems is that theyencourage workforce stability. While teacher pension contributions are “vested,”typically after five years, teachers who quit before retirement are penalized. A teacherwho works for fifteen years and then decides to quit teaching has two options. First,she can withdraw all of her contributions to the pension fund (with interest) andthen either pay taxes on them or roll them over into an IRA. In either case, she willlose all of the state’s contributions. Second, she can remain in the pension fund andcollect her pension at the regular retirement age, typically 62 or 65 – with benefitsbased on her salary at the time she quit. Thus, if she quits at age 40 earning $45,000,her pension at age 65 will be based on that same salary. Clearly her real purchasingpower will have been seriously eroded by 25 years of inflation.
There is some evidence in the research literature that defined benefit pension planslower worker turnover (Ippolito, 1997). However this literature focuses on thepresence or absence of a plan, not variations in the plans’ characteristics. There is noevidence that variation in defined benefit plans affects teachers’ turnover. Ironically,teachers have one of the most attractive defined benefit pension systems, yet teacherturnover remains very high, primarily due to high rates of turnover among youngteachers. There are two sources of this high turnover. First, some novice teacherssimply find that they prefer other work. At the margin, improved pension benefitsthirty or so years in the future are very unlikely to influence these decision makers. Asecond group is temporary exiters, sometimes called “stop outs.” These are womenwho leave temporarily, usually for family reasons, and then return. A typical exampleis a woman who has a baby, takes a period of leave for child rearing, and later returns.Again, the multiplier on a pension received in thirty years is not likely to affect herchild-rearing plans.
While there is a literature on teacher mobility and quality that examines the effect ofcurrent earnings, we were unable to find any studies that examine the effect ofteacher pensions.9 Therefore we examined data on teacher mobility and teacherqualifications from the 1999-2000 Schools and Staffing Surveys (conducted by theU.S. Department of Education), the most recent data available.10 We extracted therecords of all teachers from public (non-charter) schools in Pennsylvania andMaryland.
The original sample of teachers was interviewed in spring 2000 and the surveyprovided extensive data on school and teacher characteristics. School administratorswere then contacted in spring 2001 and asked about the status of the teachers
Pension Plans, Teacher Retention, andWorkforce Quality
16 teacher pensions
....
....
....
....
....
....
....
....
....
....
....
....
....
....
....
....
....
....
....
....
....interviewed in spring 2000. In particular, teachers were classified as stayers (in the
same school), movers (those who moved to another teaching job), and those who left teaching.
Data on teacher retention in Pennsylvania and Maryland are presented in the firstthree columns of Table 3 (statistical details are in Appendix A). The first columnreports the simple difference between Maryland and Pennsylvania with no othercontrols. The statistic labeled “Maryland” in column (1) (.105) indicates that thesimple retention rate was roughly 10 percent higher in Maryland than Pennsylvania.However, the low t-value also shows that the difference was not statistically significant.Thus, the SASS data overall indicate no significant statistical difference in teacherturnover between the two states.
A large literature shows that working conditions and pay have significant effects onteacher retention (e.g., Hanushek, Rivkin, and Kain, 2003; Podgursky, Monroe, andWatson, 2004). Our estimates in columns (2) and (3) control for pecuniary and non-pecuniary factors that may affect a teacher’s decision to remain in the profession.When we do this the difference in turnover between the two states drops toapproximately zero (-.011) and is statistically insignificant. We re-estimated the modelfor teachers 35 or younger (column 3). In this case the Maryland retention ratedifference turned positive and statistically significant (weakly so, at 10 percent). Thus,there is no evidence that the Maryland pension system hampers teacher retention inMaryland. In fact, the retention of young teachers is somewhat higher in Maryland –perhaps a reflection of their higher take-home pay.

....
....
....
....
....
....
....
....
....
....
....
....
....
....
....
....
....
....
....
....
....
teacher pensions 17
Table 3 Labor Effects of Teacher Pensions:
Maryland and Pennsylvania Teachers(Absolute value of t-statistic in parenthesis)
Dependent Variable = Dependent Variable =
Teacher Retention (2000 to 2001) Certified in Primary Teaching Field
(1) (2) (3) (4) (5) (6)
All All Teachers All All Teachers
Teachers Teachers < 36 Teachers Teachers < 36
Maryland .105 -.011 .055* -.009 -.016 -.001
(1.02) (.70) (1.77) (.59) (.80) (.04)
Other No Yes Yes No Yes Yes
Covariates
Sample Size 1406 1119 353 1406 1119 353
Source: 1999-2000 Schools and Staffing Surveys. Other covariates – retention - model 2:female, black, white, total experience up to cubic, annual school earnings, pct minorityenrollment at school, pct FRL at school, urban, suburban; retention model 3 dropsexperience terms. Not Certified models 2 and 3 identical to retention except thatexperience^2 and experience^3 are excluded. Note that the sample includes all Marylandteachers, including Baltimore.
We then examined a simple measure of teacher quality available in SASS – whether the teacher is certified in her primary teaching area. Staffing classrooms withappropriately certified teachers is a challenge for many schools districts. If theMaryland pension system hampers teacher recruitment we would expect to seesignificantly lower rates of certified staffing than in Pennsylvania. The results in Table 3show that there are no statistically significant differences in certified staffing ratesbetween Maryland and Pennsylvania, either for the entire workforce or young teachers,controlling for pay and teacher and school characteristics.
In sum, in spite of the lower pension benefits, or perhaps because of them, theretention rate for young teachers is somewhat higher in Maryland than in Pennsylvania.There is no detectable difference in the two states’ ability to recruit and retain certifiedteachers.


....
....
....
....
....
....
....
....
....
....
....
....
....
....
....
....
....
....
....
....
....
teacher pensions 19
The 2006 Maryland legislative session witnessed a major debate about thecompetitiveness of the state teacher pension system. Proponents of an increase inpension benefits argued that the state plan was the “worst in the nation” and that itwas hampering the recruitment and retention of teachers. This paper provided aneconomic analysis of defined benefit teacher plans and compared the formerMaryland state system to teachers’ pensions in several other states.
On the basis of a simple replacement rates, the former Maryland state plan was thelowest in the nation. However, such a simple comparison ignores other importantfacets of state plans. Maryland teachers are in the federal Social Security system andteachers in many other states are not. When Social Security and the state pension arecombined a retiree’s income easily matches that in states where teachers are notcovered by Social Security. In addition, the teacher contribution rate in Maryland wasvery low relative to other states’ (including Pennsylvania), which means that teachersin Maryland had more take-home pay in the early years of their teaching career. Thismay appeal to teachers who do not expect to remain in the profession untilretirement, or who prefer more of their pay “up front.” Evidence from teacher labormarket survey data does not suggest that teacher retention or quality is worse inMaryland than in Pennsylvania.
The unfunded liabilities of state and local teacher pension systems are substantial. In2005 these were estimated at $1.5 billion in the Maryland state teacher plan.11 Thenew, more generous payments are likely to increase those liabilities. Our evidencesuggests that these back-loaded benefits may do little to help schools recruit a highquality teaching workforce.
However, our analysis is preliminary and further research would be most useful. Inparticular, the following questions might be addressed in future research:
• What Maryland and Pennsylvania data are available from state agencies that wouldpermit analysis of teacher mobility between the states? Is Maryland on net losingteachers to Pennsylvania? Have changes in the pension system affected these netmigration rates?
• What are the costs of teacher retiree pensions and retiree health insurance inMaryland and how do these compare to costs in other states? How are theseexpected to grow in coming years?
• How has the Maryland teacher retirement benefit package above affected teacherrecruitment and retention? Is this the most efficient compensation package tostaff public schools with qualified teachers, or would alternatives be more cost-effective?
Conclusion and Issues for Further Research

20 teacher pensions
....
....
....
....
....
....
....
....
....
....
....
....
....
....
....
....
....
....
....
....
....Finally, Maryland education policy-makers should consider alternative pension options
for their new teachers. Over the past several decades, private sector employers haveshifted dramatically toward defined contribution systems, particularly for their mobileprofessional employees. Currently, defined-contribution plans predominate in theprivate sector. For decades, TIAA-CREF has operated defined contribution funds forhigher education.12 Although systematic data are not available, defined contributionplans also seem commonplace in independent private k-12 schools.
Education decision makers should consider phasing in defined contribution optionsfor new public school teachers. A defined contribution system is ideally suited foryoung mobile teachers. The current defined benefit system hampers teacher mobilityacross states or pension systems. It also penalizes teachers who leave the workforcefor family reasons. Since state pensions typically have five-year vesting provisions (insome states it is even ten years), young teachers who teach for a few years and moveto other professions lose all state contributions toward retirement. The recent reportof the Governor’s Commission on Quality Education took note of these portabilityproblems and called for pension system reform:
For new teachers and veteran teachers interested in making theshift, Maryland should supply a competitive and completely portablepension plan, giving educators the option of “taking their retirementwith them” (Maryland Office of the Governor, 2005, p. 19).
It is also possible to restructure defined benefit pension plans in ways that reduce oreliminate the penalties for teachers who quit before traditional retirement age. Forexample, along with a defined contribution option for new teachers, the Ohio teacherpension system has implemented a “cash balance” option for its defined benefit planteachers who leave the system short of retirement age.
One way or another, states will need to bail out their under-funded pension systemsin coming years. As they also struggle to raise student achievement and meet NCLBstaffing requirements for “highly qualified teachers,” reform of these costly pensionsystems deserves careful scrutiny.
....
....
....
....
....
....
....
....
....
....
....
....
....
....
....
....
....
....
....
....
....
teacher pensions 21
Michael Podgursky is Professor of Economics at the University of Missouri – Columbia.He has published numerous articles and reports on education policy and teacherquality. The primary focus of recent work has been on personnel policies in schoolsand their effects on teacher quality. His work on education has been supported by thefederal and state agencies as well as various private foundations. He serves on theboard of editors of Education Finance and Policy, and technical advisory boards fornumerous education organizations, including the National Center for EducationStatistics, the National Research Council, the National Center for Teacher Quality,American Board of Certification of Teacher Excellence, the National Center forEducation Accountability, and Mathematica Policy Research. Dr. Podgursky is a co-investigator at the National Center for Performance Incentives at Vanderbilt Universityand the Center for Analysis of Longitudinal Data in Education Research at the UrbanInstitute. He is on the Board of Directors of the Missouri Show Me Institute, a publicpolicy think-tank.
The Maryland Public Policy Institute
Founded in 2001, the Maryland Public Policy Institute is a nonpartisan public policyresearch and education organization – a think tank - that focuses on state policyissues. Its goal is to provide accurate and timely research analysis of Maryland policyissues and market these findings to key primary audiences.
The mission of the Maryland Public Policy Institute is formulate and promote publicpolicies at all levels of government based on the principles of free enterprise, limitedgovernment, and civil society. MPPI achieves its mission through research andpublications and outreach to the media and public policymakers. In order to maintainobjectivity and independence, the Institute accepts no government funding and doesnot perform contract research.
The Maryland Public Policy Institute can be found online at mdpolicy.org
About the Author


....
....
....
....
....
....
....
....
....
....
....
....
....
....
....
....
....
....
....
....
....
teacher pensions 23
References
Deloitte Research. 2006. Paying for Tomorrow: Practical Strategies for Tackling the PublicPension Crisis. http://www.deloitte.com/dtt/cda/doc/content/DTT_DR_PensionCrisis072006.pdf#search=%22%22paying%20for%20tomorrow%22%20deloitte%22
Employee Benefit Research Institute. 2006. “’Traditional’ Pension Assets Lost Dominance aDecade Ago, IRA’s and 401(k)’s Have Long Been Dominant.” (February).http://www.ebri.org/pdf/publications/facts/fastfacts/fastfact020306.pdf
Furgeson, Joshua, Robert Strauss, and William Vogt. 2006. “The Effects of Defined BenefitPension Incentives and Working Conditions on Teacher Retirement Decisions.” EducationFinance and Policy. Vol. 1 No. 3 (Summer), pp. 316-348.
Fore, Douglas. 2001. “Going Private in the Public Sector: The Transition from DefinedBenefit to Defined Contribution Pension Plans.” in Olivia Mitchell and Edwin Hustead (eds.)Pensions in the Public Sector. University of Pennsylvania Press, pp. 218-240.
Ippolito, Richard. 1997. Pension Plans and Employee Performance. Chicago: University ofChicago Press.
Maryland Office of the Governor. 2005. Governor’s Commission on Quality Education inMaryland. (September).
Mitchell, Olivia, David McCarthy, Stanley Wisniewski, and Paul Zorn. 2001. “Developments inState and Local Pension Plans.” in Olivia Mitchell and Edwin Hustead (eds.) Pensions in thePublic Sector. University of Pennsylvania Press, pp. 11-40.
National Association of State Retirement Administrators. 2006. Public Fund Survey.http://www.publicfundsurvey.org/publicfundsurvey/survey.asp
National Education Association. 2004. Characteristics of Large Public Education PensionPlans. Washington D.C.
Passantino, George and Adam Summers. 2005. The Gathering Pension Storm: HowGovernment Pension Plans Are Breaking the Bank and Strategies for Reform. Los Angeles:Reason Public Policy Institute (June).
Ruppert, Sandra C. 2001. Improving Pension Portability for K-12 Teachers. DenverColorado. State Higher Education Executive Officers (SHEEO) February.
U.S. Department of Education. National Center for Education Statistics. 2004. TeacherAttrition and Mobility: Results from the Teacher Follow Up Survey, 2000-01. (August).http://nces.ed.gov/pubs2004/2004301.pdf
USA Today. “U.S. Schools Face Death Spiral.” February 14, 2006. http://www.usatoday.com/news/opinion/editorials/2006-02-14-our-teachers-health_x.htm
Walsh, Mary Williams. “Public Pension Plans Face Billions in Shortages.” New York TimesAugust 8, 2006. http://www.nytimes.com/2006/08/08/business/08pension.html?_r=1&n=Top%2fReference%2fTimes%20Topics%2fPeople%2fW%2fWalsh%2c%20Mary%20Williams&oref=slogin


....
....
....
....
....
....
....
....
....
....
....
....
....
....
....
....
....
....
....
....
....
teacher pensions 25
Endnotes
1 The fiscal problems of these state pension system are beginning to attract public attention. Forexample, see USA Today, Walsh (2006). For good overview of the fiscal problems of these statesystems along with strategies for reform see Passantino and Summers (2005), and DeloitteResearch (2006).
2 One reviewer asked whether these legislative decisions can be reversed. The answer with respectto teacher pensions seems to be “only partly.” It might be possible for a subsequent legislativesession to take back what the 2006 session gave, but it would certainly face strong legal challenge.Pension benefits can be reduced for new employees. They cannot be reduced for retiredemployees. Whether they can be reduced for current employees is unclear. For a discussion of thispoint see Deloitte Research (2006, p. 9).
3 State pension plans often use a formula that combines years of service and age. For example, if age+ years of service equal 85 or more then the employee is eligible for full benefits.
4 This formula applied to teachers hired after June 1998. For teachers hired before this date, years ofservice prior to June 1998 had a lower multiplier. One can think of the example in the text as a“forward looking” formula, describing the benefit system for new hires.
5 A more complete list of state and district pension funds is found in NEA (2004). 6 Of course, if Missouri or Ohio teachers “moonlight” after school or during the summer in a private
sector job covered by Social Security they will qualify for pension benefits based on their earningsin the second job.
7 To take a simple example, the discounted present value of $20,000 paid 20 years from now at a 5percent rate of discount is $7,915. That is, if I took $7,915 and put it in the bank today earning a 5percent annual return, in twenty years I would have $20,000. At a 10 percent discount this futurepayment would be worth only $3,270 today. This shows that additional pension benefits (e.g., fromteaching in Pennsylvania versus Maryland) payable in the distant future are worth relatively little toyoung workers with high discount rates.
8 Apparently, the Pennsylvania COL adjustments are also ad hoc in that they are incomplete. “Thelast COLA was passed in 1998 and was equal to 1.86 percent per year, or roughly half the rate ofinflation since the previous COLA.” (Furgeson, Strauss, and Vogt, 2006, p. 324).
9 The only econometric study we were able to identify was Furgeson et al. (2006), who examine theeffect of a retirement incentive on teacher retirement behavior in Pennsylvania. They found thatteachers’ retirement decisions were highly responsive to changes in the years of service requiredfor full retirement benefits. However, they did not examine effects on recruitment or retention ofyounger teachers.
10 A more recent survey of SASS was conducted in 2003-04, but these data have not yet been released to researchers. A description of the SASS survey methods is found athttp://nces.ed.gov/surveys/sass/methods.asp
11 Maryland’s unfunded liabilities are modest compared to those of some other districts and states:Chicago ($2.8 billion), California ($24.2 billion), Missouri ($ 4.8 billion), and Ohio ($20.1 billion).See NASRA (2006).
12 Data from a 2005 faculty survey conducted by TIAA-CREF show that 75 percent of public and 89percent of private college professors report that their institution sponsors a defined contributionretirement plan. Tabulations were provided by TIAA-CREF to the author.


....
....
....
....
....
....
....
....
....
....
....
....
....
....
....
....
....
....
....
....
....
teacher pensions 27
Appendix A
Regression Analysis of Teacher Turnover
To examine whether the Maryland pension system hampered teacher recruitment andretention, we estimated a simple model of teacher turnover that compares teacherturnover in Maryland and Pennsylvania holding constant pay, teacher characteristics,and school and community variables that have been found to affect teacher turnover.
The dependent variable in our model is whether a teacher remained in the teachingprofession between spring 2000 and spring 2001 (1 = yes). We estimated a simplelinear probability model:
Pr (remained in teaching) = B0 + B1 current salary + B2 teacher characteristics+ B3 school characteristics + B4 MD teacher. (1)
If low pension benefits in Maryland hamper teacher retention, then we would expectthat, controlling for current salary and other working conditions, B4 < 0. However, ifwe estimate equation (1) for young teachers and the typical young teacher significantlydiscounts future pension benefits, we might expect B4 > 0. This is because the higherpension benefits in PA are financed in part by higher payroll deductions. While we arecontrolling for gross pay, net pay will be higher in MD.
School districts must recruit appropriately certified teachers for their classrooms. If theless remunerative Maryland pension system hampered recruitment of teachers, wewould expect that, other things being equal, Maryland schools would have relativelymore uncertified teachers than Pennsylvania. To test this hypothesis, we estimated thefollowing model:
Pr (certified in primary teaching area) = C0 + C1 current salary + C2 teachercharacteristics + C3 school characteristics + C4 MD teacher. (2)
The dependent variable takes the value 1 if the teacher is appropriately certified (0 otherwise). As with retention, we control for current salary and other teacher andschool variables that may be related to recruitment. If the Maryland pension systemhampered recruitment of qualified teachers we would expect to find C4 < 0.
OLS estimates of B4 and C4 are reported in Table 3.
