irrigation system and pattern of crop combination, concentration … · keywords: crop combination,...
TRANSCRIPT

The NEHU Journal, Vol XV, No. 2, July-December 2017,
ISSN. 0972 - 8406
Irrigation System and Pattern of Crop Combination,Concentration and Diversificationin Barddhaman
District, West Bengal
KSHUDIRAM CHAKRABORTY* & BISWARANJAN MISTRI**
_____________________________________________________________________________
*Kshudiram Chakraborty ([email protected]),is a Ph.D. Research Scholar inDepartment of Geography, University of Burdwan, Burdwan, West Bengal.
**Biswaranjan Mistri ([email protected]),is an Assistant Professor in Department ofGeography, The University of Burdwan, Burdwan, West Bengal.
Abstract
In West Bengal, 53% of Net Shown Area (NSA) is cultivated underpaddy. In Barddhaman, 97% of Gross Cropped Area (GCA) is usedfor cultivation of paddy and there is also aninter-block difference inthe pattern of combination, intensification and diversification ofcrops.Using District Statistical Handbook, 2013 and Census reportof Barddhaman, 2001, an attempt is made in this paper to find outthe suitable cropping pattern in Barddhaman, West Bengal. Thepaper argues that the type of irrigation and soil health determinethe combination of crop in the district.
Keywords: Crop Combination, Crop Concentration, CropDiversification, Groundwater irrigation and Fertility of Soil
1.0. Introduction
Agriculture plays a dominant role in economic development through supplyingfood for the nation, generating opportunities of employment, and sharing ofnational GDP as well as providing raw materials for agro-based industries(Johnstone and Mellor, 1961). In India, 60% of people are dependent onagriculture (Paul, 2015). After green revolution in India (1966-67), chemicalfertilizer is being used to improve productivity along with high yield varietyseeds, pesticides and irrigation (Snapp et al., 2010; Chattopadhyey, 1984).During this period, mono-crop cultivation has been over emphasized whichin turn destroyed the traditional crop sequence, crop calendar and crop rotation
pp.45-65
The NEHU Journal, Vol XV, No. 2, July-December 2017,
ISSN. 0972 - 8406
(Thapar, 1973). Consequently, agricultural landuse has drastically beenchanged from multicrop (cereals,oil seeds, pulses) to mono crop (paddy orwheat). In pre-green revolution period, rice was the dominant crop of WestBengal in general and of Barddhaman in particular. Noticeably, gram wasfound as second dominant crop in the district in 1950-52 (Bhatia, 1965). But,in 2013, 97% of gross cropped area in Barddhaman is earmarked only forrice through obliterating earlier cropping system of oil seed and pulses.
Crop rotation and diversification were practiced intraditional systemof farming to control weeds, pest and soil erosion, and to maintain soil fertility(Singh and Sidhu, 2004; Jodha and Singh, 1990; El-Nazer and McCarl,1986;Battese and Fuller, 1972; Brust&Stinner, 1991; Summer, 1982;Leibman&Dyck, 1993; Blanco-Canqui&Lal, 2004). Diversity of crops helpsto sustain functional capacity and resilience in agro-ecosystem throughincreasing biodiversity along with performance of genotype in different niches(Vandermeer et al. 1998; Brust and Stinner, 1991; Sumner, 1982).Diversification of crops includes all crops other than rice (Husain, 1996;Metzel and Ateng, 1993) whereas horizontal diversification of agricultureinvolves various activity or cultivation of differentcrops in a calendar (Taylor,1994). Level of crop diversification is dependent on geo-climatic or agro-climatic, socio-economic and technological advancement of a region (Husain,1996; Quasem and Rehman, 1993; Singh and Dhillon, 1984).
During 1965-71, 49.7% area under pulses declined in Punjab to flourishwheat-paddy system (Thapar, 1973). Adverse consequences of this systemare deceleration in productivity, unemployment in agriculture, over exploitationof ground water and declination in soil fertility (Sidhu and Johl, 2002; Singhet al., 1997). Recently, crop diversification has been mooted in Panjab toreplace winter wheat with oil seed or pulse to restore nitrogen balance in soiland sound economic as well as societal benefit (Editorial, EPW, 2002).
The study of combination of crops is an important tool to assess thedistribution of cropping system to assess suitable combination of crops(Weaver, 1954). Greater the dominance of a crop, the lesser is the competitionamong crops in an areal unit (Bhatia, 1965; Singh and Dhillon, 1984).Specialization of crop is not desirable as it leads to loss of productivity, declineof fertility of soil, outbreak of pest and pathogen (Quasem and Rahman,1993; Husain, 1996; Lin, 2011; Singh and Dhillon, 1984; Zohir, 1993).Hence,combination, concentration and diversification of crops are important tools inagricultural regionalization to find out the specificity of crops, causes of
46 IRRIGATION SYSTEM AND PATTERN OF...
The NEHU Journal, Vol XV, No. 2, July-December 2017,
ISSN. 0972 - 8406
specialization and remedies for agro-ecosystem. The objectives of theresearch study are to find out the combination of crops, concentration andcrop land occupancy of rice (aman and boro) and potato along withdiversification of crops in Barddhaman District.
2.0 Study Area
The geographical area of Barddhaman District is 7024 sq km. The district isconstituted of six sub-divisions and 31 C.D. Blocks.During last five decades,population density has been increased 342% from 312 persons/sq. km in1961to 1099 persons/sq. km in 2011 (Census of India, 1951, and 2011). Theprincipal crop of the district is rice which is cultivated in 97% of the grosscropped area. The net sown area is 4328 sq. km (61.61%) with physiologicaldensity of 79 cultivators/sq km.
2.0. Materials and Method
Materials
The research study has been done using secondary data of District StatisticalHandbook of Burdwan, (2013), collected from Bureau of Applied Economicand Statistics, Government of West Bengal. The data on facilities of irrigationhas been taken from village directory of Census of India, Government ofIndia, (2001).
Methods
Calculation for Regionalization of Agriculture
The collected data have been calculated to find out the regions of agricultureon crop combination (Weaver, 1954), concentration, diversification andintensityusing following equations.where, CC= Crop combination“d2= difference between the actual crop percentage in a given unit andthe percentage in the theoretical distribution,n= the number of crops in a given combination (Weaver, 1954; Singhand Dhillon, 1984). where, C =crop concentrationCi= crop concentration indexPae=% of the crop ‘a’ to the total harvested area in an enumeration unitPar=% of crops a to the total harvested area in the entire region
KSHUDIRAM CHAKRABORTY & BISWARANJAN MISTRI 47
The NEHU Journal, Vol XV, No. 2, July-December 2017,
ISSN. 0972 - 8406
where, CD= Crop diversificationc= %of total harvested area under ‘n’ cropsn= crops are those which individually occupy 5% or more of the totalharvested area (Singh, 1984) where, aij=area under the ith crop in the jth yearaio= area under the ith crop in the base yearNi=net area shown in the jth yearNo=net area shown in the base year, (Hasain, 1996 ) where, Cci= Sharing of canal irrigation aci = area under canal irrigation til= total irrigated land where, Cgr=Sharing of ground water irrigation agr =area of ground water irrigationtil= total irrigated landRepresentation
Linear and multiple regression have been done in MS excel, 2007 and Statistica10.0 respectively. Thematic maps is prepared using Map Info 7.0. Correlationbetween variables has been calculated and tested its significance at N-2degree of freedom [N-2=(31-2)=29].
3.0. Results
3.1. Crop Combination in Barddhaman District
After detail analysis of crop combination in BarddhamanDistrict, only rice(aman) has been found as suitable crop in Salanpur, Barabani, Jamuria,Pandabeswar, and Raniganj Blockswhere cultivation of rice is marginal withrain water and cultivation in rabi is not possible due to availability of waterand low fertility of soil. Only rice (boro) has been observed as favourablecombination in Faridpur-Durgapur Block because boro cultivation is dominantwith tank irrigation. Rice (aman) is the convenient combination of crop inKanksa, Ausgram - II, Bhatar, Galsi - II, Manteswar and Memari II due tosharing of more than 70% of GCA in aman. Rice-rice (aman-boro) is thepertinent crop combination in Burdwan I, Burdwan II, Raina I, Kalna I,Purbasthali I, Ketugram - I, II, Katwa I, II, Mangolkote and Galsi - II because
48 IRRIGATION SYSTEM AND PATTERN OF...
The NEHU Journal, Vol XV, No. 2, July-December 2017,
ISSN. 0972 - 8406
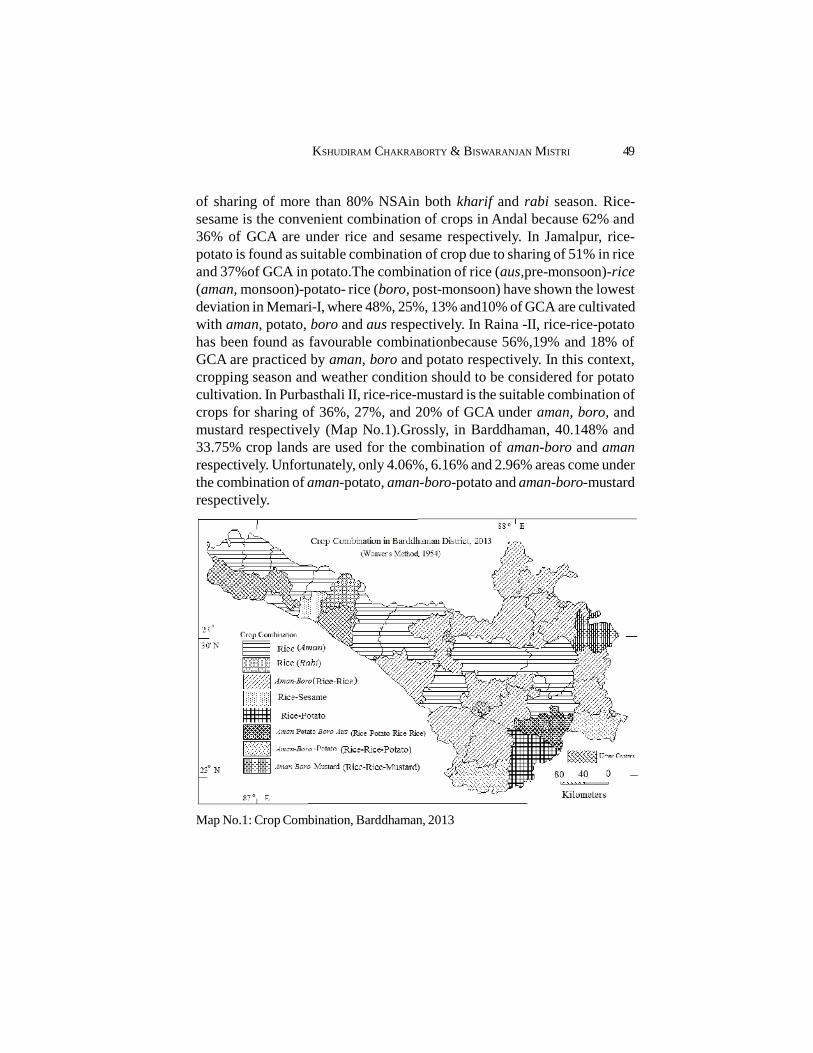
of sharing of more than 80% NSAin both kharif and rabi season. Rice-sesame is the convenient combination of crops in Andal because 62% and36% of GCA are under rice and sesame respectively. In Jamalpur, rice-potato is found as suitable combination of crop due to sharing of 51% in riceand 37%of GCA in potato.The combination of rice (aus,pre-monsoon)-rice(aman, monsoon)-potato- rice (boro, post-monsoon) have shown the lowestdeviation in Memari-I, where 48%, 25%, 13% and10% of GCA are cultivatedwith aman, potato, boro and aus respectively. In Raina -II, rice-rice-potatohas been found as favourable combinationbecause 56%,19% and 18% ofGCA are practiced by aman, boro and potato respectively. In this context,cropping season and weather condition should to be considered for potatocultivation. In Purbasthali II, rice-rice-mustard is the suitable combination ofcrops for sharing of 36%, 27%, and 20% of GCA under aman, boro, andmustard respectively (Map No.1).Grossly, in Barddhaman, 40.148% and33.75% crop lands are used for the combination of aman-boro and amanrespectively. Unfortunately, only 4.06%, 6.16% and 2.96% areas come underthe combination of aman-potato, aman-boro-potato and aman-boro-mustardrespectively.
Map No.1: Crop Combination, Barddhaman, 2013
KSHUDIRAM CHAKRABORTY & BISWARANJAN MISTRI 49
The NEHU Journal, Vol XV, No. 2, July-December 2017,
ISSN. 0972 - 8406
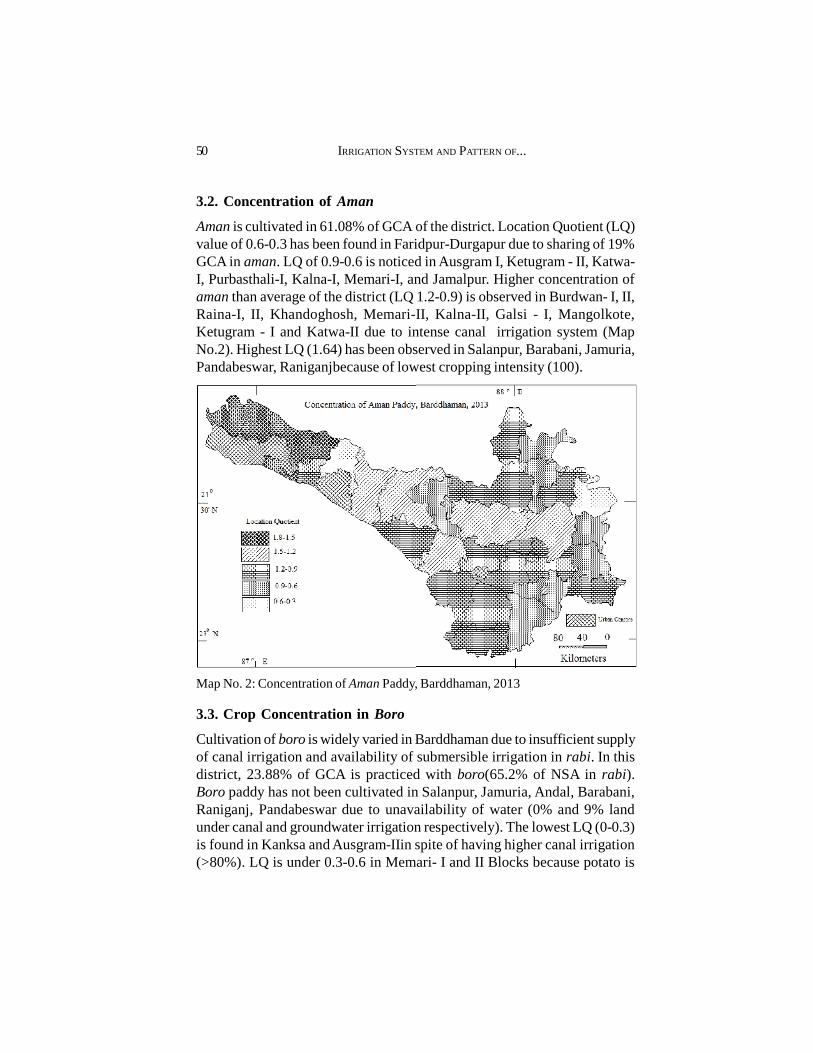
3.2. Concentration of Aman
Aman is cultivated in 61.08% of GCA of the district. Location Quotient (LQ)value of 0.6-0.3 has been found in Faridpur-Durgapur due to sharing of 19%GCA in aman. LQ of 0.9-0.6 is noticed in Ausgram I, Ketugram - II, Katwa-I, Purbasthali-I, Kalna-I, Memari-I, and Jamalpur. Higher concentration ofaman than average of the district (LQ 1.2-0.9) is observed in Burdwan- I, II,Raina-I, II, Khandoghosh, Memari-II, Kalna-II, Galsi - I, Mangolkote,Ketugram - I and Katwa-II due to intense canal irrigation system (MapNo.2). Highest LQ (1.64) has been observed in Salanpur, Barabani, Jamuria,Pandabeswar, Raniganjbecause of lowest cropping intensity (100).
Map No. 2: Concentration of Aman Paddy, Barddhaman, 2013
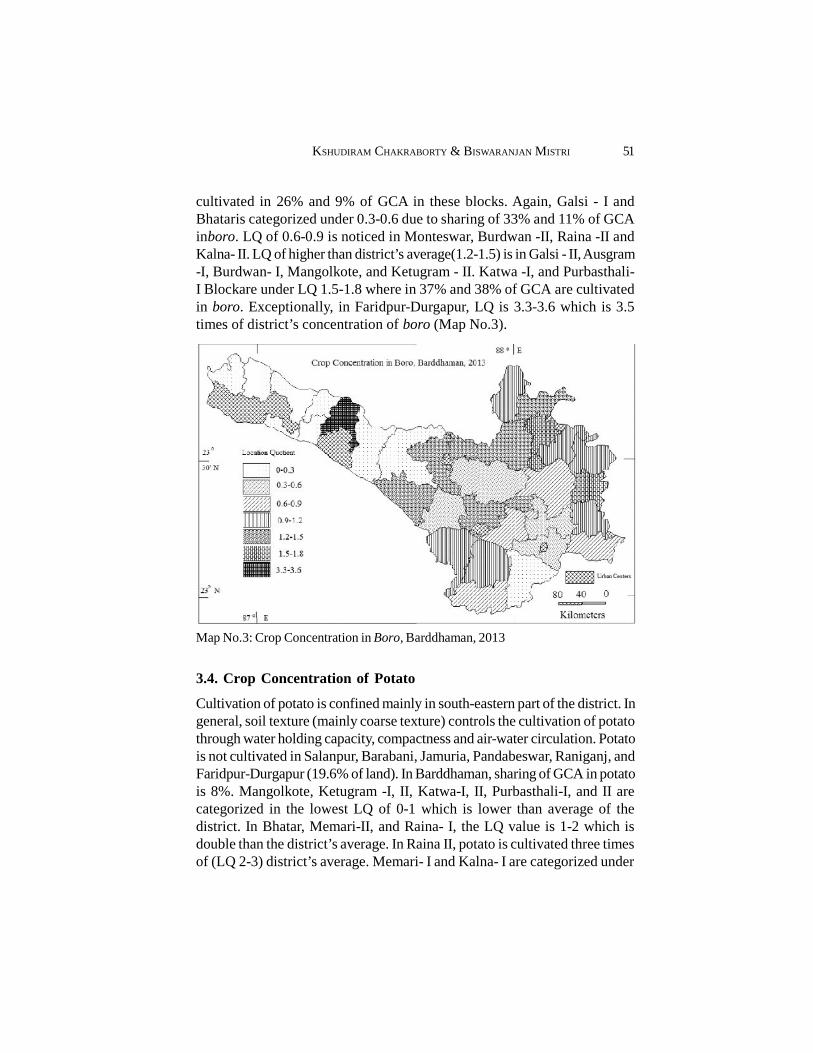
3.3. Crop Concentration in Boro
Cultivation of boro is widely varied in Barddhaman due to insufficient supplyof canal irrigation and availability of submersible irrigation in rabi. In thisdistrict, 23.88% of GCA is practiced with boro(65.2% of NSA in rabi).Boro paddy has not been cultivated in Salanpur, Jamuria, Andal, Barabani,Raniganj, Pandabeswar due to unavailability of water (0% and 9% landunder canal and groundwater irrigation respectively). The lowest LQ (0-0.3)is found in Kanksa and Ausgram-IIin spite of having higher canal irrigation(>80%). LQ is under 0.3-0.6 in Memari- I and II Blocks because potato is
50 IRRIGATION SYSTEM AND PATTERN OF...
The NEHU Journal, Vol XV, No. 2, July-December 2017,
ISSN. 0972 - 8406
cultivated in 26% and 9% of GCA in these blocks. Again, Galsi - I andBhataris categorized under 0.3-0.6 due to sharing of 33% and 11% of GCAinboro. LQ of 0.6-0.9 is noticed in Monteswar, Burdwan -II, Raina -II andKalna- II. LQ of higher than district’s average(1.2-1.5) is in Galsi - II, Ausgram-I, Burdwan- I, Mangolkote, and Ketugram - II. Katwa -I, and Purbasthali-I Blockare under LQ 1.5-1.8 where in 37% and 38% of GCA are cultivatedin boro. Exceptionally, in Faridpur-Durgapur, LQ is 3.3-3.6 which is 3.5times of district’s concentration of boro (Map No.3).
Map No.3: Crop Concentration in Boro, Barddhaman, 2013
3.4. Crop Concentration of Potato
Cultivation of potato is confined mainly in south-eastern part of the district. Ingeneral, soil texture (mainly coarse texture) controls the cultivation of potatothrough water holding capacity, compactness and air-water circulation. Potatois not cultivated in Salanpur, Barabani, Jamuria, Pandabeswar, Raniganj, andFaridpur-Durgapur (19.6% of land). In Barddhaman, sharing of GCA in potatois 8%. Mangolkote, Ketugram -I, II, Katwa-I, II, Purbasthali-I, and II arecategorized in the lowest LQ of 0-1 which is lower than average of thedistrict. In Bhatar, Memari-II, and Raina- I, the LQ value is 1-2 which isdouble than the district’s average. In Raina II, potato is cultivated three timesof (LQ 2-3) district’s average. Memari- I and Kalna- I are categorized under
KSHUDIRAM CHAKRABORTY & BISWARANJAN MISTRI 51

The NEHU Journal, Vol XV, No. 2, July-December 2017,
ISSN. 0972 - 8406
LQ of 3-4 where 26% and 30% of GCA are under potato cultivation. InJamalpur, the LQ of concentration of potato is 4-5 which is five times ofdistrict’s average because 38% of GCA is used for cultivation of potato usinggroundwater (Map No.4).
Map No.4: Crop Concentration, Barddhaman, 2013
3.5 Crop Land Occupancy of Paddy in Kharif Season
This is an indicator for assessing the percentage of land in a particular cropand more than 70% of crop land occupancy is called monoculture. In Salanpur,Barabani, Jamuria, Pandabeswar, and Raniganj Block, aman is cultivated in100% of GCA. So, there is monoculture in kharif season. Again, in 36.73%area of the district, monoculture is also practiced in Kanksa, Ausgram - II,Galsi - II, Bhatar, Monteswar, and Ketugram - I. Predominant category (50-70%) is foundin Galsi - I, Ausgram- I, Mangolkote, Katwa-I, II, Ketugram -II, Burdwan- I, II, Memari - II, Khandoghosh, Raina - I, II, Jamalpur andKalna- II. Memari - I, Kalna- I, and Purbasthali- II are identified as dominantland occupancy (30-50% of GCA). Major land occupancy (15-60%) in kharifhas been noticed in Faridpur-Durgapur (Map No.5). The occupancy of cropland of paddy is negatively related with diversification of crops (r=0.6797,p=<0.01).
52 IRRIGATION SYSTEM AND PATTERN OF...

The NEHU Journal, Vol XV, No. 2, July-December 2017,
ISSN. 0972 - 8406
Map No. 5: Crop Land Occupancy of Aman Paddy in Kharif, Barddhaman, 2013
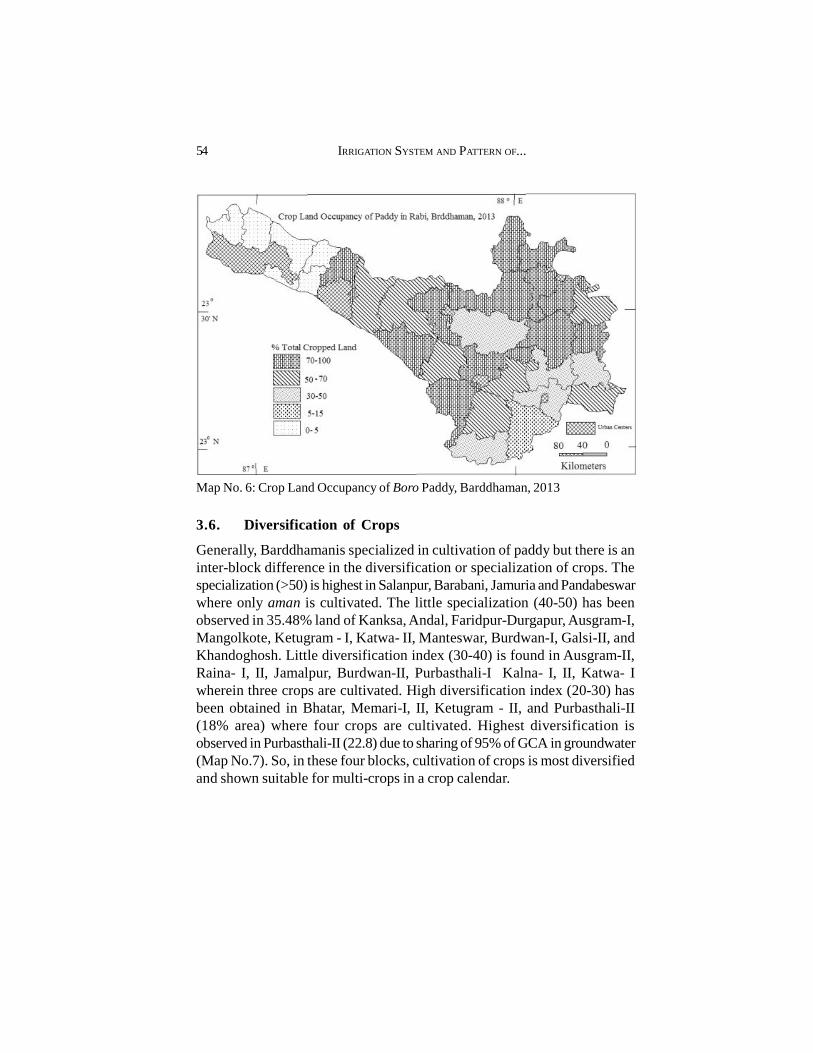
3.5. Land Occupancy of Boro Paddy
This is an index showing the sharing of area of paddy in rabi season. In thisseason, paddy is not cultivated in Salanpur, Barabani, Jamuria, Raniganj,Pandabeswer, and Andal. In Jamalpur, secondary land occupancy (5-15%land) has been observed in boro. Dominant category (30-50% of NSA inrabi) is noticed in Raina- II, Memari- I, II, Kalna-I, and Bhatar due topredominance canal irrigation. Predominant category (70-50%) has beenobserved in Kanksa, Ausgram - II, Raina- I, Burdwan- II, Kalna- II, andPurbasthali-II. Monoculture is practiced in 41.03% land of Galsi-I, Ausgram-I, Burdwan- I, Khandoghosh, Manteswar, Ketugram - I, II, Katwa-I, II,Purbasthali-I, and Faridpur-Durgapur (Map No.6). The crop land of boroispositively related with canal irrigation (r=0.3082, p=<0.1).
KSHUDIRAM CHAKRABORTY & BISWARANJAN MISTRI 53
The NEHU Journal, Vol XV, No. 2, July-December 2017,
ISSN. 0972 - 8406
Map No. 6: Crop Land Occupancy of Boro Paddy, Barddhaman, 2013
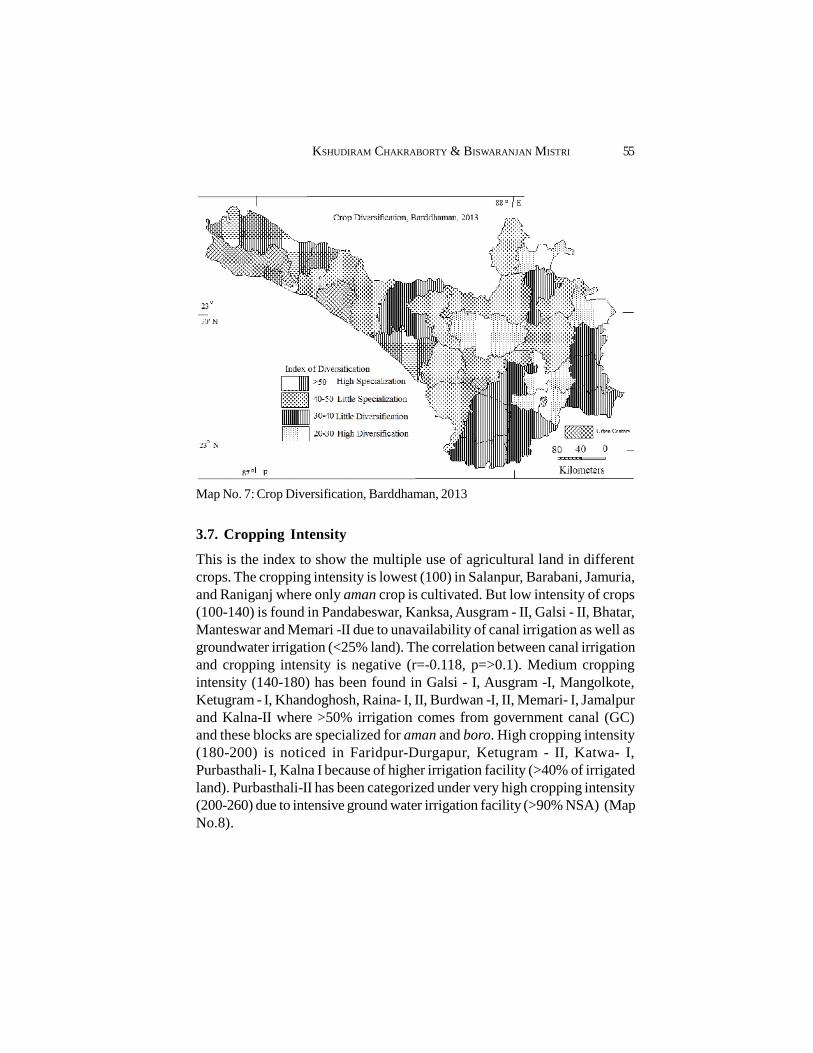
3.6. Diversification of Crops
Generally, Barddhamanis specialized in cultivation of paddy but there is aninter-block difference in the diversification or specialization of crops. Thespecialization (>50) is highest in Salanpur, Barabani, Jamuria and Pandabeswarwhere only aman is cultivated. The little specialization (40-50) has beenobserved in 35.48% land of Kanksa, Andal, Faridpur-Durgapur, Ausgram-I,Mangolkote, Ketugram - I, Katwa- II, Manteswar, Burdwan-I, Galsi-II, andKhandoghosh. Little diversification index (30-40) is found in Ausgram-II,Raina- I, II, Jamalpur, Burdwan-II, Purbasthali-I Kalna- I, II, Katwa- Iwherein three crops are cultivated. High diversification index (20-30) hasbeen obtained in Bhatar, Memari-I, II, Ketugram - II, and Purbasthali-II(18% area) where four crops are cultivated. Highest diversification isobserved in Purbasthali-II (22.8) due to sharing of 95% of GCA in groundwater(Map No.7). So, in these four blocks, cultivation of crops is most diversifiedand shown suitable for multi-crops in a crop calendar.
54 IRRIGATION SYSTEM AND PATTERN OF...
The NEHU Journal, Vol XV, No. 2, July-December 2017,
ISSN. 0972 - 8406
Map No. 7: Crop Diversification, Barddhaman, 2013
3.7. Cropping Intensity
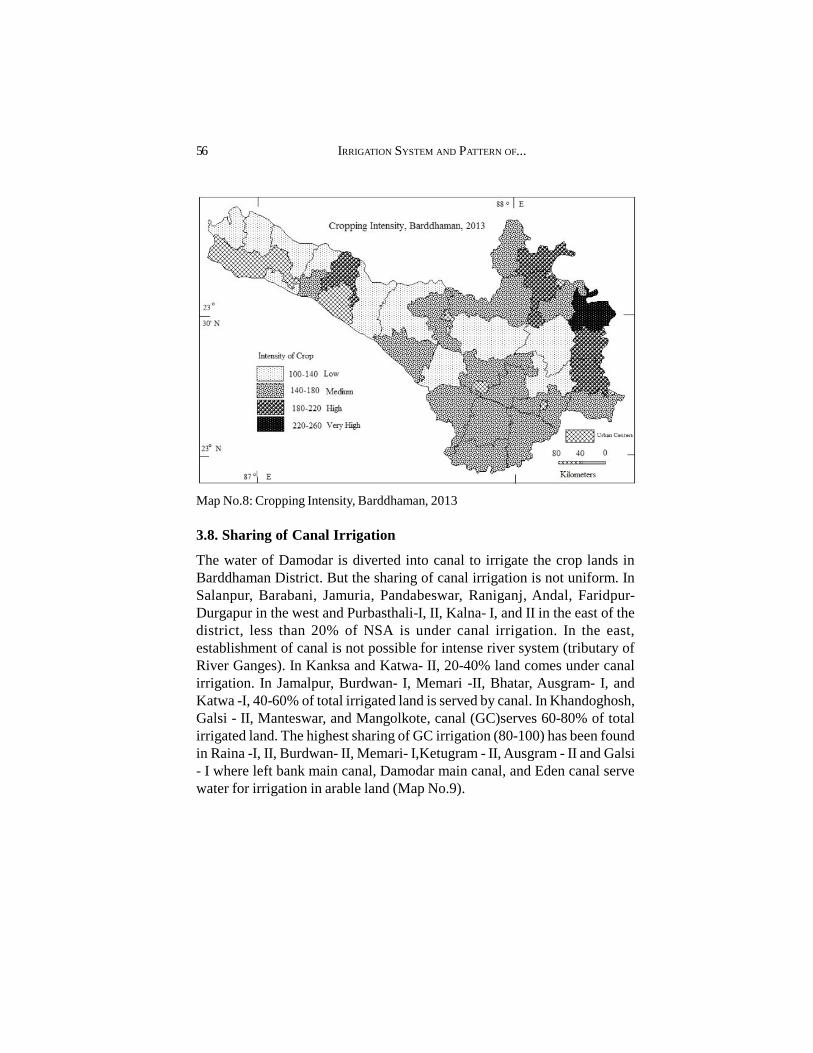
This is the index to show the multiple use of agricultural land in differentcrops. The cropping intensity is lowest (100) in Salanpur, Barabani, Jamuria,and Raniganj where only aman crop is cultivated. But low intensity of crops(100-140) is found in Pandabeswar, Kanksa, Ausgram - II, Galsi - II, Bhatar,Manteswar and Memari -II due to unavailability of canal irrigation as well asgroundwater irrigation (<25% land). The correlation between canal irrigationand cropping intensity is negative (r=-0.118, p=>0.1). Medium croppingintensity (140-180) has been found in Galsi - I, Ausgram -I, Mangolkote,Ketugram - I, Khandoghosh, Raina- I, II, Burdwan -I, II, Memari- I, Jamalpurand Kalna-II where >50% irrigation comes from government canal (GC)and these blocks are specialized for aman and boro. High cropping intensity(180-200) is noticed in Faridpur-Durgapur, Ketugram - II, Katwa- I,Purbasthali- I, Kalna I because of higher irrigation facility (>40% of irrigatedland). Purbasthali-II has been categorized under very high cropping intensity(200-260) due to intensive ground water irrigation facility (>90% NSA) (MapNo.8).
KSHUDIRAM CHAKRABORTY & BISWARANJAN MISTRI 55
The NEHU Journal, Vol XV, No. 2, July-December 2017,
ISSN. 0972 - 8406
Map No.8: Cropping Intensity, Barddhaman, 2013
3.8. Sharing of Canal Irrigation
The water of Damodar is diverted into canal to irrigate the crop lands inBarddhaman District. But the sharing of canal irrigation is not uniform. InSalanpur, Barabani, Jamuria, Pandabeswar, Raniganj, Andal, Faridpur-Durgapur in the west and Purbasthali-I, II, Kalna- I, and II in the east of thedistrict, less than 20% of NSA is under canal irrigation. In the east,establishment of canal is not possible for intense river system (tributary ofRiver Ganges). In Kanksa and Katwa- II, 20-40% land comes under canalirrigation. In Jamalpur, Burdwan- I, Memari -II, Bhatar, Ausgram- I, andKatwa -I, 40-60% of total irrigated land is served by canal. In Khandoghosh,Galsi - II, Manteswar, and Mangolkote, canal (GC)serves 60-80% of totalirrigated land. The highest sharing of GC irrigation (80-100) has been foundin Raina -I, II, Burdwan- II, Memari- I,Ketugram - II, Ausgram - II and Galsi- I where left bank main canal, Damodar main canal, and Eden canal servewater for irrigation in arable land (Map No.9).
56 IRRIGATION SYSTEM AND PATTERN OF...

The NEHU Journal, Vol XV, No. 2, July-December 2017,
ISSN. 0972 - 8406
Map No. 9: Irrigation of Government Canal, Barddhaman, 2001
KSHUDIRAM CHAKRABORTY & BISWARANJAN MISTRI 57
Map No.10: Irrigation of Ground Water, Barddhaman, 2001

The NEHU Journal, Vol XV, No. 2, July-December 2017,
ISSN. 0972 - 8406
4.0. Discussion
4.1. Factors of Crop Combination
Crop combination of the district is controlled with soil health (r=0.4837, p=<0.01)and irrigation facility (r=0.4245, p=<0.05) (Fig. No. 1&2). Lateritic soil and lownutrient content in western part of the district leads to single crop combination.
Yc = 0.404x + 1.806R² = 0.234
00.511.522.533.544.5
-2.00 -1.50 -1.00 -0.50 0.00 0.50 1.00 1.50 2.00
CropCombination
Soil Health (z value)
Crop Combination and Soil Health
Fig. No. 1: Crop Combination and Soil Health
Cro
p C
ombi
natio
n
58 IRRIGATION SYSTEM AND PATTERN OF...
3.9. Groundwater Irrigation
Well, with electric connection, and tube well with or without electric connectionhave been considered as source of groundwater for irrigation. The lowestground water irrigation (<20%) is found in 63.54% area of the district. InMangolkote, Ketugram - II, Memari -II, Jamalpur,Galsi - II, Kanksa, andPandabeswar, 20-40% land is under groundwater irrigation. In Kalna-II andPurbasthali -II, 60-80% and 80-100% of land are irrigated with groundwaterrespectively (Map No.10). So, in eastern part of the district whereestablishment of canal is not possible, groundwater is an alternative source ofirrigation.
The NEHU Journal, Vol XV, No. 2, July-December 2017,
ISSN. 0972 - 8406
Yc = 0.355x + 1.806R² = 0.181
0
1
2
3
4
5
-2 -1 0 1 2 3 4
CropCombination
% of Irrigated Land (z value)
Crop Combination and Irrigation
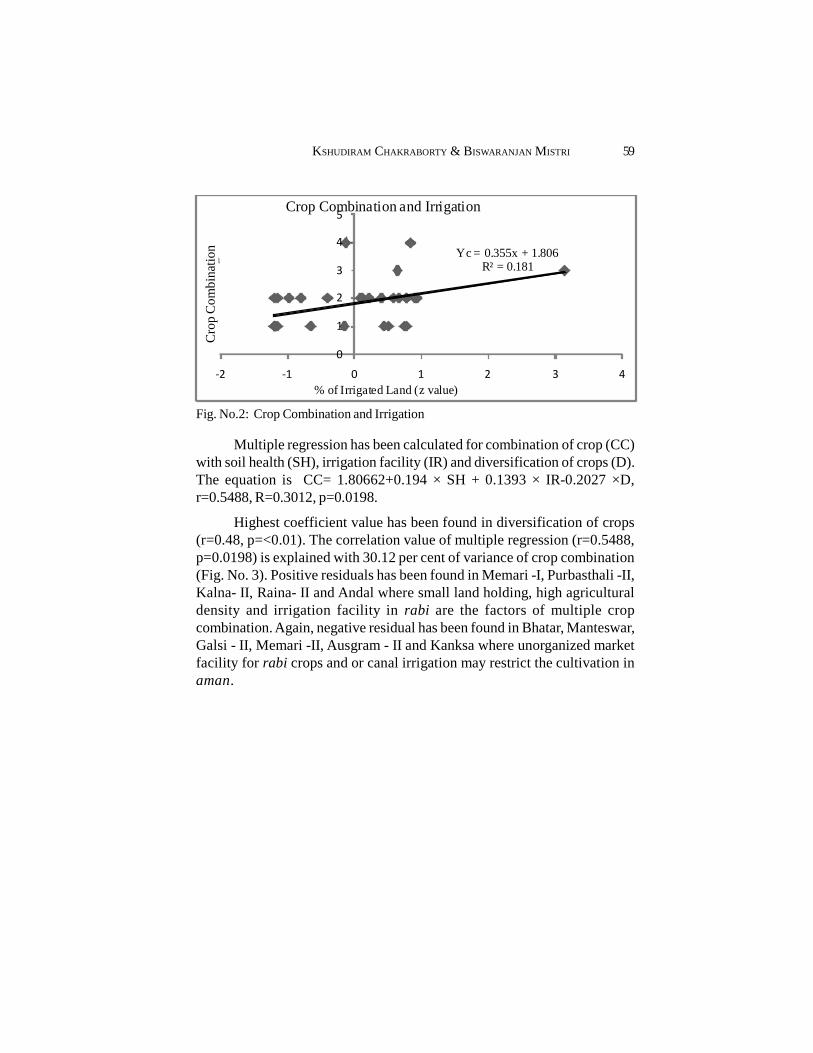
Fig. No.2: Crop Combination and Irrigation
Multiple regression has been calculated for combination of crop (CC)with soil health (SH), irrigation facility (IR) and diversification of crops (D).The equation is CC= 1.80662+0.194 × SH + 0.1393 × IR-0.2027 ×D,r=0.5488, R=0.3012, p=0.0198.
Highest coefficient value has been found in diversification of crops(r=0.48, p=<0.01). The correlation value of multiple regression (r=0.5488,p=0.0198) is explained with 30.12 per cent of variance of crop combination(Fig. No. 3). Positive residuals has been found in Memari -I, Purbasthali -II,Kalna- II, Raina- II and Andal where small land holding, high agriculturaldensity and irrigation facility in rabi are the factors of multiple cropcombination. Again, negative residual has been found in Bhatar, Manteswar,Galsi - II, Memari -II, Ausgram - II and Kanksa where unorganized marketfacility for rabi crops and or canal irrigation may restrict the cultivation inaman.
Cro
p C
ombi
natio
n
KSHUDIRAM CHAKRABORTY & BISWARANJAN MISTRI 59

The NEHU Journal, Vol XV, No. 2, July-December 2017,
ISSN. 0972 - 8406
Fig. No 3: Predicted and Observed Values of Crop Combination
4.2. Crop Diversification and Irrigation of GroundWater
The signified positive correlation has been found between diversification ofcrops and use of groundwater (r=0.411, p=<0.05) (Fig. No.4). The use ofgroundwater, regulated as well as judicious use and or minimum loss of wa-ter, are the ways for higher potentiality of irrigation to cultivate differenttypes of crops according to fertility of soil rather than cultivation of monocrop which inturn leads to minimize risk in agro-ecosystem and soil fertility.
Yc = -0.503x + 59.3r= 0.411
0
20
40
60
80
100
120
0 20 40 60 80 100
IndexofDiversification
Ground Water Irrigation (%)
Crop Diversification and Use of Ground Water
Fig. No. 4: Crop Diversification and Use of Ground Water
Inde
x of
Div
ersi
fica
tion
60 IRRIGATION SYSTEM AND PATTERN OF...

The NEHU Journal, Vol XV, No. 2, July-December 2017,
ISSN. 0972 - 8406
4.3. Cropping Intensity and Irrigation Facility
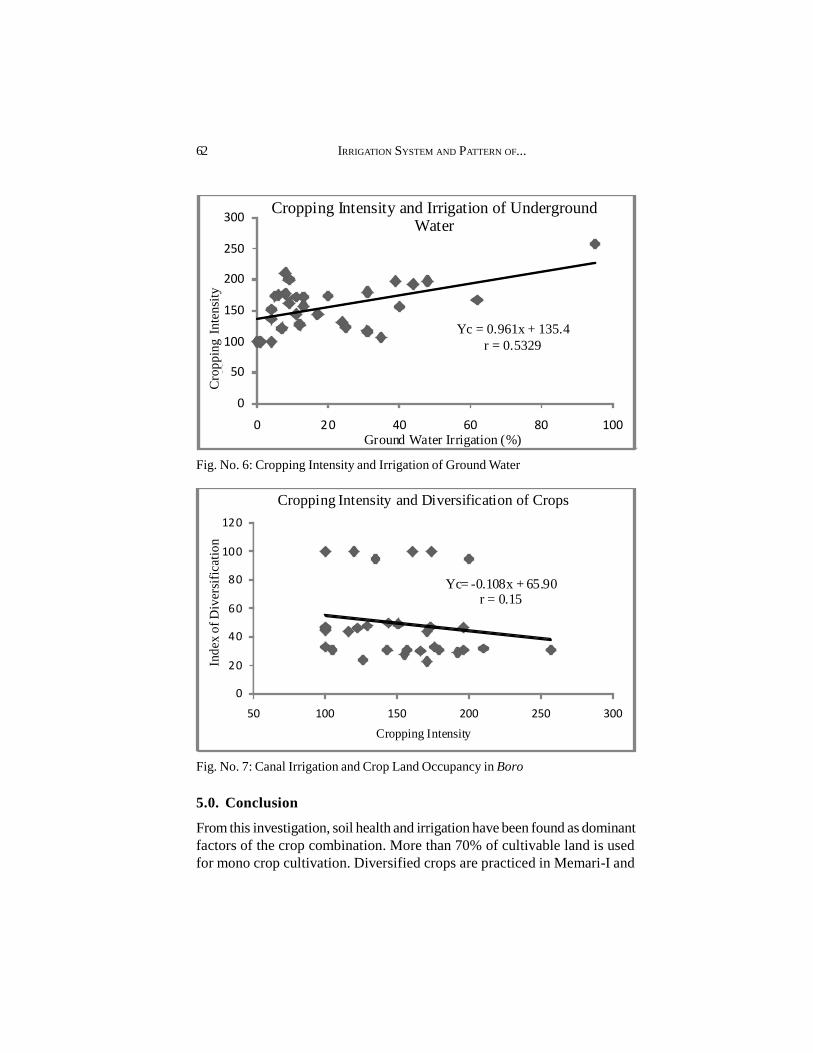
The correlation between cropping intensity and canal irrigation (-0.118, p=>0.1)is not satisfactorily signified for enhancing potential as well as multiple use ofagricultural land in Barddhaman. The correlation between cropping intensityand use of groundwater irrigation is signified at 99% level (r=0.5329, p=<0.01)because farmers can cultivate different types of crops as per their requirementusing groundwater (Fig. No.5 and 6).Alternatively, farmers generally followthe supply of water from DVC and they are compelled to cultivate paddy.But without the supply of canal water (like as aman cultivation in 2015), theproduction and agricultural system may be collapsed. Higher cropping intensityis also increased with increasing diversification of crop (r=0.1581, p=>0.1)(Fig. No.7).
Yc = -0.089x + 52.84r = -0.118
0
20
40
60
80
100
120
0 20 40 60 80 100
CroppingIntensity
Canal Irrigation (%)
Cropping Intensity and Canal Irrigation
Fig. No. 5: Cropping Intensity and Canal Irrigation
Cro
ppin
g In
tens
ity
KSHUDIRAM CHAKRABORTY & BISWARANJAN MISTRI 61
The NEHU Journal, Vol XV, No. 2, July-December 2017,
ISSN. 0972 - 8406
Yc = 0.961x + 135.4r = 0.5329
0
50
100
150
200
250
300
0 20 40 60 80 100
CroppingIntensity
Ground Water Irrigation (%)
Cropping Intensity and Irrigation of UndergroundWater
Fig. No. 6: Cropping Intensity and Irrigation of Ground Water
Yc= -0.108x + 65.90r = 0.15
0
20
40
60
80
100
120
50 100 150 200 250 300
IndexofDiversification
Cropping Intensity
Cropping Intensity and Diversification of Crops
Fig. No. 7: Canal Irrigation and Crop Land Occupancy in Boro
5.0. Conclusion
From this investigation, soil health and irrigation have been found as dominantfactors of the crop combination. More than 70% of cultivable land is usedfor mono crop cultivation. Diversified crops are practiced in Memari-I and
Inde
x of
Div
ersi
fica
tion
Cro
ppin
g In
tens
ity
62 IRRIGATION SYSTEM AND PATTERN OF...

The NEHU Journal, Vol XV, No. 2, July-December 2017,
ISSN. 0972 - 8406
Purbasthali- II using ground water irrigation and in Jamalpur, Memari-I, andKalna-I, potato is the main crop. As crop rotation and diversification improvestability of production, soil fertility and agro-economic scenario, diversifiedcombination of crop is to be practiced in Barddhaman to avoid unprecedentednegative effects on agriculture as in Punjab after green revolution.
References
Battese, G.E. and Fuller, W.A. 1972. ‘Determination of Economic Optima from Crop-Rotation Experiments’, Biometrics, 28(3):781-792.
Bhatia, S.S. 1965. ‘Patterns of Crop Concentration and Diversification in India’,Economic Geography, Clark University, 41(1):39-56.
Blanco-Canqui, H. and Lal, R. 2004.‘Mechanisms of Carbon Sequestration in SoilAggregates’, Critical Reviews in Plant Sciences, Taylor & Francis, 23(6):481-504, DOI: 10.1080/07352680490886842.
Brust, G. E. and B. R. Stinner. 1991. ‘Crop rotation for insect, plant pathogen, andweed control’, in D. Pimentel, (ed). Handbook of Pest Management inAgriculture, 2ndedition. CRC, Boca Raton, FL: 217-236.
Chattopadhyay, M. 1984. ‘Transformations of labour use in Indian agriculture’,Cambridge Journal of Economics, 8(3): 289-296.
El-Nazer T. and McCarl B.A. 1986. ‘The Choice of Crop Rotation: A ModellingApproach and Case Study’, American Journal of Agricultural Economics,Oxford University Press,68(1):127-136.
Editorials,2002. ‘Problems in Punjab’, Economic and Political Weekly, 37(29):2969.
Husain, M.1996. Agricultural Geography, Rawat Publications, Jaipur: 213-251.
Jodha, N. S. and Singh, R. P. 1990. ‘Crop Rotation in Traditional Farming Systems inSelected Areas of India’, Economic and Political Weekly, 25(13):A28-A35.
Johnston, B. F. and Mellor, J. W. 1961. ‘The Role of Agriculture in EconomicDevelopment’, American Economic Review, Vol. 51, in Kurosaki T.2002.‘Agriculture in India and Pakistan, 1900-95: A Further Note’, Economicand Political Weekly, 37(30): 566-93.
Liebman, M. and E. Dyck. 1993. ‘Crop rotation and intercropping strategies for weedmanagement’ Ecol. Appl. 3:92-122. In:Brainard, D.C., Bellinder, R.R., Hahn,R.R. and Shah, D.A., (2008).Crop Rotation, Cover Crop, and WeedManagement Effects on Weed Seed banks and Yields in Snap Bean, SweetCorn, and Cabbage, Weed Science, 56(3) pp. 434-441, Retrieved on 16-02-
KSHUDIRAM CHAKRABORTY & BISWARANJAN MISTRI 63

The NEHU Journal, Vol XV, No. 2, July-December 2017,
ISSN. 0972 - 8406
2016 12:55 UTC.
Lin, B.B. 2011. ‘Resilience in Agriculture through Crop Diversification: AdaptiveManagement for Environmental Change’, Bio-Science, 61(3),OxfordUniversity Press.
Metzel, J. &Ateng, B. 1993. ‘Constraints to Diversification in Bangladesh: A Surveyof Farmers’ Views’, Bangladesh Institute of Development Studies, Retrievedon 16-02-2016 12:47 UTC.
Paul, A. 2015. Banglar Krishi O Krishak Samasya O Sombhabana, Naya UdyogPublication, Kolkata.
Quasem,A.andRahman, L. 1993. ‘Agricultural Research and Crop Diversification inBangladesh’, Bangladesh Institute of Development Studies, Retrieved on16-02-2016 12:39 UTC.
Sidhu, R. S. and S.S.Johl, 2002. ‘Three Decades of Intensive Agriculture in Punjab:Socio-Economic and Environmental Consequences’In:Johl, S. S. and Ray, S.S. (eds.), Future of Punjab Agriculture, Centre of Research in Rural andIndustrial Development, Chandigarh.
Singh, J. and Sidhu, R.S. 2004. Factors in Declining Crop Diversification: Case Studyof Punjab, Economic and Political Weekly, 39(52).
Singh, J.and Dhillon, S.S. 1984.Agricultural Geography, Tata McGraw-Hill, Delhi.
Singh, J., G. S. Dhaliwal, and N. S. Randhawa 1997. Changing Scenario of PunjabAgriculture: An Ecological Perspective, Centre for Research in Rural andIndustrial Development, Chandigarh
Singh,J. and Sidhu, R.S.(2004).Factors in Declining Crop Diversification: Case Studyof Punjab, Economic and Political Weekly, 39(52).
Snapp, S.S., Blackie, M.J., Gilbert, R.A., Bezner-Kerr, R., Kanyama-Phiri, G.Y. andKates, R.W. (2010).
Biodiversity can support a greener revolution in Africa Source: Proceedings of theNational Academy of Sciences of the United States of America, 107(48).
Sumner, D. R. 1982. Crop rotation and plant productivity, in M. Rechcigl, ed. CRCHandbook of Agricultural Productivity, Boca Raton, FL: CRC:273-313.
Tangley, L. 1987. ‘Beyond the Green Revolution’, Bio-Science, Oxford UniversityPress, 37(3).
Taylor, D. C. 1994. ‘Agricultural Diversification: An Overview and Challenges inASEAN in the 1990s’, ASEAN Economic Bulletin, 10(3),Institute of SoutheastAsian Studies.
Thapar, R. 1973. Backwash of Green Revolution, Economic and Political
64 IRRIGATION SYSTEM AND PATTERN OF...

The NEHU Journal, Vol XV, No. 2, July-December 2017,
ISSN. 0972 - 8406
Weekly,8(34).
Vandermeer, J., van Noordwijk, M., Anderson, J., Ong, C., and Perfecto, I. 1998.‘Global change and multi-species agro-ecosystems: Concepts and issues’.Agriculture, Ecosystems and Environment 67(1):22.
Weaver, J.C. 1954. ‘Crop-Combination Regions for 1919 and 1929 in the MiddleWest’,Geographical Review, American Geographical Society,44(4).
Zohir, S. 1993. ‘Problems and Prospects of Crop Diversification in Bangladesh’, TheBangladesh Development Studies, 21(3).
KSHUDIRAM CHAKRABORTY & BISWARANJAN MISTRI 65