crop water use curves for irrigation scheduling - oregon state
TRANSCRIPT

Crop WaterUse Curves forIrrigation Scheduling
Special Report 706March 1984
Agricultural Experiment StationOregon State University, Corvallis

Authors: D. C. Hane is Instructor and F. V. Pumphrey is Agronomist atOregon State University, Columbia Basin Agricultural Research and ExtensionCenter, Hermiston, Oregon.
References:
(1) Bauder, J. W. 1982. Consumpt user's manual--A new approach toirrigation scheduling. Montana State University, Bozeman, Montana.
(2) Doorenbos, J., and A. H. Kassam. 1979. Yield response to water.FAO Irrigation and Drainage Paper 33. Rome.
(3) Hane, D. C., and F. V. Pumphrey. 1983. Determining waterrequirements of Russett Burbank potatoes in North Central Oregon.Oregon Agricultural Experiment Station Special Report 684,pp 37-42.
(4) McVay, M. C. 1982. Water management and conservation programannual report. Engineering and Research Center, Denver, Colorado.
(5) Pumphrey, F. V. 1974. Effects of irrigation on growth, yield,and quality of peas for processing. Journal, American Society ofHorticultural Science. 99:104-106.
(6) Pumphrey, F. V., and D. C. Hane. 1982. Water consumptioncoefficients of frequently irrigated winter wheat in North CentralOregon. Oregon Agricultural Experiment Station Special Report 664,pp 29-33.
(7) Wright, J. L. 1982. New evapotranspiration crop coefficients.ASCE Irrigation and Drainage Division Speciality Conference, Proceed-ings, Volume 108, International Rice Research Institute, pp 107-115.

CROP WATER USE CURVES FOR IRRIGATION SCHEDULING
D. C. Hane and F. V. Pumphrey
The relationship between water used by crops at various growth stagesand pan evaporation provides information applicable to irrigation schedul-ing. The curves provided here have been constructed using the data mostcurrent and relevant to intensive irrigated agriculture. Data for thepotato and winter wheat curves were developed at the Columbia BasinAgricultural Research and Extension Center, Hermiston, Oregon. The alfalfa,field corn, peas, and mint curves include data from Oregon, Idaho, and FAO
irrigation and drainage papers.
These curves represent average conditions and allowances have to bemade for individual conditions. The actual water used by a crop at agiven growth stage can be modified by disease, weeds, insects, fertility,variety, slope exposure, and management factors for individual fields.
Pan evaporation can be obtained from local weather recording stationsor from appropriate measuring devices at or near grower fields. Pansshould be located under conditions representative of irrigated crops. Thestandard U. S. Weather Bureau Class A evaporation pan is four feet in diam-eter, ten inches deep, filled with water to a depth of 7 1/2 inches, andelevated above ground five inches. A similar pan that can be used fordetermining evaporation has been suggested by Montana State University (1).They recommend a No. 1 or No. 2 galvanized washtub be set up similarly toa standard pan. The accuracy of the "washtub" pans is said to be similarto a Class A pan and is considerably cheaper.
These crop water use curves along with crop growth stage and panevaporation provide an irrigation scheduling tool. The water use co-efficient determined from crop growth stage and these curves is multipliedby pan evaporation to give estimated crop water use (water use coefficientx pan evaporation equals water used by crop). Irrigations are scheduled
accordingly.

1.0 ALFALFA
•n•
4: .8 12"PLANT
HEIGHT
Qu.u-
nnI
0 .6
Lir /--
C:)
ccLir INITIATION
CtC.DLuCC
' OF SPRINGGROWTH
FIRST SECOND THIRD FOURTHCUTTING CUTTING CUTTING CUTTING
GROWTH STAGE
*Water use coefficient X pan evaporation = water used by plant.
(Doorenbos and Kassam, 1979)(McVay, 1982; Wright, 1982)
Alfalfa is deeper rooting and can deplete soil moisture to a greaterextent without suffering yield loss than most irrigated crops.
When the supply of water is limited, irrigating more acres rather thanfully irrigating fewer acres will increase total production. A 20 percentdeficit in water may reduce yield by only 10 percent.
Irrigating immediately after cutting encourages rapid regrowth if thesoil is not moist from irrigating just prior to cutting.
Water use efficiency decreases during the growing season. This decreasein water use efficiency results from decreasing yield during the growingseason and increasing plant water use mainly because of higher summertemperatures and lower humidity.
2

1.0 WINTER WHEAT
n•n
MM.
.2
GROUNDCOVER
PLANTESTABLISHMENT RAPID
AND VEGETATIVETILLERING GROWTH
.==
nn1
FLOWERING ANDGRAIN FILLING MATURITY
GROWTH STAGE
*Water use coefficient X pan evaporation = water used by crop.
(Pumphrey and Mane, 1982)
Grain yields are affected most by water supply from head emergencethrough flowering. A water deficit of 20 percent during this period canreduce grain yield as much as 50 percent. Grain yields are least affectedby water deficits during tillering; a water deficit during this period mayreduce grain yield by only 10 percent. If water is limiting growth duringtillering and early jointing, an inch of water may increase the yield threebushels per acre. An inch of water applied to wheat suffering from severemoisture stress during flowering will increase yields as much as 10 bushelsper acre.
Wheat, until the hard dough stage of growth, can take up 45 to 55 percentof the available soil water before suffering stress and yield reduction.Available water in the upper two or three feet of soil can be utilized afterhard dough without loss in yield or quality.
Over watering during the vegetative stage of growth increases vegetativegrowth, the grain to straw ratio, the possibility of lodging, and may leachnutrients (mainly nitrate and sulfur) below the rooting zone. The worstpossible water scheduling for wheat is abundant irrigation until heademergence and little, or no irrigation after head emergence.
3

TUBER TWO INCHINITIATION TUBERS
ROW-- PLANT CLOSINGEMERGENCE
SENESCENCE(AGING & MATURING)
1MM
RnI
REM
a
POTATOES
0
GROWTH STAGE*Water use coefficient X pan. evaporation = water used by crop.
(Hane and Pumphrey, 1982)
The sensitivity of the potato plant to water stress prohibits soil waterdepletion of more than 30 to 40 percent if optimum yield and quality are tobe obtained. The periods of stolonization through tuber initiation andyield formation are the most sensitive to water deficits. Water stress atthese times will have the greatest adverse affect on yield and quality.The periods of very early vegetative growth and late tuber bulking are lessaffected by water deficits.
Over watering reduces yield and quality and increases problems related tostorage.
1.0
4
CORN
MIN
1.0
1m.
lip
TASSELINGPOLLINATION
__EMERGENCE RAPID YIELD RIPENING VEGETATIVE FORMATION
GROWTH
GROWTH STAGE
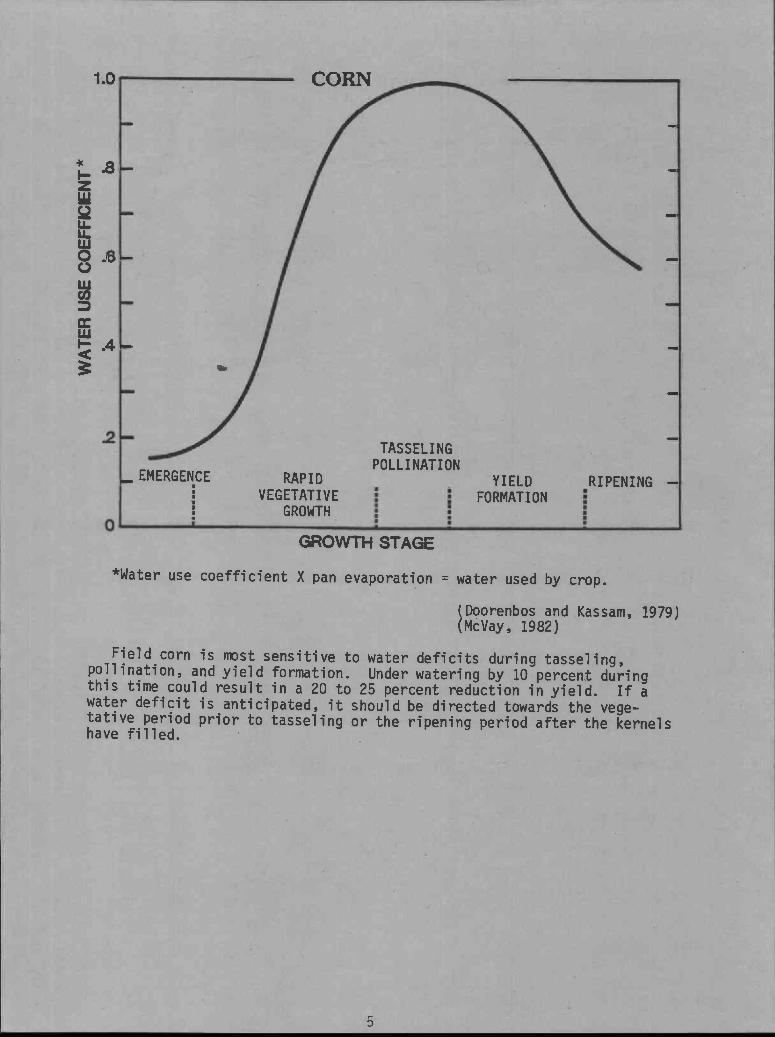
*Water use coefficient X pan evaporation = water used by crop.
(Doorenbos and Kassam, 1979)(McVay, 1982)
Field corn is most sensitive to water deficits during tasseling,pollination, and yield formation. Under watering by 10 percent duringthis time could result in a 20 to 25 percent reduction in yield. If awater deficit is anticipated, it should be directed towards the vege-tative period prior to tasseling or the ripening period after the kernelshave filled.
5

1.0 PEAS
fir
•n1
EMERGENCE
FRESHHARVEST
RAPID FLOWERING DRY --VEGETATIVE POD HARVEST
GROWTH FILLING
GROWTH STAGE
*Water use coefficient X pan evaporation = water used by crop.
(Doorenbos and Kassam, 1979)(Pumphrey, 1974)
Peas are very sensitive to water deficiency during flowering and podfilling. Soil water depletion should be no more than 40 percent of avail-able water in the upper two feet of soil during these growth periods.
When moisture is deficient, an inch of water during early vegetativegrowth will increase fresh pea yields 200 to 300 pounds per acre; an inchof water during flowering and pod filling will increase the yield 400 to1000 pounds per acre. When moisture is deficient, irrigating duringflowering increases the number of flowers, pods, and peas per pod.
Abundant moisture during the vegetative stage of growth and good soilfertility result in excessive vine growth. Abundant moisture throughoutthe growing season extends blooming and pod filling. With fresh peaproduction, greatly extending blooming and pod filling result in lessuniformity in pea size, maturity, color, and increases "blonding" (palegreen colored peas).
6
.8 -1.-Z
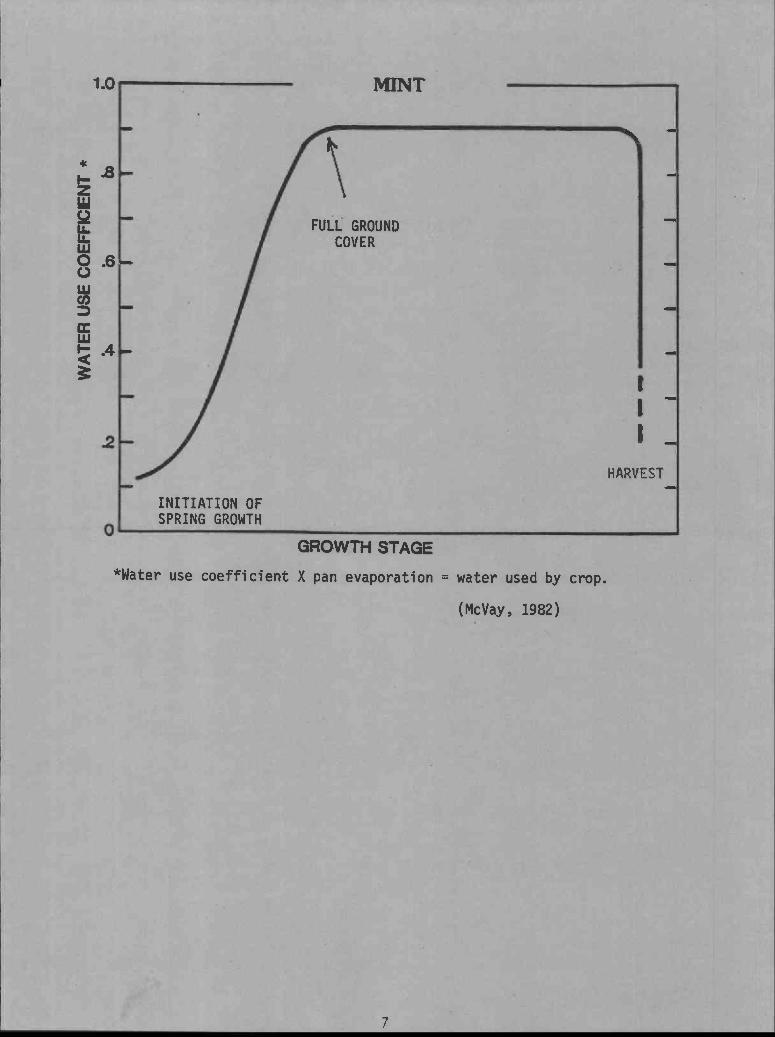
FULL GROUNDCOVER
0 .6 -
Co
CCLaiI— .4cc
HARVEST
INITIATION OFSPRING GROWTH
1.0 MINT
GROWTH STAGE
*Water use coefficient X pan evaporation = water used by crop.
(McVay, 1982)
7