irrigation scheduling - department of primary...
TRANSCRIPT

IrrigationScheduling
WISE WATERINGIrrigation Management CourseThese materials are part of the Wise Watering Irrigation ManagementProgram, developed in part from the NSW Agriculture WaterWise on the farmeducation program and The Mallee Wells Irrigators manual.
Course development and presentation by Davey & Maynard, in associationwith Armstrong Agricultural Services, Serve-Ag, Hinton AgriculturalConsulting, Rural Development Services and the Tasmanian Department ofPrimary Industries, Water and Environment.
The Wise Watering project is part of the Tasmanian Irrigation PartnershipProgram, funded jointly by the State Government and Natural Heritage Trust.
September 2001

Module notes prepared by
David Armstrong, Armstrong Agricultural ServicesChris Thompson, Serve-AgDavid O’Donnell, DPIWESue Hinton, Hinton Agricultural Consulting
Contents
INTRODUCTION .............................................................................................1Learning outcomes ......................................................................................1Assessment .................................................................................................1Additional reading ........................................................................................1
CROP WATER USE ........................................................................................2Crop growth stages......................................................................................2Calculating crop water use with weather data .............................................5Estimating crop water use by examining the plant.......................................7Measuring crop water use with soil water monitoring tools..........................8
IRRIGATION SCHEDULING .........................................................................12
WATER BUDGETING ...................................................................................13Calculating the water budget .....................................................................14
ACTIVITY 1: CALCULATING CROP WATER USE FROM WEATHER DATA.......................................................................................................................16
Irrigation scheduling data sheet: example .................................................17Answer sheet for Steps 1 to 4....................................................................18Guidelines for completing the Irrigation scheduling data sheet..................20Irrigation scheduling data sheet: ................................................................21
ACTIVITY 2A: CALCULATING CROP WATER USE FROM SOILMOISTURE DATA .........................................................................................22
Blank chart for plotting data. ......................................................................23
ACTIVITY 2B: PLOTTING CROP WATER USE FROM TENSIOMETERREADINGS (KPA) .........................................................................................26

6 Irrigation Scheduling, V1.doc 01/11/02 Page 1
Introduction
This workshop aims to introduce you to irrigation scheduling, farm waterbudgeting and benchmarking.
Using these tools will improve your irrigation management and crop performance.
Learning outcomesBy the end of this workshop of the Introduction to Irrigation Management courseyou will be able to:
¶ determine crop water requirements¶ compare irrigation scheduling methods and tools¶ develop an irrigation schedule¶ develop a seasonal irrigation budget¶ identify the benefits of water use efficiency benchmarks for your farm¶ identify the information you need to benchmark water use efficiency for your
farm.
To achieve these outcomes, workshop activities include determining crop waterrequirements, developing a sample irrigation schedule, reading and interpretingscheduling tools, completing calculations for a seasonal irrigation budget, andusing a data collection sheet for benchmarking information.
AssessmentIn this workshop, you complete the assessment by participating in classdiscussion and completing the worksheets provided for the activities. Activitiesmust be completed and submitted for assessment. Completion of these tasks willbe checked during this workshop and at the beginning of the next workshop.
Additional reading
Bill Cotching, DPIWE. “Getting Irrigation Right, Irrigation using tensiometers andevaporation pans”.

6 Irrigation Scheduling, V1.doc 01/11/02 Page 2
Crop water use
For given climatic conditions, crop water use depends on the type of crop and itsstage of growth.
Water evaporates from the soil and is used by the plant by transpiration.
Evapotranspiration is a term used to describe the combined losses of watervapour from soil (evaporation) and through plants (transpiration).
Crop growth stagesFigure 1 shows how crop water use changes with crop growth stages. In the earlystages of growth, the water requirements are low. Much more water is neededlater, nearer crop maturity, and then water use tapers off. The amount of waterused varies according to crop and environment: for example, at peak growth, alucerne crop uses about twice as much water as a grape crop.
Figure 1. Variation in crop water use over the growing season

6 Irrigation Scheduling, V1.doc 01/11/02 Page 3

6 Irrigation Scheduling, V1.doc 01/11/02 Page 4
What drives crop water use?
Crop water use is driven by the weather conditions of its environment:
¶ Solar radiation provides the energy that drives water use. The energyreceived, and therefore water use, may also be affected by aspect of thecrop to the sun.
¶ Humidity: In a high humidity environment, a plant uses less water than itdoes at the same temperature in a dry environment, because the airsurrounding the plant is less able to remove the water vapour coming out ofthe plant's leaves.
¶ Wind speed: Evapotranspiration increases with wind speed, because thewind removes the vapour that the plant is transpiring.
¶ Temperature: Hotter temperatures increase the rate of photosynthesis.
These four aspects of the crop's environment, which combine asevapotranspiration, set the peak water use for the crop. Some farmingpractices (such as tillage, cover crops, fertiliser, pest and disease management,plant density) can affect how closely actual water use approaches peak rates.
Figure 2. Factors affecting crop evaop-transpiration

6 Irrigation Scheduling, V1.doc 01/11/02 Page 5
Calculating crop water use with weather dataCrop water use can be estimated from weather data such as pan evaporation.This relies on the use of a Pan Coefficient that relates Reference CropEvapotranspiration (ET) to the evaporation measured in the pan, and a CropFactor that relates crop water use to Reference Crop ET.
Pan Coefficients depend on the exposure of the pan, wind velocity and humidity.A coefficient of 0.85 is common.
Crop factors vary greatly during the season, and at best are rough estimates.
Given the estimates involved, it is reasonable to simply apply the Crop Factor topan evaporation, and revise the factors during the growing season by experienceand observation.
Crop factors in the following table can be used as a guide.
Table 1. Monthly crop factors for a range of irrigated crops.
Month Vines (1) Lucerne andpasture
Potatoes
September 0.10 0.75October 0.23 0.85November 0.30 0.95 0.2December 0.40 1 0.7January 0.4 1 0.9February 0.4 0.9 0.7March 0.30 0.85April 0.23 0.8
(1) A Grapegrowers Guide, NSW Dept. of Agriculture, 1993.
In some areas ”Reference Evapotranspiration” figures are published. The figuresindicate water use by a standard crop such as well irrigated pasture. To usethese figures you also need to apply a Crop Factor that relates the water use ofyour crop to that of the reference crop.
An alternative to a Class A pan is to use a 200 litre drum cut in half. Theevaporation from the drum is close to the water use by a vigorous crop with fullground cover. The simplest procedure is to cut a V notch 12-15 mm deep in therim so that surplus water or rain can overflow.
The bottom of the V notch represents Field Capacity. Water is used from the soilat a similar rate to evaporation from the drum. Horizontal lines or a ruler insidethe drum can be used to measure the evaporation. When the level falls to the“Refill Point” the crop should be irrigated and the drum filled to overflow that Vnotch.
6 Irrigation Scheduling, V1.doc 01/11/02 Page 6
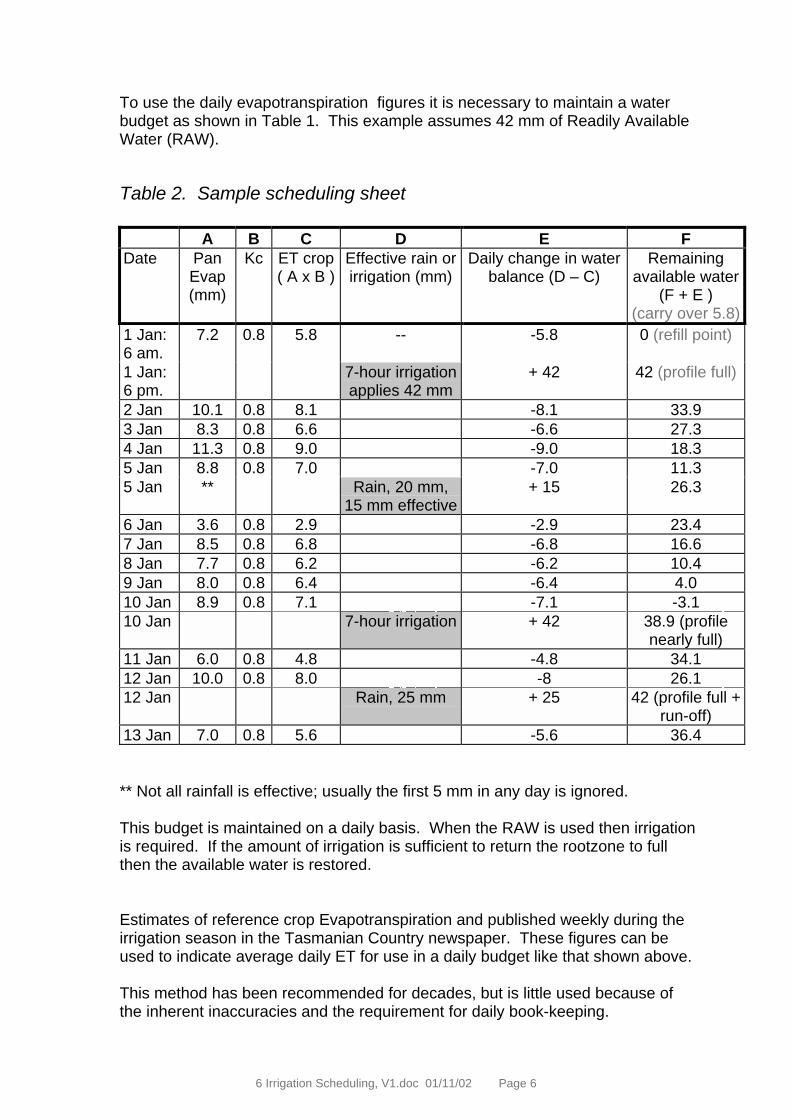
To use the daily evapotranspiration figures it is necessary to maintain a waterbudget as shown in Table 1. This example assumes 42 mm of Readily AvailableWater (RAW).
Table 2. Sample scheduling sheet
A B C D E FDate Pan
Evap(mm)
Kc ET crop( A x B )
Effective rain orirrigation (mm)
Daily change in waterbalance (D – C)
Remainingavailable water
(F + E )(carry over 5.8)
1 Jan:6 am.
7.2 0.8 5.8 -- -5.8 0 (refill point)
1 Jan:6 pm.
7-hour irrigationapplies 42 mm
+ 42 42 (profile full)
2 Jan 10.1 0.8 8.1 -8.1 33.93 Jan 8.3 0.8 6.6 -6.6 27.34 Jan 11.3 0.8 9.0 -9.0 18.35 Jan 8.8 0.8 7.0 -7.0 11.35 Jan ** Rain, 20 mm,
15 mm effective+ 15 26.3
6 Jan 3.6 0.8 2.9 -2.9 23.47 Jan 8.5 0.8 6.8 -6.8 16.68 Jan 7.7 0.8 6.2 -6.2 10.49 Jan 8.0 0.8 6.4 -6.4 4.010 Jan 8.9 0.8 7.1 -7.1 -3.110 Jan 7-hour irrigation + 42 38.9 (profile
nearly full)11 Jan 6.0 0.8 4.8 -4.8 34.112 Jan 10.0 0.8 8.0 -8 26.112 Jan Rain, 25 mm + 25 42 (profile full +
run-off)13 Jan 7.0 0.8 5.6 -5.6 36.4
** Not all rainfall is effective; usually the first 5 mm in any day is ignored.
This budget is maintained on a daily basis. When the RAW is used then irrigationis required. If the amount of irrigation is sufficient to return the rootzone to fullthen the available water is restored.
Estimates of reference crop Evapotranspiration and published weekly during theirrigation season in the Tasmanian Country newspaper. These figures can beused to indicate average daily ET for use in a daily budget like that shown above.
This method has been recommended for decades, but is little used because ofthe inherent inaccuracies and the requirement for daily book-keeping.

6 Irrigation Scheduling, V1.doc 01/11/02 Page 7
Figure 3. Plot of Column F: Remaining available water
Estimating crop water use by examining the plantSome farmers may irrigate when a section of a crop starts to show wilting, anddue to light soil types and therefore less soil water in the rootzone this is a goodindicator for the rest of the paddock if it has better soil and therefore more soilwater.
In many cases, however, waiting until the plant wilts means that crop water usehas already slowed, reducing the final yield or quality.
Wilting can also be a sign of waterlogging or root disease; also, some plants rolltheir leaves on a hot, windy day despite the fact that soil water content is adequate,whilst other plants only show wilting when water is severely limited.
Because of these factors, monitoring the plant is not recommended as the only orprime method of monitoring crop water use.
More technologically advanced methods of plant monitoring, including sap flowand pressure bomb meters, do work well, but are not in common use by farmers.
-10
0
10
20
30
40
50
60
31/12/002/01/014/01/016/01/018/01/0110/01/0112/01/0114/01/01
Rem
aini
ng a
vaila
ble
wat
er
Full point
Refill point

6 Irrigation Scheduling, V1.doc 01/11/02 Page 8
Measuring crop water use with soil water monitoringtoolsThree basic methods of determining the volume of water in the soil are:
1. gravimetric, as with a digstick or drying a soil sample in an oven.
2. volumetric, using nuclear or electrical capacitance methods (ADCON,Gopher and Diviner instruments).
3. tension, such as in tensiometers or gypsum blocks. Tension is the effort aplant needs to use to extract water.
New soil water monitoring tools are constantly becoming available and each hasadvantages and disadvantages. The capacitance instruments offer a costeffective and reliable means of irrigation scheduling based on soil moisture levels.
Tensiometers have been used to measure the soil moisture tension. This is adirect measure of the force that plants have to exert to extract moisture.
Guidelines have been developed for the sandy loam and clay loam soilscommonly irrigated in Tasmania.
Table 3. Soil moisture tensions to start irrigation.
Irrigated vegetables on Krasnozems,tensiometer at 30 cm
Irrigate at 50 cb (centi-Bars)
Irrigated vegetables on a sandy loam(eg., Cressy loam), tensiometer at 30 cm
Irrigate at 30-40 cb
Irrigated vegetables on light sand(Panshanger sand), tensiometer at 30 cm
Irrigate at 20-30 cb
Pyrethrum on Krasnozems, late in theseason
Irrigate at 60-70 cb
Tensiometers fail when the tension (or suction) gets close to 1 atmosphere; aircomes out of solution and air pockets prevent the measurement of suction.Regular maintenance is required. Because most of the water available to plantsin sandy soils is extracted at low suctions, tensiometers are more reliable insandy rather then clay soils.
Always install several tensiometers at several locations and several depths, onein the middle of the rootzone, and one near the bottom or just below the rootzone.
Readings should be graphed so you can see the trend, and use this to predictwhen the next irrigation is due.
Tensiometers have proved useful in potato crops, where a tensiometer placed inthe middle of the mound gives a reliable measure of the dryness of the mound.

6 Irrigation Scheduling, V1.doc 01/11/02 Page 9
Other methods have been less reliable in monitoring the moisture level in themounds.
Selecting sites for soil water monitoringWhen monitoring soil water the measurements only sample a small amount ofsoil. To ensure maximum benefit, it is important to select monitoring sites whichare representative of the irrigated area. Selecting monitoring sites is easier onproperties where soil surveys have been conducted and water distributionuniformity is good.
Wheel tracks and areas where soil is compacted should be avoided, as shoulddisturbed soil, outside rows, or areas near stunted or sick plants.
Placing the soil water monitor in a 'representative' site means knowing how thelocation relates to the rest of the field. You are trying to select a soil type thatindicates the water-holding capacity for the area, making sure the locationincludes the whole rootzone of the crop, and supports a crop of a height and yieldthat is average for the area.
It is advisable to use more than one sensor in each paddock. Capacitanceprobes, for example, can be strongly influenced by air gaps between the accesstube and the surrounding soil (so care in installation is necessary). But it is saferto have two or three access tubes in each paddock or irrigation block.
If you are using more than one sensor site, you could try to get a better idea ofwhat is happening across the whole area by locating sensors in, for example, thehigher/lower or drier/wetter parts of the field.
What do soil water monitoring tools tell us?A soil water monitoring tool shows how the water content varies at differentdepths and over time. Figures 4 and 5 show water content varying with depth,and soil water readings over time.
Figure 4. Soil water content varying at different depths

6 Irrigation Scheduling, V1.doc 01/11/02 Page 10
Figure 5. Soil water readings at several depths over time
6 Irrigation Scheduling, V1.doc 01/11/02 Page 11
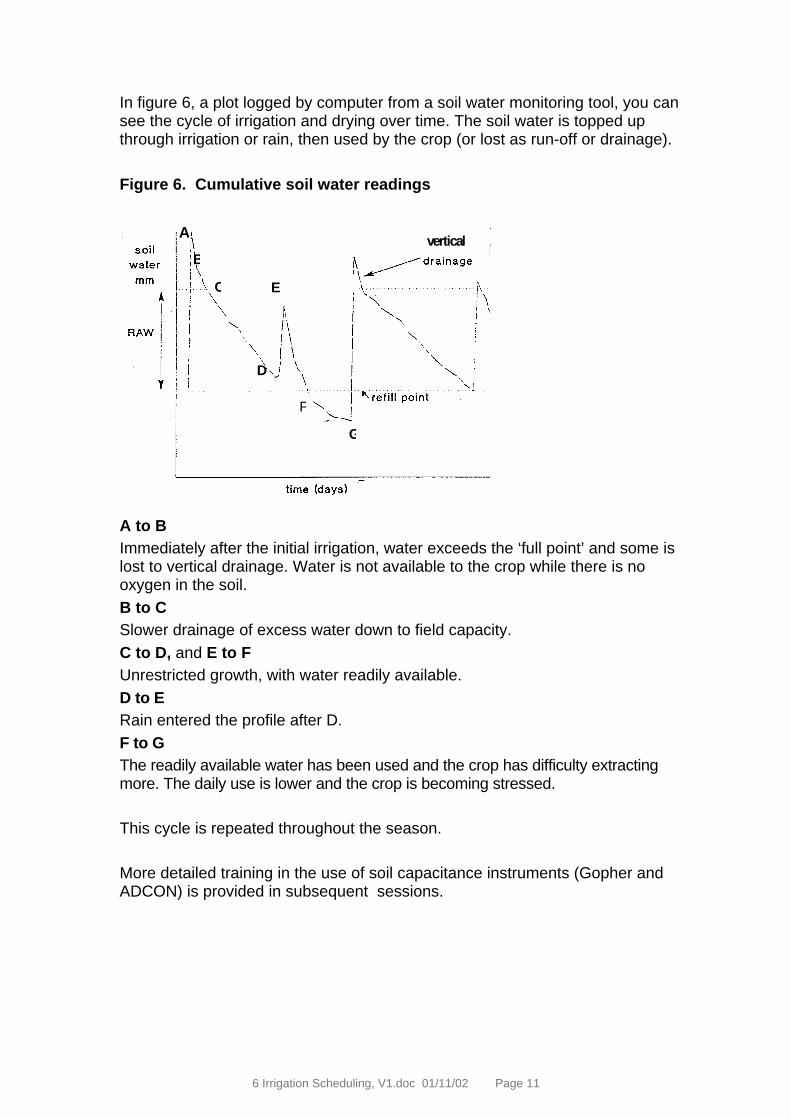
In figure 6, a plot logged by computer from a soil water monitoring tool, you cansee the cycle of irrigation and drying over time. The soil water is topped upthrough irrigation or rain, then used by the crop (or lost as run-off or drainage).
Figure 6. Cumulative soil water readings
AB
D
vertical
C E
G
F
A to BImmediately after the initial irrigation, water exceeds the ‘full point’ and some islost to vertical drainage. Water is not available to the crop while there is nooxygen in the soil.B to CSlower drainage of excess water down to field capacity.C to D, and E to FUnrestricted growth, with water readily available.D to ERain entered the profile after D.F to GThe readily available water has been used and the crop has difficulty extractingmore. The daily use is lower and the crop is becoming stressed.
This cycle is repeated throughout the season.
More detailed training in the use of soil capacitance instruments (Gopher andADCON) is provided in subsequent sessions.

6 Irrigation Scheduling, V1.doc 01/11/02 Page 12
Irrigation scheduling
An irrigation schedule predicts when the crop needs its next irrigation, and theamount required. Irrigation scheduling is a process of fine-tuning to achieve thequality and yields required, and uses data on crop water use. Figure 5 illustrateshow yield is affected by too little or too much water.
Figure 7. Theoretical relationship between water applied and yield.1. Yield increases without irrigation2. Irrigation contributes to continued yield increase3. More water causes no increase in yield4. Too much water and yield declines due to waterlogging
When both weather data and soil water monitoring tools are available for irrigationscheduling they are often used for cross-checking crop water use in the particularsituation. This is particularly the case with high value crops.
Effective irrigation scheduling generally aims to avoid stress to the plant, althoughspecialised management techniques may be used in some crops or where waterresources are limited.
For instance:
Vines: Although it is accepted practice to avoid water stress duringflowering, fruit quality can be improved by stressing the plant at certainstages of growth. Seek further information if you are interested in thesetechniques.
Stone fruit: Avoid any water stress during flowering and keep water upduring the 4-6 weeks prior to harvest to ensure adequate fruit size.
Vegetables: Avoid any water stress during the life of shallow-rooted plantsas it can lead to a reduction in yield.

6 Irrigation Scheduling, V1.doc 01/11/02 Page 13
Water budgeting
Water budgeting is estimating
1. how much crop can be grown with the available water (particularly relevantfor annual crops), or
2. how much water is needed to achieve the required quantity and quality.
Water budgeting allows you to plan your irrigation management and make thechanges you needed during the season.
The factors that help determine the water budget are¶ the local climate ¶ the annual requirements of the crop ¶ the available supply
Local climate¶ What is the average rainfall?¶ What is the probability of above or below average rainfall?¶ When does rainfall occur – how will this affect irrigation and dam supplies?
Annual requirements of the crop ¶ Do you know the annual requirements for your crop¶ What scope is there to adjust water within acceptable quality and quantity
boundaries
Available supply¶ How much stored water is available? ¶ How much water will be lost from the storage by evaporation?¶ How much water can be pumped from streams or bores?¶ Can water be transferred or purchased? How much will this cost versus the
benefits?¶ Is water quality an issue at low flows?¶ What are the chances of summer “freshes”?
It is often not easy to estimate all these amounts. The amount of water stored isoften over-estimated. The capacity of dams is best determined by a survey of thedam (particularly if this was not done prior to construction).
A rough figure of evaporation loss is to allow 66% of the annual evaporation andapply it to the top surface area of the dam. So for a dam with a surface area of 1hectare, and annual evaporation of 1,100 mm (most of Tasmania has evaoprationbetween 1,000 and 1,200 mm) indicates an evaporative loss of approximately725 mm per hectare of surface area. This is equivalent to 7.25 ML/hectare ofsurface area.
6 Irrigation Scheduling, V1.doc 01/11/02 Page 14
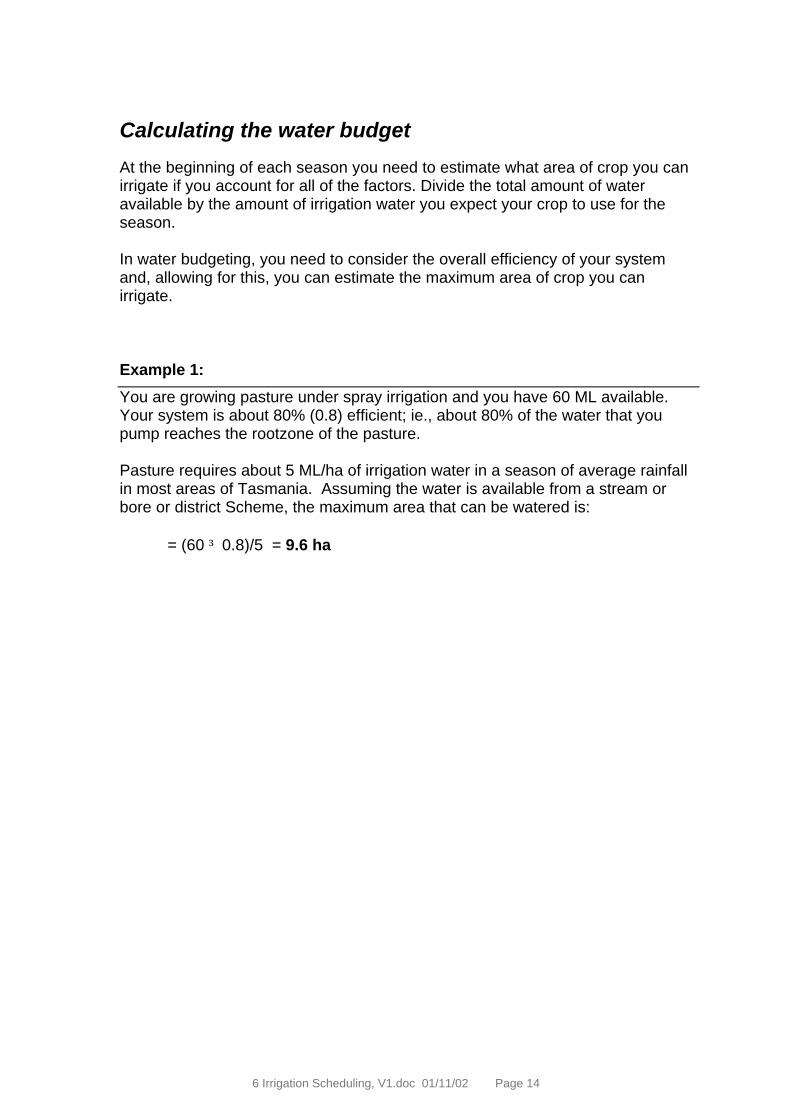
Calculating the water budgetAt the beginning of each season you need to estimate what area of crop you canirrigate if you account for all of the factors. Divide the total amount of wateravailable by the amount of irrigation water you expect your crop to use for theseason.
In water budgeting, you need to consider the overall efficiency of your systemand, allowing for this, you can estimate the maximum area of crop you canirrigate.
Example 1: You are growing pasture under spray irrigation and you have 60 ML available.Your system is about 80% (0.8) efficient; ie., about 80% of the water that youpump reaches the rootzone of the pasture.
Pasture requires about 5 ML/ha of irrigation water in a season of average rainfallin most areas of Tasmania. Assuming the water is available from a stream orbore or district Scheme, the maximum area that can be watered is:
= (60 ³ 0.8)/5 = 9.6 ha

6 Irrigation Scheduling, V1.doc 01/11/02 Page 15
Example 2:You have a dam with capacity of 75 megalitres and surface area of 3.2 hectares.The maximum depth of the water is 7 metres.
Note. You can check the dam capacity as with the following formula;
Volume = Surface area (sq.metres)*maximum depth/3 = 3.2*10,000*7/3 = 74,667 cubic metres = 75 megalitres
Evaporation loss = surface area (ha) * 6.25 = 23 ML
If there is no inflow into the dam during the season (either from springs or runoff)then the amount available for irrigation is 52 ML.
The evaporative loss is over-estimated if the irrigation is conducted mainly in theearly summer (November to January); as is common with many crops.
Assume your system is about 90% (0.9) efficient and you are planning to irrigate12 hectares of potatoes and 15 hectares of peas.
Water requirements for potatoes are approximately 3.75 ML/ha; total 45 ML.Peas @ 1.5 ML/ha; 22.5 ML.The total requirement is therefore 67.5 ML, which significantly exceeds theamount available (52 ML).
How would you respond to this deficit?
You could reduce the area of either crop. Or you could reduce the planned waterapplication by stressing the crops between irrigation. This is probably not thebest strategy (this will be discussed in the Crop Management Module).
You could look for more water, by establishing an arrangement with a neighbourto buy water, or drill looking for groundwater.
Or you could continue with the proposed areas and pray for rain!

6 Irrigation Scheduling, V1.doc 01/11/02 Page 16
Activity 1: Calculating crop water use fromweather data
On the example worksheet (Irrigation scheduling data sheet) that follows, you willnotice the information has partially been filled in. You will need to supply the basicinformation such as RAW and ETo when you develop a schedule for you ownirrigation blocks.
Step 1 Calculate the ETcrop from the 13th through to the 19th. Enter this incolumn C
Step 2 Enter the ‘Daily change in water balance’ in column E from 11th throughto 19th
Step 3 Complete Column F and add an irrigation amount to Column D where itis required.(You will also need to update Column E for the dates irrigation occured)
Step 4 Check out your answers with the answer sheet.
If you have time, continue with the next set of steps.
Step 5 For the next week, 20th to 26th calculate the average ETo so far for themonth and use this to predict water use for the next week. Enter this inColumn A(Historical data for your district may be available or you can average theearlier part of the month by adding up all the ETo’s from 1st to 19th anddividing the result by the number of days)
Step 6 Calculate the predicted ETcrop for the next week. Enter this in column CStep 7 Complete the rest of the sheet and irrigate when required. (Assume
there is no rainfall)

6 Irrigation Scheduling, V1.doc 01/11/02 Page 17
Irrigation scheduling data sheet: example
Month: January Crop: …….Block: West 3 RAW 42 mm
A B C D E F
Date
ETo Kc ETcrop
(A x B)
Effective rain or Irrigation
Daily changein waterbalance( D - C )
Remainingwater available
( F + E )(Carried over
5.8)1 7.2 0.8 5.8 7 hrs x 6mm/h
irrigation-5.8+42
0 (refill point)42 (profile full)
2 10.1 0.8 8.1 -8.1 33.93 8.3 0.8 6.6 -6.6 27.34 11.3 0.8 9.0 -9.0 18.35 8.8 0.8 7.0
Rainfall, 15 mm-7.0+15
11.326.3
6 3.6 0.8 2.9 -2.9 23.47 8.5 0.8 6.8 -6.8 16.68 7.7 0.8 6.2 -6.2 10.49 8.0 0.8 6.4 -6.4 4.010 8.9 0.8 7.1
7 hrs x 6mm/h-7.1+42
-3.138.9
11 6.0 0.8 4.812 10.0 0.8 8.0
Rainfall, 25 mm13 7.0 0.814 7.0 0.815 8.0 0.816 9.0 0.817 7.0 0.818 10.0 0.8
19 12.0 0.820 0.821 0.822 0.823 0.824 0.825 0.826 0.82728293031

6 Irrigation Scheduling, V1.doc 01/11/02 Page 18
Answer sheet for Steps 1 to 4.
Irrigation scheduling data sheet: example
Month: January Crop: …….Block: West 3 RAW 42 mm
A B C D E FDate ETo Kc ET crop
(A x B )Effective rain or Irrigation
Daily changein waterbalance( D - C )
Remainingwater available
( F + E )(Carried over
5.8)1 7.2 0.8 5.8
7 hrs x 6mm/hirrigation
0 (refill point)42 (profile full)
2 10.1 0.8 8.1 -8.1 33.93 8.3 0.8 6.6 -6.6 27.34 11.3 0.8 9.0 -9.0 18.35 8.8 0.8 7.0
Rainfall, 15 mm-7.0+15
11.326.3
6 3.6 0.8 2.9 -2.9 23.47 8.5 0.8 6.8 -6.8 16.68 7.7 0.8 6.2 -6.2 10.49 8.0 0.8 6.4 -6.4 4.010 8.9 0.8 7.1
7 hrs x 6mm/h-7.1+42
-3.138.9
11 6.0 0.8 4.8 -4.8 34.112 10.0 0.8 8.0
Rainfall, 25 mm-8+25
26.142 (full +
13 7.0 0.8 5.6 -5.6 36.414 7.0 0.8 5.6 -5.6 30.815 8.0 0.8 6.4 -6.4 24.416 9.0 0.8 7.2 -7.2 17.217 7.0 0.8 5.6 -5.6 11.618 10.0 0.8 8.0
7 hrs x 6mm/h-8.0+42
3.642 (full)
19 12.0 0.8 9.6 -9.6 32.420 0.821 0.822 0.823 0.824 0.825 0.826 0.8272829

6 Irrigation Scheduling, V1.doc 01/11/02 Page 19
Answer sheet for Steps 5 to 7
This shows the predicted water use using the average ET.
Irrigation scheduling data sheet: example
Month: January Crop: …….Block: West 3 RAW 42 mm
A B C D E FDate ETo Kc ET crop
(A x B )Effective rain or Irrigation
Daily changein waterbalance( D - C )
Remainingwater available
( F + E )(Carried over
5.8)1 7.2 0.8 5.8
7 hrs x 6mm/hirrigation
0 (refill point)42 (profile full)
2 10.1 0.8 8.1 -8.1 33.93 8.3 0.8 6.6 -6.6 27.34 11.3 0.8 9.0 -9.0 18.35 8.8 0.8 7.0
Rainfall, 15 mm-7.0+15
11.326.3
6 3.6 0.8 2.9 -2.9 23.47 8.5 0.8 6.8 -6.8 16.68 7.7 0.8 6.2 -6.2 10.49 8.0 0.8 6.4 -6.4 4.010 8.9 0.8 7.1
7 hrs x 6mm/h-7.1+42
-3.138.9
11 6.0 0.8 4.8 -4.8 34.112 10.0 0.8 8.0
Rainfall, 25 mm-8+25
26.142 (full +
13 7.0 0.8 5.6 -5.6 36.414 7.0 0.8 5.6 -5.6 30.815 8.0 0.8 6.4 -6.4 24.416 9.0 0.8 7.2 -7.2 17.217 7.0 0.8 5.6 -5.6 11.618 10.0 0.8 8.0
7 hrs x 6mm/h-8.0+42
3.642 (full)
19 12.0 0.8 9.6 -9.6 32.420 Avg so
far 8.30.8 6.6 -6.6 25.8
21 0.8 6.6 -6.6 19.2
22 0.8 6.6 -6.6 12.6
23 0.8 6.6 -6.6 6.0
24 0.8 6.67 hrs x 6mm/h
-6.6+42
-0.6+41.4
25 0.8 6.6 -6.6 34.80
26 0.8 6.6 -6.6 28.2
27

6 Irrigation Scheduling, V1.doc 01/11/02 Page 20
Guidelines for completing the Irrigation scheduling datasheet
1. Fill in details of the crop or pasture being irrigated.2. Record the RAW (mm) for your block.3. ONLY if you are using pan evaporation figures, use a separate sheet to
convert each day's evaporation reading to ETo by multiplying the Pan readingby the ‘pan factor’ for your district. (Ask your irrigation adviser for details.)
Column A: Enter the daily evapotranspiration readings for your district. Column B: Copy the crop coefficient (Kc) which applies to your crop for themonth from the reference your trainer has recommended.Column C: Multiply the figure in Column A by the figure in Column B todetermine crop water use (ET crop) and enter this in column C.Column D: Enter details of any effective rainfall.Column E: Show the daily water use. Column D minus Column C. (This willusually be negative except when there is rain or irrigation.)Column F: Determine the remaining water available for each day (below theFull point) This is the previous day's figure less today's daily water use. (Whenthe water use is positive because of rain or irrigation, you add the amount)Whenever the figure in column F approaches 0 you need to irrigate to refillthe soil profile. If an irrigation does not totally refill the profile you will need toallow for this. For surface systems it is always assumed the profile is filled.If there are any special conditions, such as leaching requirements, or you arepractising RDI, you will need to adjust your scheduling to suit.
Listed below are some Kc figures. For your own scheduling calculations, youshould use local figures in preference to those given in the tables. Your localirrigation adviser will be able to provide these figure.

6 Irrigation Scheduling, V1.doc 01/11/02 Page 21
Irrigation scheduling data sheet:
Month: Crop:
Block: RAW...........……..mm
A B C D E FDate (ETo) (Kc) ET crop
(A x B )Effective rain or Irrigation
Daily changein waterbalance( D - C )
Remaining wateravailable in
paddock( F + E )
(Carried over……)
12345678910111213141516171819202122232425262728293031

6 Irrigation Scheduling, V1.doc 01/11/02 Page 22
Activity 2A: Calculating crop water use fromsoil moisture data
Step 1. Using the data below, (collected from a soil based monitoring tool) fill in the‘Remaining water available” column (the first 3 have been done for you)
Step 2. Plot the water usage on the following blank chart.
Note that in this case the soil is assumed to have a RAW of 37 mm so the FULL point isat 37 mm with the REFILL point at 0 mm. Draw a line across your chart at each ofthese levels.
Date Daily cropwater used
mm
Rainfallmm
Remainingwater
available
Irrigationneeded ??
Full Irrigation on 30th November so Profile is now Full at 37 mm1/12 5 322/12 4 283/12 3 254/12 65/12 46/12 57/12 5 208/12 39/12 210/12 311/12 712/12 513/12 514/12 215/12 3

6 Irr
igat
ion
Sche
dulin
g, V
1.do
c 0
1/11
/02
Pag
e 23
Bla
nk c
hart
for p
lotti
ng d
ata.
80 75 70 65 60 55 50 45 40 35 30 25 20 15 10 5 0
< 1/
12<
8/12
< 15
/12
< 22
/12
< 29
/12

6 Irr
igat
ion
Sche
dulin
g, V
1.do
c 0
1/11
/02
Pag
e 24
Bla
nk c
hart
for p
lotti
ng d
ata.
80 75 70 65 60 55 50 45 40 35 30 25 20 15 10 5 0
< 1/
12<
8/12
< 15
/12
< 22
/12
< 29
/12

6 Irr
igat
ion
Sche
dulin
g, V
1.do
c 0
1/11
/02
Pag
e 25
Bla
nk c
hart
for p
lotti
ng d
ata.
80 75 70 65 60 55 50 45 40 35 30 25 20 15 10 5 0
< 1/
12<
8/12
< 15
/12
< 22
/12
< 29
/12

6 Irrigation Scheduling, V1.doc 01/11/02 Page 26
Activity 2B: Plotting crop water use fromtensiometer readings (kPa)
The purpose of this activity is to plot and interpret readings from twotensiometers placed at a site at depths of 30, 60 cm Assume the soil profile requires refilling when the suction is at 40kPa, and theprofile is full when the suction is down to only 8 kPa.
Step 1. Using a blank chart draw a line across at the Refill and Full points(8kPa and 40kPa)
Step 2. Plot the tensiometer readings from the table below and join the points.Use a different colour or shaped line for the 30 and 60cm tensiometerreadings.
Step 3. When you have completed this, discuss the results, and decide if theirrigation could have been managed more effectively.
30 CM 60cm
kPa kPa1 6 302345 22 426789 56 61 7 hr Irrigation10 3 4011 6 10121314 33 18 3 hr Irrigation1516 7 231819 8 mm of effective rainfall20 17 2921222324 25 342526 50 40 6 hr Irrigation2728 5 8293031 16 14

6 Irrigation Scheduling, V1.doc 01/11/02 Page 27
The table below shows you how to interpret tensiometer readings.Readings
(cb or kPa)Interpretation
0 to 10 Soil is very wet. Continualreadings in this rangeindicate excessiveirrigation and waterlogging.Plant root damage highlyprobable
10 to 25 Best balance of soilmoisture and air. Ideal forplant growth.
25 to 40 Soil moisture sufficient forplant growth. May need toirrigate on light soils.
40 to 60 Soil is getting dry. Cropsare probably stressed.Crops should be irrigatedin this range.
Over 60 Irrigate before this level isreached!
Tensiometer gauges measure negativepressure, or suction. Gauges do notnormally display the ‘-‘ sign that you maysee in written material, for example –20kPa.