iq - hsbc … · and investment strategy unit of hsbc global asset ... the reforms both unlocked...
TRANSCRIPT

ARE NOT A BANK DEPOSIT OR
OBLIGATION OF THE BANK OR ANY OF ITS AFFILIATES
ARE NOT FDIC
INSURED
ARE NOT INSURED BY ANY FEDERAL GOVERNMENT
AGENCY
ARE NOT GUARANTEED BY THE BANK OR ANY OF ITS AFFILIATES
MAY LOSE VALUE
In the US, Investment Products:
Insideuu Taking a balanced view of
Brazil’s problems and prospects
uu Market focus: India’s challenge
uu Ask the expert: outlook for developed market credit
uu Navigating markets
uu Global data watch
Focus on emerging markets
IQ Investment Quarterly Q4 2013

uu Overview 4
uu Taking a balanced view of Brazil’s problems and prospects 6
uu Market focus: India’s challenge 10
uu Ask the expert: outlook for developed market credit 14
uu Navigating markets 16
uu Global data watch 18
uu Contributors 26
Contents
IQ is part of a suite of investment communications produced by the Macro and Investment Strategy Unit of HSBC Global Asset Management. The views expressed herein are as at end of September 2013 and subject to change, as the macroeconomic environment evolves.
2

Q4 2013 3

Overview
IntroductionTwo related issues have dominated asset markets in the third quarter: the prospects for the US Federal Reserve (Fed) to taper or not its Quantitive Easing (QE) program and the potential impact of rising US Treasury yields and tighter global liquidity on emerging market (EM) currencies and asset markets.
In the fourth quarter, these issues will still be important, as will the current ongoing fiscal negotiations in the US. However, beneath the surface, another more encouraging trend has been taking place, a cyclical improvement across the major developed economies, i.e., the US, Europe and Japan. In time, this should also feed through to an improving growth outlook for many emerging markets, especially those which are major exporters to the developed world.
The upshot is that despite the various understandable concerns related to Fed tapering and EM asset markets, we remain positive overall on risk assets, especially given still attractive valuations relative to “safe haven” government bonds. Having said that, the recent volatility in EM markets over the past few months has highlighted not all EM countries can be considered equally, and instead that a case by case assessment and careful selection is often needed. Those EM countries with high inflation rates and large current account deficits – and therefore most dependent on capital inflows to fund these deficits – have generally suffered the most, seeing the sharpest depreciation in their currencies and falls in their stock markets. These moves have also highlighted the need for reform in many of these countries.
This is why it is important to consider the merits of these countries on an individual basis. This edition of IQ focuses on two key emerging markets, namely India and Brazil, which have been under the investor spotlight recently. We also consider the outlook for emerging markets and asset markets in general in our “Navigating Markets” article, and look at the outlook for developed market credit in our “Ask the Expert” section.
Brazil: problems and prospectsIt is interesting to note that just about three years ago, Brazil was considered one of the rising stars among emerging economies, with inflation having been brought under control, improved government and finances and strong growth. However, since then, Brazil’s macro performance has mostly disappointed expectations and this has affected investor perception of its long-term outlook. Indeed, sentiment towards the country has significantly deteriorated. The key questions now are: is such pessimism justified or not, and what should be done to change this perception? Our view is that the reality is not as positive as previously thought, but it is not as negative as currently perceived either. It
seems reasonable to expect some improvement in terms of economic figures in the coming years, while some adjustments on the policy side will be taken amid a growth strategy more focused on productive investments and raising potential growth.
Market focus: India’s challengeThe Indian economy has achieved remarkable development over the past two decades since economic reforms were introduced in 1991. The reforms both unlocked India’s vast growth potential and unleashed powerful entrepreneurial forces. Additional economic liberalization in the 2000s moved the country toward a market-based economy and greater openness to trade and investment. However, since the 2008-09 global financial crisis, India has had to contend with a difficult macro environment, with widening fiscal and current account deficits, slowing growth and persistently high inflation. India pursued an expansionary fiscal policy to boost domestic demand to offset export declines during the global financial crisis and as a result the budget deficit surged.
Indian rupee volatility, external funding risks, weak growth and concern about twin deficits will likely weigh on the Indian equity market in the near term, especially as the political calendar becomes more of a focus heading to the general elections in 2014. However, the current valuations of Indian stocks on the 12-month forward price-to-earning and price-to-book basis are low compared to the market’s own history, especially in some cyclical sectors, and on a micro level, we see opportunities in quality cyclical sectors and stocks with earnings visibility. Concrete progress on structural reforms to boost long-term growth prospects and, on fiscal consolidation could be a medium-term fundamental catalyst for the markets. In addition, India’s appealing long-term consumption and demographic story remains intact.
Ask the expert: outlook for developed market credit We expect that government bond yields will trend higher as global economic growth improves and some QE programs are phased out. In this environment, government bonds and high-grade corporate bonds may struggle to achieve positive returns with low starting yields and the headwind of rising yields. By contrast, we believe that lower-rated corporate bonds such as BBB-rated and high yield BB- and B-rated areas can provide attractive returns. Indeed, this economic growth outlook should be positive for these corporate bonds. The quality of balance sheets is affected by economic conditions with rising sales and healthy liquidity conditions, which are generally good for company fundamentals. In particular, defaults in high yield markets are usually linked with broad financial distress and difficult economic conditions – which we do not expect
4

in the near future. Unlike governments, the corporate sector, excluding financials, was in pretty good shape going into the economic crisis in 2008-2009 with reasonable balance sheets, healthy profit margins and cash flow. Since the crisis, this broadly conservative stance has placed the corporate sector in a strong position to ride out the subsequent economic turbulence with improving cash flows in most sectors in the US and Europe. As US economic growth picks up and Europe emerges from recession, we are seeing moderate growth in company leverage in some areas, but corporate earnings remain robust and ratios that measure the ability of companies to service debt are well within acceptable ranges.
Navigating marketsRisk assets sold off early in the third quarter on fears that the Fed would start reducing (“tapering off”) its QE program. Eventually, the Fed refrained from tapering and this news was welcomed by investors, allowing risk assets to end higher in the third quarter. Evidence of a stabilization in the Chinese economy and improvement in the US and eurozone also helped. Year-to-date the main developed world equity indices
remain in positive territory. Emerging market equities are more mixed with some markets like Brazil, India and Turkey being substantial underperformers relative to developed markets and to emerging market peers. However, we believe valuations across many emerging markets are at attractive levels, and we believe the sell-off in EM hard and local currency bonds has made many EM investment grade credits look attractive, though careful selection is still required.
Global data watchEconomic growth in the developed world picked up in the second quarter, with the US, UK, eurozone and Japan all posting higher year-over-year second quarter GDP numbers. Consumer spending, although still weak in the developed world, has also started to pick up. US unemployment is off its highs and closing in on the 7% level. However, EM growth fell slightly in the second quarter of this year in a number of key economies, including China, India and Russia. The latest consensus forecast data shows downward revisions to economic growth expectations for the US in 2013, while eurozone growth prospects for both 2013 and 2014 have been revised upward.
Q4 2013 5

Taking a balanced view of Brazil’s problems and prospectsEduardo Jarra Head of Macro Research and Strategy, Brazil
Not so long ago, headlines about Brazil mostly revolved around its strong growth and future prospects. However, nowadays headlines seem to focus more on disappointing economic data and problems impacting the country’s prospects.
We believe that the true picture has elements of both: perspectives are not as rosy as perceived in the past, but also not as negative as currently believed. If this is a reasonable view, one could expect a future path that will show some improvement, especially in terms of economic growth, probably accompanied by heated discussions regarding future challenges.
To make things more complicated, investors must deal with two critical themes. On the external front, the global scenario now looks more challenging for Brazil, with higher global interest rates following the recent sell-off in global bond markets and Chinese growth that is unlikely to return to the heady levels of the pre-crisis period; in other words, less favorable conditions in terms of external financing and commodity prices. On the domestic side, presidential elections are scheduled for next year on the back of modest growth and high inflation, hardly a supportive backdrop for necessary economic reforms and structural adjustment.
Taking a balanced view, there are also some key positives. The country has benefited from several structural advances during the past couple of decades, increasing the resilience of the economy and creating important engines for future growth.
The golden yearsFrom 2004 to 2010, the Brazilian economy achieved an average growth rate of 4.5%. This was impressive for a country used to growth of close to 2% in previous years (see chart below). Of course, this was also a favorable phase for many countries, including Brazil’s neighbors in Latin America (see table opposite).
Several factors led to this. On the external side, the trade balance posted a solid performance, hugely supported by commodities. At the same time, external financing was abundant, with foreign investors happy to invest in both the real and financial sectors of the economy.
This was also the phase where the country reaped the dividends from reforms implemented since the 1990s. For instance, credit growth accelerated (see chart below), providing large parts of society with access to goods and services not affordable to them in the past, e.g., cars, housing, etc. The government also had the opportunity to improve its social programs, i.e., welfare payments, increasing the minimum wage, etc., and there was also a dramatic reduction in the unemployment rate (see chart on page 8). Against this backdrop, it is no coincidence that confidence among businessmen and investors was generally high, with substantial growth in productive investment as a consequence.
However, on the negative side, during this period the administration virtually halted economic reform, and this has created a constraint on economic expansion in the coming years.
-2
-1
0
1
2
3
4
5
6
7
8
1995 1997 1999 2001 2003 2005 2007 2009 2011 2013
Forecast GDP growthActual GDP growth
GDP growth in Brazil (%)
Source: IBGEAny forecast, projection or target contained in this presentation is for information purposes only and is not guaranteed in any way. HSBC accepts no liability for any failure to meet such forecasts, projections or targets. Data as at September 2013
Latin America growth rates (%)
2004-2010 avg. 2011-2014 avg.
Brazil 4.5 2.1
Chile 4.6 5.0
Colombia 4.7 4.5
Mexico 2.3 3.7
Peru 6.8 6.2
Sources: IMF and HSBC Global Asset Management. Any forecast, projection or target contained in this presentation is for information purposes onlyand is not guaranteed in any way. HSBC accepts no liability for any failure to meet such forecasts, projections or targets. Data as at September 2013
30
35
40
45
50
55
60%
2007 2008 2009 2010 2011 2012 2013
Substantial credit growth (credit to GDP, %)
Source: Brazilian Central BankAny forecast, projection or target contained in this presentation is for information purposes only and is not guaranteed in any way. HSBC accepts no liability for any failure to meet such forecasts, projections or targets. Data as at September 2013
6

Q4 2013 7
Taking a balanced view of Brazil’s problems and prospects
Reality checkSince 2011, the macro landscape has changed. Economic performance has been disappointing with GDP growth on average at 2% and inflation remaining stubbornly above the middle of the target range, currently at 4.5%. If our scenario happens to be correct, 2013 and 2014 will likely tell a similar story. By regional standards, this has also been a disappointment. To some extent, this is a natural consequence of the international scenario, but this picture also reflects important domestic factors.
First, there is a fading impact of the drivers that propelled the economy during the previous years, which can be considered a natural stabilization, not a reversion, of the trend seen within credit, the labor market, social programs and other areas. This means that the economy could not have kept growing simply as a result of a focus on consumption and commodities.
Second, the lack of structural reform and infrastructure investment since 2004 has led to a loss of competitiveness, not to mention an important driver of growth rates in the short term.
Finally, the policy strategy adopted during these years did not help. Policy stimulus through interest rate cuts, despite high inflation, was accompanied by fiscal and public credit expansion. The consequence has been to reduce confidence, push up inflation and curb real income expansion.
The road aheadThe question now is: can the country return to a more virtuous path? For that, economic growth must accelerate without adding to inflationary pressures and there needs to be a more balanced macro-economic framework.
There are grounds for hope. Although on a cyclical basis commodities are weaker, prospects for the long term are still positive, with Brazil in good shape to be a key supplier of hard and soft commodities and benefit from related investment in production and infrastructure. Domestic demand also has several positive drivers for future expansion. Consumption is likely to continue on the back of rising and better distributed income. In terms of investment, there is strong consensus on the need for improved infrastructure. The message here is straightforward: the country does not need to leverage to grow, only to create conditions for this potential demand to materialize over the coming years.
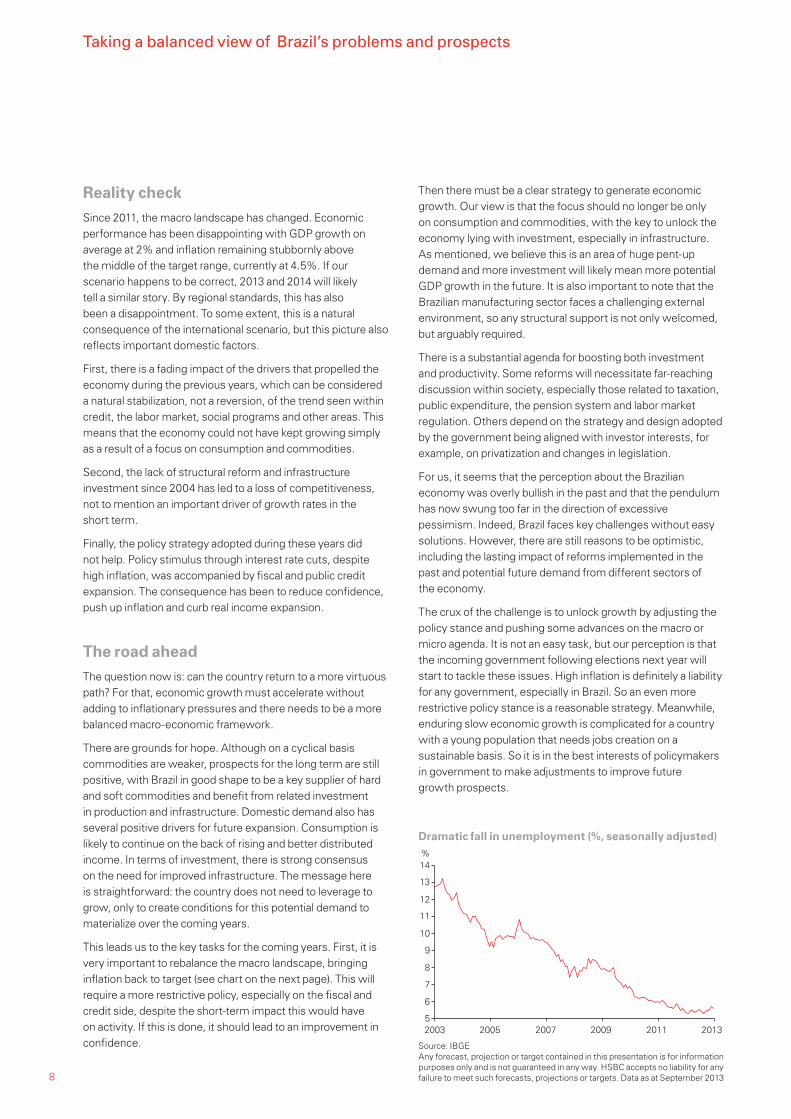
This leads us to the key tasks for the coming years. First, it is very important to rebalance the macro landscape, bringing inflation back to target (see chart on the next page). This will require a more restrictive policy, especially on the fiscal and credit side, despite the short-term impact this would have on activity. If this is done, it should lead to an improvement in confidence.
Then there must be a clear strategy to generate economic growth. Our view is that the focus should no longer be only on consumption and commodities, with the key to unlock the economy lying with investment, especially in infrastructure. As mentioned, we believe this is an area of huge pent-up demand and more investment will likely mean more potential GDP growth in the future. It is also important to note that the Brazilian manufacturing sector faces a challenging external environment, so any structural support is not only welcomed, but arguably required.
There is a substantial agenda for boosting both investment and productivity. Some reforms will necessitate far-reaching discussion within society, especially those related to taxation, public expenditure, the pension system and labor market regulation. Others depend on the strategy and design adopted by the government being aligned with investor interests, for example, on privatization and changes in legislation.
For us, it seems that the perception about the Brazilian economy was overly bullish in the past and that the pendulum has now swung too far in the direction of excessive pessimism. Indeed, Brazil faces key challenges without easy solutions. However, there are still reasons to be optimistic, including the lasting impact of reforms implemented in the past and potential future demand from different sectors of the economy.
The crux of the challenge is to unlock growth by adjusting the policy stance and pushing some advances on the macro or micro agenda. It is not an easy task, but our perception is that the incoming government following elections next year will start to tackle these issues. High inflation is definitely a liability for any government, especially in Brazil. So an even more restrictive policy stance is a reasonable strategy. Meanwhile, enduring slow economic growth is complicated for a country with a young population that needs jobs creation on a sustainable basis. So it is in the best interests of policymakers in government to make adjustments to improve future growth prospects.
5
6
7
8
9
10
11
12
13
14%
2003 2005 2007 2009 2011 2013
Dramatic fall in unemployment (%, seasonally adjusted)
Source: IBGEAny forecast, projection or target contained in this presentation is for information purposes only and is not guaranteed in any way. HSBC accepts no liability for any failure to meet such forecasts, projections or targets. Data as at September 20138

Taking a balanced view of Brazil’s problems and prospects
2.02.53.03.54.04.55.05.56.06.57.07.58.0%
2005 2007 2009 2011 2013
Consumer price inflation needs to be curbed (%)
Source: Brazilian Central BankAny forecast, projection or target contained in this presentation is for information purposes only and is not guaranteed in any way. HSBC accepts no liability for any failure to meet such forecasts, projections or targets. Data as at September 2013
2003 2005 2007 2009 2011 20130
50
100
150
200
250
300
350
400USDbn
International reserves – Brazil (in USD billion)
Source: Brazilian Central BankAny forecast, projection or target contained in this presentation is for information purposes only and is not guaranteed in any way. HSBC accepts no liability for any failure to meet such forecasts, projections or targets. Data as at September 2013
Q4 2013 9

Market focus: India’s challengeRenee Chen Investment Strategist, Macro and Investment Strategy
uu Large twin deficits, weak private CAPEX and structural constraints on capacity and productivity are ongoing risks
uu Structural reforms are key to long-term prospects for growth and asset markets
Market fundamentals Growth driversThe Indian economy has achieved remarkable development over the past two decades since economic reforms were introduced in 1991. The reforms reduced import restrictions, increased foreign competition, ended state monopolies in many industries, liberalized the Foreign Direct Investment (FDI) regime, developed national infrastructure and led to a sharp rise in productivity. They both unlocked India’s vast growth potential and unleashed powerful entrepreneurial forces. Additional economic liberalization in the 2000s has moved the country toward a market-based economy and greater openness to trade and investment.
The economy grew by 7% a year on average over the past two decades and by over 9% in fiscal year (FY) 2006-2008 just before the global financial crisis. Per capita, GDP grew more than four times from below USD350 in FY1990 to USD1,526 in FY2012. India has relied on services rather than manufacturing as an engine of growth. It has become one of the leading destinations for global information technology and other services outsourcing. The supply of human capital in India met increased demand from foreign companies that looked to out-source their operations.
India’s growth prospects have been supported by strong domestic demand and economic liberalization and reform. The country’s long-term economic growth is also likely to benefit from its “demographic dividend” with a working age population that is expected to grow until at least the middle of this century, unlike many other countries, including China, which will have to contend with an ageing population.
Key economic risksHowever, since the 2008-09 global financial crisis, India has had to contend with a difficult macro environment, with widening fiscal and current account deficits, slowing growth and persistently high inflation. India pursued an expansionary fiscal policy to boost domestic demand to offset export declines during the crisis. As a result, the fiscal deficit surged to almost 10% of GDP in FY2009 from 4.8% in FY2008 and has remained substantial at 7-9% since then. Rising subsidies have contributed to fiscal pressures, with fuel, food and fertilizer subsidies accounting for 2.5% of GDP in FY2013. The large subsidies have also “crowded out” high-priority public spending on areas, such as infrastructure, education and health.
Continued sluggish growth and the recent Indian rupee (INR) depreciation will likely make it difficult to achieve the deficit target while global oil prices and pre-election populist measures remain risks. To attain fiscal consolidation and ward off the risk of a sovereign rating downgrade, the government will probably have to cut expenditure significantly.
India’s current account deficit widened to previously unseen levels of 4.8% of GDP in FY2013 and 4.2% in FY2012 from close to 1% in FY2006-2008 and a surplus in FY2002-2004. The larger fiscal deficit, supply-side constraints and low real interest rates – encouraging households to allocate their savings into gold and property – were behind the larger current account deficit. India has increasingly relied on foreign capital and corporate external borrowings to finance its current account deficit; hence it is highly exposed to external funding risks. While we expect the current account deficit to narrow in the coming quarters on lower gold and oil imports, slower domestic demand and the lagged impact of INR weakness, it will likely remain above the 2.5% of GDP indicated by the Reserve Bank of India (RBI) as a sustainable level.
The sharp depreciation of INR in May-June on heightened concern over India’s funding risks, amid expectations of an approaching end to QE in the US, forced the RBI to take liquidity tightening measures in July, pushing the overnight interbank
-12
-10
-8
-6
-4
-2
0
2
4
6
FY91 FY94 FY97 FY00 FY03 FY06 FY09 FY11*
% of GDP
-6
-5
-4
-3
-2
-1
0
1
2
3
Consolidated fiscal balance (lhs) Current account balance (rhs)
India’s twin deficits
*Includes one-off telecom revenue Sources: RBI and CEIC
0
5
10
15
20
25
30
35
FY91 FY94 FY97 FY00 FY03 FY06 FY09 FY12
% of GDP
0
2
4
6
8
10
12
14
16
18
20% of GDP
Capital investment (lhs) Private corporate CAPEX (rhs)
Weak investment cycle in India
Source: RBI
10

Q4 2013 11

12

Market focus: India’s challenge
rate up 300 basis points (bp), although the interest rate defence measures were partially rolled back at the RBI’s 20 September meeting when it raised the policy repo rate by 25bp to anchor inflation and inflation expectations. Tighter monetary and fiscal controls will likely have a negative impact on growth.
Growth has slowed significantly since FY2012 on persistent weakness in industrial activity and sluggish global trade. The slowdown also reflected domestic supply bottlenecks and a significant deceleration in private capital investment. Consumption has also slowed on job and income growth and high inflation, although the good monsoon rainfall has improved the outlook for agricultural production.
Structural constraints on capacity and productivity have put pressure on inflation. The surge in rural wages since early 2009 without a matching increase in productivity was also behind high inflation, despite a recent deceleration in rural wage growth. In the near term, the pass-through from currency weakness, energy price hikes, elevated inflation expectations and global oil price developments poses inflation risks.
Accelerating implementation of and continued efforts on structural reforms to adjust imbalances in the economy, revitalize investment and unlock supply constraints, while adhering to fiscal consolidation, are the only sustainable solutions for India to return to high growth and macro stability. Over the past year, the authorities have been making moves in the right direction by initiating policy reforms such as liberalizing foreign direct investment limits, reducing the fuel subsidy and most recently the RBI’s package of financial sector reforms. However, recent external developments have exposed ongoing weaknesses and increased the urgency to accelerate the pace of reforms.
PoliticsThe Indian political system is characterized by one of the world’s largest multi-party coalition governments and by a high degree of fragmentation and vigorous competition between parties. Each of the regional parties has its own agenda and often the agendas and ideologies of national and regional parties do not match. The latest opinion polls suggest that in the upcoming general elections (due in May 2014), neither the governing Congress Party nor the opposition Bharatiya Janata Party is likely to win convincingly to form a strong government. As a result, there is a risk that an unstable coalition government will add political risks to the current macro-economic challenges.
Financial marketsCurrencyThe INR has been one of the weakest emerging market currencies year-to-date, down about 11% against the USD (as of 7 October), although it rebounded from record lows after recent RBI measures designed to ease depreciation. In the near term, the INR is likely to remain volatile in a global environment characterized by the prospects of Fed QE “tapering” and rising US yields, as well as challenging external funding conditions on the back of weak macro fundamentals. Currency moves will likely remain data dependent. However, the INR real effective exchange rate has fallen substantially below its long-term average and on a number of longer-term valuation metrics now looks undervalued. In the longer term, the INR could stabilize or appreciate on a more sustainable basis if the external environment stabilizes and India’s macro fundamentals strengthen as a result of structural reform.
Equity marketINR volatility, external funding risks, weak growth and capital expenditure plus concern about the twin deficits will likely weigh on the Indian equity market in the near term, as the political calendar becomes more of a focus heading to the general elections. The current valuations of Indian stocks, on the 12-month forward price-to-earning and price-to-book basis, are low compared to the market’s own history – especially in some cyclical sectors. On a micro level, we see opportunities in quality cyclical sectors and stocks with earnings visibility. Concrete progress on structural reforms to boost long-term growth prospects and on fiscal consolidation could be a medium-term fundamental catalyst for the markets. Beyond the immediate term, India’s appealing long-term consumption and demographic story remains intact.
Fixed incomeIn the near term, we are relatively cautious on Indian debt – both local rates and credit – given external risks related to Fed policy and US interest rates, India’s macro headwinds and tight monetary conditions. There is also a threat of a credit rating downgrade, though this may not be immediate or our base-case scenario. In the longer term, we see opportunities in India’s high-yielding capital markets with the potential for INR appreciation if external risks recede and macro fundamentals improve, and as India continues to develop its corporate bond market.
Q4 2013 13
Ask the expert: outlook for developed market creditMarcus Pakenham Director, Product Specialist
We expect that government bond yields will trend higher as global economic growth improves and some Quantitative Easing (QE) programs are phased out. In this environment, government bonds and high-grade corporate bonds may struggle to achieve positive returns with low starting yields and the headwind of rising yields. By contrast, we believe that lower-rated corporate bonds, such as BBB-rated, high yield BB- and B-rated areas can provide attractive returns in this scenario. These assets have higher starting yields and the duration, or sensitivity to movements in government bond yields, is generally lower than for higher-rated corporate bonds.
In this article, we consider the improving economic environment and its likely positive impact on company fundamentals. We also highlight the improvement in the banking sector over the past four years, which is a positive for the wider corporate sector. Finally, we focus on default rates and conclude that, in our view, the environment is positive for some parts of the lower-rated global corporate sector.
Improving global economyWe believe that recent economic performance has been reasonable given the impact of government austerity campaigns. The International Monetary Fund (IMF) has estimated that the impact of this so-called “fiscal drag” on GDP in 2013 has been -1.8% in the US, -1.1% in the UK and -0.8% in the eurozone. One reason why we expect economic growth to improve in 2014 is that these budgetary headwinds to growth should ease to -0.7%, -0.9% and -0.1% in these respective areas.
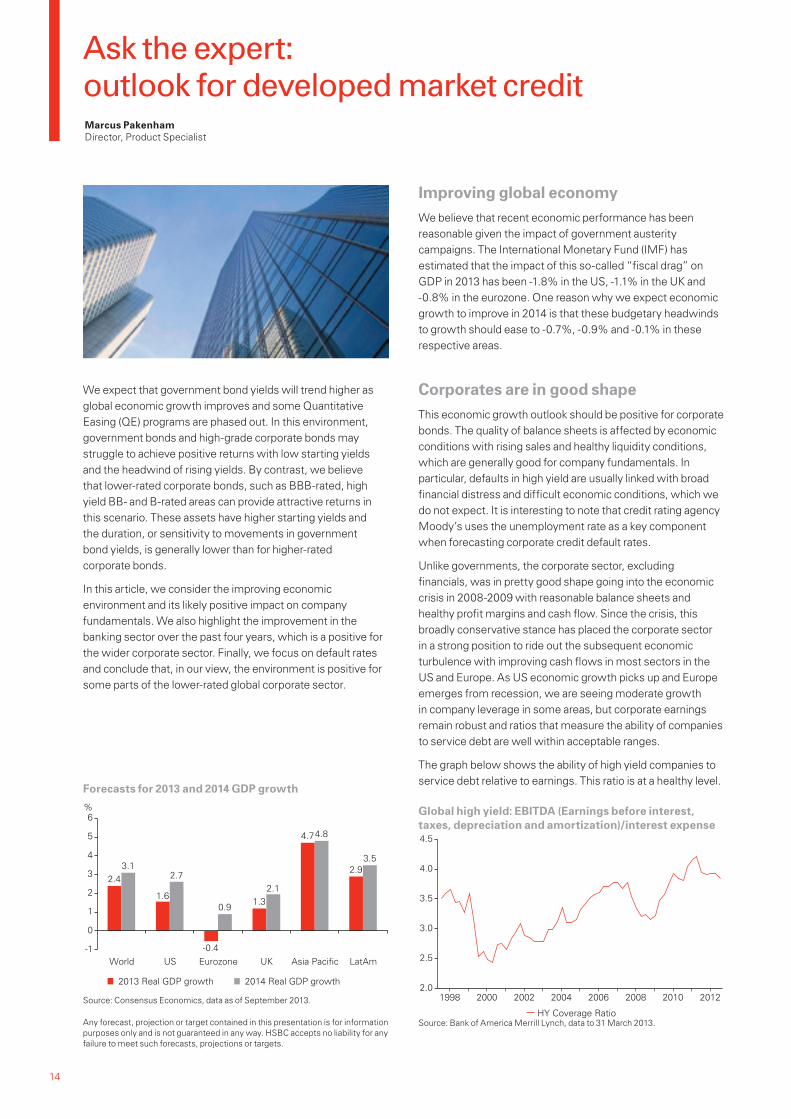
Corporates are in good shapeThis economic growth outlook should be positive for corporate bonds. The quality of balance sheets is affected by economic conditions with rising sales and healthy liquidity conditions, which are generally good for company fundamentals. In particular, defaults in high yield are usually linked with broad financial distress and difficult economic conditions, which we do not expect. It is interesting to note that credit rating agency Moody’s uses the unemployment rate as a key component when forecasting corporate credit default rates.
Unlike governments, the corporate sector, excluding financials, was in pretty good shape going into the economic crisis in 2008-2009 with reasonable balance sheets and healthy profit margins and cash flow. Since the crisis, this broadly conservative stance has placed the corporate sector in a strong position to ride out the subsequent economic turbulence with improving cash flows in most sectors in the US and Europe. As US economic growth picks up and Europe emerges from recession, we are seeing moderate growth in company leverage in some areas, but corporate earnings remain robust and ratios that measure the ability of companies to service debt are well within acceptable ranges.
The graph below shows the ability of high yield companies to service debt relative to earnings. This ratio is at a healthy level.
2.0
2.5
3.0
3.5
4.0
4.5
1998 2000 2002 2004 2006 2008 2010 2012
HY Coverage Ratio
Global high yield: EBITDA (Earnings before interest, taxes, depreciation and amortization)/interest expense
Source: Bank of America Merrill Lynch, data to 31 March 2013.
2.4
1.6
-0.4
1.3
4.7
2.93.12.7
0.9
2.1
4.8
3.5
-1
0
1
2
3
4
5
6%
2014 Real GDP growth2013 Real GDP growth
World US Eurozone UK Asia Pacific LatAm
Forecasts for 2013 and 2014 GDP growth
Source: Consensus Economics, data as of September 2013.
Any forecast, projection or target contained in this presentation is for information purposes only and is not guaranteed in any way. HSBC accepts no liability for any failure to meet such forecasts, projections or targets.
14

Banks are also improvingThe 2008-2009 financial crisis clearly highlighted the exposure of the banking sector to US mortgage debt and eurozone sovereign debt. The subsequent loan losses and pressure on capital have necessitated significant efforts to repair balance sheets with new capital or retained earnings. In addition, banking regulators in the US and Europe have sought to improve the resilience of banks to systemic shocks in the future. The main focus of this process has been on strengthening the capital base, both in terms of quantity and quality, and on more stringent restrictions on risk-taking. These efforts are yielding results and the capital ratios of US and European banks have eventually improved significantly during the past four years.
Corporate defaults should remain lowDefaults are at a low level and below historic averages, as a result of prudent financial policies that most corporates have adopted since the crisis: a focus on cost cutting, paying down debt and increasing the average maturity of outstanding debt.
Major credit rating agencies are currently forecasting the continuation of these below-average default rates.
Opportunities in lower-rated creditsWe expect higher yields in most government bond markets as global growth improves, QE programs are phased out and we move closer to rate increases from central banks.
In this environment, government bonds and highly-rated credit, where credit spreads are tight, may struggle to achieve positive returns. By contrast, we believe that lower-rated elements of the credit market can provide higher yields with lower duration. In addition, when government yields are rising these lower-rated bonds has the potential to achieve attractive investment returns as spreads often fall as improved economic conditions help company fundamentals.
The lower-rated bonds that we believe are attractive are typically BBB, BB and B rated. We expect that the more highly rated bonds will be more vulnerable to higher government yields. CCC-rated bonds generally have high yields, but there is a correspondingly much higher chance of default.
We also believe that there are advantages in investing on a global basis. This provides a larger universe of companies and bonds, with a diversified mix of sector influences. There are also differences in economic factors and company performance between regions, which can provide asset allocation opportunities.
0
2
4
6
8
10
12
14%
2006 2007 2008 2009 2010 2011 2012
US core tier 1 capital ratioEuropean core tier 1 capital ratio
Banks improving capital ratios
Sources: Autonomous Research, data at 19 August 2013. European data average of 19 banks. US data average of Bank of America, Citigroup and JP Morgan.
0
5
10
15
20
25
30
35
1999 2001 2003 2005 2007 2009 2011 2013
EM HYEU HYUS HY
High yield bond default rates historically low
Source: Bank of America Merrill Lynch as of 30 June 2013
Q4 2013 15

Navigating marketsJulien Seetharamdoo Senior Macro and Investment Strategist
Despite having a poor start to the third quarter, risk assets managed to end the quarter on a positive note as combinations of improving global macro data and the US Federal Reserve’s (Fed) decision not to “taper” its Quantitative Easing (QE) asset purchase program, contrary to most analysts and investors’ expectations, helped investor sentiment.
In Europe, the Bank of England and the European Central Bank have adopted a type of “forward guidance” in their communication policy, which has further helped risk appetite in the region. Emerging market (EM) macro data has also shown signs of stabilization with Asian data, China in particular, improving in the past month or two.
Looking at specific asset classes, equities globally have performed strongly in the third quarter with the MSCI World and MSCI emerging markets indices advancing 7.4% and 5.0% in USD terms, respectively. Regionally, the Euro Stoxx 50 Index and the Shanghai Composite have fared the best gaining 11.1% and 9.9%, respectively.
Likewise, commodities did well in the past quarter. Oil prices have been supported on supply concerns as geopolitical tensions over Syria in the third quarter intensified, while gold prices have advanced 7.6% on the Fed’s decision not to taper its bond-buying program. As for currencies, most major developed currencies have appreciated against the USD on dollar weakness after the Fed decided to hold back on “tapering” QE at its September meeting.
EM currency performance was more mixed. Most notable was the depreciation of the Indian rupee (INR) and the Indonesian rupiah (IDR). The INR depreciated to an all-time low in the past quarter on concern about external funding conditions. The INR, however, at the end of August/early September managed to gain back some of its initial losses on the back of broad stabilization in the emerging market assets. What is more, on 20 September the Reserve Bank of India (RBI) unexpectedly hiked policy rates in an attempt to further stabilize the INR though rates may have to rise further still to reassure investors. The IDR has depreciated considerably as well in the past quarter as the country struggles with external imbalances and inflationary pressures.
Lastly, in the fixed income universe, corporate credit outperformed “safe haven” government bonds in the past quarter. Indeed, major “safe haven” developed government bond yields have risen across the board on the back of initial Fed “tapering” concerns and stronger macro data.
It is important to put the recent volatility in EM financial assets in an historical context, especially for long-term investors. In our view, the fundamentals for most EMs, while not perfect, are far better than they were in the late ‘90s at the time of the East Asian financial crisis and in the ‘80s during the many financial crises in Latin America. This makes the chances of a generalized contagious crisis in EM much lower.
0
500
1,000
1,500
2,000
2,500
3,000
3,500
4,000USD Billions USD Billions
09/0
3
09/0
4
09/0
5
09/0
6
09/0
7
09/0
8
09/0
9
09/1
0
09/1
1
09/1
2
06/1
3
0
100
200
300
400
500
600
Indonesia (rhs) Russia (rhs) Turkey (rhs)Brazil (rhs) China (lhs) India (rhs)
FX reserves
Source: JEDH/World Bank, as of September 2013
0
5
10
15%
Asi
an IG
US
Cor
p
Glo
bal H
Y
Glo
bal E
M
Glo
bal A
gg
Gol
d
WTI
Cru
de O
il
Sha
ngha
i Com
p
Indi
a S
ense
x
MS
CI E
M
Nik
kei 2
25
FTS
E 1
00
Eur
o S
toxx
S&
P 5
00
MS
CI W
orld
Equities Commodities Bonds
Market performance for Q3
Source: Bloomberg, data as of September 2013
16

For example, external debt levels are lower, foreign exchange reserves higher and these countries are no longer trying to defend fixed exchange rate regimes. Generally speaking, macro policy is better, though not perfect, as current account deficits have widened and inflation is above target in some countries (e.g., Brazil, India and Indonesia). This emphasizes the need for reform in some of these countries to open up further product and labor markets and raise long-term sustainable growth rates. Indeed, market pressure in the past has often been the catalyst for reforms in EM countries, leading in turn to improved financial market performance, and the same could happen this time around.
EM stocks appear to be trading at inexpensive valuations, making them attractive for us as long-term investors. We maintain our positive stance on EM equities, but given the volatility in the market and the divergence in performance, we also see the need to be selective.
In terms of the outlook for asset markets more generally, the improving cyclical picture in developed markets and China is encouraging. From a multi-asset perspective, we continue to favor risk assets, including developed and EM equities and hard and local currency bonds over “safe haven” government bonds.
Q4 2013 17

Global data watchParas Patel Associate, Macro and Investment Strategy
Headline inflation – developed markets (% yoy)
-3
-2
-1
0
1
2
3
4
5
6
Sep
-07
Jan-
08
May
-08
Sep
-08
Jan-
09
May
-09
Sep
-09
Jan-
10
May
-10
Sep
-10
Jan-
11
May
-11
Sep
-11
Jan-
12
May
-12
Sep
-12
Jan-
13
Jun-
13
Eurozone Japan UK US
%
Annual real GDP growth – BRIC markets (% yoy)
-15
-10
-5
0
5
10
15
Sep
-07
Jan-
08
May
-08
Sep
-08
Jan-
09
May
-09
Sep
-09
Jan-
10
May
-10
Sep
-10
Jan-
11
May
-11
Sep
-11
Jan-
12
May
-12
Sep
-12
Jan-
13
Jun-
13
Brazil China India Russia
%
Headline inflation – BRIC markets (% yoy)
-4-202468
10121416
Sep
-07
Jan-
08
May
-08
Sep
-08
Jan-
09
May
-09
Sep
-09
Jan-
10
May
-10
Sep
-10
Jan-
11
May
-11
Sep
-11
Jan-
12
May
-12
Sep
-12
Jan-
13
Jun-
13
Brazil China India (WP) Russia
%
Key highlights uu Growth: Economic growth in the developed world picked
up in Q2 2013, with the US, UK, eurozone and Japan, all posting higher year-over-year Q2 GDP numbers. In contrast, most of the BRIC economies have seen their GDP growth rates fall in Q2 2013. Brazil is the only major exception, where the economy grew faster in Q2 than Q1.
uu Inflation: Inflation in Japan, the UK and US picked up in Q2, with Japan now showing positive growth. Inflation for the BRIC economies was more mixed with India posting falls, while China and Brazil posted higher figures for Q2. Russian inflation also increased marginally.
uu Industrial production: Industrial production (IP) for the developed world was mixed; in the US, IP growth slowed modestly in the past quarter, while it rose in the UK. Contraction in IP for Japan and the eurozone has slowed, while it remains mixed for most of the BRIC economies.
uu Labor markets: Labor markets in the US have shown further signs of improvement with the latest monthly data showing unemployment falling to 7.7%. The labor market in the eurozone has remained relatively unchanged, but there has been some improvement in the UK in recent months.
Annual real GDP growth – developed markets (% yoy)
-10
-8
-6
-4
-2
0
2
4
6
8%
Sep
-07
Jan-
08
May
-08
Sep
-08
Jan-
09
May
-09
Sep
-09
Jan-
10
May
-10
Sep
-10
Jan-
11
May
-11
Sep
-11
Jan-
12
May
-12
Sep
-12
Jan-
13
Jun-
13
Eurozone Japan UK US
GDP growth for the developed world picked up in Q2 2013, with the US, UK, eurozone and Japan all posting higher GDP year-over-year numbers than in Q1.
Inflation in Japan, the UK and US picked up in Q2 compared to Q1, with Japan now showing a positive inflation figure. In the eurozone it continued to fall in Q2.
In contrast, most of the BRIC economies have seen their economic growth rates fall in Q2. Brazil is the only economy where Q2 GDP growth came in higher than in Q1.
Inflation for the BRIC economies was more mixed with India posting falls while China and Brazil posted higher inflation figures for Q2. In Russia, inflation increased marginally.
Sources: MSCI, Thomson Reuters Datastream and Bloomberg Q2 data as at September 18, 2013
Sources: MSCI, Thomson Reuters Datastream and Bloomberg Q2 data as at September 18, 2013
Sources: MSCI, Thomson Reuters Datastream and Bloomberg Q2 data as at September 18, 2013
Sources: MSCI, Thomson Reuters Datastream and Bloomberg Q2 data as at September 18, 2013
18

Industrial production – developed markets (% yoy)
-40
-30
-20
-10
0
10
20
30
40
Sep
-07
Jan-
08
May
-08
Sep
-08
Jan-
09
May
-09
Sep
-09
Jan-
10
May
-10
Sep
-10
Jan-
11
May
-11
Sep
-11
Jan-
12
May
-12
Sep
-12
Jan-
13
Jun-
13
Eurozone Japan UK US
%
Retail sales – developed markets (% yoy)
-10-8-6-4-202468
1012
Sep
-07
Jan-
08
May
-08
Sep
-08
Jan-
09
May
-09
Sep
-09
Jan-
10
May
-10
Sep
-10
Jan-
11
May
-11
Sep
-11
Jan-
12
May
-12
Sep
-12
Jan-
13
Jun-
13
Eurozone Japan UK US
%
Unemployment rates – developed markets (%)
0
2
4
6
8
10
12
14
Sep
-07
Jan-
08
May
-08
Sep
-08
Jan-
09
May
-09
Sep
-09
Jan-
10
May
-10
Sep
-10
Jan-
11
May
-11
Sep
-11
Jan-
12
May
-12
Sep
-12
Jan-
13
Jun-
13
Eurozone Japan UK US
%
Industrial production – BRIC markets (% yoy)
-20
-15
-10
-5
0
5
10
15
20
25
Sep
-07
Jan-
08
May
-08
Sep
-08
Jan-
09
May
-09
Sep
-09
Jan-
10
May
-10
Sep
-10
Jan-
11
May
-11
Sep
-11
Jan-
12
May
-12
Sep
-12
Jan-
13
Jun-
13
Brazil China India Russia
%
Retail sales – emerging markets (EM) (% yoy)
-15
-10
-5
0
5
10
15
20
25
Sep
-07
Jan-
08
May
-08
Sep
-08
Jan-
09
May
-09
Sep
-09
Jan-
10
May
-10
Sep
-10
Jan-
11
May
-11
Sep
-11
Jan-
12
May
-12
Sep
-12
Jan-
13
Jun-
13
Brazil China TaiwanRussia
%
Unemployment rates – emerging markets (%)
2
3
4
5
6
7
8
9
10
Sep
-07
Jan-
08
May
-08
Sep
-08
Jan-
09
May
-09
Sep
-09
Jan-
10
May
-10
Sep
-10
Jan-
11
May
-11
Sep
-11
Jan-
12
May
-12
Sep
-12
Jan-
13
Jun-
13
Brazil China Russia
%
Industrial production (IP) for the developed world was mixed with US IP growth falling modestly in the past quarter, while it rose in the UK. Contractions in IP for Japan and the eurozone has slowed in the past quarter.
Retail sales growth for the major developed economies has been positive in the past quarter. The US, UK, Japan and the eurozone, all posted higher retail sales growth (although retail sales growth is still in contractionary territory for the eurozone).
Labor markets in the US have shown further signs of improvement with the latest monthly data showing unemployment falling to 7.7%. The labor market in the eurozone remained relatively unchanged, but improvement was evident in the UK in recent months.
Labor markets in Asia remain relatively healthy despite slowing growth. Unemployment rates in Brazil continued to rise, while in Russia they fell and in China unemployment remained unchanged.
Consumer spending for the emerging markets countries has been more mixed in Q2 with China and Taiwan posting rising retail sales growth, while Russia and Brazil posted falling retail sales growth.
Industrial production for most of the BRIC economies remained mixed with Chinese IP growth stabilizing in the past quarter, while Russian and Indian IP growth fell. IP growth in Brazil posted its first quarterly positive number in the past seven quarters.
Sources: MSCI, Thomson Reuters Datastream and Bloomberg Q2 data as at September 18, 2013
Sources: MSCI, Thomson Reuters Datastream and Bloomberg Q2 data as at September 18, 2013
Sources: MSCI, Thomson Reuters Datastream and Bloomberg Q2 data as at September 18, 2013
Sources: MSCI, Thomson Reuters Datastream and Bloomberg Q2 data as at September 18, 2013
Sources: MSCI, Thomson Reuters Datastream and Bloomberg Q2 data as at September 18, 2013
Sources: MSCI, Thomson Reuters Datastream and Bloomberg Q2 data as at September 18, 2013
Q4 2013 19

Global data watch
Economic forecasts for 2013 and 2014
uu Growth: Consensus Economics’ global growth forecasts for 2013 and 2014 have been revised modestly lower to 2.4% and 3.1%, respectively. The most notable changes over the past three months have come in the US, China and India, where GDP growth forecasts for 2013 have been revised downwards.
uu Inflation: Consensus Economics’ global inflation forecasts through 2013 have been revised up slightly to 2.7% from 2.6% previously, while for 2014 forecasts remain unchanged at 3.0%. The most notable changes to forecasts for 2013 are for China and India, where inflation in China is expected to fall by 0.3% to 2.6%, while in India it is expected to rise by 0.6% to 8.8%.
Consensus Economics’ growth forecasts
June 2013 Consensus September 2013 Consensus
2013F 2014F 2013F 2014F
Developed markets
United States 1.9 2.7 1.6 2.7
Canada 1.7 2.4 1.7 2.3
Japan 1.9 1.5 1.9 1.7
UK 0.9 1.7 1.3 2.1
Eurozone -0.6 0.8 -0.4 0.9
France -0.3 0.6 0.1 0.8
Germany 0.5 1.6 0.5 1.7
Spain -1.6 0.3 -1.4 0.5
Italy -1.7 0.4 -1.7 0.5
Emerging markets
Brazil 2.7 3.4 2.4 2.6
China 7.8 7.8 7.5 7.4
India 6.0 6.8 4.9 5.9
Mexico 3.0 4.0 1.6 3.6
Russia 2.6 3.3 2.0 2.6
South Africa 2.5 3.4 2.2 3.5
South Korea 2.6 3.5 2.6 3.4
Turkey 2.5 4.8 3.5 3.9
World 2.5 3.2 2.4 3.1
Source: Consensus Economics as of September 2013. Any forecast, projection or target contained in this presentation is for information purposes only and is not guaranteed in any way. HSBC accepts no liability for any failure to meet such forecasts, projections or targets.
20

Global data watch
Consensus Economics’ inflation forecasts
June 2013 Consensus September 2013 Consensus
2013F 2014F 2013F 2014F
Developed markets
United States 1.5 1.9 1.5 1.9
Canada 1.3 1.9 1.1 1.8
Japan 0.0 2.1 0.1 2.2
UK 2.7 2.5 2.7 2.5
Eurozone 1.5 1.5 1.5 1.5
France 1.0 1.5 1.0 1.5
Germany 1.6 1.9 1.6 1.8
Spain 1.7 1.4 1.7 1.3
Italy 1.6 1.5 1.5 1.6
Emerging markets
Brazil 5.8 5.7 5.8 4.8
China 2.9 3.4 2.6 3.0
India 8.2 7.6 8.8 7.6
Mexico 3.9 3.9 3.6 3.9
Russia 5.9 5.7 5.9 5.5
South Africa 6.0 5.7 5.9 5.8
South Korea 1.9 2.7 1.5 2.6
Turkey 6.8 6.2 7.4 6.6
World 2.6 3.0 2.7 3.0
Source: Consensus Economics as of September 2013. Any forecast, projection or target contained in this presentation is for information purposes only and is not guaranteed in any way. HSBC accepts no liability for any failure to meet such forecasts, projections or targets.
Q4 2013 21
Global data watch
Market implied policy rates
Current (%) 3 months (%) 12 months (%)
Developed markets
US 0-0.25 0-0.25 0-0.25
Eurozone 0.50 0.50 0.50
UK 0.50 0.50 0.50
Japan 0-0.1 0-0.1 0-0.1
Emerging markets
Brazil 9.00 9.50 9.50
India 7.25 7.25/7.50 7.25/7.50
Korea 2.50 2.50 2.5/2.75
Mexico 3.75 3.75 3.50
South Africa 5.00 5.00 5.0/5.25
Taiwan 1.875 1.75/2.00 2.00
Turkey 4.50 4.50/4.75 5.25
Sources: Merrill Lynch, JP Morgan, Barclays, Deutsche Bank, Danske, Westpac, HSBC, Nomura, Credit Agricole, Société Générale, UBS, Citigroup, Commonwealth Bank and HSBC Global Asset Management, as of September 2013. Any forecast, projection or target contained in this presentation is for information purposes only and is not guaranteed in any way. HSBC accepts no liability for any failure to meet such forecasts, projections or targets.
Central Bank interest rate setting meetings
Date Country Event
02-Oct Europe European Central Bank interest rate decision
10-Oct UK Bank of England MPC interest rate decision
30-Oct Japan Bank of Japan interest rate decision
30-Oct US US Federal Reserve’s FOMC interest rate decision
07-Nov Europe European Central Bank interest rate decision
07-Nov UK Bank of England MPC interest rate decision
20-Nov Japan Bank of Japan interest rate decision
05-Dec UK Bank of England MPC interest rate decision
05-Dec Europe European Central Bank interest rate decision
18-Dec US US Federal Reserve’s FOMC interest rate decision
19-Dec Japan Bank of Japan interest rate decision
Sources: HSBC Global Asset Management and Bloomberg as of September 2013
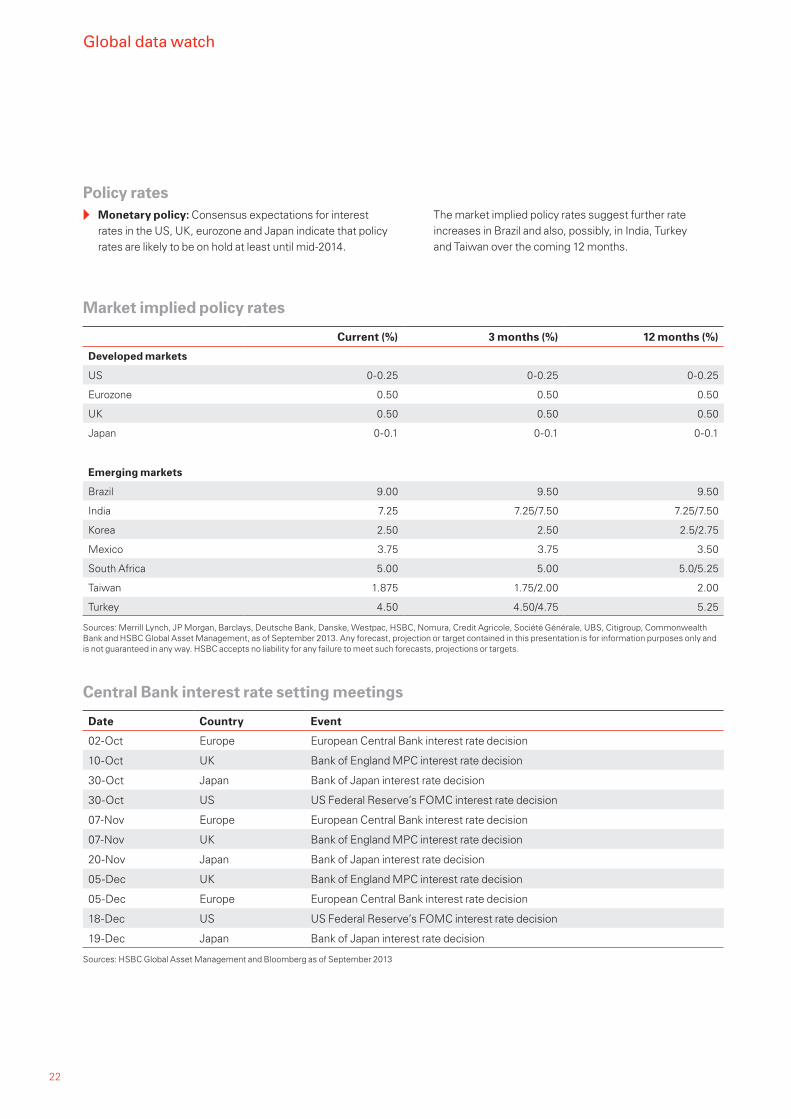
Policy rates uu Monetary policy: Consensus expectations for interest
rates in the US, UK, eurozone and Japan indicate that policy rates are likely to be on hold at least until mid-2014.
The market implied policy rates suggest further rate increases in Brazil and also, possibly, in India, Turkey and Taiwan over the coming 12 months.
22

Currency expectations (quoted versus USD)
Spot 3 months ago
6 months ago
12 months ago
2 months forward
6 months forward
9 months forward
12 months forward
Developed world
Eurozone (EUR) 1.36 1.33 1.29 1.31 1.36 1.36 1.36 1.36
UK (GBP) 1.61 1.55 1.51 1.62 1.61 1.61 1.61 1.60
Japan (JPY) 99.21 96.46 95.17 78.39 99.18 99.09 99.01 98.90
Sweden (SEK) 6.33 6.46 6.47 6.51 6.34 6.35 6.37 6.39
Norway (NOK) 5.79 5.77 5.84 5.70 5.80 5.83 5.85 5.87
Switzerland (CHF) 0.91 0.93 0.95 0.93 0.91 0.91 0.91 0.91
Australia (AUD) 0.95 0.93 1.04 1.05 0.95 0.94 0.93 0.93
Canada (CAD) 1.02 1.03 1.03 0.98 1.02 1.03 1.03 1.03
New Zealand (NZD) 0.84 0.79 0.83 0.83 0.84 0.83 0.82 0.82
Asia
China (CNY) 6.12 6.13 6.22 6.31 6.12 6.13 6.15 6.17
Hong Kong (HKD) 7.75 7.76 7.76 7.75 7.75 7.75 7.75 7.75
India (INR) 61.98 59.44 54.52 54.34 63.04 64.90 65.90 66.89
Indonesia (IDR) 10830 10160 9737 9563 10950 11325 11561 11715
Malaysia (MYR) 3.15 3.19 3.13 3.06 3.16 3.19 3.20 3.22
Philippines (PHP) 42.95 43.39 40.75 41.62 42.66 42.60 42.64 42.63
Singapore (SGD) 1.25 1.27 1.25 1.22 1.25 1.25 1.25 1.24
South Korea (KRW) 1073 1139 1115 1117 1077 1084 1087 1091
Thailand (THB) 31.00 31.01 29.29 30.81 31.07 31.29 31.42 31.57
EEMEA
Czech Republic (CZK) 18.99 19.34 19.90 19.09 18.98 18.97 18.95 18.93
Hungary (HUF) 218.5 224.2 237.3 217.1 219.6 221.4 222.7 224.0
Poland (PLN) 3.09 3.23 3.24 3.18 3.10 3.12 3.14 3.16
Russia (RUB) 31.64 32.61 31.05 31.24 31.96 32.57 33.02 33.48
South Africa (ZAR) 9.65 10.19 9.25 8.27 9.73 9.90 10.03 10.17
Turkey (TRY) 1.96 1.90 1.83 1.79 1.98 2.02 2.05 2.09
Latin America
Argentina (ARS) 5.75 5.35 5.10 4.68 6.44 7.70 8.53 9.48
Brazil (BRL) 2.20 2.23 1.99 2.02 2.23 2.28 2.33 2.38
Mexico (MXN) 12.66 13.25 12.44 12.86 12.72 12.84 12.96 13.03
Source: Forward currency rates sourced from Bloomberg, as at September 2013. Any forecast, projection or target contained in this presentation is for information purposes onlyand is not guaranteed in any way. HSBC accepts no liability for any failure to meet such forecasts, projections or targets.Past performance is no guarantee of future results.
Q4 2013 23

Global data watch
Global equity market performance (MSCI indices)
Total return (% in USD terms)
-1M -1Q -1Y YTD
Developed world 3.7 5.8 20.0 19.0
Emerging world 4.8 6.0 2.3 -2.8
North America 4.4 5.3 19.7 21.4
Europe 2.5 6.8 20.1 16.1
Eurozone 2.2 8.0 23.2 17.5
Europe ex-UK 2.0 7.1 23.5 18.0
Asia Pacific ex-Japan 4.1 7.0 11.6 5.5
Australia 5.6 8.7 12.3 5.7
Austria -1.3 5.1 21.7 8.3
Belgium 0.6 7.3 24.3 19.6
Brazil 10.9 5.8 -10.0 -9.3
Canada 2.1 4.4 1.6 2.7
Chile 3.9 -4.1 -16.1 -15.4
China 4.3 12.1 16.5 1.7
Colombia 1.8 6.5 1.1 -11.1
Czech Republic 8.2 10.6 -12.9 -8.1
Denmark -0.9 7.6 17.2 13.4
Egypt -0.5 9.4 -20.3 -10.3
Finland 12.6 19.5 44.3 32.9
France 1.3 7.6 25.3 19.0
Germany 3.0 5.0 21.9 15.9
Greece 6.0 23.2 57.4 33.2
Hong Kong 1.4 5.3 13.9 7.1
Hungary 1.4 -8.2 -4.3 0.8
India 3.3 -4.5 -7.5 -12.0
Indonesia -10.3 -18.8 -13.4 -14.0
Ireland 2.3 14.1 29.4 26.4
Israel 0.1 -1.8 1.7 4.2
Italy 1.2 10.5 11.9 9.7
Japan 2.8 5.8 28.4 22.7
Korea 8.8 12.0 4.7 0.1
Malaysia 0.3 -2.5 6.3 2.7
Mexico -0.7 6.5 4.1 -2.0
Morocco -2.7 -7.4 -14.3 -11.3
Netherlands 1.8 10.3 28.2 22.0
New Zealand 9.3 11.4 21.8 13.7
Norway 1.5 2.5 4.6 6.6
Peru 1.3 -5.2 -24.2 -28.1
Philippines -2.2 -1.9 19.3 5.9
Poland -1.4 1.8 5.4 -3.0
Sources: MSCI, Thomson Reuters Datastream and HSBC Global Research, as at September 2013. Past performance is no guarantee of future results.
24

Total return (% in USD terms)
-1M -1Q -1Y YTD
Portugal 0.3 0.0 16.2 9.8
Russia 9.2 11.6 -0.5 1.9
Singapore 1.1 1.9 3.8 1.2
South Africa 4.8 10.9 -1.8 -7.1
Spain 2.6 12.1 18.9 15.1
Sweden 2.7 7.6 24.5 21.2
Switzerland 1.2 4.2 27.1 20.0
Taiwan 5.2 5.1 7.5 5.6
Thailand 0.2 2.2 6.6 -0.7
Turkey -1.4 -8.6 1.4 -12.9
UK 3.5 6.3 13.9 12.5
US 4.6 5.4 21.3 23.1
Sources: MSCI, Thomson Reuters Datastream and HSBC Global Research, as at September 2013. Past performance is no guarantee of future results.
Global emerging markets (GEMs) equity valuations
End year PE (x) End year EPSg (%) PEG
2011e 2012e 2013e 2011e 2012e 2013e 2012e
China 9.7 8.9 8.0 10.1% 9.5% 11.2% 0.8
India 15.5 13.2 11.5 8.2% 16.9% 14.7% 0.9
Indonesia 14.9 12.9 11.2 10.1% 15.3% 15.6% 0.8
Korea 9.9 8.4 7.7 14.4% 18.4% 8.9% 0.9
Malaysia 16.3 15.0 13.7 -1.1% 9.2% 8.9% 1.7
Philippines 18.8 17.5 15.3 8.4% 7.8% 14.3% 1.2
Taiwan 15.1 13.6 12.5 32.8% 10.8% 9.5% 1.4
Thailand 12.8 11.3 10.1 14.5% 13.9% 11.5% 1.0
Czech Republic 9.6 10.9 11.2 -7.6% -11.3% -3.3% -3.2
Hungary 8.9 7.9 6.7 -8.1% 12.3% 17.5% 0.5
Poland 13.1 12.7 11.7 -23.5% 3.5% 8.1% 1.6
Egypt 8.6 6.3 5.4 3.7% 36.9% 16.2% 0.4
Russia 4.8 4.8 4.9 -4.8% 0.2% -2.4% -2.0
South Africa 15.0 13.3 12.0 4.4% 12.7% 11.0% 1.2
Turkey 10.0 9.3 8.0 6.3% 7.3% 15.8% 0.6
Argentina 6.2 6.5 6.0 1.6% -4.6% 7.1% 0.9
Brazil 11.7 10.2 9.4 14.5% 14.6% 9.1% 1.1
Chile 18.3 14.9 12.8 8.6% 22.9% 16.2% 0.9
Colombia 18.3 16.3 14.1 -9.4% 12.6% 15.7% 1.0
Mexico 19.3 17.1 15.0 -0.6% 12.6% 14.0% 1.2
Peru 13.0 11.2 10.2 -22.7% 16.0% 10.3% 1.1
GEMs 11.3 10.1 9.2 8.5% 11.6% 9.1% 1.1
PE = price earnings, EPSg = earnings per share growth, PEG = price/earnings to growth ratio, e = earnings. Data is for end year. Sources: IBES estimates, MSCI, Thomson Reuters Datastream and HSBC Global Research, as at September 2013 Past performance is no guarantee of future results. Any forecast, projection or target contained in this presentation is for information purposes only and is not guaranteed in any way. HSBC accepts no liability for any failure to meet such forecasts, projections or targets.
Q4 2013 25

Contributors
uu Eduardo Jarra Head of Macro Research and Strategy, Brazil
Eduardo Jarra is responsible for the Macro Strategy team in Brazil, involving economic and quantitative analysis, strategy and investment solutions. Eduardo has 11 years’ experience in financial markets, all of them with HSBC Group. He holds a BSc in Economics from the University of São Paulo and a master’s degree in Economics and Finance from the Ibmec SP.
uu Renee Chen Macro and Investment Strategist
Renee Chen joined HSBC Global Asset Management as Macro and Investment Strategist in April 2012. Prior to this role, she held Economist roles at Macquarie Capital Securities, Nomura and Citigroup and has over 13 years’ experience in economic and policy research. Renee holds a master’s degree in International Affairs and Economic Policy Management from Columbia University, New York and an MBA in Finance and Investment from George Washington University, Washington DC.
uu Marcus Pakenham Director, Product Specialist
Marcus Pakenham is the product specialist for the global and sterling fixed income funds managed in London and New York and has been working in the industry since 1985. Previously he has managed global emerging markets and Asian portfolios. Prior to joining the firm in 1999, Marcus worked for HSBC Global Asset Management. He holds a masters degree in Politics, Philosophy and Economics from Oxford University.
uu Julien Seetharamdoo Senior Macro and Investment Strategist
Julien Seetharamdoo is a Senior Macro and Investment Strategist within HSBC Global Asset Management’s Macro and Asset Strategy team where he provides analysis and research on the key issues facing the global economy and asset markets. Prior to joining HSBC, Julien worked for Coutts Investment Services, RBS and Capital Economics. He holds a first class degree in Economics from Cambridge University and a Ph.D. in Economics from the Management School, Lancaster University focusing on the implications of the European Monetary Union.
uu Paras Patel Associate, Macro and Investment Strategy
Paras Patel is an Associate Macro and Investment Strategist within HSBC Global Asset Management. Prior to joining HSBC Global Asset Management, Paras worked in the sell side with HSBC Global Research as an Associate in the Global Emerging Markets team. He holds a first class degree in Engineering from the University of Warwick and a master’s degree in Finance from Warwick Business School.
26

Glossary of Financial TermsAsset Class A group of securities that show similar characteristics, behave similarly in the marketplace, and are subject to the same laws and regulations. The main asset classes are equities or stocks, fixed income or bonds, and cash and cash equivalents or money market instruments.
Basis point a unit that is equal to 1/100th of 1%, and is used to denote the change in a financial instrument. The basis point is commonly used for calculating changes in interest rates, equity indexes and the yield of a fixed-income security. For example: 1% change = 100 basis points, and 0.01% = 1 basis point.
‘B’-rating A rank used by credit rating agencies assigned to a government or company’s debt. An obligor with a ‘B’-rating generally is more vulnerable to adverse business, financial and economic conditions but currently has the capacity to meet financial commitments.
‘BB’— A rank used by credit rating agencies assigned to a government or company’s debt. An obligor with a “BB”-rating is less vulnerable in the near-term but faces major ongoing uncertainties to adverse business, financial and economic conditions. ‘BBB+’-rating A rank used by credit rating agencies assigned to a government or company’s debt. An obligor with a ‘BBB+’-rating generally has an adequate capacity to meet financial commitments, but more subject to adverse economic conditions.
‘CCC’-rating A rank used by credit rating agencies assigned to a government or company’s debt. An obligor with a ‘CCC’ –rating is currently vulnerable and dependent on favorable business, financial and economic conditions to meet financial commitments. Bond yield is Annual interest payments as a percentage of the current price of a bond.
Bond-buying program A program through which central banks buy back bonds in order to add liquidity into the economy, and lower the cost of borrowing, by setting low interest rates.
BRIC marketsis the acronym for an association of five major emerging national economies: Brazil, Russia, India, China and South Africa.
CAPEX Capital expenditures are expenditures creating future benefits. A capital expenditure is incurred when a business spends money either to buy fixed assets or to add to the value of an existing fixed asset with a useful life extending beyond the taxable year.
‘CCC’-rating A rank used by credit rating agencies assigned to a government or company’s debt A CCC rating represents an extremely high risk bond or investment; banks are not allowed to invest in CCC rated bonds. CCC bonds are junk bonds.
Core government bonds Principally the government bond markets of the US, UK, Germany and other developed countries outside of the eurozone such as Canada and Switzerland.
Corporate asset Securities issued by corporations, e.g. equities and corporate bonds.
Developed Markets typically refers to a country with a relatively high level of economic growth and security. Some of the most common criteria for evaluating a country’s degree of development are per capita income or gross domestic product (GDP), level of industrialization, general standard of living and the amount of widespread infrastructure.
Dividend Yield is a financial ratio that measures how much cash flow you are getting for each dollar invested in an equity position.
Emerging Markets typically refers to a nation’s economy that is progressing toward becoming advanced, as shown by some liquidity in local debt and equity markets and the existence of some form of market exchange and regulatory body.
Fiscal cliff The term ‘fiscal cliff’ was first coined by Federal Reserve Chairman, Ben Bernanke in 2012 and refers to the fact that a large amount of tax cuts were due to expire in January 2013along with cuts to government spending.
Frontier Markets Less advanced capital markets from the developing world. Frontier markets are countries with investable stock markets that are less established than those in the emerging markets.
German Bunds German government bonds.
Gross Domestic Product is the value of a country’s total output of goods and services, produced within a given period.
Price to Book is the ratio used to compare a stock’s market value to its book value. It is calculated by dividing the current closing price of the stock by the latest quarter’s book value per share.
Price earnings ratio A valuation ratio of a company’s current share price compared to its per-share earningsQuantitative Easing A programme through which central banks buy back bonds in order to add liquidity into the economy, and lower the cost of borrowing, by setting low interest rates.
Treasury yield The return on investment, expressed as a percentage, on the debt obligations of the U.S. government. Treasuries are considered to be a low-risk investment because they are backed by the full faith and credit of the U.S. government, which includes the government’s authority to raise taxes to cover its obligations. Because of their low risk, treasuries have a low return compared to many other investments.
Yield is the income return on an investment usually expressed in percentage.
Index Definitions:Barclays Capital Global Aggregate is a broad base index and is often used to represent investment grade bonds being traded in United States.
Barclays Capital Global High Yield covers the universe of fixed rate, non-investment grade debt. Pay-in-kind bonds, Eurobonds, and debt issues from countries designated as emerging markets are excluded, but Canadian and global bonds of issuers in non-EMG countries are included.
Barclays Capital US Corporate is a market value-weighted index which covers the US non-investment grade fixed-rate debt market. The index is composed of US dollar-denominated corporate debt in industrial, utility, and finance sectors with a minimum $150 million par amount outstanding and a maturity greater than 1 year. The index includes reinvestment of income.
JPM Asian Investment Grade tracks total return performance of the Asia fixed-rate dollar bond market. JACI is a market cap-weighted index comprising sovereign, quasi-sovereign and corporate bonds and it is partitioned by country, sector and credit rating.
JPMorgan Emerging Markets Bond Index Global (“EMBI Global”) tracks total returns for traded external debt instruments in the emerging markets, and is an expanded version of the JPMorgan EMBI+. As with the EMBI+, the EMBI Global includes US dollar-denominated Brady bonds, loans, and Eurobonds with an outstanding face value of at least $500 million. It covers more of the eligible instruments than the EMBI+ by relaxing somewhat the strict EMBI+ limits on secondary market trading liquidity.
Q4 2013 27

Important information:
All indices are unmanaged. Index returns do not reflect any fees, expenses or sales charges associated with investing. Investors cannot invest directly in an index.
Unless stated otherwise, all data and charts are sourced from Datastream, Bloomberg, Barclays Capital, MSCI and HSBC Global Asset Management.
Neither diversification nor asset allocation can protect from a loss in a particular market nor guarantee a profit; however it does allow spreading the risk across various asset classes.
Investment Quarterly is a joint publication of HSBC Global Asset Management (USA) Inc. and HSBC Global Asset Management (Canada) Limited (collectively “we”). This document is distributed by HSBC Global Asset Management (USA) Inc., HSBC Global Asset Management (Canada) Limited and HSBC Global Asset Management (Bermuda) Limited. It should not be viewed as a solicitation or an offer to purchase or subscribe for any investment or advisory service. The information contained in this document is for information purposes only and is based on sources believed to be reliable. However, we have not independently verified such information and make no guarantee, representation or warranty and accept no responsibility or liability as to its accuracy or completeness. Opinions expressed in the document are subject to change without notice and this information is not intended to provide professional advice and should not be relied upon in that regard. Some of the statements contained in this document may be considered forward looking statements which provide current expectations or forecasts of future events. Such forward-looking statements are not guarantees of future performance or events and involve risks and uncertainties. Actual results may differ materially from those described in such forward-looking statements as a result of various factors. We do not undertake any obligation to update the forward-looking statements contained herein, or to update the reasons why actual results could differ from those projected in the forward-looking statements.
Diversification does not eliminate the risk of loss. Investing entails risks, including possible loss of principal. Investors should be aware that performance returns are affected by market fluctuations and note that the use of derivatives and investments involving a currency other than their own involves special risks. Currency exchange rates can be very volatile and can change quickly and unpredictably. Investments in commodities and currencies may involve substantial risk as the prices can fluctuate significantly.
Emerging markets are often characterized by even less economic diversity and political stability than more developed international markets, and individual securities may demonstrate greater price volatility and a lack of liquidity. Fixed income securities are subject to credit and interest-rate risk. Investments in high- yield securities (commonly referred to as “junk bonds”) are often considered speculative investments and have significantly higher credit risk than investment- grade securities. The prices of high-yield securities, which may be less liquid than higher rated securities, may be more vulnerable to adverse market, economic or political conditions.
Frontier market countries generally have smaller economies and even less developed capital markets or legal and political systems than traditional emerging market countries. As a result, the risks of investing in emerging market countries are magnified in frontier market countries. The magnification of risks are the result of: the potential for extreme price volatility and illiquidity in frontier markets; government ownership or control of parts of private sector and of certain companies; trade barriers, exchange controls, managed adjustments in relative currency values and other protectionist measures imposed or negotiated by the countries with which frontier market countries trade; and the relatively new and unsettled securities laws in many frontier market countries.
Investors should consider their investment objectives, whether or not they can assume these risks and should undertake their own appropriate professional advice. Past performance does not guarantee future results.
This information is not, and under no circumstances should be construed as, a solicitation to act as a securities broker or dealer in any jurisdiction by any person or company that is not legally permitted to carry on the business of a securities broker or dealer in that jurisdiction. HSBC Global Asset Management (USA) Inc., HSBC Global Asset Management (Canada) Limited and HSBC Global Asset Management (Bermuda) Limited are part of HSBC Global Asset Management, the global investment management business of HSBC Holdings plc. HSBC Global Asset Management (USA) Inc. is a separate legal entity registered with the United States Securities and Exchange Commission. HSBC Global Asset Management (Canada) Limited is also a separate legal entity and is a subsidiary of HSBC Bank Canada. HSBC Global Asset Management (Canada) Limited is registered in all provinces of Canada except for Prince Edward Island and is also registered in the Northwest Territories. HSBC Global Asset Management (Bermuda) Limited of 6 Front Street, Hamilton, Bermuda, is a wholly owned subsidiary of HSBC Bank Bermuda Limited, and is licensed to conduct investment business by the Bermuda Monetary Authority.
In the US, Investment products are offered by HSBC Securities (USA) Inc. (HSI), member NYSE/FINRA/SIPC. HSI is an affiliate of HSBC Bank USA, N.A. Investment products: Are not a deposit or other obligation of the bank or any of its affiliates; Not FDIC insured or insured by any federal government agency of the United States; Not guaranteed by the bank or any of its affiliates; and are subject to investment risk, including possible loss of principal invested.
All decisions regarding the tax implications of your investment(s) should be made in connection with your independent tax advisor.
CA#13-10-108 (US) CA#M1311003 (Canada)
MSCI Global Equity Indices are widely tracked global equity benchmarks and serve as the basis for over 500 exchanged traded funds* throughout the world. The indices provide exhaustive equity market coverage for over 70 countries in the Developed, Emerging and Frontier Markets, applying a consistent index construction and maintenance methodology. This methodology allows for meaningful global views and cross regional comparisons across all market capitalization size, sector and style segments and combinations.
European High Yield represented by BofA Merrill Lynch Euro High Yield Index
GEM Equity represented by MSCI EM IndexGlobal Equities represented by MSCI World IndexS&P 500: Standard and Poor’s 500 index is widely regarded as a gauge of the US equities market. It includes 500 leading publicly-traded companies in the US.
Euro Stoxx 50: A market capitalisation-weighted stock index of 50 large, blue-chip European companies operating within eurozone nations
FTSE 100: Is an index of the financial performance of the 100 largest companies in the UK. The index, which is updated continuously, is considered a barometer of the stock market in the UK and a reflection of the overall health of the UK economy.
Nikkei-225: A price-weighted index of the 225 top Japanese companies that are listed in the Tokyo Stock Exchange.
India Sensex is a free-float market capitalization-weighted stock market index of 30 well-established and financially sound companies listed on Bombay Stock Exchange Ltd.
Shanghai Composite is a capitalization-weighted index. The index tracks the daily price performance of all A-shares and B-shares listed on the Shanghai Stock Exchange.
US High Yield represented by BofA Merrill Lynch US High Yield Master II IndexUS Treasuries represented by BofA Merrill Lynch US Government Index (GOAO)* As of December 31, 2011