ipl’s 2006 summer capacity
TRANSCRIPT

IPL’s2006 Summer Capacity
Presentation to IURC
May 18, 2006
Steve Corwell, Sr. VP – Corporate AffairsJim Sadtler, Sr. VP – Power Supply

Presentation Overview
• Customer demand assessment• Supply resources • Market conditions• Customer Demand Response options• IPL generation• MISO Day 2 Operations

IPL Historical Summer Peaks
2002 2003 2004 2005 MW 3,003 2,892 2,915 3,118 Date July 22 Aug. 26 July 22 July 25 Hour 4:00 PM 5:00 PM 4:00 PM 4:00 PMTemp. 92°F 89°F 88°F 95°F

IPL 2006 Summer Projected Peaks (MW)
June July August
Total Demand 2,960 3,110 2,967
Demand Response 84 84 84
Net Demand 2,876 3,026 2,883

Supply Resources 2006 (MW)
IPL Owned Generation 3,282Perry K (CTE) 5Power Purchase 73Scrubber Option 19Total Supply Resources 3,379

Supply Resources vs. Projected Peak Load
0
500
1000
1500
2000
2500
3000
3500
4000
June July August
Meg
awat
ts
Res
ourc
es
Res
ourc
es
Res
ourc
es
Load
Load
Load
Reserve Margin (MW) 503 353 496
Reserve Margin (%) 17.5% 11.7% 17.2%

IPL & RFC/MISO Reserve MarginsSummer 2006
June July August
IPL Reserve Margin % 17.5% 11.7% 17.2%
Reliability First % 25.0% 18.6% 20.6%MISO % --- 18.0% ---

Capacity Margin vs. Forward Market PricesECAR/RFC(2006)
0.0%
2.0%
4.0%
6.0%
8.0%
10.0%
12.0%
14.0%
16.0%
18.0%
20.0%
1999 2000 2001 2002 2003 2004 2005 20060
20
40
60
80
100
120
140
160
$
ECAR/RFC % Capacity Margin July/Aug 5X16 Forward Market Prices ($)

Market Prices up 10% from year ago…What are the drivers?
April 2005 April 2006 ChangeJul/Aug 5x16 $/MWH 65.10 71.30 10%IL/IN Spot Coal $/ton 37 43 16%Henry Hub NG $/mmbtu 6.60 6.94 5%#2 Fuel Oil $/mmbtu 10.73 14.28 33%SO2 Allowances $/ton 845 725 -14%

Customer Demand Response Options
• Residential Customers– IPL “CoolCents” Program - Air Conditioning
Load Management (ACLM)
– Various other programs focused on energy efficiency

“CoolCents” – Demand Impact (MW)
0
5
10
15
20
2003 2004 2005 2006 2007
Meg
awat
ts
Proj
ectio
n
Proj
ectio
n

Other Residential Programs
• Income Qualified Weatherization• High Efficiency Heat Pump and Air
Conditioner• Air Conditioning Load Management
(extension)• Energy Efficiency Education• Renewable Energy Education

Customer Demand Response Options
• Commercial and Industrial Customers– Rider 14 – Interruptible Power – Rider 15 – Customer Owned Generation– Rider 17 – Curtailment Power– SS Special Agreement – Interruptible Power

Customer DR OptionsSummer Demand Impacts (MW)
P RO JECTED
2004 2005 2006
Rider 14 12 12 12Rider 15 29 34 40Rider 17 4 15 7SS-Agreements 9 9 10Residential DR 8 11 15Total 62 81 84
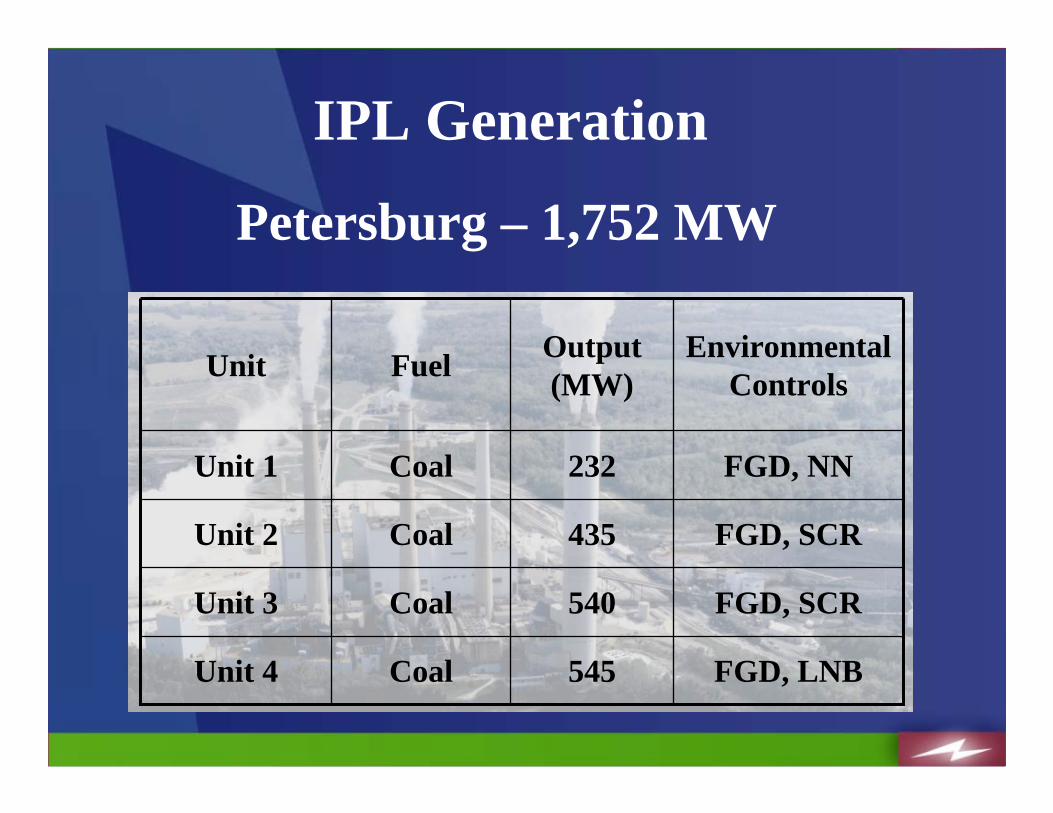
Petersburg – 1,752 MW
FGD, SCR540CoalUnit 3
FGD, LNB545CoalUnit 4
FGD, SCR435CoalUnit 2
FGD, NN232 CoalUnit 1
Environmental Controls
Output (MW)FuelUnit
IPL Generation

Harding Street – 1,099 MW
82Oil/GasCT 5
SNCR, NN106CoalUnit 6
158GasCT 6
82Oil/GasCT 460OilCTs 1-3
SCR435CoalUnit 7
SNCR, NN106CoalUnit 570 OilUnits 3 & 4
Environmental Controls
Output (MW)FuelUnit
IPL Generation

Eagle Valley – 338 MW
LNB62CoalUnit 5
NN99CoalUnit 6
LNB56CoalUnit 4
43CoalUnit 3
78 OilUnits 1 & 2
Environmental Controls
Output (MW)FuelUnit
IPL Generation

Georgetown
79 GasGT 1
Output (MW)FuelUnit
Georgetown is a 4 unit plant:
GT 2 & 3 owned by IMPA
GT 4 owned by DTE Energy
IPL Generation

Power Purchases
• 73 MW Unit Power Purchase– May—September– 3-year agreement for summers 2004-2006
• Additional short-term market purchases for economic reasons or as replacement power for unexpected unit outages

MISO Day 2 Operations• Successful transition from prior bi-lateral
market despite record setting summer peak demands in 2005
• Provides near real-time economic dispatch of IPL generation with generation supply of entire MISO footprint
• Actively involved at MISO

Summary• IPL’s Resource Portfolio of Owned
Generation, Demand Response Options, and Power Purchases will support projected summer 2006 customer load requirements.