ionoacoustic bragg peak localization for charged particle ......ionoacoustic bragg peak localization...
TRANSCRIPT
Ionoacoustic Bragg Peak Localization for Charged Particle Cancer Therapy
Siavash Yousefi, December-9-2015
Jonathan Alava, 7 Roberts Proton Therapy Center in Philadelphia

Cancer Treatment: Protons vs. X-ray
Superior Dose Distribution
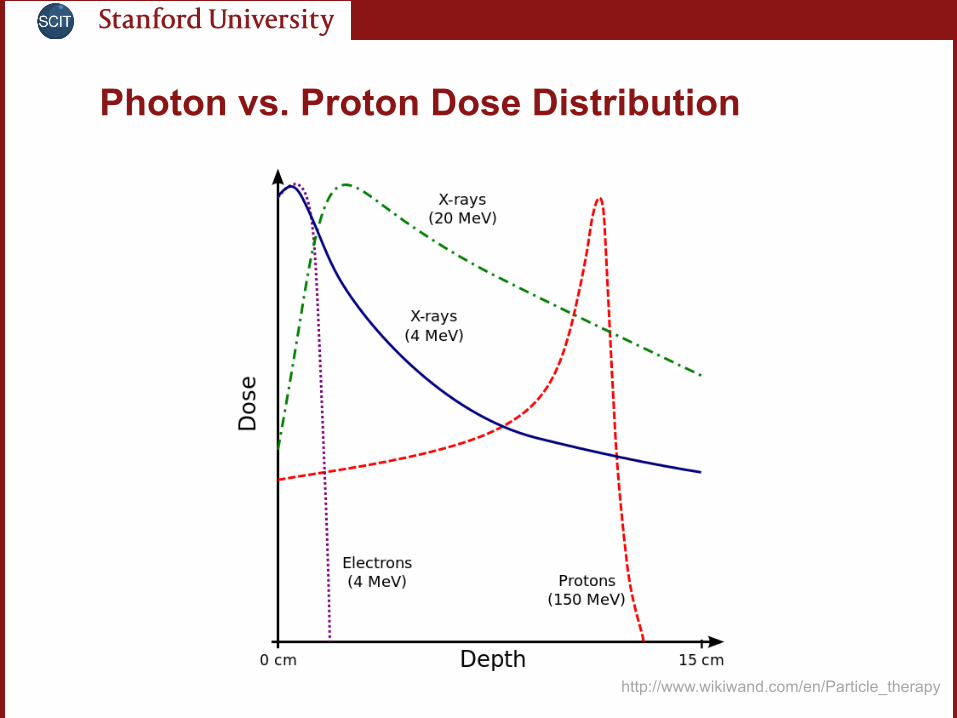
Photon vs. Proton Dose Distribution
Knopf, Antje-Christin, and Antony Lomax. "In vivo proton range verification: a review." Physics in medicine and biology 58.15 (2013): R131.
http://www.wikiwand.com/en/Particle_therapy

Proton and Carbon Therapy Facilities
Carbon Therapy Facilities PROTON THERAPY FACILITIES
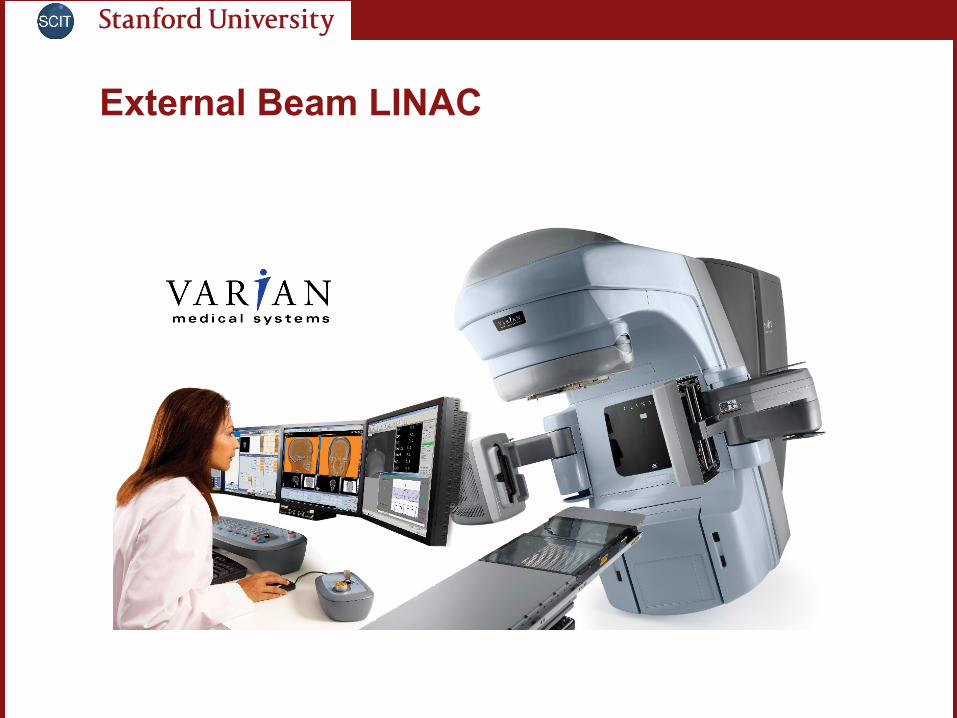
External Beam LINAC

External Beam LINAC
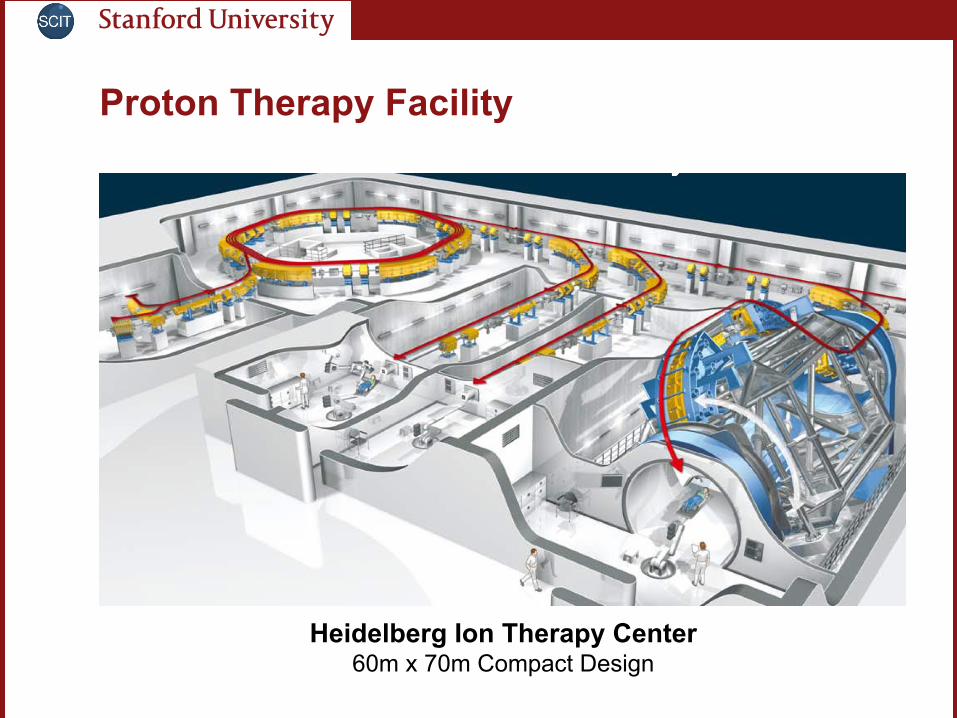
Proton Therapy Facility
: C
Heidelberg Ion Therapy Center 60m x 70m Compact Design
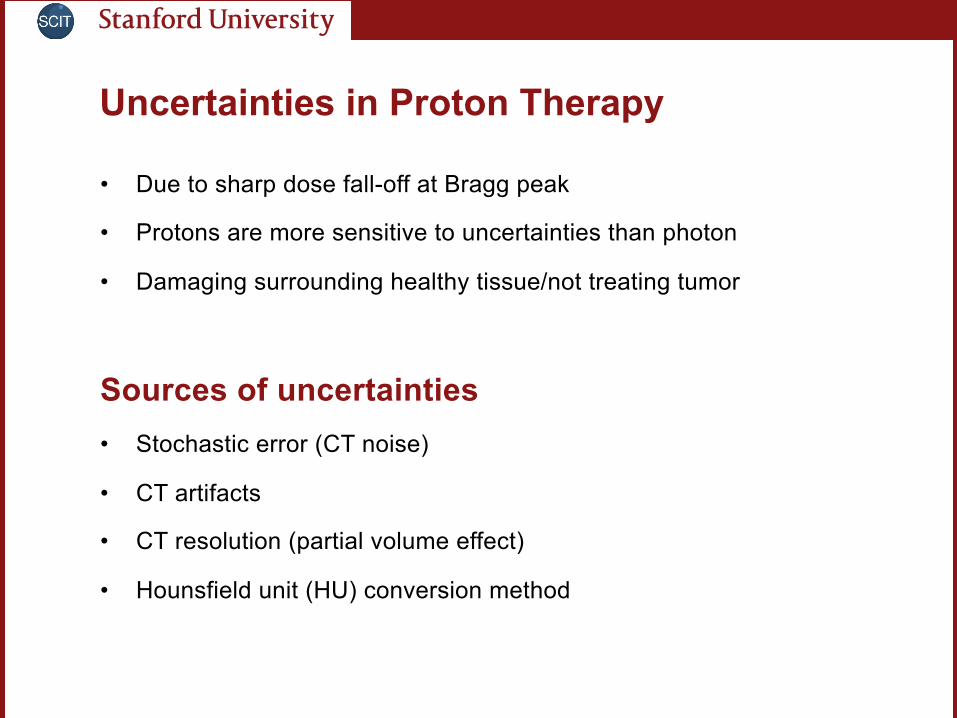
Uncertainties in Proton Therapy
• Due to sharp dose fall-off at Bragg peak
• Protons are more sensitive to uncertainties than photon
• Damaging surrounding healthy tissue/not treating tumor
Sources of uncertainties • Stochastic error (CT noise)
• CT artifacts
• CT resolution (partial volume effect)
• Hounsfield unit (HU) conversion method
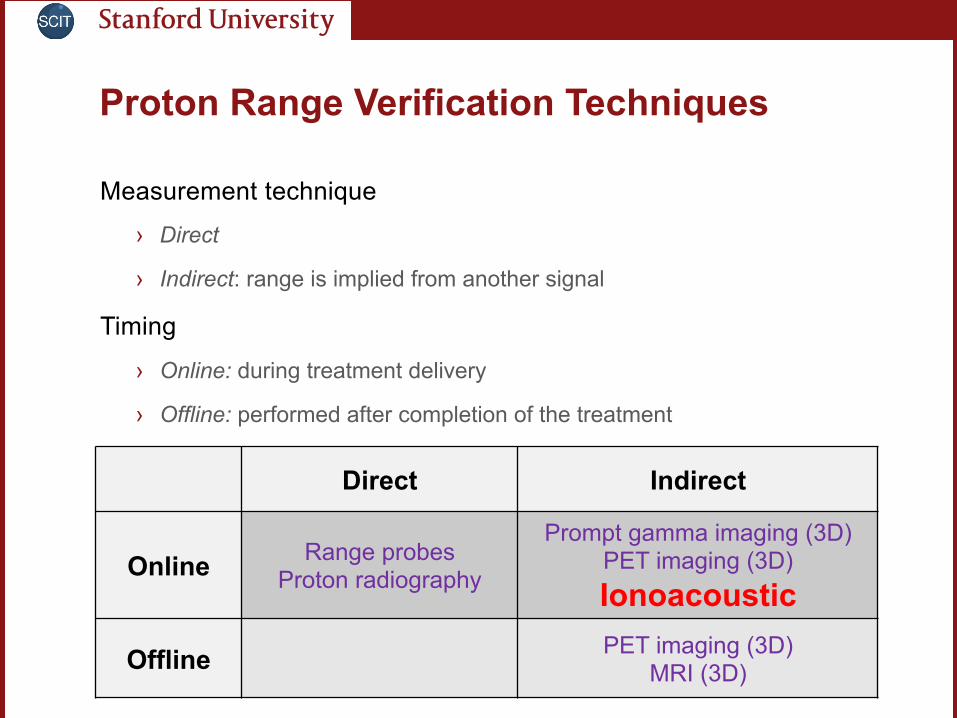
Proton Range Verification Techniques
Measurement technique
› Direct
› Indirect: range is implied from another signal
Timing
› Online: during treatment delivery
› Offline: performed after completion of the treatment
Direct Indirect
Online Range probes Proton radiography
Prompt gamma imaging (3D) PET imaging (3D) Ionoacoustic
Offline PET imaging (3D) MRI (3D)

PET Imaging for Range Verification
• Protons and heavy ions cause nuclear fragmentation reactions
• Generation of positron emitting isotopes (15O, 11C)
• PET scan measures the distribution of activities
• Clinically appealing; no additional dose to the patient
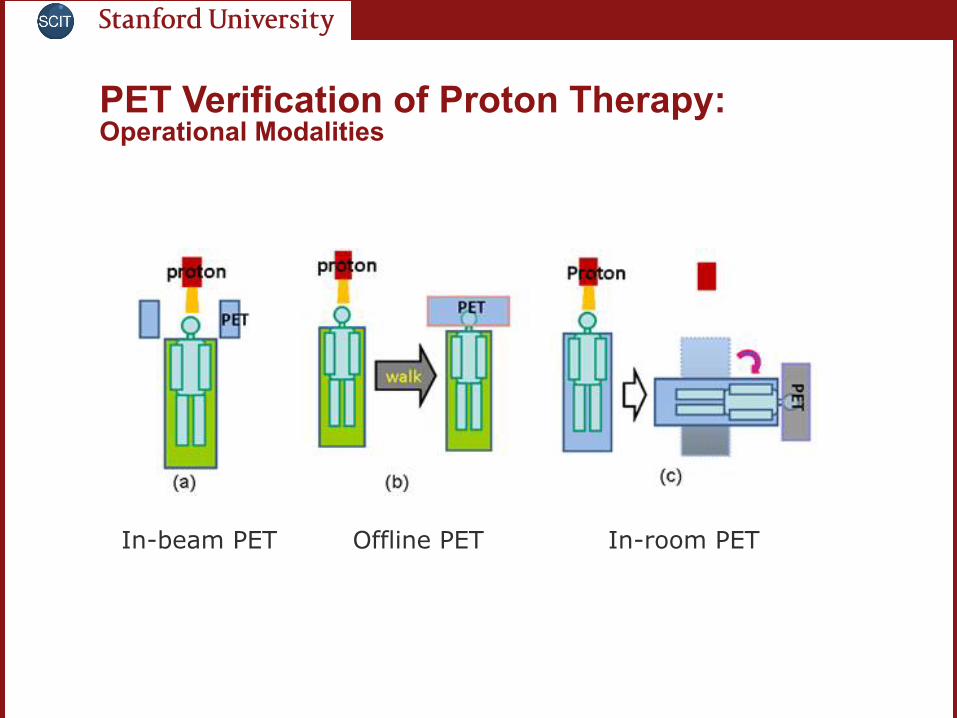
PET Verification of Proton Therapy: Operational Modalities
In-beam PET Offline PET In-room PET
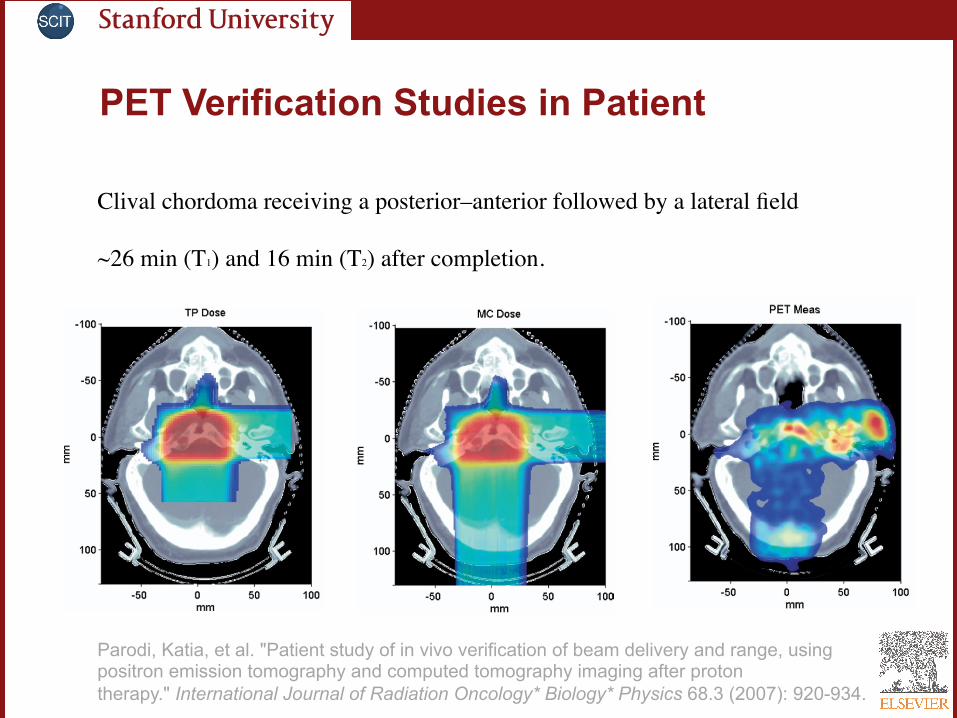
PET Verification Studies in Patient
Clival chordoma receiving a posterior–anterior followed by a lateral field
~26 min (T1) and 16 min (T2) after completion.
Parodi, Katia, et al. "Patient study of in vivo verification of beam delivery and range, using positron emission tomography and computed tomography imaging after proton therapy." International Journal of Radiation Oncology* Biology* Physics 68.3 (2007): 920-934.
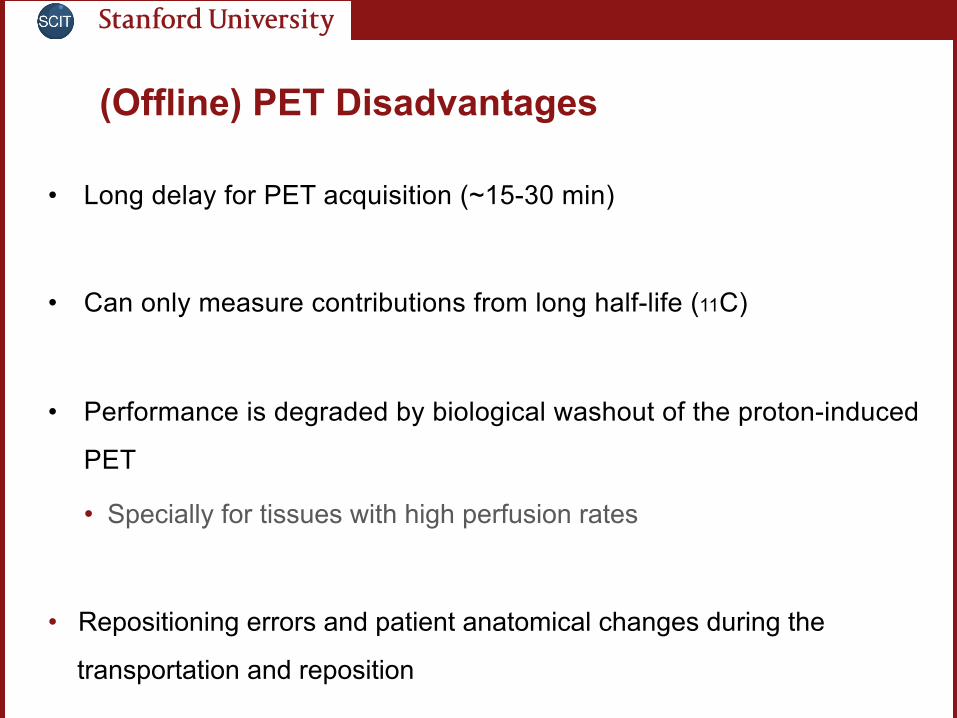
(Offline) PET Disadvantages
• Long delay for PET acquisition (~15-30 min)
• Can only measure contributions from long half-life (11C)
• Performance is degraded by biological washout of the proton-induced
PET
• Specially for tissues with high perfusion rates
• Repositioning errors and patient anatomical changes during the
transportation and reposition
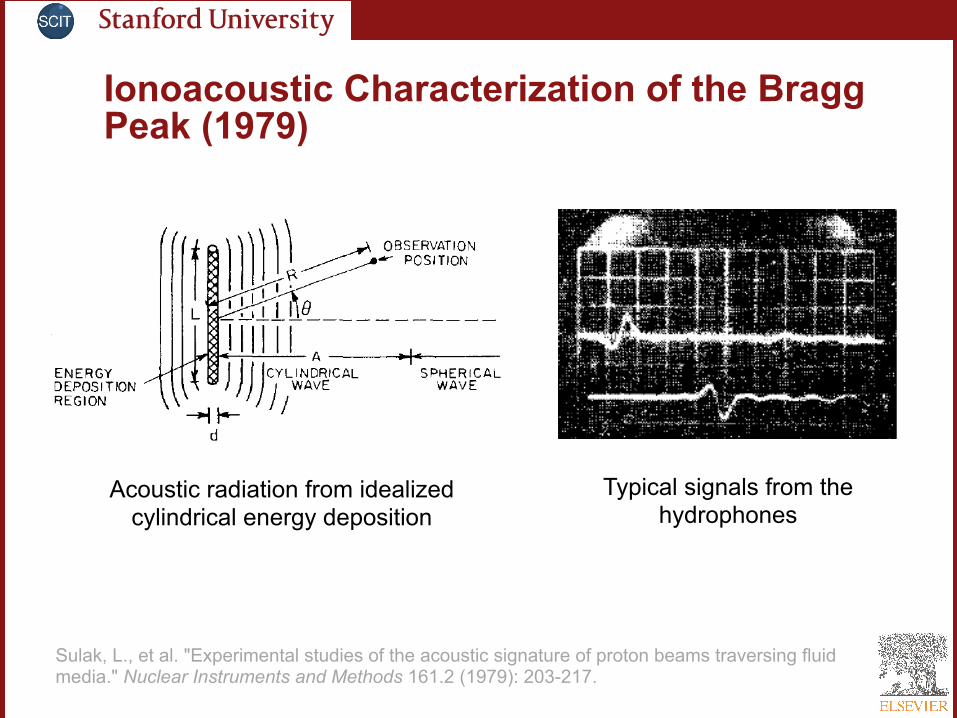
Ionoacoustic Characterization of the Bragg Peak (1979)
Typical signals from the hydrophones
Acoustic radiation from idealized cylindrical energy deposition
Sulak, L., et al. "Experimental studies of the acoustic signature of proton beams traversing fluid media." Nuclear Instruments and Methods 161.2 (1979): 203-217.
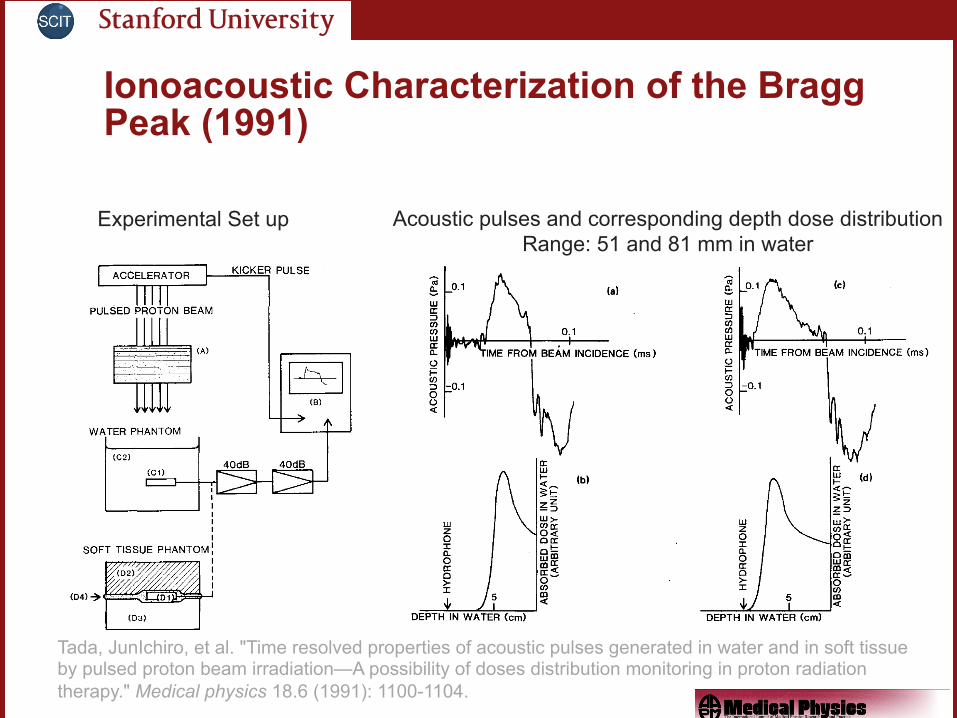
Ionoacoustic Characterization of the Bragg Peak (1991)
Tada, JunIchiro, et al. "Time resolved properties of acoustic pulses generated in water and in soft tissue by pulsed proton beam irradiation—A possibility of doses distribution monitoring in proton radiation therapy." Medical physics 18.6 (1991): 1100-1104.
Acoustic pulses and corresponding depth dose distribution Range: 51 and 81 mm in water
Experimental Set up
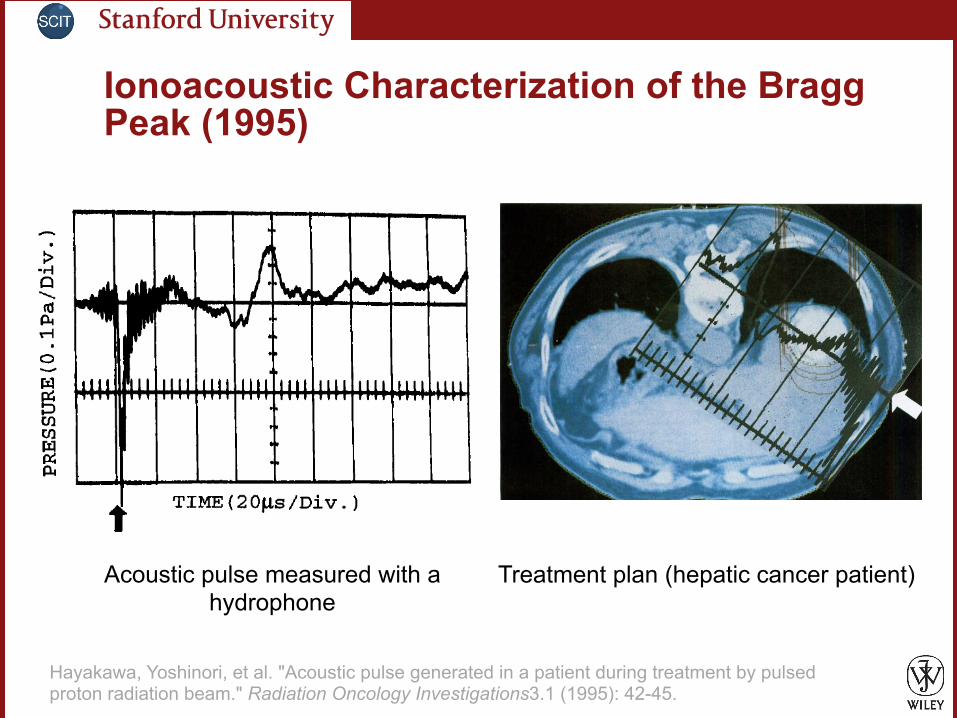
Ionoacoustic Characterization of the Bragg Peak (1995)
Hayakawa, Yoshinori, et al. "Acoustic pulse generated in a patient during treatment by pulsed proton radiation beam." Radiation Oncology Investigations3.1 (1995): 42-45.
Acoustic pulse measured with a hydrophone
Treatment plan (hepatic cancer patient)
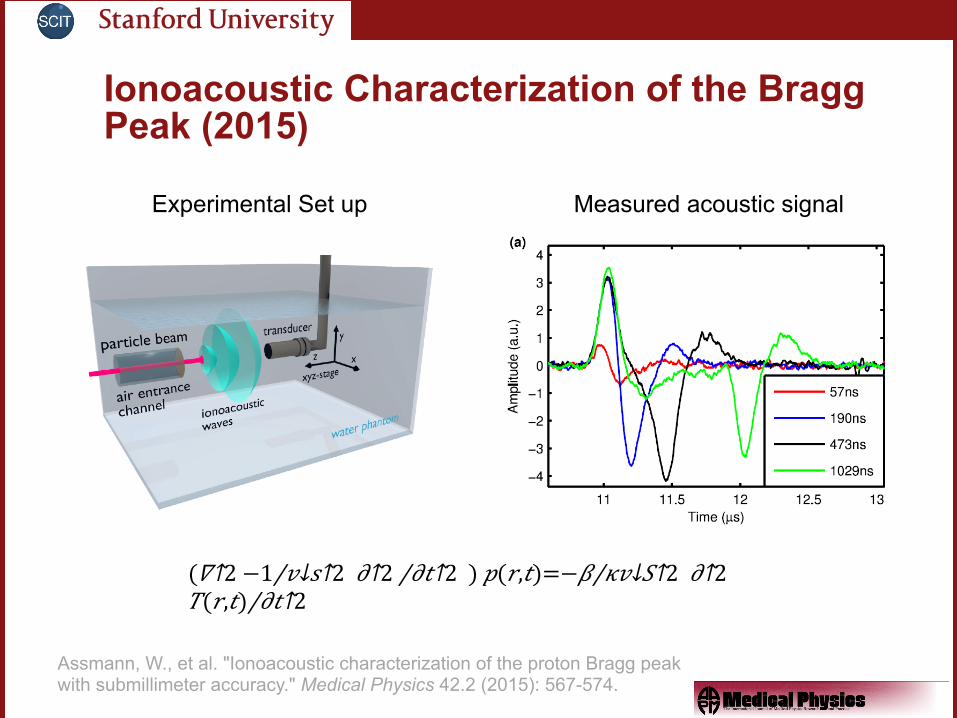
Ionoacoustic Characterization of the Bragg Peak (2015)
Assmann, W., et al. "Ionoacoustic characterization of the proton Bragg peak with submillimeter accuracy." Medical Physics 42.2 (2015): 567-574.
(𝛻↑2 − 1/𝑣↓𝑠↑2 𝜕↑2 /𝜕𝑡↑2 ) 𝑝(𝑟,𝑡)=− 𝛽/𝜅𝑣↓𝑆↑2 𝜕↑2 𝑇(𝑟,𝑡)/𝜕𝑡↑2
Experimental Set up Measured acoustic signal
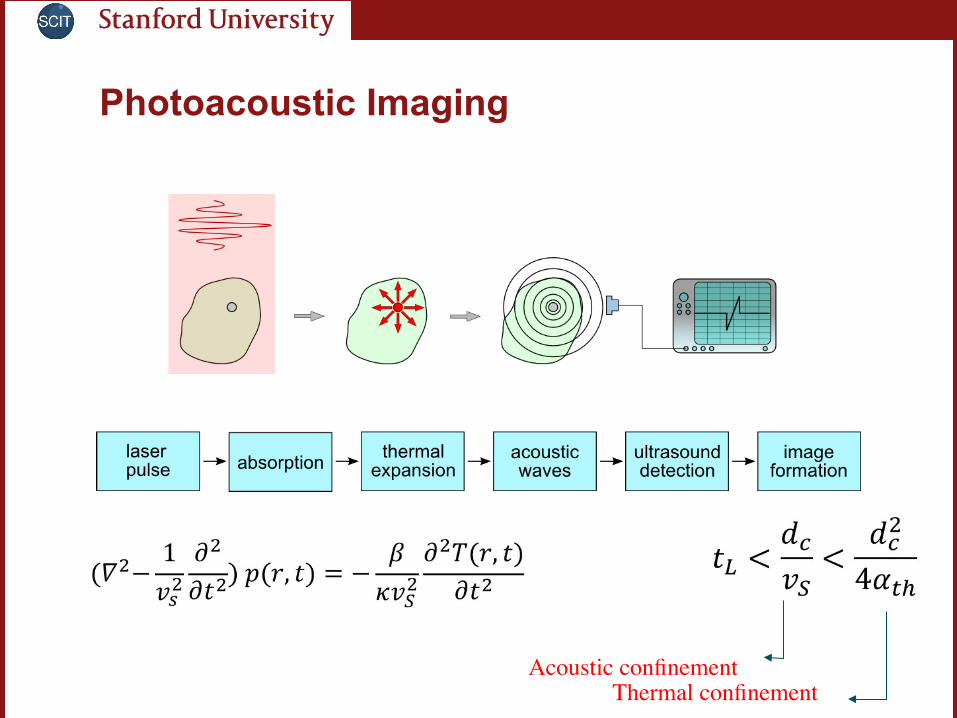
Photoacoustic Imaging (𝛻↑2 − 1/𝑣↓𝑠↑2 𝜕↑2 /𝜕𝑡↑2 ) 𝑝(𝑟,𝑡)=− 𝛽/𝜅𝑣↓𝑆↑2 𝜕↑2 𝑇(𝑟,𝑡)/𝜕𝑡↑2
𝑡↓𝐿 < 𝑑↓𝑐 /𝑣↓𝑆 < 𝑑↓𝑐↑2 /4𝛼↓𝑡ℎ
Acoustic confinement Thermal confinement
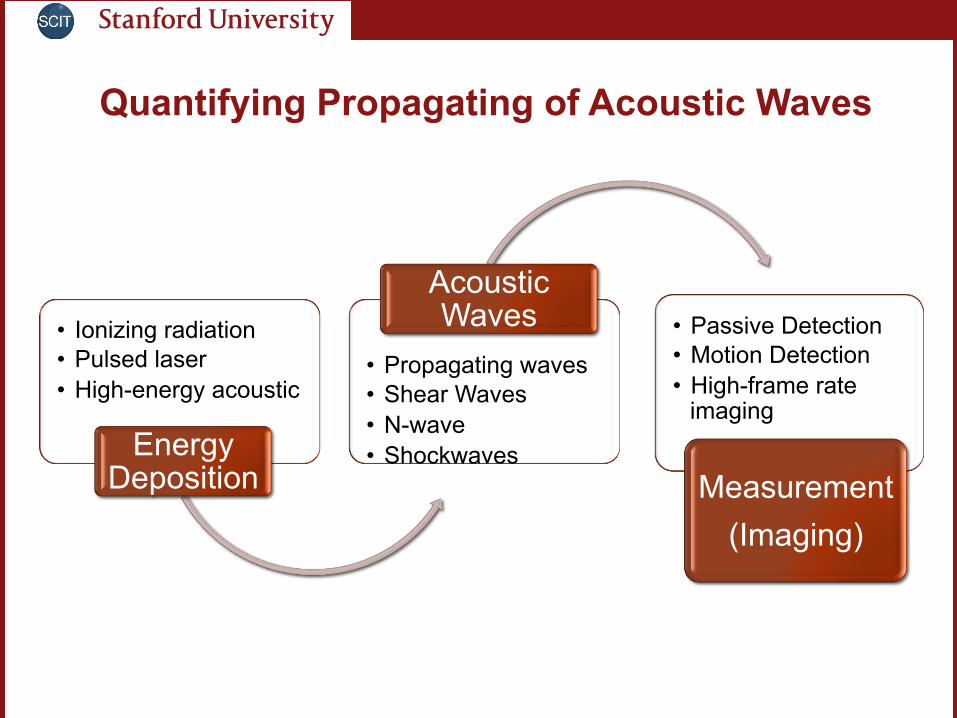
Quantifying Propagating of Acoustic Waves
• Ionizing radiation • Pulsed laser • High-energy acoustic
Energy Deposition
• Propagating waves • Shear Waves • N-wave • Shockwaves
Acoustic Waves • Passive Detection
• Motion Detection • High-frame rate
imaging
Measurement (Imaging)
20
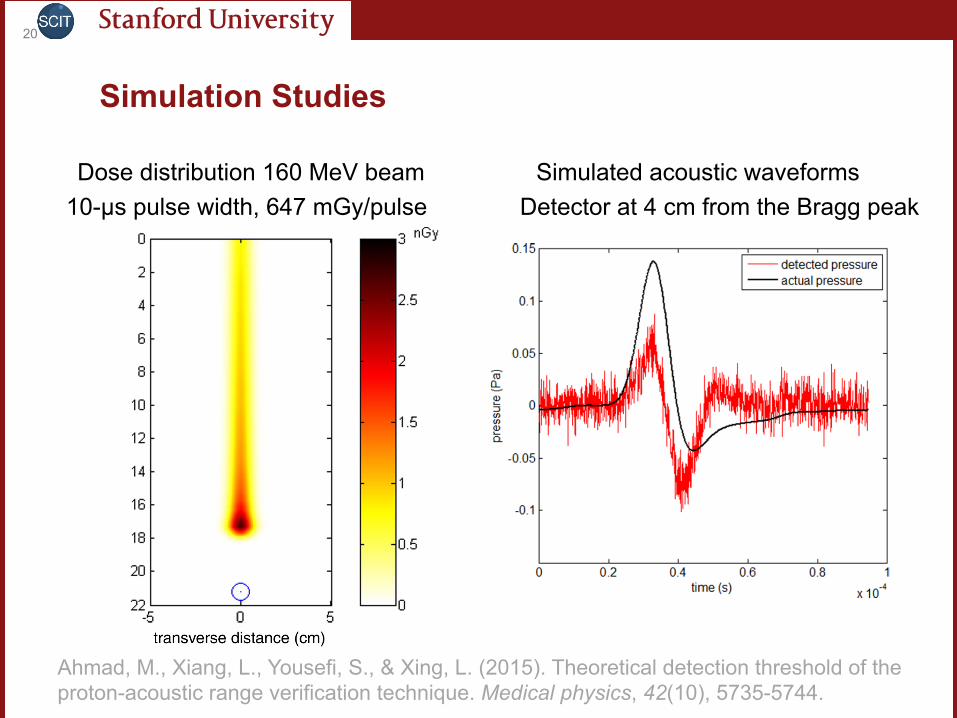
Simulation Studies
10-µs pulse width, 647 mGy/pulse Dose distribution 160 MeV beam Simulated acoustic waveforms
Detector at 4 cm from the Bragg peak
Ahmad, M., Xiang, L., Yousefi, S., & Xing, L. (2015). Theoretical detection threshold of the proton-acoustic range verification technique. Medical physics, 42(10), 5735-5744.

Simulation Studies
Dose Distribution
Acoustic Signature
(𝛻↑2 − 1/𝑣↓𝑠↑2 𝜕↑2 /𝜕𝑡↑2 ) 𝑝(𝑟,𝑡)=− 𝛽/𝜅𝑣↓𝑆↑2 𝜕↑2 𝑇(𝑟,𝑡)/𝜕𝑡↑2
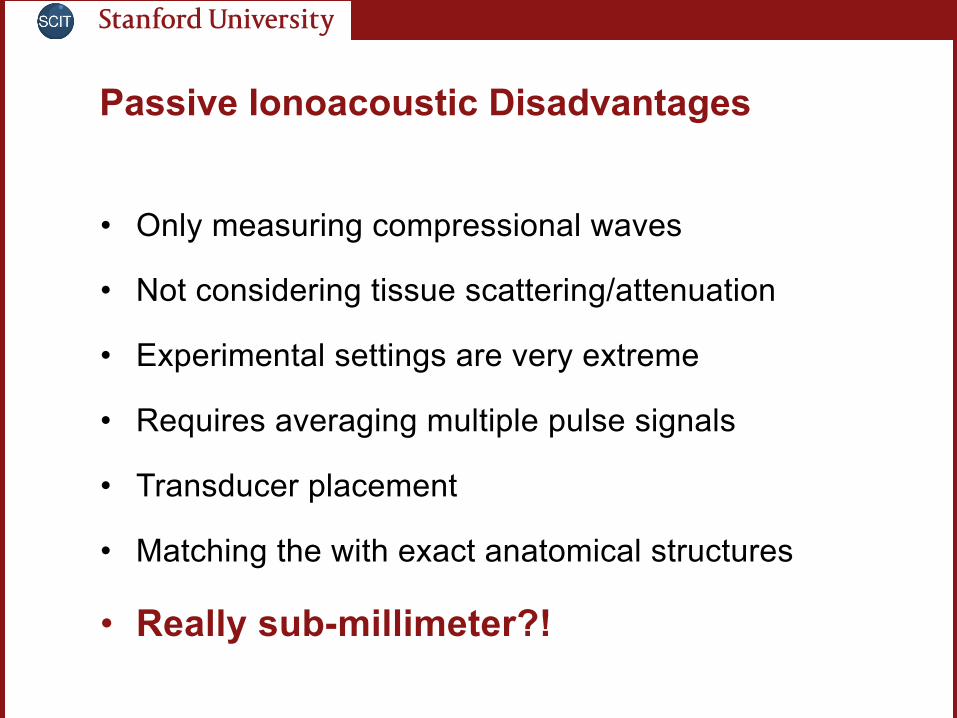
Passive Ionoacoustic Disadvantages
• Only measuring compressional waves
• Not considering tissue scattering/attenuation
• Experimental settings are very extreme
• Requires averaging multiple pulse signals
• Transducer placement
• Matching the with exact anatomical structures
• Really sub-millimeter?!
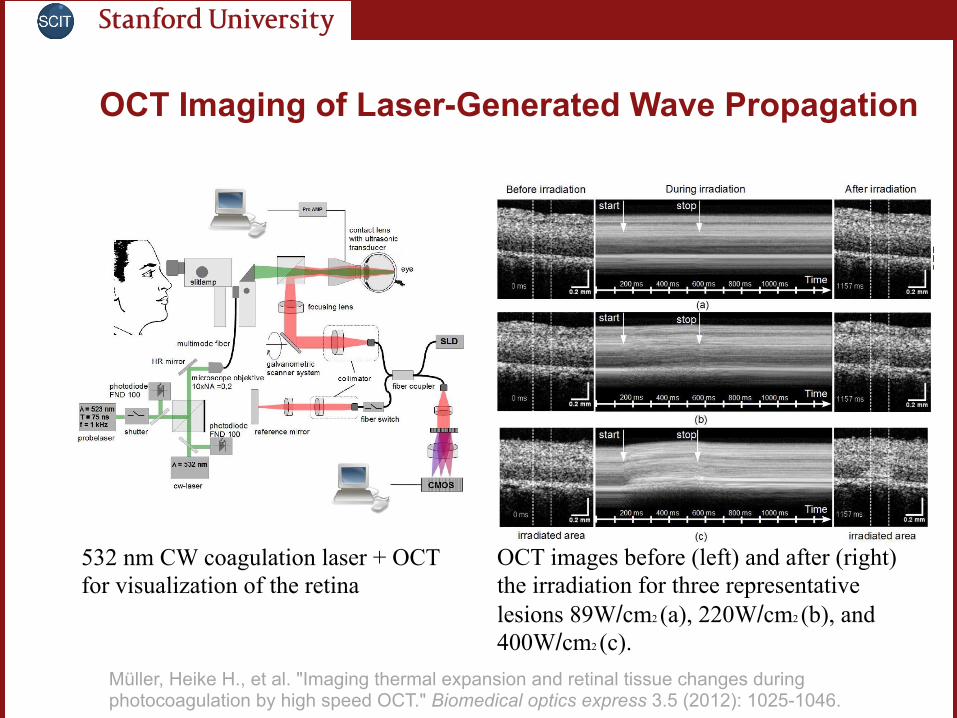
OCT Imaging of Laser-Generated Wave Propagation
Müller, Heike H., et al. "Imaging thermal expansion and retinal tissue changes during photocoagulation by high speed OCT." Biomedical optics express 3.5 (2012): 1025-1046.
532 nm CW coagulation laser + OCT for visualization of the retina
OCT images before (left) and after (right) the irradiation for three representative lesions 89W/cm2 (a), 220W/cm2 (b), and 400W/cm2 (c).
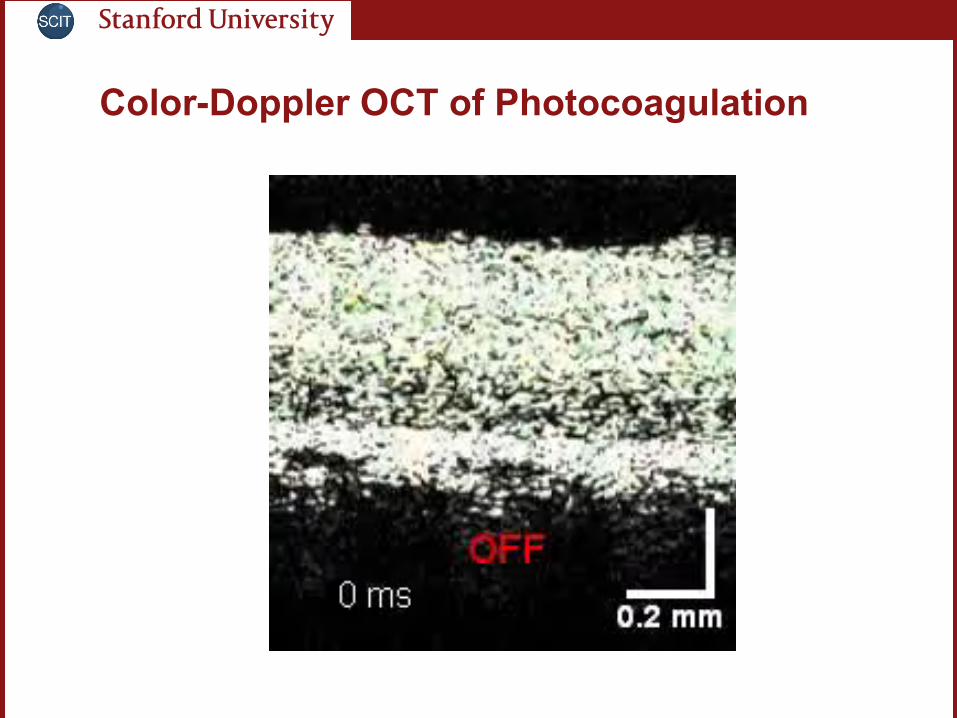
Color-Doppler OCT of Photocoagulation

Color-Doppler OCT of Photocoagulation
89W/cm2
220W/cm2
400W/cm2
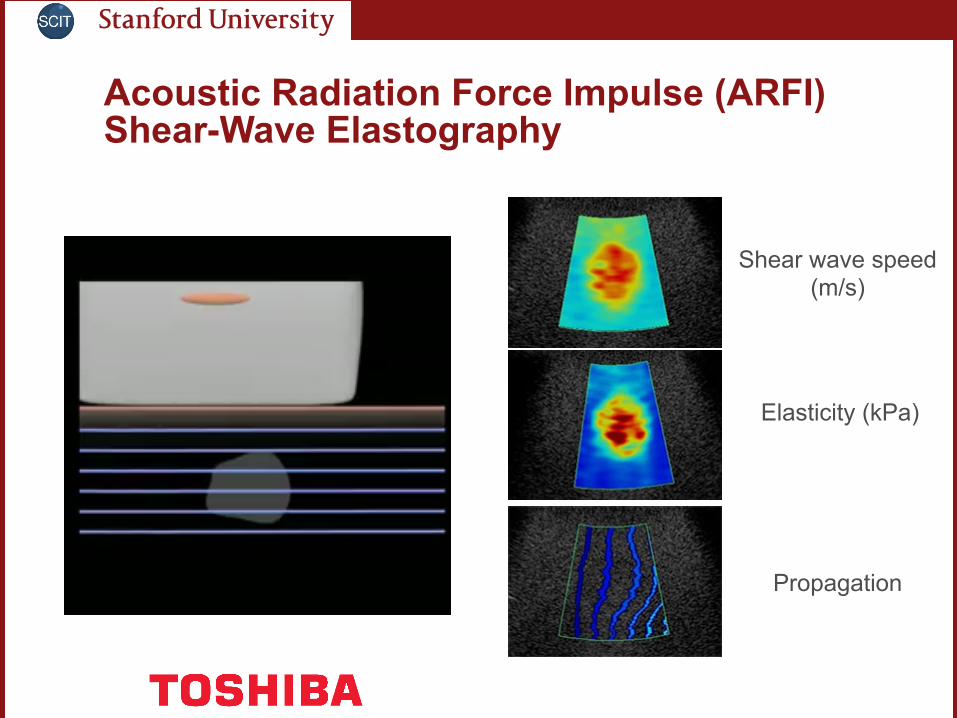
Acoustic Radiation Force Impulse (ARFI) Shear-Wave Elastography
Shear wave speed (m/s)
Elasticity (kPa)
Propagation
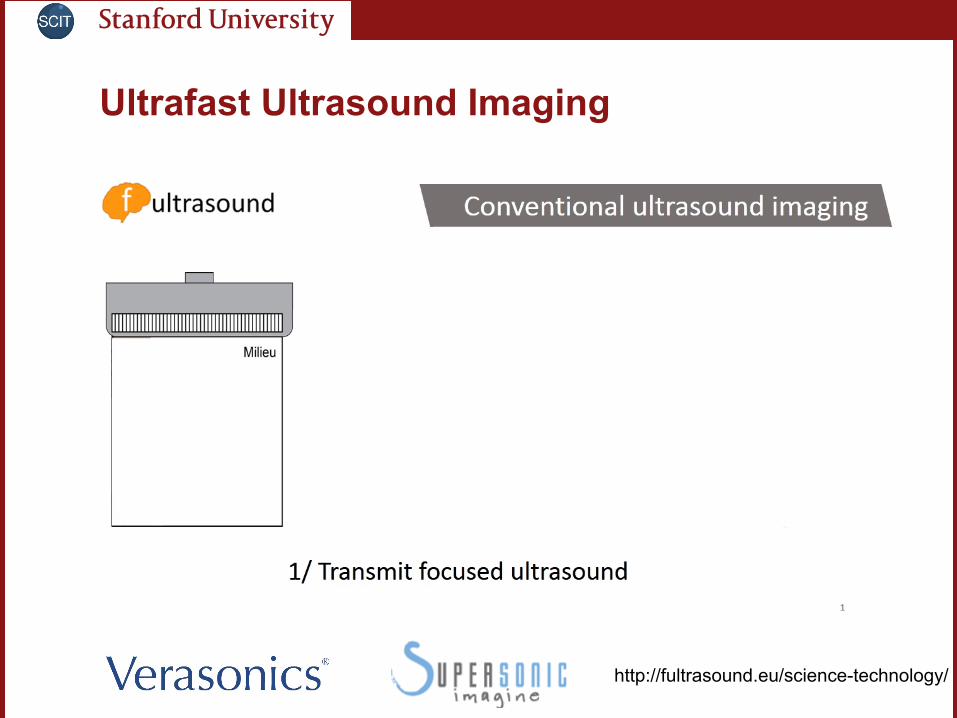
Ultrafast Ultrasound Imaging
http://fultrasound.eu/science-technology/
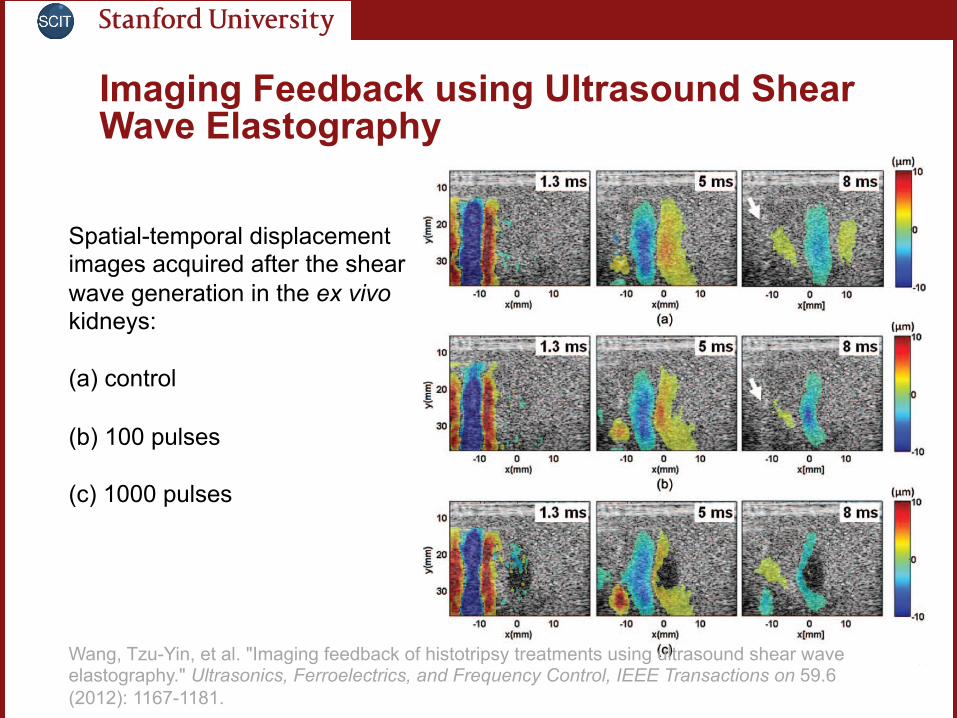
Imaging Feedback using Ultrasound Shear Wave Elastography
Wang, Tzu-Yin, et al. "Imaging feedback of histotripsy treatments using ultrasound shear wave elastography." Ultrasonics, Ferroelectrics, and Frequency Control, IEEE Transactions on 59.6 (2012): 1167-1181.
Spatial-temporal displacement images acquired after the shear wave generation in the ex vivo kidneys: (a) control (b) 100 pulses (c) 1000 pulses

Heavy Ion UTOPIA by Tobias
• Perform radiotherapy and image diagnosis simultaneously
Q&A