investment research weekly focus - danske bank · global macro and market themes ... ice brent oil...
TRANSCRIPT
Important disclosures and certifications are contained from page 16 of this report. www.danskeresearch.com
Investment Research
Market Movers ahead
Nonfarm payrolls and PCE inflation – both monitored closely by the Fed – are due for
release next week. Last month’s labour market report disappointed but we expect a
strong September reading due to low jobless claims and high ISM employment
indices. We expect core PCE to come out at 0.0% m/m and 1.4% y/y which is still
below the 2% target.
We expect the US ISM manufacturing index to decline slightly from 59.0 to 58.5,
which is still very high, indicating higher activity in the US.
The ECB meeting will deliver further details on the upcoming purchase programme of
asset-backed securities (ABS).
We expect euro area HICP inflation to decline from 0.4% y/y to 0.3% y/y due to
further decline in oil prices – a new cycle low.
The Danish FX reserves may attract some attention due to the strong krone.
Global macro and market themes
Weak euro surveys for September showed further weakness, adding to the downside
risks to growth. The weak surveys combined with very low inflation are adding to the
pressure on the ECB.
The Fed’s asset purchases programme comes to an end next month and, in this
connection, we expect the Fed to adjust its forward guidance.
The manufacturing PMI in China suggests that the Chinese slowdown may not be as
severe as previously feared.
Focus
During the week, we have published our quarterly Nordic Outlook including our new
forecasts on the Nordic economies, see Nordic Outlook – September 2014,
25 September. We have revised down our forecasts on Denmark and Sweden mainly
due to the European stagnation. In Norway, domestic demand is keeping activity on
track despite lower oil investments. The Russian recession and austerity measures are
weighing on the Finnish economy.
26 September 2014
Editors Allan von Mehren +45 4512 8055 [email protected] Steen Bocian +45 45 12 85 31 [email protected]
Weekly Focus
Tough job ahead for the ECB
Contents
Market movers ..................................................... 2
Global Macro and Market Themes .......... 6
Scandi update .................................................... 10
Latest research from Danske Bank Markets ................................................................. 11
Macroeconomic forecast ........................... 12
Financial forecast ............................................ 13
Calendar ................................................................ 14
Financial views
Source: Danske Bank
We expect a strong job report New forecasts on the Nordics
Source: US BLS, Danske Bank Markets Source: Danske Bank Markets
Major indices
26-Sep 3M 12M
10yr EUR swap 1.14 1.15 1.30
EUR/USD 127 127 125
ICE Brent oil 97 102 98
26-Sep 6M 12-24M
S&P500 1966 0-3% 5-8%

2 | 26 September 2014 www.danskeresearch.com
Weekly Fo
cus
Weekly Focus
Market movers
Global
We are heading towards a very busy week in the US, with the release of both the
September labour market report and the latest PCE figures.
Last month’s labour market report disappointed severely with an increase in non-farm
payrolls of only 142,000 despite very optimistic labour market indicators. Even if
correcting for the job loss of 17,000 due to the supermarket store strike, we still
believe the August report was too bad to be true. Low jobless claims, high ISM
employment indices as well as the increasing jobs plentiful versus hard to get balance
all suggest that the US labour market is in a considerably better condition than
reflected in last month’s report. Our model estimates an increase in non-farm payroll
in September of around 250,000 and we expect the unemployment rate to stay at
6.1%.
Moreover, we will get the latest update on the inflation pressure as the PCE figures
are due for release on Monday. The headline PCE has been closing in on the Fed’s
2.0% target through the first half of the year and the 3m AR rate is now of around
2.2%. But the consumer prices did not rise much in July and our models is suggesting
that August is going to be a low inflation month as well. We forecast a core PCE of
0.0% m/m and 1.4% y/y and low gasoline prices contribute to an expected headline
PCE of -0.1% m/m and 1.4% y/y.
The ISM manufacturing index rose to 59.0 in August – the highest level since
February 2011 – and upbeat comments in the latest report indicate optimism across a
large range of industries. We expect the ISM manufacturing index to stay at a high
level but make a small downward adjustment to 58.5. The markit PMI index is
expected to close in on the ISM with an increase to 58.5 as well. Moreover, the ISM
non-manufacturing index is also doing well, but we expect it to adjust slightly to 59.0
from 59.6 in August.
Finally, we expect consumer confidence to increase to 94.5 from 92.4 last month and
personal income and personal consumption is forecast to increase by 0.3% m/m and
0.5% m/m, respectively.
In the euro area, the ECB meeting next week will deliver further details on the
upcoming purchase programme of asset backed securities (ABS) and covered bonds.
We expect most focus to be on the new ECB soft target on the size of its balance sheet
that Draghi mentioned at the previous ECB meeting and which has been repeated by
several ECB members over the past month – an expansion of the ECB’s balance sheet
‘towards the dimensions it used to have at the beginning of 2012’. Although most
market participants view the first TLTRO take (82.6bn) as disappointing, Draghi has
commented that this allotment was well within the ECB’s expectations and that the
December auction was needed before assessing the success of the programme. We
expect him to repeat this message at the meeting. Lastly, we expect Draghi to reiterate
the Governing Council’s unanimous commitment to using additional unconventional
instruments if needed and thereby keeping the QE speculation alive.
Euro area September HICP inflation is expected to decline to 0.3% y/y from 0.4% y/y
due to a further decline in oil prices. Looking ahead, we expect inflation to pick up in
the coming months and, for that reason, the expected low September print will
Non-farm payrolls to bounce back
after last month’s weak report
Source: Macrobond
Italian sentiment points to nil growth
in Q3
Source: Macrobond
3 | 26 September 2014 www.danskeresearch.com
Weekly Fo
cus
Weekly Focus
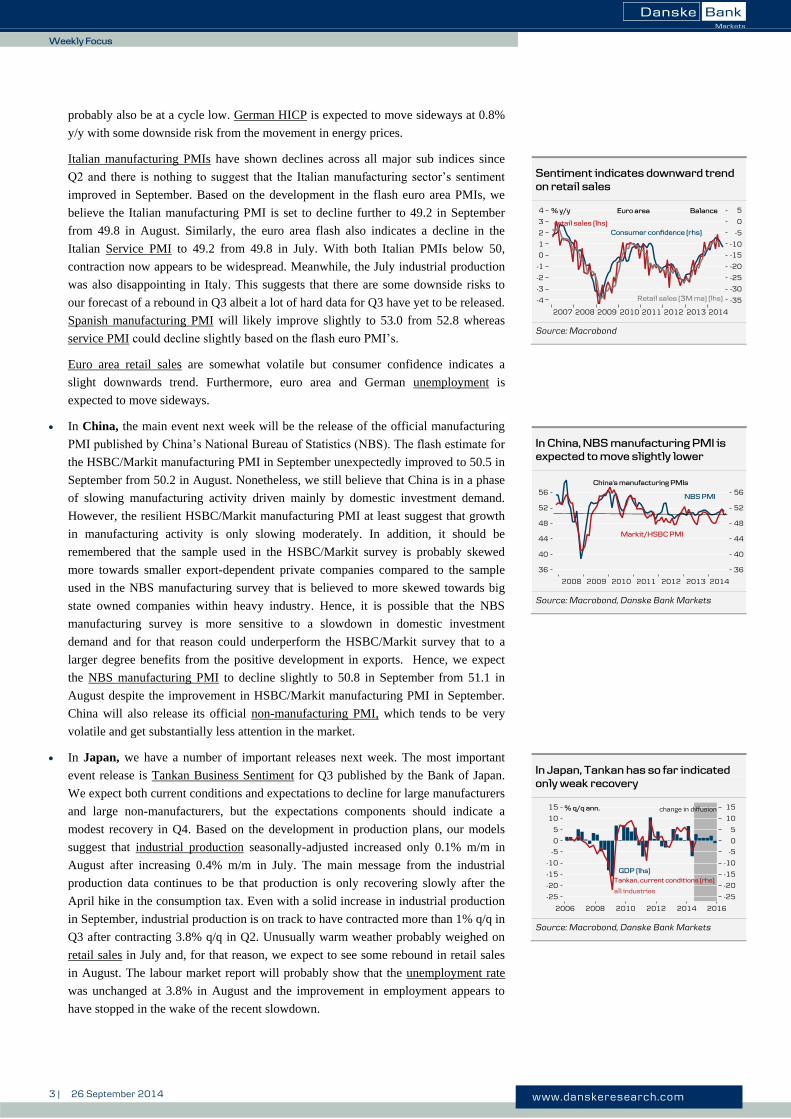
probably also be at a cycle low. German HICP is expected to move sideways at 0.8%
y/y with some downside risk from the movement in energy prices.
Italian manufacturing PMIs have shown declines across all major sub indices since
Q2 and there is nothing to suggest that the Italian manufacturing sector’s sentiment
improved in September. Based on the development in the flash euro area PMIs, we
believe the Italian manufacturing PMI is set to decline further to 49.2 in September
from 49.8 in August. Similarly, the euro area flash also indicates a decline in the
Italian Service PMI to 49.2 from 49.8 in July. With both Italian PMIs below 50,
contraction now appears to be widespread. Meanwhile, the July industrial production
was also disappointing in Italy. This suggests that there are some downside risks to
our forecast of a rebound in Q3 albeit a lot of hard data for Q3 have yet to be released.
Spanish manufacturing PMI will likely improve slightly to 53.0 from 52.8 whereas
service PMI could decline slightly based on the flash euro PMI’s.
Euro area retail sales are somewhat volatile but consumer confidence indicates a
slight downwards trend. Furthermore, euro area and German unemployment is
expected to move sideways.
In China, the main event next week will be the release of the official manufacturing
PMI published by China’s National Bureau of Statistics (NBS). The flash estimate for
the HSBC/Markit manufacturing PMI in September unexpectedly improved to 50.5 in
September from 50.2 in August. Nonetheless, we still believe that China is in a phase
of slowing manufacturing activity driven mainly by domestic investment demand.
However, the resilient HSBC/Markit manufacturing PMI at least suggest that growth
in manufacturing activity is only slowing moderately. In addition, it should be
remembered that the sample used in the HSBC/Markit survey is probably skewed
more towards smaller export-dependent private companies compared to the sample
used in the NBS manufacturing survey that is believed to more skewed towards big
state owned companies within heavy industry. Hence, it is possible that the NBS
manufacturing survey is more sensitive to a slowdown in domestic investment
demand and for that reason could underperform the HSBC/Markit survey that to a
larger degree benefits from the positive development in exports. Hence, we expect
the NBS manufacturing PMI to decline slightly to 50.8 in September from 51.1 in
August despite the improvement in HSBC/Markit manufacturing PMI in September.
China will also release its official non-manufacturing PMI, which tends to be very
volatile and get substantially less attention in the market.
In Japan, we have a number of important releases next week. The most important
event release is Tankan Business Sentiment for Q3 published by the Bank of Japan.
We expect both current conditions and expectations to decline for large manufacturers
and large non-manufacturers, but the expectations components should indicate a
modest recovery in Q4. Based on the development in production plans, our models
suggest that industrial production seasonally-adjusted increased only 0.1% m/m in
August after increasing 0.4% m/m in July. The main message from the industrial
production data continues to be that production is only recovering slowly after the
April hike in the consumption tax. Even with a solid increase in industrial production
in September, industrial production is on track to have contracted more than 1% q/q in
Q3 after contracting 3.8% q/q in Q2. Unusually warm weather probably weighed on
retail sales in July and, for that reason, we expect to see some rebound in retail sales
in August. The labour market report will probably show that the unemployment rate
was unchanged at 3.8% in August and the improvement in employment appears to
have stopped in the wake of the recent slowdown.
Sentiment indicates downward trend
on retail sales
Source: Macrobond
In China, NBS manufacturing PMI is
expected to move slightly lower
Source: Macrobond, Danske Bank Markets
In Japan, Tankan has so far indicated
only weak recovery
Source: Macrobond, Danske Bank Markets

4 | 26 September 2014 www.danskeresearch.com
Weekly Fo
cus
Weekly Focus
Scandi
In Denmark, a variety of data is on the agenda in the coming week. Most interesting
will be the revised national accounts figures for Q2 after the preliminary release
showed GDP contracting by 0.3%. The revision will be unusual as it follows the
major revision of the national accounts following the implementation of ESA 2010,
the new European system of national accounts. This may mean that we see slightly
bigger changes than normal. Elsewhere, the week brings figures for gross
unemployment (seasonally adjusted) and we expect a slight improvement in the
number of jobless from 134,500 in July to 134,000 in August, giving an unchanged
unemployment rate of 5.1%. There will also be news from industry in the form of
Statistics Denmark’s tendency surveys for September and housing prices for August,
although these are national figures and will not shed light on regional variations. In
addition, the Nationalbank will be releasing currency reserves data for September.
In Sweden, the week ahead kicks off on Monday morning (at 09.30 CEST) with
August retail sales, where we would be surprised not to see continued low y/y growth
as most indicators for the retail sector seem to have lost much of the momentum over
the past few weeks. Alas, we think that private consumption, albeit still positive, will
settle on a new lower pace of growth henceforth considering that 2015 is expected to
produce fiscal policy tightening and as new housing market related regulations put a
damper on growth. On Wednesday (at 08.30 CEST), we will receive another bout of
survey data in the form of manufacturing PMI. We actually do not have anything
intelligent (as if ever...) to say before the outcome other than that we expect it to stay
put in the 50-55 range. The week concludes with what we feel might be among the
most important numbers to keep up with Swedish domestic cyclical developments,
industrial production and orders (Friday, 09.30 CEST). As diligent readers are aware,
the manufacturing industry has posted a long string of disappointing data. A positive
outcome would keep our hopes up for a rebound in industrial activity during H2 but,
alas, it would do little to change the weak trend.
In Norway, the most important releases are retail sales figures for August and PMI
and NAV unemployment data for September. After strong growth earlier in the
summer, retail sales dropped sharply in July, putting paid to any ‘fears’ of an
impending consumer boom. However, we reckon the hot weather and a correction
from the strong growth in May and June were the main reasons for the fall in July.
Based on signals from the trade, we expect retail sales to grow 1.0% m/m in August.
This will still mean more or less zero growth in private consumption in Q3, but will
confirm that there is little downside risk to growth from private consumption going
forward. With oil-related industries slowing but the export industry growing more
quickly, the outlook for industry is uncertain. Time will tell which of these effects
dominates in terms of both industrial activity and GDP. So far this year, actual
industrial production has been surprisingly strong, while the PMI has painted a less
optimistic picture. This discrepancy may be because production is driven by order
books, whereas the PMI captures expectations. It is therefore reassuring that the PMI
picked up somewhat over the summer. We expect it to deteriorate somewhat now,
given the decline in European indicators and the weaker outlook for the oil sector and
predict a score of 51.0 in September. Rather surprisingly, the labour market has been
improving so far this year, but showed signs of levelling off in August. With more
and more redundancies in oil-related industries during the month, we expect
registered unemployment to come out at 2.8%, with the number of jobless rising by
Labour market on the mend
Source: Statistics Denmark
On a downward bound train...
Source: Statistics Sweden
Job losses in the oil sector
Source: Macrobond
5 | 26 September 2014 www.danskeresearch.com
Weekly Fo
cus
Weekly Focus
300-400. Taken together, therefore, the week's data will paint a rather mixed picture,
underlining the differences now emerging between sectors, but will also go to show
that growth is holding up relatively well despite lower oil investment.
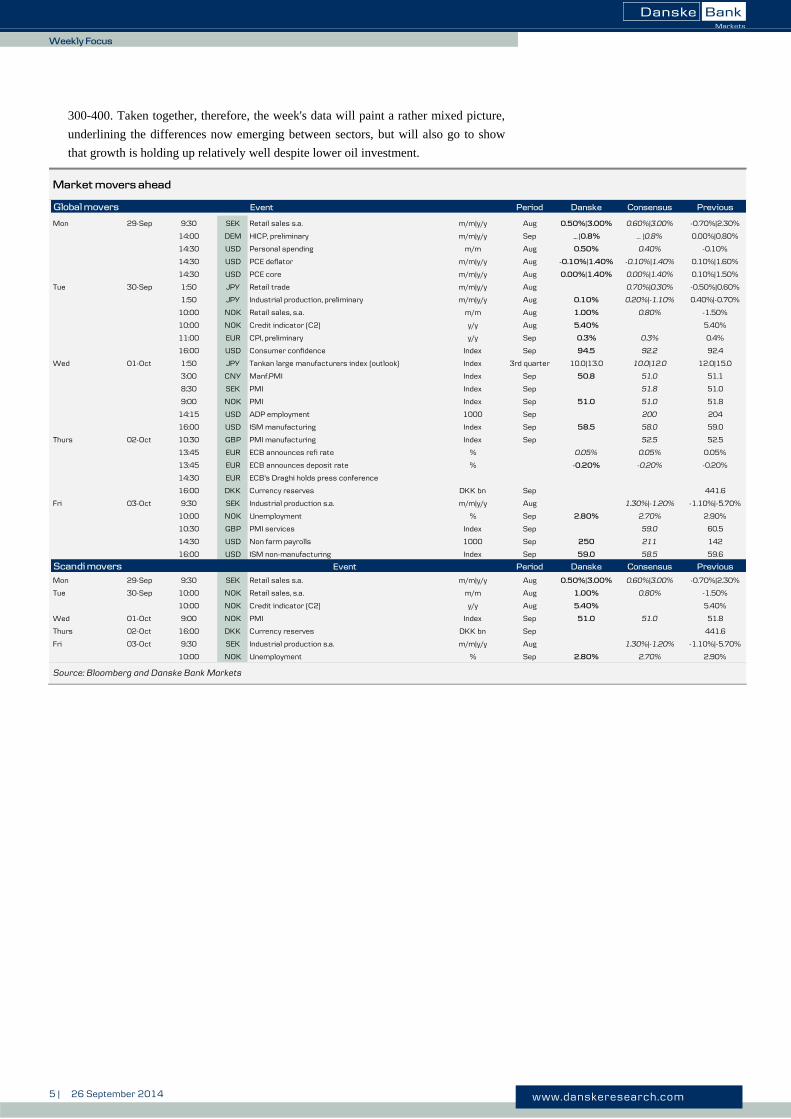
Market movers ahead
Source: Bloomberg and Danske Bank Markets
Global movers Event Period Danske Consensus Previous
Mon 29-Sep 9:30 SEK Retail sales s.a. m/m|y/y Aug 0.50%|3.00% 0.60%|3.00% -0.70%|2.30%
14:00 DEM HICP, preliminary m/m|y/y Sep … |0.8% … |0.8% 0.00%|0.80%
14:30 USD Personal spending m/m Aug 0.50% 0.40% -0.10%
14:30 USD PCE deflator m/m|y/y Aug -0.10%|1.40% -0.10%|1.40% 0.10%|1.60%
14:30 USD PCE core m/m|y/y Aug 0.00%|1.40% 0.00%|1.40% 0.10%|1.50%
Tue 30-Sep 1:50 JPY Retail trade m/m|y/y Aug 0.70%|0.30% -0.50%|0.60%
1:50 JPY Industrial production, preliminary m/m|y/y Aug 0.10% 0.20%|-1.10% 0.40%|-0.70%
10:00 NOK Retail sales, s.a. m/m Aug 1.00% 0.80% -1.50%
10:00 NOK Credit indicator (C2) y/y Aug 5.40% 5.40%
11:00 EUR CPI, preliminary y/y Sep 0.3% 0.3% 0.4%
16:00 USD Consumer confidence Index Sep 94.5 92.2 92.4
Wed 01-Oct 1:50 JPY Tankan large manufacturers index (outlook) Index 3rd quarter 10.0|13.0 10.0|12.0 12.0|15.0
3:00 CNY Manf.PMI Index Sep 50.8 51.0 51.1
8:30 SEK PMI Index Sep 51.8 51.0
9:00 NOK PMI Index Sep 51.0 51.0 51.8
14:15 USD ADP employment 1000 Sep 200 204
16:00 USD ISM manufacturing Index Sep 58.5 58.0 59.0
Thurs 02-Oct 10:30 GBP PMI manufacturing Index Sep 52.5 52.5
13:45 EUR ECB announces refi rate % 0.05% 0.05% 0.05%
13:45 EUR ECB announces deposit rate % -0.20% -0.20% -0.20%
14:30 EUR ECB's Draghi holds press conference
16:00 DKK Currency reserves DKK bn Sep 441.6
Fri 03-Oct 9:30 SEK Industrial production s.a. m/m|y/y Aug 1.30%|-1.20% -1.10%|-5.70%
10:00 NOK Unemployment % Sep 2.80% 2.70% 2.90%
10:30 GBP PMI services Index Sep 59.0 60.5
14:30 USD Non farm payrolls 1000 Sep 250 211 142
16:00 USD ISM non-manufacturing Index Sep 59.0 58.5 59.6
Scandi movers Event Period Danske Consensus Previous
Mon 29-Sep 9:30 SEK Retail sales s.a. m/m|y/y Aug 0.50%|3.00% 0.60%|3.00% -0.70%|2.30%
Tue 30-Sep 10:00 NOK Retail sales, s.a. m/m Aug 1.00% 0.80% -1.50%
10:00 NOK Credit indicator (C2) y/y Aug 5.40% 5.40%
Wed 01-Oct 9:00 NOK PMI Index Sep 51.0 51.0 51.8
Thurs 02-Oct 16:00 DKK Currency reserves DKK bn Sep 441.6
Fri 03-Oct 9:30 SEK Industrial production s.a. m/m|y/y Aug 1.30%|-1.20% -1.10%|-5.70%
10:00 NOK Unemployment % Sep 2.80% 2.70% 2.90%

6 | 26 September 2014 www.danskeresearch.com
Weekly Fo
cus
Weekly Focus
Global Macro and Market Themes
More soft euro data adds pressure on the ECB
This week’s euro surveys for September showed further weakness adding to the
downside risks to growth. PMI data for the euro area weakened further, driven by
weakness in German manufacturing and the German ifo expectations index dropped yet
again more than expected, highlighting downside risks to Q4 growth (following a
technical rebound in Q3). The German ZEW sentiment index already warned of a weak
reading for ifo last week when it showed a continued drop. Although many commentators
do not like the ZEW index because it is a survey of financial analysts, it is better than its
name suggests (see chart). We expect surveys to move a bit lower in the coming months
before staging a moderate rebound in early 2015, driven by a positive spill-over effect
from US growth, the easing Ukraine crisis and a weaker currency.
Along with very low inflation, yet lower inflation expectations and a further decline
in oil prices, the weak surveys are adding to the pressure on ECB to ensure it
provides a meaningful stimulus to underpin the recovery and lift inflation. It is
increasingly questionable whether the current measures will be enough and hence the
likelihood of real quantitative easing (a bigger programme of government bond
purchases) is going up; not least because it appears to be difficult for the ECB to increase
the balance sheet as much as it might hope with the current measures.
Tough job ahead for the ECB
It is not an easy task the ECB has of getting inflation back to 2%. First, the end of the
super cycle in commodities continues to put downside pressure on commodity prices
and thus inflation. Brent oil prices resumed the decline that started in July and, at
USD96.6, trades at the lowest level in two years. Industrial metals have also fallen back
recently due to weaker Chinese data.
Second, high unemployment and low inflation continue to put downward pressure
on wage growth in the euro area. In Q2 14, wage compensation fell to a new cycle low
of 1.1% y/y – the lowest level in many decades. With inflation as low as it is, consumers
are actually getting a decent real wage gain even with this level of nominal wage growth.
This is one of the challenges for the ECB. When inflation is lower for a longer period,
wage earners become satisfied with lower wage increases, which in turn makes it even
more difficult to get inflation higher. In this sense, inflation is shifting to a lower
equilibrium level below the ECB’s 2% limit. This is also the reason why ECB president
Mario Draghi has repeatedly stated that persistent low inflation is a problem for the ECB
because of the risk it will get anchored in expectations. For the ECB to get inflation
higher, it will need to provide enough stimulus to a) convince wage earners that they
should expect 2% inflation and b) to generate enough demand to get unemployment down
and dampen the downside pressure on wage increases.
Key points
More weak data adds pressure on
the ECB
Likelihood of real QE from ECB
increasing
The Fed is expected to change
forward guidance in October
Emerging markets in a fragile spot
German ZEW has given good signal
for ifo expectations
Source: Macrobond Financial
Euro wage growth at very low level
Source: Macrobond Financial
7 | 26 September 2014 www.danskeresearch.com
Weekly Fo
cus
Weekly Focus
As two of the biggest economies in the euro area – France and Italy – suffer from poor
competitiveness, overvalued house prices (in the case of France) and structural rigidities,
the ECB really needs countries like Germany and Spain to perform. In that light, the
current weak German figures should be of particular concern. On the other hand, it may
help in the attempt to get Germany to ease fiscal policy as Mario Draghi has increasingly
pointed to, albeit in his own cautious way.
German bond yields to stay low for a very long time
With inflation expected to remain very low in the years ahead, a very sluggish recovery
and high unemployment, there will be little pressure for higher bond yields in the euro
area. The ECB will continue to have an easing bias for a long time and investors move
out on the yield curve to get yields. The question we get a lot at the moment is whether
the euro area is the ‘new Japan’. It would be a lengthy discussion to go into and there are
both similarities and differences that we will look closer at it in a couple of forthcoming
papers. However, it is clear that monetary policy rates will be low for a very long time,
global liquidity will be ample and pension funds should continue to get new money in
that needs a home – some of them in the bond market. We should therefore expect bond
yields in the euro area to remain low for a long time.
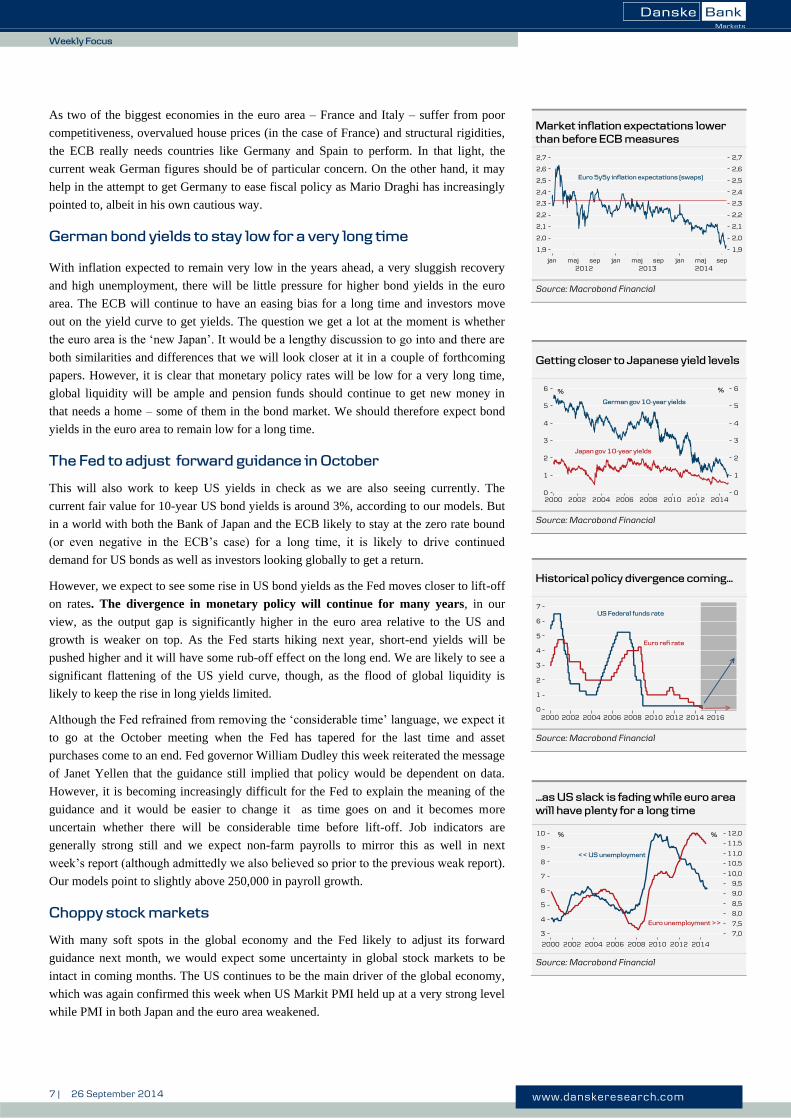
The Fed to adjust forward guidance in October
This will also work to keep US yields in check as we are also seeing currently. The
current fair value for 10-year US bond yields is around 3%, according to our models. But
in a world with both the Bank of Japan and the ECB likely to stay at the zero rate bound
(or even negative in the ECB’s case) for a long time, it is likely to drive continued
demand for US bonds as well as investors looking globally to get a return.
However, we expect to see some rise in US bond yields as the Fed moves closer to lift-off
on rates. The divergence in monetary policy will continue for many years, in our
view, as the output gap is significantly higher in the euro area relative to the US and
growth is weaker on top. As the Fed starts hiking next year, short-end yields will be
pushed higher and it will have some rub-off effect on the long end. We are likely to see a
significant flattening of the US yield curve, though, as the flood of global liquidity is
likely to keep the rise in long yields limited.
Although the Fed refrained from removing the ‘considerable time’ language, we expect it
to go at the October meeting when the Fed has tapered for the last time and asset
purchases come to an end. Fed governor William Dudley this week reiterated the message
of Janet Yellen that the guidance still implied that policy would be dependent on data.
However, it is becoming increasingly difficult for the Fed to explain the meaning of the
guidance and it would be easier to change it as time goes on and it becomes more
uncertain whether there will be considerable time before lift-off. Job indicators are
generally strong still and we expect non-farm payrolls to mirror this as well in next
week’s report (although admittedly we also believed so prior to the previous weak report).
Our models point to slightly above 250,000 in payroll growth.
Choppy stock markets
With many soft spots in the global economy and the Fed likely to adjust its forward
guidance next month, we would expect some uncertainty in global stock markets to be
intact in coming months. The US continues to be the main driver of the global economy,
which was again confirmed this week when US Markit PMI held up at a very strong level
while PMI in both Japan and the euro area weakened.
Market inflation expectations lower
than before ECB measures
Source: Macrobond Financial
Getting closer to Japanese yield levels
Source: Macrobond Financial
Historical policy divergence coming...
Source: Macrobond Financial
...as US slack is fading while euro area
will have plenty for a long time
Source: Macrobond Financial

8 | 26 September 2014 www.danskeresearch.com
Weekly Fo
cus
Weekly Focus
However, we continue to be positive on the stock market in the medium to long term as
we look for growth to recover in both the euro area and Japan on a six-12 month horizon
and expect US growth to continue at a 3-3.5% growth pace. With very cheap liquidity and
lots of it as far as the eye can see, risk assets should continue to perform in the medium
term.
Slowdown not as severe as feared
China’s HSBC manufacturing PMI unexpectedly improved in September (see Flash
Comment - China: Slight improvement in HSBC manufacturing PMI suggests slowdown
less severe than feared, 23 September 2014). It does not change our view that China is
again in a phase of slower growth driven primarily by weaker credit growth and domestic
investment demand and the manufacturing PMIs will continue to edge lower in the
coming months. However, the manufacturing PMI suggests that the slowdown might not
be as severe as we feared. It appears the weakness in domestic demand is to some degree
being offset by stronger export growth. In the HSBC manufacturing PMI, export orders
reached their highest level since March 2010 and exports were also the bright spot in the
overall weak hard data for August. Retail sales in China have also been relatively resilient
in recent months if we adjust for the decline in inflation, suggesting that so far there has
been no substantial negative impact on private consumption from the weak property
market.
Hence, at least for now, the data suggests that the Chinese economy is able to rebalance
without a severe slowdown in growth. This is not necessarily positive for commodity
markets. First, the implications are that we are unlikely to see any major stimulus from
the Chinese government in the short run. Second, demand from China will also be less
resource-intensive with growth gradually shifting away from investment-driven growth.
Another implication is likely to be that the Chinese current account surplus will again
start to increase as indicated by the surge in China’s trade surplus in recent months.
Hence, we expect the Chinese currency to continue to appreciate as long as growth does
not slow severely.
Emerging markets are fragile
With a Fed hike moving closer, growth in China slowing and commodity prices under
pressure across the board, emerging markets are fragile. Among emerging markets,
fundamentals are currently strongest for Asia as it has the strongest external balances and
the Asian region as a whole is benefiting from the recent declines in commodity prices.
In China, surprise increase in PMI
indicates less severe slowdown
Source: Macrobond Financial
Emerging markets in a fragile spot
Source: Macrobond Financial

9 | 26 September 2014 www.danskeresearch.com
Weekly Fo
cus
Weekly Focus
Global market views
Source: Danske Bank Markets
Asset class Main factors
Equities Moderately positive on 3M view, positive on 12M view The continued recovery in the US, China and, to some extent, Europe combined with stimulus from especially
BoJ and ECB will support equities. On a company level, data is starting to look promising as well. Earnings growth in Q2 showed strong momentum across the board, capex in the US is picking up and earnings revisions are positive for 2014 and 2015 for most regions
Bond market Risk of higher US rates in the near term Lower long-term growth and inflation expectations and hedging flows weigh on long bond yields in the short term US-Euro spread: wider 2-5Y, stable longer maturities Policy divergence drives short-end spread wider, longer-end spread stable as close to historical highs Peripheral spreads to continue gradual tightening Added liquidity, search for yield, improving fundamentals. Volatility to pick up somewhat Credit spread to tighten gradually still, but risk of higher vol Added liquidity, search for yield, good fundamentals. Geopolitical and idiosyncratic risk creates jitters
FX EUR/USD - more downside in short and medium term EUR/USD to fall further on diverging monetary policy, growth and portfolio flows USD/JPY - higher USD/JPY to break higher on pension reforms, portfolio outflows and diverging monetary policy EUR/SEK - lower EUR/SEK to decline on growth and valuation EUR/NOK - more downside especially in the short term EUR/NOK to decline on growth and carry in a world of low global growth and zero interest rates
Commodities Oil prices - stable prices for the rest of the year Substantial supply shock to weigh in 2014. Limited risk of supply disruptions Metal prices sideways before trending up in 2015 Support from global recovery, supply side risks Gold prices to correct lower still Trending down as first Fed hike draws closer. Geopolitical concerns a supportive factor Agricultural risks remain on the upside Near-term stabilisation, extreme weather is key upside risk

10 | 26 September 2014 www.danskeresearch.com
Weekly Fo
cus
Weekly Focus
Scandi update
Denmark – New forecast from Danske Bank: Fragile recovery
Both Danske Bank and the Nationalbank published updated forecasts for the Danish
economy during the week. Our take is that we are in the early stages of recovery but
recent data have underlined that progress will be slow and fragile and could easily be
derailed. Although the numbers have been disappointing of late, we do not think that the
recovery has been knocked completely off course, but we have revised down our growth
forecast. We now anticipate growth of 0.8% this year and 1.8% next year, which is
closely in line with the 0.8% and 1.7% predicted by the central bank in its Q3 monetary
review.
The week’s data included figures for consumer confidence showing a decrease from 11.4
in August to 7.1 in September, which can be seen in the light of rather less positive
economic news lately, such as the disappointing GDP figures for Q2. The fall should also
be seen as a normalisation, as the indicator had previously climbed for six successive
months, which has never happened before. Despite the fall in September, consumer
confidence remains high.
Sweden – We remain positive but are feeling less so
The NIER’s confidence data provided a relief for those worried about the consumption
outlook as consumers apparently were not as pessimistic as we thought and August data
were revised markedly stronger. Alas, the same cannot be said for those of us more
worried about the manufacturing sector and its pervasive importance for Swedish GDP-
growth. Manufacturing confidence continues to point to consecutive growth but not in a
very confident fashion. In addition, the overall economic tendency is just barely positive,
raising some doubt about the expected acceleration in demand during autumn. To further
that proposition, the (August) trade balance was again far below last year and exports are
uncannily weak for a country that has the ‘worst performing’ currency in the G10-
universe!
Norway – Tighter labour market
Norwegian unemployment has been surprisingly stable given the downturn in oil-related
industries. It actually seems to have fallen so far this year after rising towards the end of
last year. Employment growth has also picked up to around 2% annualised over the past
three months. This points to stronger growth in other sectors, such as the export industry,
retail, construction and, of course, the public sector. Given all the downsizing in oil-
related industries over the summer, we nevertheless believe that unemployment could rise
gently during the autumn before falling again next year. Signals seem to suggest that
5,000 people may be made redundant in these industries, equivalent to 0.2% of the labour
force. Since we expect oil investment to pick up again from 2016, our provisional
conclusion is that this will be a one-off effect, pushing up overall unemployment only to a
limited degree, and will peter out over the winter.
Fragile Danish recovery
Source: Statistics Denmark
Isn’t external demand recuperating?
Source: Statistics Sweden. DBM calculations
Falling unemployment
Source: Macrobond

11 | 26 September 2014 www.danskeresearch.com
Weekly Fo
cus
Weekly Focus
Latest research from Danske Bank Markets
25/9 Nordic Outlook - September 2014
Quarterly update on the Nordic economies.
23/9/14 Flash Comment - China: Slight improvement in HSBC manufacturing PMI
suggests slowdown less severe than feared
The flash estimate for China's HSBC/Markit manufacturing PMI in September
unexpectedly improved to 50.5 (consensus: 50.0, DBM: 49.4) from a final reading of 50.2
in August.
23/9/14 Flash Comment: Euro PMI still soft - German manufacturing weakens further
Euro flash PMI weakened further in September
19/9/14 Monitor - Global: business cycle monitor
Strong divergence - US the only pillar of strength
12 | 26 September 2014 www.danskeresearch.com
Weekly Fo
cus
Weekly Focus
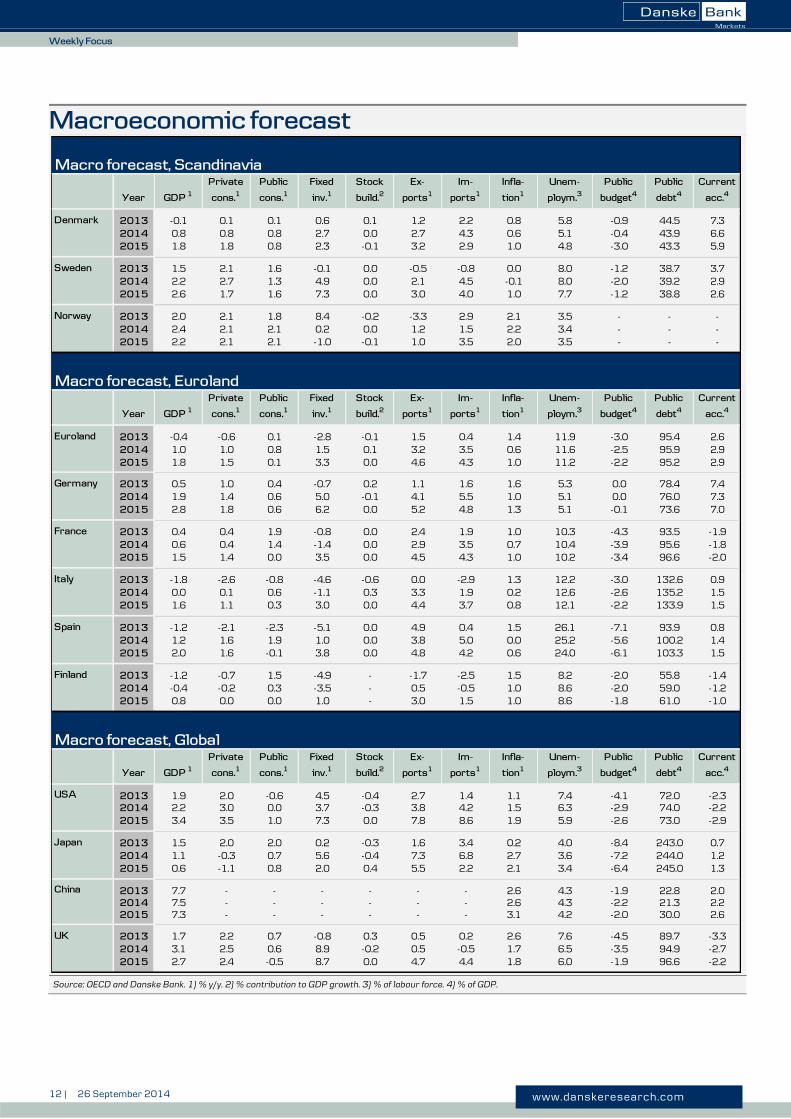
Macroeconomic forecast
Source: OECD and Danske Bank. 1) % y/y. 2) % contribution to GDP growth. 3) % of labour force. 4) % of GDP.
Macro forecast, Scandinavia
Denmark 2013 -0.1 0.1 0.1 0.6 0.1 1.2 2.2 0.8 5.8 -0.9 44.5 7.32014 0.8 0.8 0.8 2.7 0.0 2.7 4.3 0.6 5.1 -0.4 43.9 6.62015 1.8 1.8 0.8 2.3 -0.1 3.2 2.9 1.0 4.8 -3.0 43.3 5.9
Sweden 2013 1.5 2.1 1.6 -0.1 0.0 -0.5 -0.8 0.0 8.0 -1.2 38.7 3.72014 2.2 2.7 1.3 4.9 0.0 2.1 4.5 -0.1 8.0 -2.0 39.2 2.92015 2.6 1.7 1.6 7.3 0.0 3.0 4.0 1.0 7.7 -1.2 38.8 2.6
Norway 2013 2.0 2.1 1.8 8.4 -0.2 -3.3 2.9 2.1 3.5 - - -2014 2.4 2.1 2.1 0.2 0.0 1.2 1.5 2.2 3.4 - - -2015 2.2 2.1 2.1 -1.0 -0.1 1.0 3.5 2.0 3.5 - - -
Macro forecast, Euroland
Euroland 2013 -0.4 -0.6 0.1 -2.8 -0.1 1.5 0.4 1.4 11.9 -3.0 95.4 2.62014 1.0 1.0 0.8 1.5 0.1 3.2 3.5 0.6 11.6 -2.5 95.9 2.92015 1.8 1.5 0.1 3.3 0.0 4.6 4.3 1.0 11.2 -2.2 95.2 2.9
Germany 2013 0.5 1.0 0.4 -0.7 0.2 1.1 1.6 1.6 5.3 0.0 78.4 7.42014 1.9 1.4 0.6 5.0 -0.1 4.1 5.5 1.0 5.1 0.0 76.0 7.32015 2.8 1.8 0.6 6.2 0.0 5.2 4.8 1.3 5.1 -0.1 73.6 7.0
France 2013 0.4 0.4 1.9 -0.8 0.0 2.4 1.9 1.0 10.3 -4.3 93.5 -1.92014 0.6 0.4 1.4 -1.4 0.0 2.9 3.5 0.7 10.4 -3.9 95.6 -1.82015 1.5 1.4 0.0 3.5 0.0 4.5 4.3 1.0 10.2 -3.4 96.6 -2.0
Italy 2013 -1.8 -2.6 -0.8 -4.6 -0.6 0.0 -2.9 1.3 12.2 -3.0 132.6 0.92014 0.0 0.1 0.6 -1.1 0.3 3.3 1.9 0.2 12.6 -2.6 135.2 1.52015 1.6 1.1 0.3 3.0 0.0 4.4 3.7 0.8 12.1 -2.2 133.9 1.5
Spain 2013 -1.2 -2.1 -2.3 -5.1 0.0 4.9 0.4 1.5 26.1 -7.1 93.9 0.82014 1.2 1.6 1.9 1.0 0.0 3.8 5.0 0.0 25.2 -5.6 100.2 1.42015 2.0 1.6 -0.1 3.8 0.0 4.8 4.2 0.6 24.0 -6.1 103.3 1.5
Finland 2013 -1.2 -0.7 1.5 -4.9 - -1.7 -2.5 1.5 8.2 -2.0 55.8 -1.42014 -0.4 -0.2 0.3 -3.5 - 0.5 -0.5 1.0 8.6 -2.0 59.0 -1.22015 0.8 0.0 0.0 1.0 - 3.0 1.5 1.0 8.6 -1.8 61.0 -1.0
Macro forecast, Global
USA 2013 1.9 2.0 -0.6 4.5 -0.4 2.7 1.4 1.1 7.4 -4.1 72.0 -2.32014 2.2 3.0 0.0 3.7 -0.3 3.8 4.2 1.5 6.3 -2.9 74.0 -2.22015 3.4 3.5 1.0 7.3 0.0 7.8 8.6 1.9 5.9 -2.6 73.0 -2.9
Japan 2013 1.5 2.0 2.0 0.2 -0.3 1.6 3.4 0.2 4.0 -8.4 243.0 0.72014 1.1 -0.3 0.7 5.6 -0.4 7.3 6.8 2.7 3.6 -7.2 244.0 1.22015 0.6 -1.1 0.8 2.0 0.4 5.5 2.2 2.1 3.4 -6.4 245.0 1.3
China 2013 7.7 - - - - - - 2.6 4.3 -1.9 22.8 2.02014 7.5 - - - - - - 2.6 4.3 -2.2 21.3 2.22015 7.3 - - - - - - 3.1 4.2 -2.0 30.0 2.6
UK 2013 1.7 2.2 0.7 -0.8 0.3 0.5 0.2 2.6 7.6 -4.5 89.7 -3.32014 3.1 2.5 0.6 8.9 -0.2 0.5 -0.5 1.7 6.5 -3.5 94.9 -2.72015 2.7 2.4 -0.5 8.7 0.0 4.7 4.4 1.8 6.0 -1.9 96.6 -2.2
Current
acc.4
GDP 1
Private
cons.1
Public
cons.1
Fixed
inv.1
Stock
build.2
Ex-
ports1
Im-
ports1
Infla-
tion1
Unem-
ploym.3
Public
budget4
Public
debt4
Year
Year GDP 1
Private
cons.1
Public
cons.1
Fixed
inv.1
Stock
build.2
Ex-
ports1
Im-
ports1
Infla-
tion1
Unem-
ploym.3
Public
budget4
Current
acc.4
Public
debt4
Current
acc.4
Im-
ports1
Public
debt4
Public
budget4
Ex-
ports1
Infla-
tion1
Unem-
ploym.3
Year GDP 1
Private
cons.1
Public
cons.1
Fixed
inv.1
Stock
build.2

13 | 26 September 2014 www.danskeresearch.com
Weekly Fo
cus
Weekly Focus
Financial forecast
Source: Danske Bank Markets
Bond and money markets
Currencyvs USD
Currencyvs DKK
USD 26-Sep - 583.9
+3m - 586.4
+6m - 590.9+12m - 595.6
EUR 26-Sep 127.5 744.4
+3m 127.0 744.8
+6m 126.0 744.5+12m 125.0 744.5
JPY 26-Sep 109.0 5.36
+3m 110.0 5.32
+6m 112.0 5.28+12m 114.0 5.21
GBP 26-Sep 163.2 952.7
+3m 163.0 954.8
+6m 164.0 966.9+12m 164.0 979.6
CHF 26-Sep 94.7 616.7
+3m 95.3 615.5
+6m 96.8 610.2+12m 99.2 600.4
DKK 26-Sep 583.9 -
+3m 586.4 -
+6m 590.9 -+12m 595.6 -
SEK 26-Sep 722.0 80.9
+3m 716.5 81.8
+6m 714.3 82.7+12m 704.0 84.6
NOK 26-Sep 640.7 91.1
+3m 626.0 93.7
+6m 623.0 94.8+12m 620.0 96.1
Equity Markets
Regional
Price trend12 mth.
Regional recommen-dations
USA (USD) Strong growth & earnings, expensive 5-8% Neutral
Emerging markets (local curr) Commodity-related equities are pressured 0-5% Underweight
Europe (ex. Nordics) Recovering economy, fair valuation 5-10% OverweightNordics Strong cyclical profile 5-10% Overweight
Commodities
Q1 Q2 Q3 Q4 Q1 Q2 Q3 Q4 2014 2015
NYMEX WTI 99 103 96 93 93 94 94 95 98 94
ICE Brent 108 110 102 98 97 98 98 99 104 98
Copper 6,996 6,768 6,850 6,850 7,000 7,150 7,300 7,450 6,866 7,225
Zinc 2,024 2,080 2,300 2,350 2,400 2,450 2,500 2,550 2,189 2,475
Nickel 14,723 18,529 18,500 18,500 18,750 19,000 19,250 19,500 17,563 19,125
Aluminium 1,754 1,839 2,000 2,000 2,050 2,100 2,150 2,200 1,898 2,125
Gold 1,292 1,291 1,275 1,250 1,240 1,230 1,220 1,210 1,277 1,225
Matif Mill Wheat (€/t) 201 200 170 167 173 177 178 180 185 177
Rapeseed (€/t) 383 372 325 304 315 321 324 326 346 321
CBOT Wheat (USd/bushel) 618 651 530 520 530 540 545 550 580 541
CBOT Corn (USd/bushel) 453 478 360 360 370 380 385 390 413 381CBOT Soybeans (USd/bushel) 1,358 1,470 1,140 1,050 1,070 1,090 1,100 1,110 1,254 1,093
315
Average
Key int.rate
0.25
0.25
0.250.75
1.50
0.00
0.05
0.05
0.100.10
0.50
10-yr swap yield
0.47
0.20
0.200.20
3m interest rate
1.75
0.05
0.10
0.50
0.00
0.20
0.05
0.75
0.911.42
0.000.00
0.05
0.75
0.50
0.25
0.10
0.29
0.05
1.25
0.050.05
0.20
0.21
0.20
0.45
0.45
1.50
0.25
0.250.25
1.50
1.50
1.75
1.75
0.24
0.08
0.12
0.56
0.01
0.30
0.581.07
0.05
0.05
0.20
0.15
0.20
1.95
2.05
0.55
2.20
0.70
1.801.66
0.35
0.350.35
0.05
0.050.05
0.54
0.50
1.452.10
1.50
1.702.20
0.20
0.200.25
127.5
-
-
--
139.0
744.8
744.5744.5
920.4
816.8
775.0
910.0
785.0
900.0880.0
795.0
120.7
744.4
78.0
77.076.0
121.0
122.0124.0
127.0
126.0125.0
140.0
141.0143.0
High
Medium
Currencyvs EUR
2-yr swap yield
Risk profile3 mth.
Medium 0-3%
Price trend3 mth.
2.85
2.63
3.15
0.79
0.20
0.17
1.25
0.02
0.47
0.15
0.150.15
0.95
78.1
3.40
326
26-Sep
0-3%
0-3%
92
17,325
6,695
2,266
1,223
150
97
1,951
20152014
Medium 0-3%
1.15
1.201.30
0.75
0.800.85
2.51
2.75
0.64
918
471
1.14
1.801.95
2.59
3.00
3.05
2.953.30
0.82
0.95
1.051.25
3.35
1.471.57
1.42
1.73
1.65
1.46

14 | 26 September 2014 www.danskeresearch.com
Weekly Fo
cus
Weekly Focus
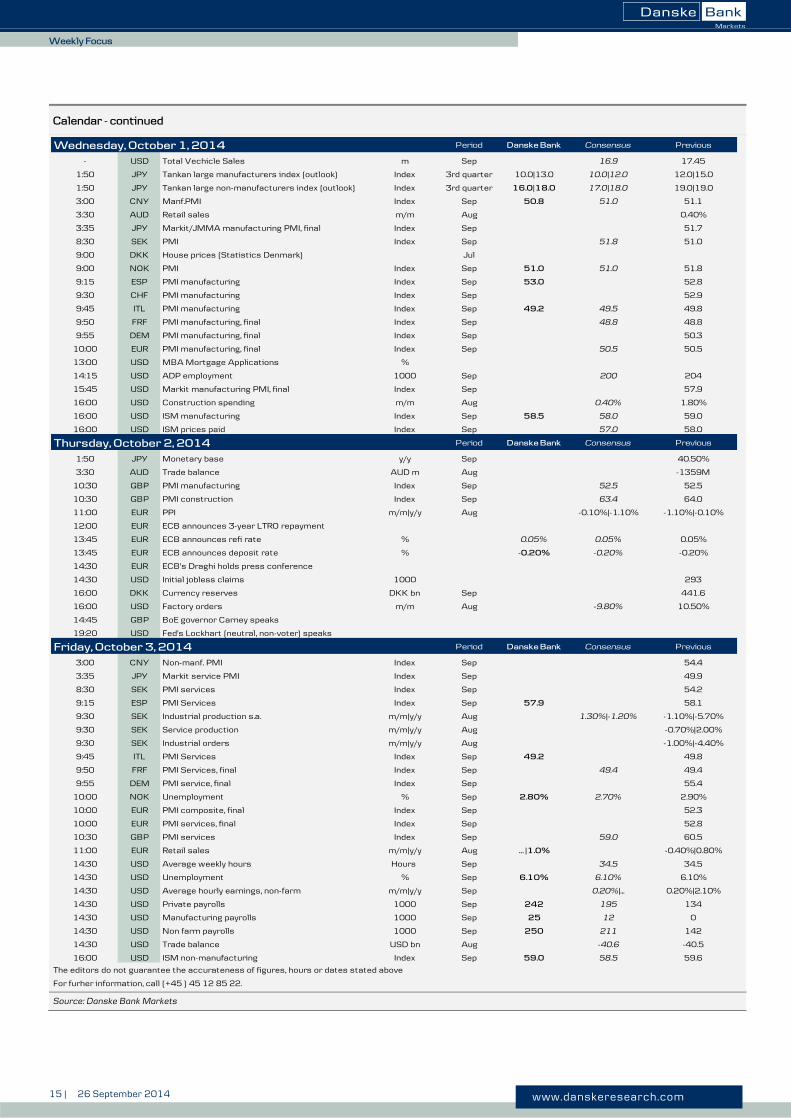
Calendar
Source: Danske Bank Markets
Key Data and Events in Week 40
During the week Period Danske Bank Consensus Previous
Mon 03 - 09 JPY Bank lending y/y Mar 2,20%
Sat 04 - 04 JPY Official reserves assets USD bn Mar 1288.2
Sat 27 - 01 DEM Retail sales m/m|y/y Aug -1.10%|1.00%
Monday, September 29, 2014 Period Danske Bank Consensus Previous
9:00 ESP HICP, preliminary m/m|y/y Sep ...|-0.50%
9:00 DKK Confidence indicator, industry Index Sep -2 -6
9:30 SEK Retail sales s.a. m/m|y/y Aug 0.50%|3.00% 0.60%|3.00% -0.70%|2.30%
10:30 GBP Broad money M4 m/m|y/y Aug 0.30%|-1.00%
11:00 EUR Business climate indicator Net bal. Sep 0.2
11:00 EUR Industrial confidence Net bal. Sep -5.5 -5.3
11:00 EUR Economic confidence Index Sep 100.0 100.6
11:00 EUR Consumer confidence, final Net bal. Sep -11.4
11:00 EUR Service confidence Net bal. Sep 2.5 3.1
14:00 DEM HICP, preliminary m/m|y/y Sep … |0.8% … |0.8% 0.00%|0.80%
14:30 USD Personal income m/m Aug 0.30% 0.30% 0.20%
14:30 USD Personal spending m/m Aug 0.50% 0.40% -0.10%
14:30 USD PCE deflator m/m|y/y Aug -0.10%|1.40% -0.10%|1.40% 0.10%|1.60%
14:30 USD PCE core m/m|y/y Aug 0.00%|1.40% 0.00%|1.40% 0.10%|1.50%
15:00 USD Fed's Evans (non-voter, dovish) speaks
16:00 USD Pending home sales m/m|y/y Aug -1.50%|… 0.40%|... 3.30%|-2.70%
18:15 USD Former chairman Bernanke speaks
Tuesday, September 30, 2014 Period Danske Bank Consensus Previous
1:05 GBP Gfk Consumer confidence Index Sep 0 1.0
1:30 JPY Household spending y/y Aug -3.60% -5.90%
1:30 JPY Unemployment rate % Aug 3.80% 3.80% 3.80%
1:30 JPY Job-to-applicant ratio Aug 1.1 1.1 1.1
1:50 JPY Large retailers' sales y/y Aug 0.30% -0.60%
1:50 JPY Retail trade m/m|y/y Aug 0.70%|0.30% -0.50%|0.60%
1:50 JPY Industrial production, preliminary m/m|y/y Aug 0.10% 0.20%|-1.10% 0.40%|-0.70%
3:30 JPY Labor cash earnings y/y Aug 1.00% 2.40%
3:45 CNY HSBC manf. PMI, final Index Sep 50.5 50.5
7:00 JPY Small business confidence Index Sep 47.7
7:00 JPY Housing starts y/y Aug -13.70% -14.10%
8:00 GBP Nationwide House Prices m/m|y/y Sep 0.50%|10.40% 0.80%|11.00%
8:45 FRF Household consumption m/m|y/y Aug ...|...
9:00 DKK GDP, quarterly figure (ESA 2010 main revision) q/q|y/y 2nd quarter -0.30%|-0.10%
9:00 DKK Gross unemployment s.a. K (%) Aug 134.0 (5.1%) 134.5 (5.1%)
9:30 SEK Wages (blue collars/white collars) y/y Jul 2.20%
9:55 DEM Unemployment % Sep 6.70% 6.70% 6.70%
10:00 NOK Retail sales, s.a. m/m Aug 1.00% 0.80% -1.50%
10:00 NOK Credit indicator (C2) y/y Aug 5.40% 5.40%
10:30 GBP GDP, final q/q|y/y 2nd quarter 0.80%|3.20% 0.80%|3.20%
11:00 ITL HICP, preliminary m/m|y/y Sep -0.20%|-0.20%
11:00 EUR Unemployment % Aug 11.50% 11.50% 11.50%
11:00 EUR CPI - core, preliminary % Sep 0.90% 0.90% 0.90%
11:00 EUR CPI, preliminary y/y Sep 0.3% 0.3% 0.4%
14:30 CAD GDP m/m|y/y Jul ...|...
14:30 CAD GDP m/m|y/y Jul 0.20%|... 0.30%|3.10%
15:00 USD S&P Case Shiller House prices Index Jul 172.3
15:45 USD Chicago PMI Index Sep 61.0 64.3
16:00 USD Consumer confidence Index Sep 94.5 92.2 92.4
15 | 26 September 2014 www.danskeresearch.com
Weekly Fo
cus
Weekly Focus
Calendar - continued
Source: Danske Bank Markets
Wednesday, October 1, 2014 Period Danske Bank Consensus Previous
- USD Total Vechicle Sales m Sep 16.9 17.45
1:50 JPY Tankan large manufacturers index (outlook) Index 3rd quarter 10.0|13.0 10.0|12.0 12.0|15.0
1:50 JPY Tankan large non-manufacturers index (outlook) Index 3rd quarter 16.0|18.0 17.0|18.0 19.0|19.0
3:00 CNY Manf.PMI Index Sep 50.8 51.0 51.1
3:30 AUD Retail sales m/m Aug 0.40%
3:35 JPY Markit/JMMA manufacturing PMI, final Index Sep 51.7
8:30 SEK PMI Index Sep 51.8 51.0
9:00 DKK House prices (Statistics Denmark) Jul
9:00 NOK PMI Index Sep 51.0 51.0 51.8
9:15 ESP PMI manufacturing Index Sep 53.0 52.8
9:30 CHF PMI manufacturing Index Sep 52.9
9:45 ITL PMI manufacturing Index Sep 49.2 49.5 49.8
9:50 FRF PMI manufacturing, final Index Sep 48.8 48.8
9:55 DEM PMI manufacturing, final Index Sep 50.3
10:00 EUR PMI manufacturing, final Index Sep 50.5 50.5
13:00 USD MBA Mortgage Applications %
14:15 USD ADP employment 1000 Sep 200 204
15:45 USD Markit manufacturing PMI, final Index Sep 57.9
16:00 USD Construction spending m/m Aug 0.40% 1.80%
16:00 USD ISM manufacturing Index Sep 58.5 58.0 59.0
16:00 USD ISM prices paid Index Sep 57.0 58.0
Thursday, October 2, 2014 Period Danske Bank Consensus Previous
1:50 JPY Monetary base y/y Sep 40.50%
3:30 AUD Trade balance AUD m Aug -1359M
10:30 GBP PMI manufacturing Index Sep 52.5 52.5
10:30 GBP PMI construction Index Sep 63.4 64.0
11:00 EUR PPI m/m|y/y Aug -0.10%|-1.10% -1.10%|-0.10%
12:00 EUR ECB announces 3-year LTRO repayment
13:45 EUR ECB announces refi rate % 0.05% 0.05% 0.05%
13:45 EUR ECB announces deposit rate % -0.20% -0.20% -0.20%
14:30 EUR ECB's Draghi holds press conference
14:30 USD Initial jobless claims 1000 293
16:00 DKK Currency reserves DKK bn Sep 441.6
16:00 USD Factory orders m/m Aug -9.80% 10.50%
14:45 GBP BoE governor Carney speaks
19:20 USD Fed's Lockhart (neutral, non-voter) speaks
Friday, October 3, 2014 Period Danske Bank Consensus Previous
3:00 CNY Non-manf. PMI Index Sep 54.4
3:35 JPY Markit service PMI Index Sep 49.9
8:30 SEK PMI services Index Sep 54.2
9:15 ESP PMI Services Index Sep 57.9 58.1
9:30 SEK Industrial production s.a. m/m|y/y Aug 1.30%|-1.20% -1.10%|-5.70%
9:30 SEK Service production m/m|y/y Aug -0.70%|2.00%
9:30 SEK Industrial orders m/m|y/y Aug -1.00%|-4.40%
9:45 ITL PMI Services Index Sep 49.2 49.8
9:50 FRF PMI Services, final Index Sep 49.4 49.4
9:55 DEM PMI service, final Index Sep 55.4
10:00 NOK Unemployment % Sep 2.80% 2.70% 2.90%
10:00 EUR PMI composite, final Index Sep 52.3
10:00 EUR PMI services, final Index Sep 52.8
10:30 GBP PMI services Index Sep 59.0 60.5
11:00 EUR Retail sales m/m|y/y Aug … |1.0% -0.40%|0.80%
14:30 USD Average weekly hours Hours Sep 34.5 34.5
14:30 USD Unemployment % Sep 6.10% 6.10% 6.10%
14:30 USD Average hourly earnings, non-farm m/m|y/y Sep 0.20%|... 0.20%|2.10%
14:30 USD Private payrolls 1000 Sep 242 195 134
14:30 USD Manufacturing payrolls 1000 Sep 25 12 0
14:30 USD Non farm payrolls 1000 Sep 250 211 142
14:30 USD Trade balance USD bn Aug -40.6 -40.5
16:00 USD ISM non-manufacturing Index Sep 59.0 58.5 59.6
The editors do not guarantee the accurateness of figures, hours or dates stated above
For furher information, call (+45 ) 45 12 85 22.

16 | 26 September 2014 www.danskeresearch.com
Weekly Fo
cus
Weekly Focus
Disclosures This research report has been prepared by Danske Bank Markets, a division of Danske Bank A/S (‘Danske
Bank’). The authors of the research report are Allan von Mehren, Chief Analyst and Steen Bocian, Chief
Economist.
Analyst certification
Each research analyst responsible for the content of this research report certifies that the views expressed in the
research report accurately reflect the research analyst’s personal view about the financial instruments and issuers
covered by the research report. Each responsible research analyst further certifies that no part of the compensation
of the research analyst was, is or will be, directly or indirectly, related to the specific recommendations expressed
in the research report.
Regulation
Danske Bank is authorised and subject to regulation by the Danish Financial Supervisory Authority and is subject
to the rules and regulation of the relevant regulators in all other jurisdictions where it conducts business. Danske
Bank is subject to limited regulation by the Financial Conduct Authority and the Prudential Regulation Authority
(UK). Details on the extent of the regulation by the Financial Conduct Authority and the Prudential Regulation
Authority are available from Danske Bank on request.
The research reports of Danske Bank are prepared in accordance with the Danish Society of Financial Analysts’
rules of ethics and the recommendations of the Danish Securities Dealers Association.
Conflicts of interest
Danske Bank has established procedures to prevent conflicts of interest and to ensure the provision of high-
quality research based on research objectivity and independence. These procedures are documented in Danske
Bank’s research policies. Employees within Danske Bank’s Research Departments have been instructed that any
request that might impair the objectivity and independence of research shall be referred to Research Management
and the Compliance Department. Danske Bank’s Research Departments are organised independently from and do
not report to other business areas within Danske Bank.
Research analysts are remunerated in part based on the overall profitability of Danske Bank, which includes
investment banking revenues, but do not receive bonuses or other remuneration linked to specific corporate
finance or debt capital transactions.
Financial models and/or methodology used in this research report
Calculations and presentations in this research report are based on standard econometric tools and methodology
as well as publicly available statistics for each individual security, issuer and/or country. Documentation can be
obtained from the authors on request.
Risk warning
Major risks connected with recommendations or opinions in this research report, including a sensitivity analysis
of relevant assumptions, are stated throughout the text.
Date of first publication
See the front page of this research report for the date of first publication.
General disclaimer This research has been prepared by Danske Bank Markets (a division of Danske Bank A/S). It is provided for
informational purposes only. It does not constitute or form part of, and shall under no circumstances be
considered as, an offer to sell or a solicitation of an offer to purchase or sell any relevant financial instruments
(i.e. financial instruments mentioned herein or other financial instruments of any issuer mentioned herein and/or
options, warrants, rights or other interests with respect to any such financial instruments) (‘Relevant Financial
Instruments’).
The research report has been prepared independently and solely on the basis of publicly available information that
Danske Bank considers to be reliable. While reasonable care has been taken to ensure that its contents are not
untrue or misleading, no representation is made as to its accuracy or completeness and Danske Bank, its affiliates
and subsidiaries accept no liability whatsoever for any direct or consequential loss, including without limitation
any loss of profits, arising from reliance on this research report.
The opinions expressed herein are the opinions of the research analysts responsible for the research report and
reflect their judgement as of the date hereof. These opinions are subject to change, and Danske Bank does not
17 | 26 September 2014 www.danskeresearch.com
Weekly Fo
cus
Weekly Focus
undertake to notify any recipient of this research report of any such change nor of any other changes related to the
information provided in this research report.
This research report is not intended for retail customers in the United Kingdom or the United States.
This research report is protected by copyright and is intended solely for the designated addressee. It may not be
reproduced or distributed, in whole or in part, by any recipient for any purpose without Danske Bank’s prior
written consent.
Disclaimer related to distribution in the United States This research report is distributed in the United States by Danske Markets Inc., a U.S. registered broker-dealer
and subsidiary of Danske Bank, pursuant to SEC Rule 15a-6 and related interpretations issued by the U.S.
Securities and Exchange Commission. The research report is intended for distribution in the United States solely
to ‘U.S. institutional investors’ as defined in SEC Rule 15a-6. Danske Markets Inc. accepts responsibility for this
research report in connection with distribution in the United States solely to ‘U.S. institutional investors’.
Danske Bank is not subject to U.S. rules with regard to the preparation of research reports and the independence
of research analysts. In addition, the research analysts of Danske Bank who have prepared this research report are
not registered or qualified as research analysts with the NYSE or FINRA but satisfy the applicable requirements
of a non-U.S. jurisdiction.
Any U.S. investor recipient of this research report who wishes to purchase or sell any Relevant Financial
Instrument may do so only by contacting Danske Markets Inc. directly and should be aware that investing in non-
U.S. financial instruments may entail certain risks. Financial instruments of non-U.S. issuers may not be
registered with the U.S. Securities and Exchange Commission and may not be subject to the reporting and
auditing standards of the U.S. Securities and Exchange Commission.