investing in systems to improve the health of populations · medical university, taipei, taiwan...
TRANSCRIPT
Investing in systems to improve the
health of populations
Sandro Galea

Investments in the SDG framework
should be in strengthening health
systems and not focused on disease
specific approaches to health

Three reasons

1. Ownership, intent, of SDGs
2. Epidemiology and temporal trends
3. Sustainability

1. Ownership, intent, of SDGs
2. Epidemiology and temporal trends
3. Sustainability

SDGs must be…universally applicable to all countries while taking into account different national realities, capacities and levels of development and respecting national policies and priorities
“
” https://sustainabledevelopment.un.org/topics/sustainabledevelopmentgoals
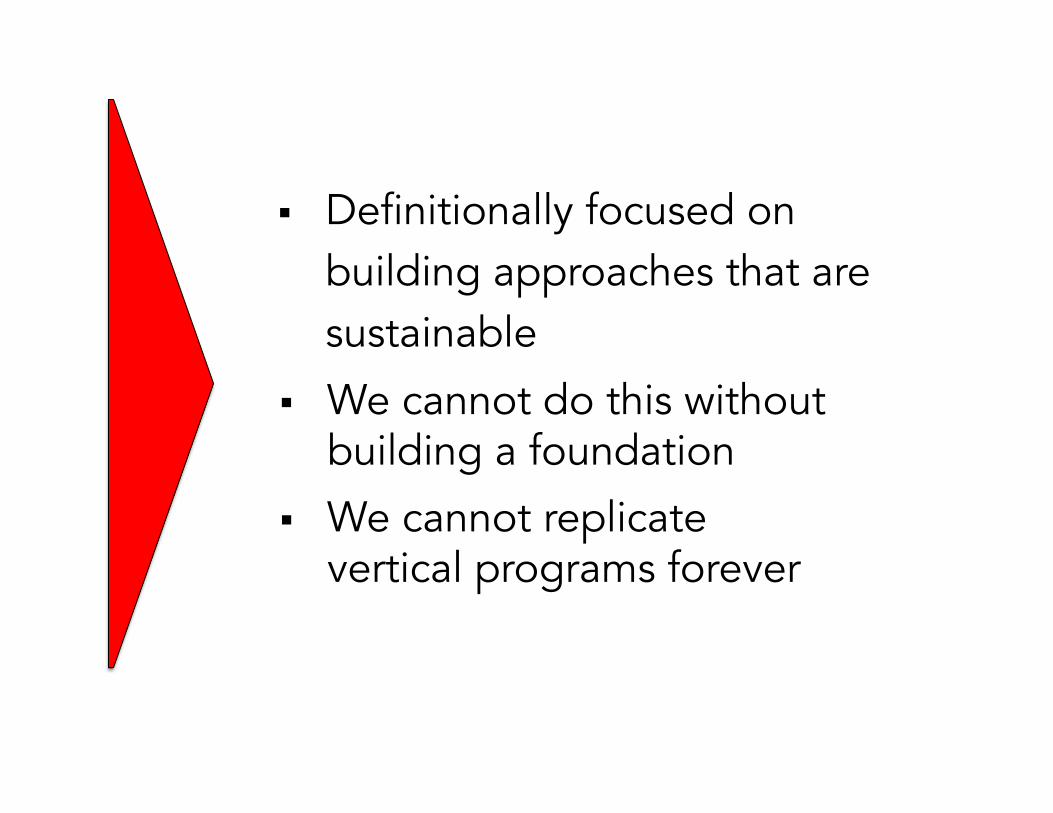
§ Definitionally focused on building approaches that are sustainable § We cannot do this without building a foundation § We cannot replicate vertical programs forever

1. Ownership, intent, of SDGs
2. Epidemiology and temporal trends
3. Sustainability


Progress, or not, in the MDGs Articles
960 www.thelancet.com Vol 384 September 13, 2014
Center for Translation Research and Implementation Science
(CTRIS), National Heart, Lung, and Blood Institute
(G A Mensah MD), National Cancer Institute
(Prof Q Lan PhD), National Institutes of Health, Bethesda,
MD, USA (X Che PhD); University of Cambridge,
Cambridge, United Kingdom (R Chowdhury MD); Cyprus University of Technology,
Limassol, Cyprus (C A Christophi PhD); Taipei Medical University, Taipei,
Taiwan (Prof T-W Chuang PhD); University of Salerno,
Baronissi, SA, Italy (Prof M Cirillo MD); National
School of Public Health (ENSP/Fiocruz), Rio De Janeiro, Brazil (I da Costa Leite PhD); Hospital Dr. Gustavo N. Collado, Chitre,
Herrera, Panama (K J Courville MD); Public Health
Foundation of India, New Delhi, India (Prof L Dandona,
R Dandona PhD, G A Kumar PhD, R B Kumar MD); Public Health
England, London, United Kingdom (Prof A Davis PhD,
J C Schmidt MSc); Addis Ababa University, Addis Ababa, Ethiopia (K Deribe MPH);
University of Peradeniya, Peradeniya, Sri Lanka
(S D Dharmaratne MD); Harvard School of Public Health,
Harvard University, Boston, MA, USA (E L Ding ScD, Prof J A Salomon PhD); University of Western
Australia, Perth, WA, Australia (Prof K M Edmond PhD); The
Institute of Social and Economic Studies of
Population at the Russian Academy of Sciences, Moscow,
Russia (Prof S P Ermakov DSc); Non-Communicable Diseases
Research Center, Endocrine and Metabolic Research Institute,
decomposition is a method with a game theory foundation that allows for decomposition of changes in a variable because of diff erent contributory factors. Specifi cally, to assess the eff ect of these six factors on changes in under-5 deaths from 1990 to 2013, we constructed 64 scenarios in which all six factors took on values from either 1990 or 2013 in each specifi c scenario.
To compute the eff ect of any one factor, we assessed 32 pairs of scenarios in which all fi ve remaining factors had the same values. For each pair, we then calculated the change in under-5 deaths, for which only the factor of interest changed value, and used this as a measure of the contribution of this specifi c factor to the change in under-5 deaths. The average of the changes in all 32 pairs of scenarios was the contribution of one factor. We repeated the same process for all six factors.
We used the above equation to predict annualised rates of change for each country from 2000 to 2013 with recorded changes in income per person and maternal education and counterfactual levels of HIV in the absence of inter vention. We generated counterfactual
HIV death rates with the improved EPP-Spectrum models for GBD 201339,40 by setting prevention of mother-to-child transmission, co-trimoxazole prophylaxis, and antiretroviral therapy (ART) to zero for all years. These predicted rates provided an estimate of the eff ect of changes in income per person, education, and the long-term secular trend by GBD super-region on the basis of a comparison with observed rates of change.
Scenarios for under-5 mortality in 2030We developed four scenarios to predict the under-5 mortality rate in 2030 on the basis of the distribution of observed annualised rates of change from 2000 to 2013. Scenario one used the observed rate of change from 2000 to 2013 for each country to project to 2030. We assumed child mortality rates in any country with an increase in mortality in this time stayed at a constant level during the projection period. In scenario two, we applied the best 75th percentile rate of change in all countries from 2000 to 2013. In scenario three, all countries had a rate of change corresponding to the best 90th percentile, and in scenario four, to the best 95th percentile rate of change. We used observed rates of change for all-cause mortality by detailed age groups (early neonatal, late neonatal, postneonatal, and childhood deaths at age 1–4 years) to generate scenarios for the age composition of under-5 deaths. Our predictions of the number of deaths were based on these predicted rates and UN Population Division fertility forecasts.46 We then rescaled predicted age-specifi c and sex-specifi c mortality to match the predicted all-cause under-5 mortality rate in 2030. For analyses, we used Stata (version 13.1), R (versions 2.15.2, 3.0.1, and 3.0.2), and Python (version 2.7.3).
Role of the funding sourceThe funders of the study had no role in study design, data collection, data analysis, data interpretation, or
1970 1980 1990 2000 2013
Early neonatal(0–6 days)
31·4(30·0–32·8)
26·7(25·7–27·7)
22·6(21·8–23·3)
19·8(19·2–20·4)
14·0(13·5–14·6)
Late neonatal(7–28 days)
16·8(16·3–17·4)
12·8(12·6–13·1)
9·3(9·1–9·5)
7·2(7·1–7·4)
4·4(4·1–4·6)
Postneonatal(29–364 days)
48·1(45·1–51·4)
36·5(34·9–38·2)
27·6(26·4–28·8)
22·2(21·3–23·0)
13·2(12·4–14·1)
Child(1–4 years)
54·1(49·8–58·7)
38·7(36·2–41·3)
27·9(26·1–29·6)
22·1(20·9–23·3)
13·1(12·0–14·3)
Under 5(0–4 years)
142·6(138·5–146·9)
110·0(108·1–111·7)
84·6(83·3–85·9)
69·4(68·5–70·4)
44·0(41·9–46·3)
Table 1: Global mortality rate (deaths per 1000 livebirths) for early neonatal, late neonatal, postneonatal, child, and under-5 age groups for 1970, 1980, 1990, 2000, and 2013
1970 1975 1980 1985 1990 1995 2000 2005 2010 20130
20
40
60
80
100
120
140
Glob
al u
nder
-5 m
orta
lity r
ate (
deat
hs p
er 1
000
liveb
irths
)
Year
A
1970 1975 1980 1985 1990 1995 2000 2005 2010 2013–4·0
–2·0
–3·5
–3·0
–2·5
–1·5
Annu
alise
d ra
te o
f cha
nge (
%)
Year
B
Figure 2: Global under-5 mortality rate and rate of change, 1970–2013(A) Global under-5 mortality, 1970–2013. (B) Annualised rate of change in global child mortality, 1970–2013.
Articles
984 www.thelancet.com Vol 384 September 13, 2014
cause-specifi c death rate are necessary to sum to all-cause mortality using the CoDCorrect algorithm.16 To ensure they do sum to all-cause mortality, at the level of each draw from the posterior distribution of each cause of death for a specifi c country, year, and age group, the sum of all causes was rescaled to equal a draw taken from the uncertainty distribution of all-cause mortality for that country, year, and age group.
Causes of maternal deathWe disaggregated maternal deaths into nine causes: maternal haemorrhage, maternal sepsis and other pregnancy-related infections, hypertensive disorders of pregnancy, obstructed labour, abortion, other direct maternal disorders, indirect maternal disorders, HIV, and late maternal deaths. To estimate the diff erent causes of maternal death, we completed a systematic review (appendix) to identify data to inform which proportion of total maternal deaths is due to each cause. Additionally, we incorporated all vital registration and
sample registration data that provided ICD-coded detail for maternal causes (appendix). We identifi ed 61 studies and, after processing, included 943 site-years of vital registration, sample registration, and maternal mortality surveillance data.
We modelled the proportion of maternal deaths for all causes except HIV using DisMod-MR (version 2.0), which is a Bayesian meta-regression tool developed for the GBD (appendix). This version of DisMod-MR allows for two types of fi xed eff ects (study attributes and country covariates) and includes nested random eff ects for super-region, region, and country. A key advantage of DisMod-MR is that it can handle data reported for any age interval. Predictions from DisMod-MR for each group divided by country, year, and age are based on the country covariates, reference values of the study level covariates, and hierarchical random eff ects. Point estimates with uncertainty were produced for six discrete points: 1990, 1995, 2000, 2005, 2010, and 2013. Each cause was modelled independently. Predicted cause fractions for each group were rescaled to equal 100% of the deaths not related to HIV. The rescaled cause fractions were then multiplied by the number of maternal deaths in each group (divided by country, year, and age) to obtain the number of deaths for each maternal cause, a sum to which the HIV deaths were added. The fi nal result includes cause fraction and number of maternal deaths due to each cause, country, age group, and year.
Timing of maternal deathsAn important issue for planning of interventions is an understanding of the timing of maternal deaths with respect to labour and delivery.47 We completed a systematic review to identify studies of the timing of maternal deaths (appendix). We identifi ed 142 studies and used vital registration, sample registration, and surveillance data for late maternal death. Many studies combined the fi rst 24 h postpartum (immediate or early postpartum) with the intrapartum period, because events of the immediate postpartum period are clinically related to events occurring during labour and delivery. Therefore, we also combined intrapartum and immediate postpartum periods. We followed this format to construct a dataset that included four diff erent time windows: deaths occurring antepartum (before onset of labour), deaths occurring intrapartum or during the immediate postpartum period (up to 24 h after delivery), deaths occurring during the subacute and delayed postpartum periods (24 h to 42 days after delivery),47 and late maternal deaths (43 days to 1 year after delivery). We modelled the proportion of maternal deaths in each of the four periods with DisMod-MR (version 2.0). The predicted proportions were scaled to 100% for each group.
2030 scenario and rate-of-change calculationsWe developed a straightforward forecast scenario for the MMR for every country in 2030 by using the estimated
Figure 3: Global maternal deaths (A) and annualised rate of change in maternal mortality ratio (B), 1990–2013Shaded areas show 95% uncertainty intervals.
0
50 000
100 000
150 000
200 000
250 000
300 000
350 000
400 000
Num
ber o
f mat
erna
l dea
ths
A
1990 1992 1994 1996 1998 2000 2002 2004 2006 2008 2010 2012
–6
–4
–2
0
2
4
Ann
ual r
ate
of c
hang
e (%
)
Year
B
Directorate of Health Research (B Bora Basara PhD, U Dilmen MD,
G K Yentur PhD); Ministry of Health, Ankara, Turkey
(S B Uzun MD); World Bank, Washington, DC, USA
(D Bose PhD); University of Arizona, Tucson, AZ, USA
(Prof N Breitborde PhD); Universidad Autonoma
Metropolitana, Mexico City, Mexico (R Cárdenas ScD);
Colombian National Health Observatory, Instituto Nacional
de Salud, Bogota, Colombia (C A Castañeda-Orjuela MSc); Universidad Diego Portales,
Santiago, Chile (R E Castro PhD); College of Public Health
(H-H Lin ScD), National Taiwan University, Taipei, Taiwan
(Prof J-C Chang PhD); National Institutes of Health, Department
of Health and Human Services,
Kassebaum, N. J., et al. (2014). "Global, regional, and national levels and causes of maternal mortality during 1990-2013: a systematic analysis for the Global Burden of Disease Study 2013." Lancet 384(9947): 980-1004.

Progress for some, stagnation for others
Articles
994 www.thelancet.com Vol 384 September 13, 2014
Endocrinology and Metabolism Research Centre
(Prof A Esteghamati MD, N Hafezi-Nejad MD,
S Sheikhbahaei MD), Digestive Diseases Research Institute
(S G Sepanlou MD), MS Research Centre (M A Sahraian MD), Sina Trauma and Surgery
Research Centre (Prof V Rahimi-Movaghar MD), Tehran University of Medical
Sciences, Tehran, Iran; Departamento de Saúde Pública,
ARS Norte IP, Porto, Portugal (M M Felicio MD, C M Teixeira MD);
Department of Medical Epidemiology and Biostatistics
(E Weiderpass PhD), Karolinska Institutet, Stockholm, Sweden
(S-M Fereshtehnejad MD, R Havmoeller MD); Northern
Region Health Administration (V M P Machado MSc), Public
Health Department, Unidade Local de Saúde de Matosinhos,
Porto, Portugal (G M Ferreira de Lima BSC);
Federal University of Minas Gerais, Belo Horizonte, Brazil
(E B Franca PhD); National Centre for Disease Control and Public
Health of Georgia, Tbilisi, Georgia (K Gambashidze MS,
K Kazanjan MS, M Kereselidze MD, M Shakh-Nazarova MS, L Sturua PhD); Clinique
Coopérative de Parakou, Parakou, Borgou, Benin
(F G Gankpé MD); Public Health Unit of Primary Health Care
Group of Almada-Seixal, Almada, Setúbal, Portugal
(A C Garcia MPH); Division of Human Nutrition, Wageningen
University, Wageningen, Netherlands (J M Geleijnse PhD); Monash University, Melbourne, VIC, Australia (K B Gibney MBBS,
B K Lloyd PhD); University Hospital of Dijon, Dijon, France
(Prof M Giroud MD); Heller School for Social Policy and
Management (E L Glaser MA), Brandeis University, Waltham,
MA, USA (B T Idrisov MD, E A Undurraga PhD); Ministry of
Labour, Health and Social Aff airs, Tbilisi, Georgia
(K Goginashvili MPH); University of Massachusetts Medical
School, Worcester, MA, USA (Prof P Gona PhD); National
Institute of Public Health, Cuernavaca, Mexico
(D González-Castell MSc, I B Heredia Pi PhD,
F Mejia-Rodriguez MSc, J C Montañez Hernandez MSc,
T G Sánchez Pimienta MSc, E E Servan-Mori MSc,
Cause patterns vary by regions. The two most important causes of maternal death in high-income regions in 2013 were indirect and other direct causes (fi gure 6B), owing largely to a decrease in abortion-related deaths, which was the most important cause of maternal mortality in high-income regions in 1990. The number of deaths due to haemorrhage, hypertension, and maternal sepsis have also decreased signifi cantly, whereas the numbers of deaths due to indirect and late maternal causes have increased since 1990 (fi gure 6B, appendix). By contrast, the most important causes in low-income countries—other direct, abortion, and haemorrhage—have not changed between 1990 and 2013, although diff erent trends are apparent in diff erent
regions. For example, east Asia had signifi cant decreases in all causes except HIV (which was estimated to be the cause of 0·003% of all maternal deaths in 2013; appendix). The total global number of HIV-related maternal deaths in 2013 was 2070 (95% UI 1290–2866), reduced from a peak of 3280 (2041–4403) in 2004. The increase in proportion of deaths due to indirect maternal causes was most notable in Latin America and the Caribbean, where the proportion increased from 9·2% (95% UI 8·8–9·8) in 1990, to 11·5% (10·9–12·2) in 2013.
In 2013, on average, nearly a quarter of deaths occurred antepartum (24·6%, 24·1–25·2), a quarter intrapartum and immediately postpartum (27·7%, 27·1–28·2), a third
0
100
200
300
400
500
600
MM
R (p
er 10
0 000
liveb
irths
)
A MMR >300 in 1990
0
600
550
500
450
400
350
300
250
200
150
100
50
MM
R (p
er 10
0 000
liveb
irths
)
B MMR 100–300 in 1990
1990 1992 1994 1996 1998 2000 2002 2004 2006 2008 2010 20120
20
40
60
80
100
120
140
MM
R (p
er 10
0 000
liveb
irths
)
Year
C MMR 30–100 in 1990
1990 1992 1994 1996 1998 2000 2002 2004 2006 2008 2010 20120
20
15
10
5
MM
R (p
er 10
0 000
liveb
irths
)
Year
D MMR <30 in 1990
OceaniaEastern sub-Saharan AfricaWestern sub-Saharan AfricaSouth AsiaCentral sub-Saharan Africa
East AsiaCentral Latin AmericaTropical Latin AmericaCentral AsiaEastern EuropeSouthern Latin AmericaCentral Europe
High-income Asia PacificWestern EuropeHigh-income North AmericaAustralasia
Southeast AsiaCaribbeanAndean Latin AmericaSouthern sub-Saharan AfricaNorth Africa and Middle East
Figure 5: Change in MMR between 1990 and 2013, by regionMMR=maternal mortality ratio.
Kassebaum, N. J., et al. (2014). "Global, regional, and national levels and causes of maternal mortality during 1990-2013: a systematic analysis for the Global Burden of Disease Study 2013." Lancet 384(9947): 980-1004.

1. Ownership, intent, of SDGs
2. Epidemiology and temporal trends
3. Sustainability

Vertical programs miss vulnerable groups in long-term
Barros, A. J. D., C. Ronsmans, et al. "Equity in maternal, newborn, and child health interventions in Countdown to 2015: a retrospective review of survey data from 54 countries." The Lancet 379(9822): 1225-1233.

100 million people impoverished by paying for health
30% of people sold assets/borrowed to pay for health
Substantial downstream costs of non-functioning health systems
Xu, K, Evans DB, Carrin G, Aguilar-Rivera AM, Musgrove P, Evans T. Protecting households from catastrophic health spending. Health Aff (Millwood). 2007;26(4):972-83. Kruk ME, Goldmann E, Galea S. Borrowing And Selling To Pay For Health Care In Low- And Middle-Income Countries." Health Affairs 28(4): 1998; 1056- 1066.

And here at home: Causes of bankruptcy
D.U. Himmelstein et al., "Medical Bankruptcy in the United States, 2007: Results of a National Study,” American Journal of Medicine 122, no. 8 (2009).

“ Health systems limitations are the binding
constraint preventing further progress in global health ”

“ A grand convergence is achievable within
our lifetime ”
…assuming coverage levels of at least 90%
Jamison, D. T., L. H. Summers, et al. (2013). "Global health 2035: a world converging within a generation." Lancet 382(9908): 1898-1955.

Investments in the SDG framework
should be in strengthening health
systems and not focused on disease
specific approaches to health
