investing for a low carbon economy - mirova · investing for a low carbon economy # 4 design ......
TRANSCRIPT

MIROVAMirova is a subsidiary of Natixis Asset ManagementLimited liability company - Share capital: € 7,461,327.50Regulated by AMF under n°GP 02-014RCS Paris n°394 648 216Registered Offi ce: 21 quai d’Austerlitz – 75 013 Paris
NATIXIS GLOBAL ASSET MANAGEMENTLimited Company - Share Capital: €156 344 050RCS Paris n°453 952 681Registered Offi ce: 21 quai d’Austerlitz – 75 634 Paris Cedex 13 - France
Visit us: www.mirova.com
Follow us: @Mirova_RI Profi l Mirova
# 4
MIR
OVA’
S IN
SIGH
TS 4
IN
VEST
ING
FOR
A L
OW C
ARBO
N E
CON
OMY
# 4
Desi
gn: a
genc
e Fa
rgo
- 10
/201
5
INVESTING FOR A LOW
CARBON ECONOMY
Special issue COP21

logo FSC
Lim
ited
liabi
lity
com
pany
- Sh
are
capi
tal 7
461
327
,50
- Reg
ulat
ed b
y A
MF
unde
r n°
GP
02- 0
14 -
RC
S Pa
ris n
° 39
4 64
8 21
6 - 2
1 qu
ai d
’Aus
terli
tz -
7563
4 Pa
ris C
edex
13.
Res
pons
ible
inve
stin
g : i
nves
tir re
spon
sabl
e
Short term thinking won’t take you very far.A financial industry out of touch with economic, ecological and social realities has no future. That is why our investment decisions are motivated primarily by the industrial strategies of the companies we back. Our experts perform extensive analyses of sustainable business models that are engines for growth, employment and innovation, shaping the world of tomorrow.
Mirova was voted Best at SRI among Asset Management Firms for 2014 by Thomson Reuters and the UK Sustainable Investment and Finance Association(*).
(*)The 2014 Survey represents the views of over 360 investment professionals from 27 countries, makingit the most extensive assessment of socially responsible investing (SRI) in the European investment community. Voting was conducted from 24th March to 7th May 2014. It reflects a contribution from 179 buy-side firms and 14 brokerage firms/research houses. Visit www.uksif.org for more information.Promotional material. Any reference to a ranking, a rating or an award provides no guarantee of future performance and is not constant over time.
Mirova a subsidiary of Natixis Asset Management specialized in Responsible Investment, offers engaged investment management aiming to combine value creation and sustainable development.Mirova favours a global approach to responsible investment and has a team of around fi fty experts in thematic investment management, fund managers specialising in different business sectors, engineers, fi nancial and extra-fi nancial analysts, experts in project fi nancing and solidarity fi nance. Mirova has also developed a research partnership with the University of Cambridge and actively participates within various international organisations.
Head of publication:Hervé Guez, Head of RI Research
Authors: Basselier, Clotilde, SRI Portfolio ManagerBennani, Zineb, Head of Governance and EngagementCoeslier, Manuel, Carbon Analyst, PhD candidateDufour, Mathilde, Deputy Head of RI ResearchDunand-Chatellet, Léa, Head of EquitiesGuez, Hervé, Head of RI ResearchLauverjat Céline, Investment Director Renewable Energie TeamOstiari, Emmanuelle, SRI AnalystSmia, Ladislas, Deputy Head of RI Research
Additional contributions from:Bonnin, Marguerite, SRI AnalystBriand, Marc, Head of Fixed IncomeFavier, Julien, SRI AnalystFinidori, Esther, Manager, Carbone 4Wigley, Chris, Senior Portogolio Manager, Green Bonds
Translation and editing: Jacqueline Dobie, Susannah Mary Ellis, Elizabeth Lefer, Elsa Perrin, Christopher Treadwell, Shannon Kiernan, Rachel Zerner (Copy Editor)
Design:Agence Fargo, 91 rue Réaumur – 75002 Paris
Printing: Tanghe Printing, Boulevard Industriel, 20, B-7780 CominesPrinted on Cocoon Silk with vegetable-based inks
First issue:May 2013
Visit us: www.mirova.com
Follow us: @Mirova_RI Profi l Mirova

MIROVA’SINSIGHTS
4
SPECIALISSUE COP 21

Lim
ited
liabi
lity
com
pany
- Sh
are
capi
tal 7
461
327
,50
- Reg
ulat
ed b
y A
MF
unde
r n°
GP
02- 0
14 -
RC
S Pa
ris n
° 39
4 64
8 21
6 - 2
1 qu
ai d
’Aus
terli
tz -
7563
4 Pa
ris C
edex
13.
Res
pons
ible
inve
stin
g : i
nves
tir re
spon
sabl
e
There is nothing as solid as the real economy.The days of short-term profitability are behind us. Our goal is to achieve durable value
creation by examining the sustainability of business models, exercising our responsibility
as shareholders and taking concrete engagements.
Mirova was voted Best at SRI among Asset Management Firms for 2014 by Thomson Reuters and the UK Sustainable Investment and Finance Association(*).
(*)The 2014 Survey represents the views of over 360 investment professionals from 27 countries, makingit the most extensive assessment of socially responsible investing (SRI) in the European investment community. Voting was conducted from 24th March to 7th May 2014. It reflects a contribution from 179 buy-side firms and 14 brokerage firms/research houses. Visit www.uksif.org for more information.Promotional material. Any reference to a ranking, a rating or an award provides no guarantee of future performance and is not constant over time.

3
TABLE OF CONTENTS
Lim
ited
liabi
lity
com
pany
- Sh
are
capi
tal 7
461
327
,50
- Reg
ulat
ed b
y A
MF
unde
r n°
GP
02- 0
14 -
RC
S Pa
ris n
° 39
4 64
8 21
6 - 2
1 qu
ai d
’Aus
terli
tz -
7563
4 Pa
ris C
edex
13.
Res
pons
ible
inve
stin
g : i
nves
tir re
spon
sabl
e
There is nothing as solid as the real economy.The days of short-term profitability are behind us. Our goal is to achieve durable value
creation by examining the sustainability of business models, exercising our responsibility
as shareholders and taking concrete engagements.
Mirova was voted Best at SRI among Asset Management Firms for 2014 by Thomson Reuters and the UK Sustainable Investment and Finance Association(*).
(*)The 2014 Survey represents the views of over 360 investment professionals from 27 countries, makingit the most extensive assessment of socially responsible investing (SRI) in the European investment community. Voting was conducted from 24th March to 7th May 2014. It reflects a contribution from 179 buy-side firms and 14 brokerage firms/research houses. Visit www.uksif.org for more information.Promotional material. Any reference to a ranking, a rating or an award provides no guarantee of future performance and is not constant over time.
EDITORIAL ..........................................................................................................................5
UNDERSTAND ....................................................................................................................7What technologies can build a low carbon economy?
TAKE ACTION ...................................................................................................................61What investment strategies will finance a low carbon economy?
LISTED EQUITIESThematic investing for impact ............................................................................................62
FIXED INCOMEGreen Bonds: forging a direct link between projects and financing ..................................76
INFRASTRUCTURERenewable Energy Funds: A 100% low carbon allocation ................................................81
IMPROVE ACCOUNTABILITY .........................................................................................85How can we increase the financial sector’s engagement?
ENGAGE The financial sector’s levers for promoting a low carbon economy ...................................86
MEASUREA Carbon impact methodology in line with a 2 degree scenario .......................................95
Visit us: www.mirova.com
Follow us: @Mirova_RI Mirova profile
It is now possible to invest in and for the climate without foregoing a fair return on capital. “

55
//////// Editorial ////////
www.mirova.com
Understand, take action, and be accountable. If we are to successfully address the challenge to our civilizations posed by climate change, these are imperatives that must be heeded, not only by political decision-makers and regulatory bodies, but companies as well. Obviously, the responsibilities and levers for action relevant for various parties will differ significantly. But few today can claim that these issues are no concern of theirs. The financial industry especially, and more broadly, the many players holding roles in the capital markets, possess considerable leverage for driving change. This conviction is the cornerstone of Mirova’s foundation as a business, as a company.
Today, on the eve of the COP 21, we have dedicated a special issue of our research periodical, Insights, to a comprehensive panorama that describes our understanding of the issues raised by climate change, the investment solutions on the financial markets that we have identified, and, lastly, the tools at our disposal to provide accountability for our actions and measure their impact.
Understanding means more than just being cognizant of the scientific conclusions that the IPCC has done such a tremen-dous job of making available and updating. It also involves being attuned to the murmurs of impending regulation and the technological innovations that are transforming our economic environment at an ever-increasing rate. In Europe, especially Germany, renewable energy is ever more present, and the venerable players that long dominated the market, such as E.ON are being forced to adapt. Across the Atlantic, inno-vations in communication are proliferating. Actors like Tesla are changing the way we thing about mobility and forcing dominant players like Volkswagen out of complacency. No matter where you look, buildings are developing a different relationship with energy; they consume less to do more, and some are even energy producers. The same conclusion is evident at every turn: the climate issue has percolated to a micro-economic level. The first chapter of our publication is dedicated to describing the transformations underway.
Taking action—in this rapidly changing environment, doing something about climate change is no longer merely a ques-tion of altruism or concern for the environment. A world of opportunities is opening up, ready for investments in com-panies and projects that contribute to the energy transition.
By Hervé Guez,Director of RI Research Mirova
Hervé is a Certified International
Investment Analyst and has guided
Mirova’s RI Research since 2008.
The philosophy and methodology he has
developed are currently employed by
12 analysts to guide the integration of
ESG criteria across the whole of Natixis
Asset Management, and as a basis
for investment strategies pursued by
Mirova’s actively managed sustainability-
themed conviction funds.
By Philippe Zaouati, CEO Mirova
Philippe contributes to the development
of responsible finance, in particular
through his role in professional
associations (AFG, EFAMA) and
international initiatives (ICGN, IIRC,
ILG). He is also the author of a book
on responsible investing published in
2009, and Responsible Finance (2014)
co-authored with Hervé Guez.

66
//////// Editorial ////////
Who could ignore the potential of (and the commensurate advantages of holding shares in) companies whose offerings, whether products or services, make it possible to consume less energy or use it better? Who can ignore the rise of green bonds, which give investors on the bond markets an ideal tool for financing the investments of issuers displaying an ever-widening palette of types, scopes, and credit ratings? Who can ignore the advantages ‘green’ infrastructure invest-ment funds present in the context of volatile markets and low interest rates? It is now possible to invest in and for the climate without foregoing a fair return on capital. On the contrary. The second chapter of this issue unpacks the full potential of the financial markets in equities, fixed-income and renewable energy projects.
Improving accountability begins with measuring the car-bon footprint of our investments. But to be meaningful, the yardstick needs to be relevant and reliable. This is what led Mirova to participate in developing the Carbon Impact Analysis method of Carbone 4, a carbon strategy consulting firm founded by world experts in climate economics, Alain Grandjean and Jean-Marc Jancovici. Henceforth, Mirova will be able to measure not only the GHG emissions of its port-folios, but also, and almost more importantly, the emissions avoided by investments in assets that are beneficial from a climate perspective.
It is also crucial that each economic agent, institutional inves-tor and asset management company be accountable for the way it shoulders its responsibilities. This is why Mirova has a policy of active engagement, both within the realm of finance, and through direct dialogue with companies to encourage a better integration of climate issues.
The last chapter of this Insights focuses on the guiding prin-ciples that direct how we measure the impact of our invest-ments, and how we imagine our role as responsible investors.
The transition to a low carbon economy is no longer a utopian vision: the technologies required have graduated from the laboratory, and many are being deployed on an industrial scale. Their arrival presents a multitude of investment opportunities for those who are able to seize them, meaning those ready to fulfil the true role of investors by allocating their capital to the projects and companies which create economic, envi-ronmental and social value. Naturally, investment decisions are subject to market constraints and the unique position of each investor. Imposing norms as to sectoral allocation is out of the question, however, it is incumbent on each and every investor to use what leverage they have in their sphere of activity. And, perhaps we could go so far as to think outside the box… Thus allocated, capital flows will further accelerate innovation and spur the investments needed for our model of economic development to successfully confront the chal-lenges of climate change we are facing.
Enjoy!
“ The allocation of capital to
financing low-carbon investments will create a virtuous
circle that encourages innovation.

7
UNDERSTANDWhat technologies can build a low carbon economy?
////
////
Und
erst
and
////
////
A thorough understanding of the developments taking place in the world around us, whether these be technological, political, regulatory or economic, is essential for identifying levers strong enough to power the rise of a sustainable economy as we define this concept at Mirova, the subsidiary of Natixis Asset Manage-ment dedicated to Responsible Investment. Sketching just such a comprehensive map of the current situation is the purpose of this study, conducted by Mirova’s team of Responsible Invest-ment Research analysts. Its five chapters cover the main issues and challenges of the technological transformations underway to enable the transition to a low carbon economy.
The energy transition in questions .......................................................................... 9Detailed table of contents ....................................................................................... 17What are the low carbon scenarios? .................................................................... 18Energy .......................................................................................................................... 25Mobility ....................................................................................................................... 31Buildings ..................................................................................................................... 44Industry ....................................................................................................................... 51Conclusion .................................................................................................................. 57List of figures .............................................................................................................. 57Bibliography ............................................................................................................... 58

8
////
////
Und
erst
and
////
////
UNDERSTANDWHAT TECHNOLOGIES CAN BUILD A LOW CARBON ECONOMY?
The transition towards a low carbon economy is now in motion.
A growing awareness of the issue of climate change is today generating profound changes in the principal areas of consumption. Europe has had a pioneering role through support pro-grammes for renewable energies as early as the first decade of this century, increasingly strict norms for vehicle emissions and more and more ambitious thermal regulations. Today, the United States and China – long reticent with respect to these subjects – have significantly altered their discourse. While such changes will have to be confirmed in the years to come, a real dynamic of reinforcement of climate commitments is al-ready apparent.
These developments entail substantial changes for companies. Innovations in solar and wind power, energy storage, electric vehicles and LEDs are favouring the emergence of increas-ingly competitive economic models as compared to traditional solutions. Beyond these transfor-
mational technologies, many companies are to-day proposing solutions for improving existing technologies, such as lightweighting vehicles, more efficient motors in the mobility and indus-trial sectors, and condensing boilers in buildings. Finally, mature solutions such as insulation, rail and maritime transport, or hydroelectricity still present significant potential for development in order to limit emissions.
The transition to a low carbon economy is no longer a utopian fantasy: the necessary tech-nologies have left the laboratory and, in many cases, entered the industrial phase. They offer numerous investment opportunities for those who know how to seize them, that is, those who have not chosen not to choose, those who intend to fully embrace their role as investors by allocating their capital to projects and companies that create economic, environmental and social value. Such capital flows will further accelerate the innovation and investments necessary for our model of development to rise to the climate challenge it faces.
INTRODUCTION
Ladislas Smia Deputy Head of RI ResearchEmmanuelle OstiariSRI Analyst
Contributors: Julien Favier, Marguerite Bonnin

9
//////// Understand ////////
Low carbon scenarios
Why should investors concern themselves with the energy transition?
In order to avoid the most catastrophic consequences of global warming, the international community has set itself the objective of limiting the rise in global temperatures to 2°C. To reach this goal, global greenhouse gas (GHG) emissions must be capped, by 2020, then sharply reduced. Such a scenario entails profound transformations in the economy, notably in sectors tied to energy, which represent ¾ of global emissions: energy production, transportation, building and industry.
Investors play a key role in steering the flow of capital toward different sectors. Such a central position in the economy entails a responsibility for action in response to these challenges. But beyond merely ethical considerations, these issues are a source of new opportunities and new risks for issuers and as such must be integrated in investment decisions.
Greenhouse gas emissions by sector 2010 - 49 Gt CO2 eq
Source: Mirova based on (IPCC, 2014).
Energy1%
Industry
Energy(excludingelectricityand heat)
10%
21%
Transport14%
Building6%
Transport0.3%
Building12%
Agriculture &Deforestation
1%
Industry11%
Electricity andHeat25%
Agriculture &Deforestation
24%
2,253.4
Aren’t renewable energies already sufficiently developed to tackle these issues?
Despite the significant development of alternative energy sources, fossil energy still represents ~80% of the global energy mix. This figure has scarcely evolved over the past 25 years. What is more, with the exception of the two oil crises and the financial crisis of 2009, energy consumption has never ceased its increase over the course of the past 50 years. As of the first decade of this century, the rise of China, driven heavily by coal, reinforced this tendency.
Among renewable energy sources, hydraulic energy and traditional biomass make up the majority, while wind and solar power together only represent 2% of energy consumption.
Evolution of energy consumption World, 1965 - 2014
Source: Mirova based on (BP, 2015).
Oil
Coal
Gas
RenewablesNuclear
4 000
3 000
2 000
1 000
01965 1975 1985 1995 2005 2015
First oil crisis
Second oil crisis Rise of China
subprime crisisfall of the USSR
Mto
e
What are the factors that account for the increase in GHG emissions?
GHG emissions may be seen as the product of population, energy consumption per capita and the carbon intensity of energy.
GHG emissions (energy)=
PopulationX
Energy consumption per capitaX
Carbon intensity of energy
As concerns the global population, the UN projects an increase from 7.4 billion people currently to 9.7 billion by 2050. These anticipated demographic developments necessitate more forceful action in the other areas:
➜ For a scenario compatible with economic growth, decreasing per capita energy consumption entails improved energy efficiency.
➜ Lowering the carbon intensity of energy requires the development of low carbon energy as well as a decreased reliance on fossil fuels.
What efforts should be made in terms of energy efficiency?
The efforts necessary differ widely by region of the world. OECD countries, which consume the most energy, will have to reduce their consumption by 30% within 25 years. It is therefore a positive sign that a real downward trend has been emerging in this zone over the past ten years, suggesting that efforts made to launch the energy transition are beginning to bear fruit.
THE ENERGY TRANSITION IN QUESTIONS

10
//////// Understand ////////
China should be able to stabilize its energy consumption after the sharp increase during the first decade of this century. Here as well there are several encouraging signs. Indeed, over the past few years, China has on a number of occasions asserted its desire to steer its economy toward a model that is more compatible with environmental concerns. The effects of the first changes in Chinese energy consumption are beginning to be felt today.
The main challenge for developing countries will be to succeed in improving their standard of living in the context of a sharp demographic increase and reinforced constraints in terms of energy consumption.
Primary energy consumption per capita
Source: Mirova based on (BP, 2015; World Bank, 2014; IEA, 2015).
19600
1
2
3
4
5
6
1970 1980 1990 2000 2010 2020 2030 2040
FormerSoviet UnionOECDChinaWorldRoW
First oil crisis
Second oil crisis Rise of China
2°C scenario
Subprime crisisFall of the USSRto
e pe
r cap
ita
Can’t we just wait for the much-heralded ‘end of oil’?
Limiting the rise in global temperatures to 2°C entails limiting future emissions of GHG into the atmosphere to below 1,000 Gt CO2. Proven fossil energy reserves contain three times this amount. What is more, current assessments of ultimately recoverable resources point to even more significant reserves. This issue of carbon assets that cannot be burned, also called ‘stranded assets’, calls into question the models of valuation of companies involved in fossil energies, notably oil and coal, the emissions of which are the most substantial.
Fossil fuel reserves and carbon constraints
Coal41 970
2470
2° CarbonBudget
1927 712 429 980 56550% chance80% chance
GtCO
2
678
Oil Gas
Proven reservesRecoverable reserves
Source: Mirova based on (IEA 2013, 2014).
Is the regulatory context robust enough to handle these challenges?
Today, the main emitting countries (the United States, the European Union, China, etc.) have all committed to reduction targets. These commitments are taking the form of more specific regulation concerning the development of renewables and the energy consumption of vehicles, buildings and industry. While this general orientation is not
yet sufficient to limit the rise in temperatures to 2°C, the trend is toward the strengthening of regulations, notably in emerging countries and the United States, which has been resistant on this issue. Beyond companies directly involved in energy, such legislative changes linked to climate extend to all spheres of the economy, and particularly to financial players.
Is the transition underway? What are the consequences for companies?
Our current energy model is founded on decades of investment in fossil energy. The weight of this heritage naturally implies significant inertia on every level. Nevertheless, the broader picture offers several encouraging signs. Driven by regulatory developments, companies need to evolve.
➜ The energy spectrum has been radically transformed, in particular with the decreasing costs of solar and wind energy, which have forced the major electricity companies to revise their models.
➜ The transportation sector is witnessing the emergence of disruptive solutions with electric and hybrid vehicles and significant improvements in energy efficiency.
➜ The building industry, where inertia is likely the strongest due to its decentralization, is also facing a cultural change, with greater and greater expectations in terms of insulation, smart monitoring of consumption and alternative heating (heat pumps) and lighting (LED) solutions.
➜ Finally, the major industrial players are pursuing a strategy of developing eco-efficient solutions in line with the cost-reduction expectations of the sector.
Moving to reduce the carbon intensity of energy?
What energy sources can rise to the climate challenge?
Reducing the carbon intensity of energy involves the development of low carbon energy. However, not all energy sources have the same potential.
As concerns renewable energy, wind and solar power offer the greatest possibilities for growth. In a 2°C scenario, the average annual growth of solar and wind electricity generation should be approximately 10%/year, while the share of coal should decrease by 2%/year. Hydropower also presents significant potential, essentially in developing countries.
Projection for the electricity mix in a 2°C scenario
Oil Coal
Wind
Solar
Other RE
Nuclear
Hydro
Gas
Biomass
40 000
30 000
20 000
10 000
01990 2012 2020 2030 2040
Projection 2°C scenario
TWh
Source: Mirova based on (IEA 2015).

11
//////// Understand ////////
Why might solar and wind power see such growth?
Various forms of regulatory support across most regions of the globe have allowed for the emergence of an industry that is now in a position to propose increasingly competitive technology compared with traditional production methods. By way of illustration, the cost of solar power has dropped by more than 75% over ten years. This downward trend should continue, driven by economies of scale and technological improvements. What is more, contrary to other types of energy, solar power draws on an almost unlimited source of energy, giving this technology an advantage over the very long term.
Cost of a solar module, 1976 - 2013
0
20
40
60
80
100
1976 1990 2004
$/W
c
Source: Mirova based on (IEA, 2014).
In what regions is the greatest growth expected?
Driven by policies of support for renewables, the latter essentially developed in Europe until 2005 for wind and 2010 for solar. Political transformations and lower production costs have allowed for the deployment of these technologies in other parts of the world. Today, facilities are evenly distributed among Europe, the United States, China, and the rest of the world. Over the coming decades, the installation of solar panels and wind farms should progressively see a swing toward China and other emerging countries.
Production of solar and wind electricity by dateof installation in a 2°C scenario
RoW
0 500 1 000 1 500 2 000 2 500 3 000 3 500
<2005 2006-2010 2011-2014 2015-2020 2021-2030 2031-2040
ChinaEuropean Union
United States
Twh
Source: Mirova based on (IEA 2015).
Who are the major players?
The solar industry has seen profound transformations over the course of the past 10 years. While European subsidies initially allowed for the development of a local industry, China rapidly established itself as the key player in the sector.
With the exception of polysilicon production, where Western players still maintain a substantial presence, the solar power value chain is largely dominated today by Chinese companies.
As for wind power, the traditional Western actors are still the most important. However, driven by the growth of a local market that relies little on foreign companies, China has seen the emergence of local champions that are beginning to turn toward the export market.
Polysilicon Solar modules Wind farms
GCL Poly (China) Trina Solar (China) Vestas (Denmark)
Wacker (Germany) Yingli (China) General Electric (US)
OCI (Korea) Canadian Solar (China/Canada) Enercon (Germany)
REC (Norway) Jinko (China) Gamesa (Spain)
LDK (China) JA Solar (China) Suzlon (India)
Tokuyama (Japan) Sharp (Japan) Siemens (Germany)
SunEdison (US) Renesola (China) Goldwind (China)
Daqo solar (China) First Solar (US) Sinovel (China)
Renesola (China) Hanwha (Korea) Nordex (Germany)
Sunpower (US/France) Guodian (China)
Industrial conglomerates are printed in italics
Source: Mirova.
Principal suppliers of solar/wind equipment
Will other renewable energies be called upon to play an important role?
Hydropower is a mature technology that is already competitive. While the perspectives seem limited in Western countries, where most readily exploitable sites are already in use, there is still significant potential across the rest of the world, notably in China and South America. Despite the fact that the development of large dams frequently presents social problems that must be managed with the greatest care by companies, reaching climate targets will likely require increasing recourse to this technology.
As regards other renewable energies, the perspectives seem more limited, even in the medium term, whether due to the availability of the resource (geothermal electricity generation), substantial technical challenges (marine energy, biomass), or environmental and social issues (biomass).
Production of hydro electricity by dateof installation in a 2°C scenario
OECD
0 1 000 2 000 3 000
China
Latin America
RoW
<1990 1991-2012 2013-2020 2021-2030 2031-2040
TWh
Source: Mirova based on (IEA, 2015).

12
//////// Understand ////////
Aside from renewables, might other technologies play a role in emissions reduction?
Solutions for storing electricity remain limited today. In order to cope with the intermittency of solar and wind power, it will be necessary to invest in more intelligent networks, or ‘smart grids’, allowing for the optimal alignment of supply and demand at every moment. Furthermore, the drop in the cost of batteries could foster the emergence of new markets as batteries are integrated into the new grids.
Beyond the recourse to renewables, reducing the carbon intensity of energy requires finding substitutes for coal and oil, which emit the most GHG.
➜ The emissions from natural gas are almost two times lower than those from coal. Natural gas can therefore play a transitional role, notably in countries that still rely heavily on coal, such as China, India, or the United States.
➜ Nuclear power, which doesn’t emit any GHG, may be considered a solution for combating climate change. However, safety concerns – brought to the fore by the incidents at Three Mile Island, Tchernobyl and Fukus-hima – as well as the question of nuclear waste, are significant obstacles to the development of the sector. Indeed, today, nuclear energy is the only energy that is witnessing a decrease in production. The development of nuclear fusion, which would limit these risks, appears to be out of reach today and therefore cannot contribute to the fight against climate change.
➜ Carbon capture and storage (CCS) technology is used to capture CO2 emitted by power plants or industrial sites and to store it underground. However, this technology raises issues of social acceptability and its economic viability has yet to be demonstrated.
Won’t these developments be affected by the drop in the price of oil?
The relation between the price of oil and the development of low carbon energies is more complicated than it appears. At first sight, one might think that it will be harder for alternative energies to be competitive if the price of oil is low. The question of regulation aside, which upsets this equation, most low carbon energies are used to produce electricity and are therefore not in direct competition with oil, which is primarily used for transport. Even the price of natural gas, historically indexed on that of oil, is developing its own dynamic today, in particular in the United States with the development of shale gas. The weak oil price principally affects the development of the fossil resources that are the most expensive to produce, such as Arctic oil reserves or tar sands.
Mobility
What are the trends in mobility?
Economic development has led to an increase in the mobility of individuals. While this development concerns all modes of transportation, road transport has clearly seen the greatest growth and today accounts for 75% of the energy consumption of the sector. This growth in consumption of the automotive sector is strongly tied to the urban sprawl resulting from the increased accessibility of the automobile.
In Western countries, certain trends are nevertheless emerging that suggest a transition has begun: a clear improvement in the energy efficiency of vehicles, the reduction of the number of km/person in the United States for more than ten years now, etc. However, these trends are more than compensated for by the growing use of automobiles in emerging countries. The increase in the motorization rate in China, for instance, is 10%/year. What is more, the growth of air transport, which emits the most per unit transported, also poses a challenge for reducing the emissions of the sector.
Reaching climate targets will require profound transformations in mobility.
Distribution of modes of transport over time
200
100
1850 1900 20000
km/yr and per capita
Walk, bicycle
Automobile
Rail Maritime Air
Bus
Source: Mirova based on (Greelings, shiftan & stead, 2012).
What are the solutions for a more sustainable mobility?
Making mobility more sustainable implies developments in different sectors that can be grouped around 4 axes:
➜ Transformation via the emergence of disruptive technologies such as electric vehicles or alternative fuels.
➜ Improvement in the energy efficiency of internal combustion (IC) vehicles.
➜ Transfer via greater investment in mature technologies with a smaller carbon footprint such as rail and maritime transport.
➜ Avoidance thanks to innovation in new information technologies that limit the need for travel.

13
//////// Understand ////////
Reduction potential for mobility
20056
6,5
7,5
8
8,5
9
9,5
10
10,5
11
7
2010 2015 2020 2025 2030 2035
Electromobility
Tran
sfor
mIm
prov
eSh
iftAv
oid
Biofuels
LNG
Friction resistance
Aerodynamics
Lightweighting
Efficiency of IC engines
Mode shift
Virtual mobility
Logistical improvements
GtCO
2
Source: Mirova based on (IEA, 2011; ICCT, 2012).
Do electric vehicles have a real potential for development?
The electric vehicle family (EV) comprises battery electric vehicles (BEV), plug-in hybrid vehicles (PHEV/REEV), and fuel cell vehicles (FCEV).
The two main obstacles to the development of electric vehicles are currently being overcome:
➜ Vehicle autonomy, which is already adequate for urban and corporate site needs, is growing rapidly;
➜ The cost of batteries has been halved in under 5 years, and should reach ~USD 200/kWh by 2020.
Plug-in hybrid electric vehicles represent an attractive alternative, opening perspectives for road transport with a ~40% improved carbon footprint of over long distances and the possibility of covering more than 50 km in purely electric mode.
In the long term, fuel cell vehicles are promising, conditional on sustained investments to improve the carbon footprint of the production and onboard storage of hydrogen.
Concerning air and maritime transport, transformational technologies, and in particular 2nd and 3rd-generation biofuels, are indispensable for attaining a 50% reduction in CO2 emissions.
Development of the electric vehicle market
02010
EV PHEV2011 2012 2013 2014
50 000
100 000
150 000
200 000
250 000
300 000350 000
Units sold
ICE
FCEVBEV
HEV
200018001600140012001000
800600400200
02010 2015 2020 2025 2030 2035 2040 2045 2050
Vehicle stock (in thousands) - Scenario 2DS
PHEV/REEV
Source: Mirova based on (Geelings, Shiftan, & Stead, 2012).
Shifts in vehicle stock in a 2°C scenario
ICE*
FCEVBEV
HEV
200018001600140012001000
800600400200
02010 2015 2020 2025 2030 2035 2040 2045 2050
Num
ber o
f veh
icle
s (m
illio
ns)
PHEV/REEV
* Internalcombustionengine
Source: Mirova based on (OECD/IEA, 2015; OCDE, 2013).
Can we further improve the energy efficiency of internal combustion vehicles?
For air, maritime and road transport, the potential reduction in CO2 emissions through technological improvements is on the order of 30%.
For all these modes of transport, the solutions for improvement concern:
➜ The energy efficiency of motors (assistance of a hybrid motor, downsizing and direct injection for road transport; geared turbofan engines and open rotor engines for air transport), transmission optimisation (six-speed, continuously variable transmission for road transport) and onboard energy management (electrical taxiing systems for air transport);
➜ The reduction of resistance force (aerodynamics, rolling resistance of tires, internal friction, lightweighting structures.
Do rail and maritime transport constitute viable alternatives?
When it comes to the transportation of people, emissions from rail transport are on average half those of transport by road or by air. The difference is even greater when it comes to the transportation of goods, where maritime transport, despite the problem of local pollution, and rail transport allow for even greater reductions.
In this context, public authorities are increasing investment in rail and maritime infrastructures that present opportunities for development for those companies involved in these solutions. On a smaller scale, this trend also benefits players in the domains of bus and bicycle transport.

14
//////// Understand ////////
Source: Mirova based on (IPCC, 2014).
GHG emissions by mode of transport
300
250
200
150
100
50
0Rail,
underground, tramway
Bus Passengervehicles
2- and 3-wheelers
Air
1400
1200
1000
800
600
400
200
0Rail -
electric train
Direct emissions gCO2/tkm
Direct emissionsgCO2/pkm
Rail - diesel train
Maritime -Freight
Heavy-duty vehicles - large
Heavy-duty vehicles - small
Does avoiding the need for travel represent an opportunity for companies?
The development of IT tools can contribute to minimizing and even avoiding the need for travel. The principal existing technologies are videoconferencing, vehicle-sharing platforms, fleet geo-localization, and satellite-guided navigation. While certain companies today are well positioned on these issues, such solutions are often diluted in a range of services that are far removed from questions of energy efficiency.
Examples of companies offering solutionsfor sustainable mobility
Transform
Albemarle Corporation (US) Infineon (Germany)
Blue Solutions (France) Continental AG (Germany)
Tesla (US) Delphi (US)
BMW (Germany) Zhengzhou Yutong (China)
BYD co (China) Schneider Electric (France)
Toyota (Japan) Air Liquide SA (France)
Nissan (Japan) Zheijiang Luyuan Electric Vehicle (China)
Renault (France)
Magna (Canada)
ImproveBorgwarner (US)
Airbus (France)
Rolls Royce (UK)
ABB (Finland)
Safran (France)
Michelin (France)
Hexcel (US)
ABB (Finland)
Algenol LLC (US)
Algae Tec Ltd (Australia)
Transfer
Shimano Inc. (Japan)
Deutsche Post (Germany)
Merida Industry (Taiwan)
Accell Group (Netherlands)
Siemens (Germany)
Alstom (France)Bombardier (Canada)
Buildings
What are the major trends in the building sector that have an impact on energy consumption?
The development of mobility has increased access to larger residential and commercial buildings, further removed from urban centres. This trend toward the increase in the number of m2/person seems likely to continue for many years to come.
Per capita residential surface trends
m2 /p
ers
0
20
2000 2011
United States European Union China
2025 2000 2011 2025 2000 2011 2025
40
60
80
100
Source: Mirova based on (IEA, 2014; UN, 2015).
As the energy consumption of buildings is heavily tied to heating and cooling, this trend toward larger homes requires a cultural change in the building industry in order to greatly accelerate the development of low-carbon solutions.
What are the solutions for reducing the carbon footprint of the building sector?
Technologies that limit the carbon footprint of buildings are available today. Indeed, while housing built prior to the 1970s had an energy consumption of between 300 and 400 kWh/m2/year, today’s housing can easily reach consumption levels of less than 100 kWh/m2/year. This energy performance is due to several principal solutions:
➜ The insulation of buildings, whether of walls, roofs, floors, windows or doors.
➜ Using the most efficient heating and cooling solutions.
➜ Increasing reliance on efficient equipment for producing hot water, cooking or lighting, as well as automated energy management.
Regulations governing the construction of new buildings are now encouraging the development of these solutions. Further efforts will nevertheless be required to accelerate the renovation of older buildings that account for the majority of energy consumption.
Source: Mirova.

15
//////// Understand ////////
Energy savings in the residential sector in an activereduction policy scenario
2 600
Mto
e
Energy demand Activity
Insulation
Internal airmanagement
Appliances& fittings
Reference scenario
2°C scenario
Insulation
Space heating
Cooling
Appliances
Lighting
Water heating
2 500
2 400
2 300
2 200
2 1002010 2015 2020 2025 2030 2035
Source: Mirova based on (IEA, 2012).
Who are the players that these trends could benefit?
Insulation producers seem very well positioned: production of foam insulation, glass wool, rock wool, double- and triple-pane glass. In this area, existing solutions already offer a significant level of energy efficiency at a reasonable cost. The acceleration in the implementation of these technologies seems more linked to the evolution of regulatory frameworks and the greater awareness of the players concerned, craftsmen and landlords in particular.
Concerning heating and cooling, there are fewer players proposing solutions. While condensing boilers allow for a slight increase in energy savings, the main technologies enabling a significant reduction in emissions today are heat pumps, solar panels affixed to buildings, and the use of biomass for heating.
Finally, in terms of equipment, the spectacular drop in the cost of LEDs has radically transformed the lighting sector.
Source: Mirova.
Examples of companies proposing green building solutions
Insulation Heating/Cooling Equipment
Cie de saint-Gobain (France)
United technologies corp. (US)
Epistar (Taiwan)
Asahi Glass Lennox (US) Philips (Netherlands)
Nippon Sheet Glass co. (Japan)
Daikin (Japan) Zumtobel (Austria)
Guardian Industries (US) Midea Group (China) Schneider Electric (France)
Kingspan (UK) Alfa laval (Sweden) Melrose (UK)
Rockwool (Denmark) Ingersoll Rand PLC (Ireland)
Osram (Germany)
Knauf (Germany) IMI (UK) Siemens (Germany)
Owens Corning (US) Nibe (Sweden) Legrand (France)
Johns Manville (US) Honeywell (US)
Sekisui House (Japan) ABB (Switzerland)
Industry
Which industries emit the most GHG?
Chemicals, cement, paper, steel and other metals alone account for 2/3 of the GHG emissions of the industrial sector. The remaining third is divided among a significant number of industries whose energy consumption is essentially tied to their consumption of electricity. Electricity is of increasing importance for industry. While it accounted for only 30% of industrial consumption in the early 1970s, it is now approaching 50%.
Industrial GHG emissions - World
Otherindustries
33%
Chemicals 22%
Steel15%
Cement18%
Pulp and paper5%
Non-ferrousmetals
7%
Source: Mirova based on (WRI, 2005).
Can heavy industry potentially reduce its emissions?
Driven by cost-saving targets, the most energy-intensive industries, such as the chemicals, steel and cement industries, have already made substantial efforts to reduce their consumption. While the implementation of today’s best available technologies would still allow for slight improvements, substantial reductions can only come from disruptive technologies like CCS. In the absence of greater carbon constraints, the implementation of such technologies seems largely hypothetical today. As such, the investment opportunities associated with improving the energy efficiency of these industries remain relatively limited.
Generic profile of energy consumptionfor heavy industry 1975 - 2012 - Steel
0
1975
1980
1985
1990
2000
1995
2005
2010
10
20
30
40
50
GJ/t
Ste
el
Source: Mirova based on (World Steel Association, 2008).

16
//////// Understand ////////
What about its electricity consumption?
70% of industrial electricity consumption is tied to the use of electric motors. There is substantial potential for improvement of the energy efficiency of these motors through:
➜ Replacing often ageing motors with newer, more efficient models.
➜ Increasing the use of variable-speed drives (VSD), which adjust the power of motors to the task at hand. Only 30% to 40% of existing motors are equipped with such devices today.
➜ The global optimization of systems, notably through greater reliance on sensors and information systems.
Many industrial players are now proposing solutions to optimize the energy consumption of their customers.
Source: Mirova.
Examples of companies offering energy efficiency solutionsfor industry
Efficient motors Diversified companies
ABB (Switzerland) Danaher (US)
Schneider Electric (France) Philips (Netherlands)
Emerson Electric (US) Mersen (France)
Eaton (US/Ireland) American superconductor (US)
Teco (Taiwan) Halma (UK)
Rockwell Automation (US) Spirax-sarco (UK)
WEG S.A. (Brazil) Siemens (Germany)
IMI (UK) Ingersoll Rand (Ireland)

17
//////// Understand ////////
TABLE OF CONTENTS
1 I What are the low-carbon scenarios? 181 I1 Energy, consumption and reserves 181 I 1 I 1 Consumption 181 I 1 I 2 Climate change and fossil reserves 201 I2 Future trends 201 I 2 I 1 Population demographics 211 I 2 I 2 Energy consumption per capita: improving energy efficiency 211 I 2 I 3 Carbon intensity of energy: developing low-carbon energies 211 I3 Can we achieve a 2DS? 221 I 3 I 1 Regulatory landscape 221 I 3 I 2 Potential energy scenarios 241 I 3 I 3 Is the energy transition underway? 24
2 I Energy 252 I1 What solutions exist to reduce the carbon intensity of energy? 252 I2 Wind Power 252 I3 Solar 272 I4 Hydro, biomass and other renewable energies 282 I 4 I 1 Hydro 282 I 4 I 2 Biomass 292 I5 Low carbon, non-renewable technologies 292 I 5 I 1 Smart Grids and batteries 292 I 5 I 2 CCS 302 I 5 I 3 Gas 302 I 5 I 4 Nuclear 302 I6 Impact on the energy sector’s traditional companies 302 I 6 I 1 Energy producers 312 I 6 I 2 Power producers 31
3 I Mobility 313 I1 How to make mobility sustainable? 313 I 1 I 1 Mobility trends 313 I 1 I 2 Environmental impact of the sector 323 I 1 I 3 Solutions for making mobility sustainable 323 I2 Technologies for transforming mobility 333 I 2 I 1 Electric vehicles 333 I 2 I 2 Electric two-wheelers and buses 353 I 2 I 3 Alternative fuels 353 I3 Improving transport energy efficiency 36
3 I 3 I 1 Road transport 363 I 3 I 2 Air transport 383 I 3 I 3 Maritime transport 383 I4 Development for the most efficient means of transport 383 I 4 I 1 Passenger transport 393 I 4 I 2 Freight transport 393 I5 Avoid 393 I 5 I 1 ICT and mobility 393 I 5 I 2 Shared services 393 I6 Summary of key players in sustainable mobility 40
4 I Buildings 444 I1 Buildings and the Environment 444 I 1 I 1 Trends in the building sector 444 I 1 I 2 Environmental impact of the building sector 444 I 1 I 3 Changes driven by regulations 464 I 1 I 4 How can the building sector be rendered sustainable? 464 I2 Improving buildings’ insulation 464 I 2 I 1 Insulation 464 I 2 I 2 Openings 474 I3 What developments can improve the efficiency of air and water management? 484 I 3 I 1 Heating and domestic hot water 484 I 3 I 2 Air Conditioning Systems 494 I4 Making Appliance Use More Economical 494 I 4 I 1 Lighting 494 I 4 I 2 Cooking 504 I 4 I 3 Automation 504 I5 Conclusion 50
5 I Industry 515 I1 Industry, energy and CO2 515 I2 Heavily-consuming industries 515 I 2 I 1 Overview of regulation 515 I 2 I 2 Chemical and petrochemical products 515 I 2 I 3 Steel 535 I 2 I 4 Cement 545 I3 Cross-sector approach to energy efficiency 55
Conclusion 57
List of figures 57
Bibliography 58

18
//////// Understand ////////
1 I What are the low-carbon scenarios?
According to the latest reports of the Intergovernmental Panel on Climate Change (IPCC), published between 2013 and 2014, the scientific community has confirmed that it is extremely probable (>95 %) that human activities are disrupting the climate. We are already seeing some consequences of climate change: an increase in the frequency of heat waves, the ice cap melting in the North Pole, etc. As the climate continues to warm, this trend will only escalate, leading to increased droughts, declining agricultural yields, tropical diseases migrating to more temperate zones, etc.
If we are to limit these impacts and maintain sustainable development objectives, we now need to implement significant measures to reduce GHG emissions. Indeed, as the different scenarios published by the IPCC show, we will only be able to keep the rise in temperatures below the 2°C (2DS) threshold and avoid the most serious consequences of climate change if we can cap the emissions rapidly, followed by a sharp decline by 2020.
This objective, even if it seems very ambitious today, nevertheless remains the figure on which international consensus has been reached. Achieving this objective will result in structural changes in particular for:
➜ Companies in the energy sector (~75 % of global GHG emissions);
➜ Companies in the agricultural and forestry management sector (~25% of emissions).
Figure 1. Greenhouse gas emissions by sector 2010 (Total: 49 Gt CO2 eq)
Source: Mirova 2015 based on (IEA, 2014).
Energy1%
Industry
Energy(excludingelectricityand heat)
10%
21%
Transport14%
Building6%
Transport0.3%
Building12%
Agriculture &Deforestation
1%
Industry11%
Electricity andHeat25%
Agriculture &Deforestation
24%
2,253.4
Focus: Agriculture, forestry and investment
Responsible for nearly 1/4 of global GHG emissions worldwide, agri-culture and forestry also have a major role to play in tackling climate change. Since GHG emissions in the agriculture and food sectors are largely unrelated to energy problems (CO2 emissions come from defor-estation, the digestion of livestock, fertilized soils), investments should largely be directed towards effective land management. However, despite being a major global economic sector, farms are still largely family concerns. Companies directly involved in the management and exploitation of land are barely represented in the stock markets. As inves-tors, there are some solutions that can support a low-carbon economy in the agricultural sector. In particular, some investment funds invest directly in community-based projects, which nevertheless still remain few and far between.1
For investors, the bulk of the challenges in transitioning to a low-carbon economy can be found in the energy-intensive sectors: power generation, industry, buildings, transport, etc. If we are to grapple with the on-going changes in these sectors, we need to a clear understanding of energy dynamics.
1 I1 Energy, consumption and reserves2
1 I 1 I 1 Consumption
Per type of energyDespite the growing importance of alternative energies, we should remember that fossil fuels, i.e., oil, coal and gas, still account for almost 80% of the global energy mix (IEA 2012). Yet, this energy mix is incompatible with fighting global warming. Unlike renewable energies and nuclear, which emit no CO2 to generate electricity, burning a unit of coal energy has the highest emissions (~4 t CO2/toe) followed by oil ( ~3 t CO2/toe) and then gas (~2- 2.5 t CO2/toe) (ADEME, 2010). When the consumption levels of each type of energy is factored in, coal is therefore responsible for 44% of global GHG emissions, oil 36% and gas 20%.
Figure 2. Global primary energy consumption3 2012 (14,000 Mtoe)
Source: Mirova 2015 based on (BP, 2015; IEA, 2014).
Hydro6%
Biomass10%
Nuclear4%
Gas21%
Others renewables2%
Coal28%
Oil29%
Figure 3. CO2 emissions by energy source 2012
Source: Mirova 2015 based on (BP, 2015; IEA, 2010).
Oil36%
Gas20%
Coal44%
2. There are many different units for measuring energy. For example, oil is frequently meas-ured by the barrel, gas in m3 and coal by the tonne. In order to compare different energies easily, all types of energy must be expressed in tonnes of oil equivalent, or toe. 3. The primary energy for nuclear power and renewable energy has been calculated here by applying a conversion factor or 38% corresponding to the average efficiency of a modern thermal energy plant.
1.The Land Degradation Neutrality fund, envisaged by the United Nations Convention to Combat De-sertification (UNCCD), which is due be launched in 2016, plans to change the scale of this resource to combat climate change. Its goal is to restore 12 million hectares per year, i.e., 1Gt of CO2.

19
//////// Understand ////////
The predominance of fossil energies can be largely explained by their comparatively low cost and facility of storage for different case of use and purposes. Coal is therefore the main source of energy for power generation, followed by gas. Oil is omnipresent in the transport sector. Gas, and to a lesser extent oil, are widely used for generating heat in buildings. These three energies are also widely used in industry...
As for other types of energy, biomass is the biggest contributor to the global energy mix. Although this energy source is used in modern technological plants (biofuels, co-generation, etc.), its traditional uses still dominate (for cooking and heat production in low efficiency stoves in developing countries. Finally, other main energy sources (hydroelectricity, nuclear, wind, solar PV and geothermal energy) are largely dedicated to power generation.
These direct uses mainly cover heat generation in the building sector* and plant operations (furnaces, boilers, etc.), in the manufacturing industry. These
two sectors also use significant quantities of electricity but here, the generated power has not been allocated to the sector that consumes it.
Figure 4. Breakdown of principal uses of fossiland non-fossil fuels - World 2012
Source: Mirova 2015 based on (BP, 2015; IEA, 2014; IEA, 2010).
Oil
Coal
Gas
0 1 000 2 000 3 000 4 000 5 000
Electricity Buildings Industry Transport Raw material Others
BiomassHydro
NuclearWindSolar
Geothermalenergy
0 500 1000 1500Mtep
Electricity District heating Industry Transport
Heat - modern residential use Heat - traditional residential use
Mtep
Historically, this global energy mix has changed little. Exception made for the two oil crises and the 2009 financial crisis, energy use has grown constantly over the past 50 years, driven by sustained growth in oil, coal and gas consumption. From 2000 onwards, the rise of China, which uses huge amounts of coal for its electricity and its heavy industry, has reinforced this trend.
Alternative energies have experienced less linear growth:
➜ Hydroelectricity, now a mature technology, has grown much slower than fossil fuels, despite robust growth over the last 50 years.
➜ Nuclear, which experienced strong growth in the 70s in response to oil crises, has since seen its growth
decline sharply, particularly following the disasters at Chernobyl and Fukushima.
➜ After years of near absence, other energies are starting to take off. Wind and solar power in particular have experienced sustained growth over the past 5 years.
Figure 5. Change in global energy consumption1965 - 2014
Source: Mirova 2015 based on (BP, 2015).
Oil
Coal
Gas
Renewables
Nuclear
4 000
3 000
2 000
1 000
01965 1975 1985 1995 2005 2015
First oil crisis
Second oil crisis Rise of China
Subprime crisis
Fall of the USSR
Mto
e
By regionAt a regional level, three blocks alone account for almost 75% of global energy consumption: OECD countries as a unit, the former USSR and China, whose rapid growth makes it stand out.
Other countries form a heterogeneous block that includes the major emerging economies (India, Brazil), developing countries, LDCs (mostly African and Asian countries) and the oil countries. Forecasts predict that the consumption of this last block will increase rapidly, with energy generation highly concentrated in fossil fuels, especially in countries such as India.
By sectorEnergy is used for specific needs: heating, travel, manufacturing goods, etc. From their extraction to their use, these natural resources undergo a series of conversions. These different stages can be broken down into two main groups:
➜ The upstream component, primarily electricity generation and the energy use in the energy sector (extracting raw materials, oil refining, coal processing).
➜ the downstream component, related to end-user energy consumption, concerns three main sectors:
• Industry, spanning a wide range of activities: chemicals, steel, cement, glass, food processing, pulp and paper, machinery, mining, textiles, etc.,
• Road, sea or air transport of both passengers and freight,
• Residential, business or public buildings.4
4. To these three main categories, we can also add: public services such as water supply & waste management, farming, forestry and fishing and energy use for non-energy purposes.
*Energy consumption levels in the building and industrial sectors only reflect the direct use of fossil fuels by these sectors

20
//////// Understand ////////
Figure 6. Breakdown of global primary energy consumptionper sector, 2012
Purple: upstream consumption Blue: Downstream consumption
Source: Mirova based on (IEA, 2014).
Building15%
Others2%
Transport19%
Industry20% Energy
sector20%
Electricity36%
Industry14%
Energysector
2%
Others2%
Building17%
Transport1%
Historically, the three sectors have experienced almost uninterrupted growth in their energy consumption regardless of having gone through periods of high volatility (progressive reduction in dependence on oil after the oil crises, then a sharp increase in consumption in the sector from the start of this century, led by China).
Figure 7. Global primary energy consumption per sector,1970-2012
Source: Mirova based on (IEA, 2014).
4 000
3 000
2 000
2 000
01970 1980 1990 2000 2000
Industry
Building
Transport
Mto
e
1 I 1 I 2 Climate change and fossil reserves
Restricting the rise in temperatures to 2°C will involve limiting future GHG emissions into the atmosphere. While the amount of available fossil resources is limited, the question remains whether the quantity of CO2 emissions that would be released were it burnt is compatible with the 2°C constraint.
Fossil fuels can be grouped into two categories:
➜ proven reserves, corresponding to the volumes of hydrocarbons already discovered (both conventional and unconventional) for which there is a high certainty (>90% chance) that they will be extracted under current economic and technological conditions.
➜ ultimate resources, corresponding to the latest estimates for hydrocarbons for which estimations indicate there is at least a 10% chance that they will be extracted under current economic and technological conditions. These volumes increase with technological progress.
At the current rate of consumption, we can estimate that proven oil reserves will last another 50 years, gas 65 years and coal 125 years. By including the ultimate recoverable resources, these time lines extend to between 173 and 233 years respectively for oil and gas and more than 2,700 years for coal.
However, when converted into CO2 tonnes, emissions from the proven resources alone would represent more than 3,000 Gt, in other words more than 3 times the acceptable level of emissions (980 Gt) in the atmosphere if we are to have a 50% chance of limiting the temperature increase to 2°C, according to the IPCC estimates. According to the Potsdam Institute for Climate Impact Research, this carbon budget should even be reduced to 565 Gt, to achieve an 80% probability.
Figure 8. Breakdown of carbon content of provenand ultimate hydrocarbon reserves
Source: Mirova based on (IEA 2013, 2014).
Coal41 970
2470
2° CarbonBudget
1927 712 429 980 56550% chance80% chance
GtCO
2
678
Oil Gas
Proven reservesRecoverable reserves
In general, these proven fossil resources are unevenly distributed around the world. The United States, Russia and China represent 57% of world’s coal reserves, while almost half of oil reserves are in the Middle East. When it comes to gas, Russia, Iran and Qatar share half of all conventional reserves. The concentration of hydrocarbon resources and reserves in the hands of a small number of countries, particularly oil (80% of proved reserves are held by OPEC countries) may hamper international climate negotiations. These countries may be less willing to accept setting up stringent restrictions on their main income sources.
1 I2 Future trends
In order to analyse the trends for GHG emissions related to energy consumption, one possible method is to break the emissions down based on the following equation:
GHG emissions (energy)=
Population* Energy consumption per capita * Carbon intensityof energy.
Figure 9. Breakdown of various components of greenhousegas emissions (GHG)
By understanding the trends for each element of the equation, we can anticipate future constraints in terms of GHG emissions.

21
//////// Understand ////////
1 I 2 I 1 Population demographics
According to the projections of the United Nations central scenario (Medium-Variant, per United Nations, 2015), assuming current socio-economic trends, the world population is expected to reach more than 9.7 billion people by 2050. This population increase of more than 2.5 billion individuals in less than 40 years (in 2015, the population currently stands at 7.4 billion) is unprecedented and will have a significant impact on various dimensions of society, including energy consumption and GHG emissions.
It may be noted that the biggest users of energy: i.e., OECD, China and former USSR, appear to be relatively stable in terms of demographics. Most of the population growth will come from those countries that use the least amount of energy, notably Africa and Asia.
These projected population increases will be a significant challenge requiring increased action in other areas.
1 I 2 I 2 Energy consumption per capita: improving energy efficiency
Improving energy efficiency is one way of reducing GHG emissions.
By region
Figure 10. Primary energy consumption per capita
Source: Mirova, 2015 based on (BP, 2015; World Bank, 2014; IEA, 2015).
19600
1
2
3
4
5
6
1970 1980 1990 2000 2010 2020 2030 2040
FormerSoviet UnionOECDChinaWorldRoW
First oil crisis
Second oil crisis Rise of China
2°C scenario
Subprime crisisFall of the USSRto
e pe
r cap
ita
There is a strong correlation between per capita energy consumption and the development level of a given geographical region. OECD countries show an average per capita energy consumption of around 4 toe/capita,5 well above the world average which remains less than 2 toe/capita and China, which has only recently exceeded the world average.
In OECD countries, consumption peaked in 2005, after which the per capita energy consumption began to decline. This change is partly explained by the offshoring of energy-intensive activities from OECD countries to emerging countries. However, even after reallocating emissions from production area to consumption, this downward trend is still evident (Boitier, 2012).
We may therefore be starting to see the beginnings of an energy transition in OECD countries, with a decorrelation between GDP and energy consumption. Indeed, since 2010, GDP/capita in the OECD zone has begun to grow again, while GHG emissions per capita have fallen over the same period.
Nevertheless the effort yet needed in the OECD zone is colossal. According to projections by the International Energy Agency (IEA), the energy per capita consumption will have to fall to ~3.2 toe per capita i.e., to a level 30% lower than that of 2005. Even though the time line to achieve this change is longer, the required fall is roughly commensurate with what USSR countries experienced after the fall of the Wall.
For its part, China will have to massively increase its efforts to steer its country towards a lower energy economy
Finally, for other economies, the historical trend is a stable increase over time. The IEA has called for stabilised energy consumption per capita by 2020. However, reconciling economic development and stabilised energy consumption in the context of population growth will be a huge challenge for the less advanced economies.
By sectorAs discussed above, consumption for the main energy-intensive sectors - buildings, industry, transport - has grown constantly. When broken down per capita, these three sectors nevertheless produce heterogeneous results: while energy consumption per capita in the building sector has remained relatively stable, the transport sector has constantly increased its energy consumption over the last 35 years without showing any signs of improvement. Finally, the trends toward energy reduction per capita in the manufacturing sector following the oil crises have reversed since the start of this century, mainly driven by China’s spectacular growth.
1 I 2 I 3 Carbon intensity of energy: developing low-carbon energies
Reducing the carbon intensity of the energy we produce and use is another driving force in reducing GHG emissions.
Figure 11. Change in the carbon intensity of global energy,1965-2040
Source: Mirova 2015 based on (BP, 2015; IEA, 2015; ADEME, 2010).
01965 1975 1985 1995 2005 2015 2025 2035
0,51
1,5tCO 2/t
ep
22,5
33,5 Projection scenario 2°C
The change in this indicator is entirely explained by the CO2 content of the different energies and hence by the share of each energy in the energy mix.
5. This average hides major differences between countries. The United States consumption exceeds 7 toe/capita while Europe and Japan have energy consumptions of between 3 and 4 toe/capita. These differences can be mainly explained by the fact that most of the cities in the United States developed as the motor car was becoming widespread, leading to large areas of urban sprawl and bigger buildings. Despite these differences, due to the similar consumption patterns between the different OECD member countries, we can group these countries together in a first approximation.

22
//////// Understand ////////
Consequently, the drop in the carbon intensity of energy from 1965 to the first decade of this century can be explained up to the 1970s mainly by the increasing use of oil at the expense of coal, subsequently by the increasing use of gas and nuclear until the 2000s.
The resumption in the global increase of this intensity since the 2000s can be explained by an increase in coal use due to China’s growth. Nevertheless, the Chinese authorities are now showing themselves willing to lead China to a ‘new normality’ (Stern, June 2015), by aiming to achieve lower, but more sustainable growth. In energy terms, this paradigm shift is already visible, with coal consumption stabilising over the last 3 years.
Aside from the necessary reduction in coal and oil, if we are to achieve the climate goals, alternative energy must be significantly scaled up, in particular solar and wind, but also hydro and nuclear. Gas, which has lower emissions than other fossil fuels, is often presented as a transition energy that can play a role in tackling climate change, especially if gas-fired plants can replace coal-fired plants.
Focus: Carbon intensity of energy and electrifica-tion of usesSome uses mainly employ fossil fuels without converting them into electricity: petrol consumed in vehicles, gas and oil in buildings, etc. However in most cases, low-carbon energy generation must first be converted into electricity: hydro, solar PV, wind and nuclear power cannot be used directly to run a vehicle or heat a home. One of the challenges of achieving the transition to a low-carbon economy is therefore increasing the electrification of end uses. Unlike a thermal engine which necessarily emits CO2, an electric engine uses electricity, which can be produced using energies that exhibit low CO2 emissions.Although electricity’s share is currently growing in the building sector and industry, the use of electricity in transport remains marginal, mainly due to problems of storage.
1 I3 Can we achieve a 2DS?
1 I 3 I 1 Regulatory landscape
Whether it is a matter of reducing energy use or developing low-carbon energies, significant hurdles remain that require regulatory support in order to promote innovative technology.
UN framework: UNFCC Environmental and climate issues first appeared on the international agenda at the United Nations environment conference in Stockholm in 1972. The Brundtland report followed in 1987, which enshrined the concept of sustainable development and in 1988 the Intergovernmental Panel on Climate Change (IPCC) was created, responsible for revising and compiling scientific, technical and socio-economic knowledge on climate change.
The structure of the international negotiation framework was really formalised in 1992 with the creation of the United Nations
Framework Convention on Climate Change, UNFCC, the first international treaty seeking to explicitly avoid, reduce and offset anthropogenic impact on the climate.
UNFCC now has 195 Member states, known as ‘Parties to the Convention’. Each year the Party States meet at the ‘Conference of the Parties’ (COP), its supreme decision-making body. During the COP, the UNFCC makes its structural policy decisions. The different COPS have led to a series of international agreements.
1972Stockholm
conference,UNEP
1988IPCC
1997 Kyotoprotocol(KP)
2009COP 15Copenhagen (2°C agreement, GreenClimate Fund)
2011COP 17Durban(Durban platform, objective:reach agreement for post 2020)
2005Kyoto comes into effect
2008 2012 2020
1992Riosummit,UNFCCC
1987BruntlandReport
2015COP 21Paris(Deadline fornegotiatinga post 2020agreement)
PKPhase II
PKPhase I
Figure 12. Main phases of international climate negotiations
Source: Mirova.
Kyoto ProtocolSigned at COP 3 in 1997, the Kyoto Protocol came into force in 2005. This Treaty was intended to reduce GHG emissions of the leading 38 industrialised countries (the so-called Annex B) by 5% in 2012 compared with 1990. Only countries in Annex B had binding targets. Nevertheless, many events such as the United States refusal to ratify it and then Canada’s denunciation of the Treaty reduced the scope of the Protocol. The second phase of the Protocol was adopted in Durban in 2011 which set the objectives for the period 2013-2020.
Copenhagen AccordIn 2009, in Copenhagen, the COP 15 had two aims:
➜ set up a framework and objectives for the second phase of the Kyoto Protocol (2013-2020).
➜ Include countries outside of Annex B in the framework by encouraging them to formulate GHG emission objectives.
114 States declared themselves parties to this convention at its signature (141 today). These include China, the United States and other States which stayed on the margins of climate negotiations during the 2000’s. This treaty, criticised because it did not result to a legally binding text, nevertheless achieved several advances: Acknowledging climate change as the ‘biggest challenge of our time’, the text officially mentioned the 2°C objective for the first time in a United Nations policy document. This is the figure which has been used as a basis for the discussions ever since, including for the COP21 in Paris this year.

23
//////// Understand ////////
➜ Copenhagen saw certain States not parties to Annex B publish their climate change objectives. This helped initiate the commitment of emerging and developing countries.
COP 21: ParisThe 21st COP, which will take place in Paris at the end of 2015, is an important event in the climate diary. In fact, 2015 is the ‘deadline’ set by the Durban Platform to sign an agreement to take the place of Phase 2 of the Kyoto Protocol, post 2020. The challenges are therefore huge for investors and the private sector in general, since the expected accord must provide a path and also regulatory predictability for the post 2020 period. As with each COP, the level of effort expected from each region, based on the level of emissions, development and the history of emissions will be the focus of discussions, notably between developed and emerging countries.
Rest of the world40%
Rest of the world24%
India3%
Japan4%
Russia4%
China11%
UE (28)24%
United States27%
UE (28)9%
United States12%
China23%
Brazil3%
Russia4% Indonesia
4%
India5%
Cumulative Emissions 1850-2012exclusive of deforestation impact
Emissions 2012including deforestation impact
Figure 13. Breakdown of greenhouse gas emissions by region
Source: Mirova 2015 based on (WRI 2015; FAO 2014).
Main State/Regional regulationsAt the regional level, when it comes to combating climate change, the focus of attention is on the United States, China and the European Union due to the weight of their emissions and their influence on the rest of the world.
United StatesIn spring 2015, the United States published their national contribution for the COP 21. According to this document, the
general declared objective is to reduce GHG emissions by 28% by 2025, compared to 2005 levels. Even if these objectives hardly seem in line with a 2DS6 scenario, they are nevertheless a huge step forward. To reach this macro objective, the Obama administration used sectoral plans, the most developed of which are:
➜ The ‘Clean Power Plan’ for the electricity sector which aims to reduce GHG emissions by 32% from power generation compared to their 2005 level. The plan draws significantly on renewables (target of 28% vs. 13% in 2014) and only has limited ambitions on shale gas as a stopgap solution between coal and renewables.
➜ Energy efficiency in mobility, with several programmes aimed at reducing the fuel consumption of road vehicles through implementing stringent standards for GHG emissions for new vehicles.
ChinaLong absent from China’s official policy, the transition to low carbon is now well established and even a cornerstone of the country’s new growth strategy. On 30 June 2015, China published is national objective for COP21. Overall, China foresees its GHG emissions peaking by 2030. To achieve this, it is planning on reducing the energy intensity of its GDP by 60-65% in 2030 compared to 2005 levels, by reaching the threshold of 20% of renewable energy in its energy mix (11.2% in 2014) and increasing its forest cover by 4.5 billion and m2 compared to 2005.
These commitments also appear scarcely compatible with the 2°C7 goal, but represent a step in the right direction and shows that China is aware of the challenges. This is especially true, considering that China appears to be moving quicker than expected, notably with respect to renewable energy installations. For example, it achieved the 2020 wind power objective in 2010.
European UnionThe European Union has declared ambitious goals for dealing with climatic constraints. In 2008, the European Commission presented an action plan, dubbed the ‘Climate & Energy Package’. In 2014, new objectives were set for 2030. These are the objectives to which the Union has committed for COP21.
Source: Mirova based on (European Commission, 2014).
Figure 14. European commitments on climate change
2009 Climate & Energy Package
2014 Climate & Energy Package
Horizon 2020 2030
GHG emissions -20% ≤-40%
Share of renewable energies
20% ≥27%
Energy consumption (energy efficiency)
-20% ≥-27%
6. See notably: http://climateactiontracker.org/countries/usa.html. 7. see: http://climateactiontracker.org/countries/china.html.

24
//////// Understand ////////
The objectives set by the first ‘Climate & Energy Package’ were precursors the international stage. Efforts made by the Member States in the Union, together with the effects of the economic crisis on energy consumption, suggest that the 2020 objectives will be met.
1 I 3 I 2 Potential energy scenarios
Based on the existing economic and energy context as well as different regulatory changes observed, many organisations are proposing scenarios forecasting possible changes in the energy sector. The most frequently used scenarios are those put forward by the International Energy Agency, IEA). The IEA has projected 3 main scenarios:
➜ ‘Current policies’: This scenario forecasts energy consumption by considering that current policies will not be changed. This is the most pessimistic scenario in dealing with climate change, since it leads to a rise in temperatures of 6°C over the long-term.
➜ ‘New policies’: this scenario predicts energy consumption by assuming that the different States will adhere to their commitments to limit their CO2 emissions. This scenario results in a rise in temperatures of 3.5°C over the long-term.
➜ ‘450 ppm’: this scenario predict the efforts necessary to achieve the goals to reduce emissions and limit the atmospheric concentrations of greenhouse gases to 450 ppm by 2150 (50% probability of limiting the rise in temperatures to 2°C).
Other organisations, manufacturers and NGOs have also produced projections, with their scenarios largely matching the visions defended by each of them.
Figure 15. Projections for 2040 of energy demand per fuel type(IEA, Exxon, GWEC/EREC/Greenpeace)
Source: Mirova 2015 based on (IEA, 2015; ExxonMobil, 2015; GWEC, ENERC, Greenpeace, 2012).
0
5 000
2012
Curre
nt p
olic
ies
(+6°
C)
450
Scen
ario
(+2°
C)
New
pol
icie
s(+
3.5°
C)
Exxo
n
GWEC
/ERE
C/Gr
eenp
ace
10 000Mto
e
15 000
20 000
Other renewables Hydro Biomass and waste Nuclear
Gas Oil Coal
Although the scenarios differ widely, thus demonstrating the lack of consensus, some common trends can nevertheless be highlighted.
➜ Renewable energies will play a growing share of the energy mix worldwide. However, the scale of this growth gives rise to very significant differences.
➜ Within fossil fuels, gas will play an increasingly important role.
➜ Fossil fuels will continue to feature largely in the world’s energy supply.
1 I 3 I 3 Is the energy transition underway?
Whether by improving energy efficiency or having access to lower carbon energies, now is the time to reverse the historical trends of high pollution. As previously mentioned, from a macro standpoint, some recent changes are encouraging and their effects are beginning to trickle down to the micro level.
➜ Today, the energy sector is undergoing a somewhat radical transformation. For example, several energy suppliers have announced major strategy changes over the last few years in order to adapt their economic model to energy transition. The changes taking place in the energy sector are discussed in part 2 of this study.
➜ In the transport sector, we are also seeing changes emerging in economic models, evidenced by the introduction of hybrid and electric vehicles. The issues around developing sustainable mobility are set out in part 3.
➜ In the building sector, even though the inertia is more evident, we are now seeing major changes taking place, principally pushed through by increasingly stringent regulatory constraints for energy consumption in constructing new buildings. The ability of the building industry to move towards green buildings is discussed in part 4.
➜ Finally, the manufacturing sector continues to improve its energy efficiency, for obvious reasons of cost but also pushed by more stringent regulations. These changes drivers of opportunities and the biggest players in the sector are all highlighting the energy efficiency gains of using their products. The development of the manufacturing sector is described in part 5.

25
//////// Understand ////////
2 I Energy
2 I1 What solutions exist to reduce the carbon intensity of energy?
Depending on the type of energy and end use, the greenhouse gas emissions for energy consumption are very different. We can distinguish between two main types of energy use.
➜ The direct use of energy (~2/3 of consumption): this energy is used in thermal engines (road transport, rail transport), boilers, industrial ovens, etc. The overwhelming majority of these direct uses require fossil fuels to be burnt. In terms of emissions, coal has the most emissions (~4 tCO2/toe) followed by oil (~3 tCO2/toe) and then gas (~2- 2.5 tCO2/toe). Only geothermal energy and solar thermal energy use energy directly without emitting any CO2.
➜ Transforming energy into electricity (~1/3 of consumption): electricity is used mainly in buildings and industry. The emissions attributable to power generation are very different depending on the generation method.
• Coal (~50% of world electricity), is the fuel with the highest emissions, from 750g CO2/kWh to over 1,000g CO2/kWh depending on the quality of the fuel and the efficiency of the plant.
• Gas (~25% of world electricity) has an intermediate level of emissions of around 400g CO2/kWh.
• Hydro, solar PV, wind power and nuclear energy (~20% of world electricity) do not produce any GHG emissions when generating electricity.
• Oil (~5% of the world’s electricity) has emissions of around 600 to 700 CO2/kWh.
Biomass also plays a role in energy supply, whether through the use of wood as a fuel in boilers, in power plants or in transport in the form of biofuels. Nonetheless, it is difficult to assess the carbon footprint of biomass. Depending on the analysis, this impact can be considered neutral, when it is used without being converted and the resource is sustainably managed; or it can be considered roughly as emissions-intensive as fossil fuels, when the sector using it requires several conversions and the resource is not sustainably managed.
Figure 16. Direct consumption versus consumptionof electricity
Source: Mirova based on ( BP, 2015; IEA, 2014).
Coal9.8%
Coal15.8% Other energies
1%
Hydro5.5%
Biomass0.7%
Nuclear3.8%
Oil25.8%
Gas18.8%
Gas7.7%Oil
2%
Biomass8.9%
Electricity36%
Geothermaland solar thermal
0.3%
Over the last decades, fossil fuels, and particularly coal, have grown at a much greater rate than renewable energies, which still only constitute a small proportion of the energy mix. Nevertheless, investments in renewable energies in Europe, solar and wind in particular, have seen strong growth in the last ten years; today, expansion has been redirected to China and the United States.
Figure 17. Investments by energy type (2000-2012)
Source: Mirova based on (IEA, 2014).
Coal mining and transport)
Oil (extraction)
Oil (power plant)
Gas (transport)
Wind and solar
Others Energies
Gas (power plant)
Nuclear
Hydro
Oil (transport)
Gas (extraction)
Coal (power plant)
2000
1 600
1 400
1 200
1 000
800
600
400
200
02004 2008 2012
Billi
ons
of d
olla
rs
If a 2°C scenario is to be achieved, the investments in solar and wind will need to be sustained and greater investments will need to be made in other renewable energies, especially hydro. Furthermore, gas or nuclear energy could also come to play a role in reducing emissions.
Figure 18. Composition over time of the electricity mixin a 2oC scenario
Source: Mirova based on (IEA, 2015).
Oil Coal
Wind
Solar
Other RE
Nuclear
Hydro
Gas
Biomass
40 000
30 000
20 000
10 000
01990 2012 2020 2030 2040
Projection 2°C scenario
TWh
2 I2 Wind Power
The wind power market developed in Europe, especially in Germany (56 TWh of wind generation in 2014), Spain (52 TWh) and in the United Kingdom (32 TWh). Denmark has also been a pioneer in developing wind power and now has the highest percentage of wind power generation in the region (>10% of electricity generated). First the United States and then China began investing in this technology in 2005, and China became the world’s biggest market in terms of installed capacity in 2009. Wind power has therefore seen an average growth of over 20% per year over the last ten years and now represents 700 TWh i.e. ~3% of the power generated worldwide. In Europe, the main markets today are Germany, the United Kingdom, Sweden and France.

26
//////// Understand ////////
Figure 19. Wind turbine installation by region – net output
Source: Mirova based on (BP, 2015).
19902000
20022004
20062008
20102012
20140
5
10
15
20
25
European Union China Rest of the worldUnited States India
GW
This growth has been made possible partly by regulatory support, but also by falling costs.
Regulatory support mechanisms vary widely depending on the region under consideration.
➜ In the United States, the main incentive mechanism for wind power is a system of tax credits (PTC: Production Tax Credit), which is currently set at slightly over $20/MWh for the first 10 years of generation. These tax credits are generally voted for periods of one to two years. This mechanism has been in place for twenty years. Although it has allowed the sector to expand, the US market’s collapse in 2013, which was caused by the federal government’s tardy renewal of subsidies, demonstrates how heavily the sector relies on State support.
➜ China has set a goal to achieve an installed wind power capacity of 200 GW by 2020, meaning it will almost double its installed capacity, which was 115 GW at the end of 2014. This goal is currently supported by a guaranteed feed-in tariff of ~$80-90/MWh which varies according to the region.
➜ In Europe, beyond the shared goal of raising the proportion of renewable energies in the mix to 27% by 2030, each country is responsible for implementing incentive mechanisms to develop each sector. For example, Germany and France have opted for guaranteed feed-in tariffs ranging from ~€50 to 90/MWh, while Sweden and the United Kingdom have chosen green certificate systems.
Beyond these regulatory aspects, recent technological progress, in particular the increased size of the turbines along with an improved approach to selecting generation sites and the decrease in financing costs, have led to a significant drop in generating costs. In many regions, onshore wind power can increasingly compete with traditional generation methods, making grid parity a reasonable goal.
Figure 20. Wind power generation costsDenmark 1980-2000
Source: Mirova based on (IEA, 2012).
0
50
100
150
200
250
300
1981 1983 1985 1987 1989 1991 1993 1995 1997 1999
$/M
Wh
Figure 21. Wind power generation costs vs. coal and CCGT gasWorld 2013-2025
Source: Mirova based on (IEA, 2015).
0
50
100
150
2013
Onshore wind
$/m
Wh
New coal New gas CCGT
2014 2025 2013 2014 2025 2013 2014 2025
This trend suggests that it is possible to transition to a wind power generation capable of scaling up without grants, which opens up development perspectives in the sector. Achieving a 2°C scenario requires not only continuing, but also accelerating the current trends in renewable energy deployment.
Figure 22. Projection of wind energy consumptionin a 2°C scenario
Mirova based on ( BP, 2015; IEA, 2015).
20002005
20102015
20202025
20302035
20400
1 000
2 000
3 000
4 000
5 000
6 000
TWh
United States
Rest of the world
European Union
China
2°C Scénario
These projections represent promising opportunities for industry players. Western companies are still the biggest players in the industry, thanks to the fact that wind power developed earlier in their markets. However, growth in China has mainly been achieved by drawing on local companies, accounting for the emergence of Chinese companies that are now starting to turn to the export market.
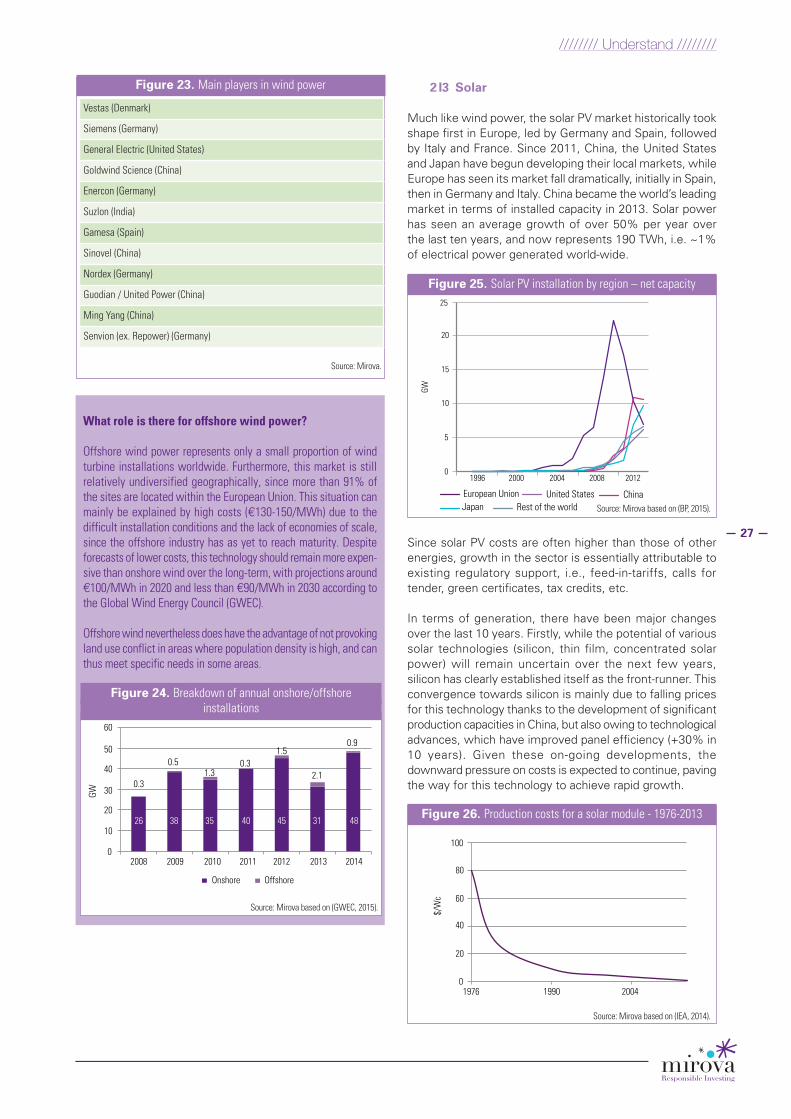
27
//////// Understand ////////
Figure 23. Main players in wind power
Source: Mirova.
Vestas (Denmark)
Siemens (Germany)
General Electric (United States)
Goldwind Science (China)
Enercon (Germany)
Suzlon (India)
Gamesa (Spain)
Sinovel (China)
Nordex (Germany)
Guodian / United Power (China)
Ming Yang (China)
Senvion (ex. Repower) (Germany)
What role is there for offshore wind power?
Offshore wind power represents only a small proportion of wind turbine installations worldwide. Furthermore, this market is still relatively undiversified geographically, since more than 91% of the sites are located within the European Union. This situation can mainly be explained by high costs (€130-150/MWh) due to the difficult installation conditions and the lack of economies of scale, since the offshore industry has as yet to reach maturity. Despite forecasts of lower costs, this technology should remain more expen-sive than onshore wind over the long-term, with projections around €100/MWh in 2020 and less than €90/MWh in 2030 according to the Global Wind Energy Council (GWEC).
Offshore wind nevertheless does have the advantage of not provoking land use conflict in areas where population density is high, and can thus meet specific needs in some areas.
Figure 24. Breakdown of annual onshore/offshoreinstallations
2008
0.3
0.51.3
0.31.5
0.9
2.1
0
10
20
30
40
50
60
Onshore Offshore
2009 2010 2011 2012 2013 2014
GW
26 38 35 40 45 31 48
Source: Mirova based on (GWEC, 2015).
2 I3 Solar
Much like wind power, the solar PV market historically took shape first in Europe, led by Germany and Spain, followed by Italy and France. Since 2011, China, the United States and Japan have begun developing their local markets, while Europe has seen its market fall dramatically, initially in Spain, then in Germany and Italy. China became the world’s leading market in terms of installed capacity in 2013. Solar power has seen an average growth of over 50% per year over the last ten years, and now represents 190 TWh, i.e. ~1% of electrical power generated world-wide.
Figure 25. Solar PV installation by region – net capacity
1996 2000 2004 2008 20120
5
10
15
20
25
European Union United States ChinaJapan Rest of the world
GW
Source: Mirova based on (BP, 2015).
Since solar PV costs are often higher than those of other energies, growth in the sector is essentially attributable to existing regulatory support, i.e., feed-in-tariffs, calls for tender, green certificates, tax credits, etc.
In terms of generation, there have been major changes over the last 10 years. Firstly, while the potential of various solar technologies (silicon, thin film, concentrated solar power) will remain uncertain over the next few years, silicon has clearly established itself as the front-runner. This convergence towards silicon is mainly due to falling prices for this technology thanks to the development of significant production capacities in China, but also owing to technological advances, which have improved panel efficiency (+30% in 10 years). Given these on-going developments, the downward pressure on costs is expected to continue, paving the way for this technology to achieve rapid growth.
Figure 26. Production costs for a solar module - 1976-2013
Source: Mirova based on (IEA, 2014).
0
20
40
60
80
100
1976 1990 2004
$/W
c

28
//////// Understand ////////
02010 2015 2020 2025 2030 2035 2040 2045 2050
100
200
300
$/m
Wh
400
Min/max Average
Figure 27. Estimated projections for solar generation costs
Source: Mirova based on (IEA, 2014).
The sector has experienced many crises in past years, with regulatory changes, overcapacity issues and, most of all, offshoring to Asia. This history calls for caution from an investment perspective. The drop in solar costs will certainly gradually reduce the need for regulatory support, thereby reducing the risks associated with legislative changes. However, competition between companies remains fierce and new technological breakthroughs can still affect companies in the sector.
We can distinguish between two main types of players in solar panel production: manufacturers of polysilicon, the raw material for solar panels, and manufacturers of the cells and solar modules.
Figure 28. Solar Modules
Source: Mirova based on (IEA, 2014).
Polysilicon Modules solaires
GCL Poly (China) Trina Solar (China)
Wacker (Germany) Yingli (China)
OCI (Korea) Canadian Solar (China/Canada)
REC (Norway) Jinko (China)
LDK (China) JA Solar (China)
Tokuyama (Japan) Sharp (Japan)
SunEdison (US) Renesola (China)
Daqo solar (China) First Solar (US)
Renesola (China) Hanwha (Korea)
Sunpower (US/France)
Industrial conglomerates are represented in italics
The producers of solar inverters, electronic components necessary for solar installations, also bear mention. These components can be produced by specialist companies such as the German company SMA, but also by industrial conglomerates such as ABB or Schneider Electric.
2 I4 Hydro, biomass and other renewable energies
Although wind and solar draw the lion’s share of investments, other renewable energies may have a role to play in reducing emissions.
2 I 4 I 1 Hydro
Hydroelectricity is the oldest and largest renewable energy source in terms of electricity generation. Globally, it represents more than 60% of the installed renewable power capacity, producing 3,890 TWh in 2014, or 16% of the word’s electricity. The production of hydroelectricity is relatively stable in the United States, Europe, the countries of the former USSR and Canada, where development has historically taken place. Most of the growth we see today comes from emerging countries, particularly China and Brazil.
Figure 29. Development of hydro generationby region 1965-2015
Source: Mirova based on (BP, 2015).
0
500
1 000
1 500
2 000
2 500
3 000
3 500
4 000
4 500
1965
TWh
1970
1975
1980
1985
1990
1995
2000
2005
2010
US
EU
ex-USSR
Canada
India
Brazil
China
Restof the world
Although development perspectives are now limited in OECD countries, where almost all exploitable sites are occupied, the development potential in other regions of the world is very high. If the 2°C scenario is to become a reality, hydroelectricity generation needs to almost double by 2040.
Figure 30. Development of hydroelectricity generation by region in a 2°C scenario by installation date
Source: Mirova based on (IEA, 2015).
OECD
0 1 000 2 000 3 000
China
Latin America
RoW
<1990 1991-2012 2013-2020 2021-2030 2031-2040
TWh

29
//////// Understand ////////
Developing hydroelectricity capacity does, however, present a few problems:
➜ Population displacement related to the construction of large dams,
➜ Environmental issues due to biodiversity losses, and even in certain cases, potential methane emissions from decomposing plants in flooded areas.
For these reasons, the management of certain major projects, particularly in China and Brazil, has been highly controversial. However, industry and investors, whether public or private, are increasingly sensitive to these issues, and standards, such as the Hydropower Sustainability Assessment Protocol, now exist to mitigate these risks.
While these problems require analysis on a case-by-case basis, hydro must be developed if the world’s climate objectives are to be achieved, and this development should benefit industry players.
Figure 31. Major hydro OEMs
Alstom /GE (France/USA)
Voith (Germany)
Andritz (Austria)
IMPSA (Spain)
Source: Mirova.
2 I 4 I 2 Biomass
Biomass is still the leading renewable energy. It is important to note that the large majority of biomass is used in developing countries, for cooking and heating, where combustion takes place in open fires or inefficient stoves. This traditional use of biomass poses several problems. First and foremost it has an impact on users’ health due to the toxicity of wood smoke in an uncontrolled environment. Furthermore, the low efficiency of combustion in open fires, ~10-20% compared to efficiencies of >70% for modern stoves, means the resource is used inefficiently. Outside of traditional uses, the remaining biomass consumption is divided among more modern residential uses (closed wood-burning stoves, pellet boilers...), industrial uses, electricity and heat production and, lastly, biofuel production.
From an environmental point of view, burning biomass emits CO2 at levels comparable or even higher than that of coal. Despite these emissions, biomass is generally considered carbon neutral, since the CO2 emissions during combustion correspond to atmospheric CO2 absorbed by plants during their growth. The carbon neutrality of biomass is frequently questioned, however, especially in the current context, where deforestation accounts for ~10% of global GHG emissions. Moreover, beyond the issue of calculating biomass CO2, converting the fuel resources in some cases entails a process that generates significant GHG emissions.
Finally, the development of biomass faces other challenges:
➜ Competition with food production, especially for the production of biofuels,
➜ Potential biodiversity loss related to deforestation,
➜ Consequences related to water use, energy use, intensive farming, applying nitrogen rich fertilizers, water pollution,
➜ Land use issues.
In the medium term, biomass can nevertheless play a role in reducing emissions, in particular through the heat recovery of waste biomass as well as 2nd generation biofuels. While heat recovery of biomass presents less of a problem than the current technology, there are still major technological challenges to overcome if these sources of energy are to reach maturity.
2 I5 Low carbon, non-renewable technologies
2 I 5 I 1 Smart Grids and batteries
Unlike traditional energy sources, solar and wind energy have the particularity of being intermittent and decentralised energy producers. Integrating these sources requires adapting existing electricity grids, which were historically designed to distribute centralised energy with a predictable generation profile. Managing this intermittent supply can be achieved in several ways.
➜ Demand side management: consumers are encouraged to adapt their consumption to changes in production. These mechanisms were historically developed to smooth peak demand using differentiated tariffs depending on the time of day, for residential users or via agreements with manufacturers to switch off their production capacity during peak demand. Given the difficulty of predicting changes in renewable generation, demand management requires more sophisticated technologies, capable of adapting demand dynamically. For example, some companies offer to manage air conditioning in such a way as to adapt to changes in supply.
➜ Supply management: A drop in renewable generation is offset by another generation method. Gas or hydroelectric power, very fast to turn on and off, can be used to offset the changes in generation supply. But the use of ‘back-up’ capacities implies a reduced use of power stations and therefore lower profitability. Today in Europe, renewable energies have grown dramatically and must be given priority in power generation. This development has led to a decreased use of gas power plants, making them significantly less profitable. Nonetheless, these plants are necessary to cope with the intermittent nature of renewable energies. Electricity suppliers that own thermal power stations are now pushing for a ‘capacity payment’ system, in other words: a payment for maintaining thermal plants as a back-up, even when they are not operating. This type of mechanism could increase the total cost of renewable energies.

30
//////// Understand ////////
➜ Developing storage Electricity is difficult to store on a large scale. Currently, the only way to store electricity on an industrial scale is pumped-storage, which involves pumping water downstream of a hydro-electric dam back up to reservoirs (99% of stored electricity). Global storage capacities are around a hundred GW, in other words, less than 5% of the world’s installed capacity. Developing these capabilities would make it possible to store surplus renewable power for later use. The development of electric vehicles is also making it possible to envisage adding new storage capacities to the grid itself: vehicle charging can be optimised to meet variations in supply. A portion of the charged electricity in vehicles could even be redistributed to supply the grid during dips in power generation. The development of electric vehicles has also resulted in falling storage costs with the emergence of battery storage solutions such as the Tesla Powerwall.
The principle behind the Smart Grid concept is to call on new technologies to inject more dynamic communication, more ‘smartness’ between the different components of the grid, i.e. the generation resources and users. The development of these smart grids will therefore help ensure that renewable energies are more effectively integrated, while limiting the risk of malfunctions or even blackouts.
2 I 5 I 2 CCS
The CCS (Carbon Capture and Storage) process involves capturing CO2 from fixed sources (fossil power plants, steel and cement production...) and storing it underground. These sources represent almost 40% of global GHG emissions. However, CCS is not suitable for distributed sources of CO2 emissions (transport, buildings). It also faces several challenges, which hamper development on a larger scale. These barriers fall into three categories:
➜ Technical: finding deep reservoirs and aquifers capable of storing CO2 requires a great deal of exploration. Making sure the reservoirs are watertight over long periods of time is also a technical challenge.
➜ Costs: While the capture and transport of CO2 rely on technologies whose costs are relatively well understood, there are still substantial uncertainties about the expense of underground storage. A CCS facility increases the cost of capital by 45% for pre-combustion capture (possible on combined cycle CCGT plants), and by 75% for post-combustion capture in classic power plants. We estimate that coal coupled with CCS could become competitive compared to natural gas without CCS from €35/t CO2. These economic conditions are unlikely to be achieved before 2025-2030 in Europe. The proper functioning and growth of the different carbon emission trading markets set up (EU, West Coast of North America) or currently being tested in China will be determinant in the spread of CCS technology.
➜ Social acceptability: many companies are worried about safety problems (leaks leading to contaminated water, soil, etc.), related to CO2 storage. The Netherlands and Sweden have therefore banned onshore CO2 storage. Germany is also facing strong resistance to this technology. More generally, many players consider it more relevant to invest in renewable energies to cope with the CO2 intensity of electricity generation.
2 I 5 I 3 Gas
As the carbon footprint for gas-fired electricity generation is half that of coal-fired electricity generation, it has a role to play in reducing CO2 emissions. In particular, in countries where coal has a predominant place in power generation, such as China and the United States, gas development perspectives are high.
Great care must nevertheless be taken in carrying out a complete environmental assessment of gas, especially since the risk of methane leakage can significantly worsen the carbon footprint for this solution. Furthermore, the development of non-conventional gas poses specific problems including groundwater pollution. Some players have demonstrated their ability to properly address these issues. These specific risks nevertheless require a case-by-case analysis of the companies concerned.
2 I 5 I 4 Nuclear
Nuclear energy is often presented as a solution in the fight against climate change. This technology has indeed the advantage of having a CO2 footprint close to that of renewable energies insofar as the fission reaction produces no GHG emissions. However, this energy has specific risks, notably:
➜ The risk of a nuclear accident. The accidents at Three Mile Island, Chernobyl and Fukushima have shown that nuclear accidents are possible.
➜ The management of high-level nuclear waste. As long-lived waste may remain dangerous for thousands, even hundreds of thousands of years, this also represents a massive challenge for the industry.
The lack of consensus on this technology has weighed heavily on the sector’s development for many years. Consequently, generation capacities have stagnated for almost a decade. In this context, the growth prospects for nuclear are questionable.
2 I6 Impact on the energy sector’s traditional companies
Aside from those suppliers providing solutions, on-going changes in the energy sector will have major impacts on the various other players along the value chain, in particular the energy and power companies.

31
//////// Understand ////////
2 I 6 I 1 Energy producers
For fossil fuel producers, reaching the established reduction objectives signifies that not all the fossil fuel reserves can be used. This restriction has major consequences for companies involved in the coal and oil industries.
CoalThe coal industry is that most exposed to the ‘stranded asset’ risk, since coal is the largest source of emissions. There are many alternatives for power generation, which is currently the main market for coal, encompassing both renewable energies and gas. We can already see this risk materialising in several regions.
➜ In Europe, the share prices of utility companies heavily exposed to coal, notably RWE AG, are already suffering from investor scepticism about the viability of their economic model in a context of renewable energy development.
➜ In China, the legislative framework is starting to address the subject, mostly through targets to scale down the use of coal.
➜ In the United States, the coal industry is suffering from a growing reliance on shale gas and increasingly stringent regulations on emissions for new plants.
OilThe oil sector is also affected by the risk of stranded assets. This concern is particularly pressing for oil companies with large positions in unconventional oil (e.g., Arctic, oil sands, shale oil), which could potentially be the most affected assets due to their high operating costs.
To date no major oil company has made any convincing attempt to factor in the constraints of a 2°C scenario. Growth prospects are still presented in a ‘business as usual’ context, and no commitment to a real change in strategy is evident.
2 I 6 I 2 Power producers
The rise in renewables also carries major changes for power companies. Injecting these new capacities has upset the prevailing economic balance. Given that renewables have priority on the grid, the rise of these capacities is reducing market share for players with little or no involvement in these technologies. Aside from renewable energies, political developments relating to nuclear energy following the Fukushima accident have had significant impacts, ranging from additional investment to strengthen the security of plants, and, especially in Germany, to plant closures.
Given this context, companies in the sector are being forced to change their strategies. For example, Engie (ex GDF SUEZ) chose to carry out a major depreciation on its gas power plants in 2014, and has stated that it aims to increasingly
redirect its investments towards the challenge of energy transition. The purchase of SolaireDirect in 2015 appears to be a new milestone in this strategy. In another major shift in strategy, E.ON announced its intention to focus on its renewable energy and grid businesses and create an independent company, Uniper, for nuclear and fossil fuel energies.
Consequently, the CO2 emissions of power companies seem to be a significant indicator in several respects. On the one hand, they provide information about companies’ sensitivity to introducing or strengthening a price for carbon. Furthermore, since this emission level is highly correlated with the share of renewables in the energy mix, it gives an indication of the company’s potential resilience when faced with the introduction of new renewable capacity, which will erode the market share of traditional energies.
Figure 32. Carbon intensity of Europe’s mainelectricity producers
Source: Mirova based on data from companies, 2013.
Drax
Gro
up
RWE
AG
Nat
iona
l Grid CE
Z
SSE
E.ON
AG
GDF
SUEZ
Vatte
nfal
l AB
Enel
Gas
Nat
ural
Sdg
Ende
sa
EnBW ED
P
A2A
Spa
Iber
drol
a
Fortu
m
Verb
und
AG EDF
TVO
Pow
er C
o
Stat
kraf
t
0
100
200
300
400
500
600
700
800
900gC
O 2/kW
h
3 I Mobility
3 I1 How to make mobility sustainable?
3 I 1 I 1 Mobility trends
‘Mobility’ is a crucial aspect of human development. Movement of freight and passengers makes it possible to provide access to services, as well as to lodging, work, healthcare, education, culture, etc.
Over the long term, it can be observed that modes of transport, both of passengers and freight, are evolving towards increasingly quick travel and covering increasing distances. In urban settings, access to mobility has made it possible for cities to expand, lengthening daily commutes. Over longer distances, rapid methods of transport by road and air, have thus increased their penetration in the structure of our societies to the detriment of rail, inland water and maritime transport.

32
//////// Understand ////////
Figure 33. Changes the in use of various transport modesover time
Source: Mirova, adapted from (Geelings, Shiftan, & Stead, 2012).
200
100
1850 1900 20000
km/yr and per capita
Walk, bicycle
Automobile
Rail Maritime Air
Bus
Road transport is expected to maintain its dominant position with increasing use of cars in the coming years. According to the IEA, over two million vehicles are expected to be in circulation in 2050, compared to around 900,000 in 2015 (OECD/IEA, 2015). In line with the strong correlation observed between mobility and economic development (Geelings, Shiftan, & Stead, 2012), emerging countries are now the ones seeing increasing strength with annual growth in motorisation rates for China and India of 10% and 7%, respectively, expected until 2030, compared to 0.6% for OECD member countries (Dargay, Gately, & Sommer, 2007).
However, the advantages of speed, comfort and flexibility that come with the use of a vehicle are countered by a high cost of possession, time lost in traffic, risk of accidents, and the inability to use transit time for other purposes (rest, work, entertainment). These disadvantages, combined with socioeconomic changes, have led to a simultaneous decrease in vehicle use by young adults in certain developed countries (IFMO, 2012). In the case of the United States, the number of miles per vehicle has been decreasing for more than ten years (State Smart Transportation Initiative, 2015).
3 I 1 I 2 Environmental impact of the sector
In terms of energy consumption and climate impact, transport accounts for:
➜ More than 14% of global emissions of greenhouse gases, i.e. 7.1 GteCO2 (IPCC, 2014);
➜ 28% of end-use for energy in 2012 (OECD/IEA, 2015);
➜ 50% of overall oil consumption, meeting 94% of the energy demands associated with transport.
The bulk of the demand for energy is related to road transport of either passengers or freight. Maritime transport accounts for 12% of this demand, primarily for freight transport, while air transport accounts for 11%, primarily for the passenger transport. Demand due to rail transport is marginal, accounting for 3% of consumption.
Figure 34. Transport energy consumptionand GHG emissions
Source: Mirova, according to (OECD/IEA, 2015; IPCC, 2014).
PassengerTransport
60 %
12 %5 %
Rail freight
Road freight
Maritime freight
Buses
Passenger vehicles
2- and 3-wheelers
Air
Rail
39 %
4 %11 %1 %
26 %
2 %
Energy demand : 105EJ/year (2012)
Direct and indirect greenhouse gas emissions (2010): 7.1 Gte CO2
Road
*’Other’ corresponds to electricity generation, pipeline transport and N2O and HFC emissions
Maritime
Air
Rail
Other*71%
11%
10%
2% 6%
Since 1970, energy consumed for transport has increased by 62% (OECD/IEA, 2015), while direct and indirect greenhouse gas emissions have multiplied by 2.5, also largely due to road transport. Without any action (6°C scenario), by 2015 transport energy consumption could increase by nearly 75%, whereas under a 2°C scenario, energy demand could stabilise around ~100 EJ.
Figure 35. Evolution of the distribution of global energy consumption by mode of transport
Source: Mirova, according to (OECD/IEA, 2012; IPCC, 2014; OECD/IEA, 2015).
Passenger vehicles
Transport energy demand (EJ/year)Direct and indirect greenhouse gas
emissions (Gte CO2/year)
Heavy vehicles 2- and 3-wheelers Maritime Air
Other* Direct and indirect greenhouse gas emissions
1970 1990 2010 20506DS
20502DS
20018016014012010080604020
0 0246810121416
Rail
* Other corresponds to electricity generation, pipeline transport and N2O and HFC emissions
3 I 1 I 3 Solutions for making mobility sustainable
There is a large range of possible solutions for reducing emissions from the transport sector. These solutions can be divided into four categories:
➜ Transform: transform the pool of personal vehicles from combustion-powered to electric, and fuels from diesel/petrol (gas) to alternative fuels. Although this pillar does not represent the greatest reductions in emissions in the short term, it holds potential for strong investment

33
//////// Understand ////////
opportunities in the long term due to the existence pure players in these technologies and the significant technological changes which are related to them.
➜ Improve: improve the energy efficiency of means of transport. These solutions represent the greatest potential for medium-term reduction. Nevertheless, even though the majority of players in transport have embraced a logic of continuous improvement, it is more difficult to identify companies that stand out in this pillar.
➜ Transfer: favour modes of transport that are energy-efficient in terms of energy consumed per unit transported. Over long distances, this pillar relies on technologies such as rail or maritime transport that, though often mature, offer potentially interesting development prospects due to their reduced carbon footprint in comparison to other modes of transport. In urban settings, the transfer is towards low-emission mobility (bicycles, walking, electric vehicles, metro systems, trams (light rail).
➜ Avoid: reduce the need for and/or distance of transit. These opportunities are increasingly related to behavioural changes encouraged by the rise of new technologies.
3 I2 Technologies for transforming mobility
Whatever the scenario adopted by 2050, road transport will continue to hold a significant place among means of transportation. The development of electric vehicles, in the broad sense, is a source of a radical transformation for the automobile sector – one that will make it possible to reduce greenhouse gas emissions in the long term. Transformation technologies, particularly second and third generation biofuels, are also necessary in order to achieve a 50% reduction in CO2 emissions in the aviation and maritime sectors.
3 I 2 I 1 Electric vehicles
The family of electric vehicles includes battery electric vehicles (BEVs), plug-in hybrid electric vehicles (PHEVs), range extender electric vehicles (REEVs) integrated into PHEVs, and fuel cell electric vehicles (FCEVs). These solutions offer the possibility, when used, of getting around without oil resources, without emitting CO2 or polluting locally, and without noise. However, from well-to-wheels, the carbon footprint of a BEV is more favourable the lower the CO2 emissions of the source of electricity generation.
These vehicles are supported by a strong political will in numerous European countries, China and the United States (CO2 regulations, subsidies/tax credits):
➜ In Europe, regulations stating that manufacturers must reach an objective of an average of 95 g of CO2/km by 2021 support the development of electric vehicles, plug-in hybrid vehicles and fuel cell electric vehicles by granting ‘super credits’, higher multipliers for vehicles that emit less than 50 g of CO2/km. In terms of incentives, many European countries offer subsidies or bonuses to consumers in order to promote electric vehicles.
➜ In the United States, comprehensive regulation also contributes to promoting this type of vehicle by allocating specific credits. Furthermore, subsidies/tax credits are allocated to manufacturers such as Tesla to develop their projects, and to consumers as a means of encouraging the purchase of electric vehicles.
➜ In China, the government plans to support the development of electric vehicles via state subsidies (currently 55,000 yuan, or ~7,500 euros) until 2020, and is conducting a strategy focused on development, design and local production.
Figure 36. Projected GHG emissions savings related to mobility in the context of an active reduction policy
20056
6,5
7,5
8
8,5
9
9,5
10
10,5
11
7
2010 2015 2020 2025 2030 2035
ElectromobilityTransform
Improve
Shift
Avoid
Biofuels
LNG
Friction resistance
Aerodynamics
Lightweighting
Efficiency of IC engines
Mode shift
Virtual mobility
Logistical improvements
GtCO
2
Source: Mirova, adapted from (IEA 2011; ICCT, 2012).

34
//////// Understand ////////
Electric vehicles are expected to succeed in progressively eliminating the need for this regulatory support. In a life-cycle approach, the whole-life cost of an electric vehicle is already comparable to that of a combustion-powered vehicle. Nevertheless, the additional cost remains a barrier to growth.
At the end of 2014, electric vehicles represented about one thousandth of passenger vehicles in circulation, with a stock of ~670,000 vehicles and over 300,000 annual sales (57% electric and 43% plug-in hybrid). To meet climate objectives, annual sales of electric vehicles, broadly defined, need to reach 7 million by 2020, with stock in circulation at 20 million. This involves a 69% annual increase in sales, compared to the 43% seen between 2013 and 2014.
Figure 38. Evolution of the electric vehicle market and stockin circulation until 2050 to meet climate objectives
Source: Mirova based on (OECD/IEA, 2012; IPCC, 2014).
02010
EV PHEV2011 2012 2013 2014
50 000
100 000
150 000
200 000
250 000
300 000350 000
Units sold
ICE
FCEVBEV
HEV
200018001600140012001000
800600400200
02010 2015 2020 2025 2030 2035 2040 2045 2050
Vehicle stock (in thousands) - Scenario 2DS
PHEV/REEV
In order to eliminate the need for regulatory support, the electric vehicle sector must still:
➜ reduce costs so that acquisition prices are competitive with the price of combustion-powered vehicles (internal combustion engine - ICE) of the same calibre;
➜ meet consumer expectations in terms of battery life.
These challenges present differently depending on the type of vehicle.
Battery electric vehicles (BEVs) and plug-in hybrid electric vehicles (PHEVs/REEVs)BEVs, PHEVs and REEVs currently account for the majority of sales.
BEV battery life does not present a real barrier to growth. In view of their environmental advantages during use and their battery life, which is currently limited to 150 km in most cases, BEVs are best suited for:
➜ urban settings, either as passenger vehicles or as part of car sharing systems;
➜ company fleets, for frequent use over short distances.
Furthermore, Tesla has recently shown that the battery life of a BEV can now exceed 400 km with NCA Li-ion batteries (85 kWh). PHEVs and REEVs also address this issue of battery life, since they make it possible to cross short distances (between 20 and 50 km) on electric power, while travelling long distances on fuel power with a carbon footprint that is up to ~40% lower. Lastly, the network of charging stations is increasing, with over one million stations in 2014. The costs of charging infrastructure are variable, ranging from ~1,200 USD at home to between ~50,000 USD and ~100,000 USD for outdoor fast chargers.
Now, the challenge is to make the technology more mature in order to reduce costs per kWh for storage batteries, optimise management of these batteries and, ultimately, make the economic equation of BEVs, PHEVs and REEVs interesting to drivers without state aid, as well as to manufacturers and suppliers. In less than five years, the cost per kWh
Figure 37. Well-to-wheels carbon assessment of electric vehicles in the primary sales zones (2014)
Source: Mirova according to (OECD/IEA, 2013; OECD/IEA, 2015).
Gasolin
e0
50
Well to plug/pump Plug/pump to wheels *Electric vehicle consumption of 0.15 kWh/km
Battery Electric Vehicles (BEV)*
100
g CO
2 /km
150
200
Diesel
Norway
Netherl
ands
United
States
Sweden
Denmark
France Ja
pan
United
Kingdo
m
German
yChin
a
Canad
aInd
ia
South
Korea

35
//////// Understand ////////
has already been halved to ~300 USD/kWh. The United States Advanced Battery Consortium (USABC LLC) set the objective of a cost of 125 USD/kWh in 2020. This objective seems very ambitious, and projections show that in 2020 Li-ion batteries are expected to cost between ~190 USD/ kWh and 250 USD/ kWh, depending on the technology (NCA, LFP, NMC). Cost reductions could also come from other technologies, such as lithium polymer batteries (LMP) which are already in use.
Aside from issues of energy storage, cost reduction in electric vehicles comes via improvements in the other key components, in particular:
➜ electric motors, permanent magnet synchronous motors and asynchronous motors with challenges in terms of not using rare earth elements and output,
➜ semiconductors to make the electronics in the vehicle more efficient.
Today, BEV sales are led by Nissan, Tesla, BMW and Renault, which dominate, even though the Chinese competition is accelerating with more than 80,000 vehicles sold in China in 2014. In the PHEV/REEV segment, the manufacturers with the greatest presence are Mitsubishi, Ford, BYD, Toyota and Chevrolet. As concerns cost reduction, solutions come from players in:
➜ battery storage, such as Tesla and BYD, in Li-ion batteries and Blue Solutions which is advancing in LPM batteries;
➜ electric motors, where Tesla also distinguishes itself along with other suppliers;
➜ semiconductors for the automobile sector, with NCP-Freescale at the head followed by Renesas and Infineon.
Fuel cell electric vehicles (FCEVs)The first FCEV models intended for large-scale development have been arriving on the market since 2015.
FCEVs do not have any use-phase CO2 emissions. Their entire carbon impact is due to production, distribution and hydrogen storage. From well-to-wheels, the carbon assessment of fuel cell electric vehicles is favourable in most cases. However, in view of the investments required for their development, progress is to be expected on this point. Today, 95% of the hydrogen produced comes from natural gas. From a CO2 perspective, the two solutions which appear the most promising are natural gas reforming and water electrolysis using an electric mix which emits little CO2.
The storage of hydrogen – in liquid, solid or gaseous form – presents certain challenges in terms of required volume, filling speed and cost, thermal management and weight. The gaseous form is preferred, but improvements are expected in order to reduce costs.
The transport and distribution of hydrogen do not present any particular barriers. Hydrogen can be distributed by service stations: there are ~150 service stations primarily in Japan, the United States and Germany.
Safety issues do not seem to present any barriers to significant development. As with other types of vehicles, FCEVs have their own particular risks. In the event of a leak, the most critical risks are those of fire and explosion. The challenge is to ensure that these risks are anticipated across the entire value chain. There are specific safety regulations for hydrogen.
Toyota, Hyundai and Honda, among manufacturers, and Air Liquide and Linde among hydrogen suppliers are the most involved in this segment at present.
3 I 2 I 2 Electric two-wheelers and buses
The use of electric power is increasing in other modes of transport beyond passenger vehicles.
➜ Two-wheelers: in 2015, 235 million electric two-wheel-ers are in circulation (OECD/IEA, 2015). This market, which is expanding in emerging zones (97% of the stock in China), is made up particularly of specialised players.
➜ Buses: in early 2015, 46,000 electric buses were in circulation, with 79% of these in China. In 2014, nearly 8,000 electric or hybrid buses were sold (more than 80% of these in China). Engine and battery technolo-gies are identical to those used for passenger vehicles. Battery life (~200 km) is not the real stumbling block in the case of urban buses – instead, it is the charging time. Ultra fast-charging systems are appearing on the market. These systems detect the buses, connect to them and, in several seconds, provide enough power for the buses to have sufficient battery life to reach the next stop. With specialised players and diversified companies such as Bolloré, Siemens and Bombardier, electric buses are increasingly attracting investments.
3 I 2 I 3 Alternative fuels
Alternative fuels represent about 5% of overall transport energy consumption (3% biofuels, 1% LPG and 1% CNG).
These fuels have the advantage of reducing harmful emissions, but their carbon benefit is random and sometimes limited, particularly for CNG and LPG:
➜ The use-phase CO2 benefit made possible by CNG (~20%) disappears from well-to-wheels with extrac-tion/processing, transport, distribution and compres-sion. Furthermore, CNG requires large reservoirs and a specific distribution channel.
➜ LPG emits less CO2 than petrol, but more than diesel. As it is the result of oil refining and natural gas pro-cessing, this fuel does not greatly diversify resources.
As for biofuels, two types are currently on the market for the automobile sector:
➜ Ethanol, in petrol (gasoline) engines, comes from sugar or starch crops.

36
//////// Understand ////////
➜ Biodiesel, in diesel engines, is a biofuel synthesised from rapeseed, sunflower, soy-bean and palm oil or animal fats.
GHG emissions are difficult to quantify, as they vary based on production methods (raw materials and quantity of fertilisers used, processing techniques, climate, soil quality), accounting methods, and the assessment of the impact of changes in land use.
Other difficulties include the first generation of biofuels running into competition with the food supply chain, a potential loss of biodiversity, consequences in terms of water and energy consumption, intensive cultivation, spreading of nitrogen fertilisers, and the necessity of having room in the soil as well as arable land.
Second and third generation biofuels make it possible to reduce dependence on petrol without infringing on the food supply chain. The CO2 assessment depends on the raw materials used. The second generation, obtained from lignocellulosic biomass, biochemically produces cellulosic ethanol, or thermochemically produces liquid fuels from biomass. Third generation biofuels are derived from algae. These technologies, which are still costly at present, have a role to play in the transition of mobility, particularly in air and maritime transport.
3 I3 Improving transport energy efficiency
Besides transformational technologies, solutions for improvement that target motor technologies and existing structures will help reach objectives for emission reduction.
3 I 3 I 1 Road transport
Regulatory incentives employed in numerous geographical zones (Europe, North America, China, Japan) in the past ten years have made it possible to significantly reduce the CO2 emissions of new vehicles.
These mechanisms have enabled reductions of about 30% for the most advanced manufacturers due to improvements in:
➜ The powertrain and transmission,
➜ The reduction of resistance forces (aerodynamics, tyre rolling resistance in the case of road transport, internal friction and rubbing, reduction in weight of structural elements).
While CO2 regulations have been significantly increased for passenger vehicles, heavy vehicles are largely exempt from restrictions on CO2 emissions.8 However, road freight accounts for 26% of transport energy demand, and its carbon footprint is significant. Increased regulatory restrictions on CO2 emissions from heavy vehicles are being explored in Europe, North America and Japan. Penalised by their size, shape and mass, heavy vehicles have few options in terms of reducing resistance forces. Only technologies for improving the performances of their diesel engines could provide significant improvements.
Improvement in powertrain and transmission efficiencyThe main technologies that make it possible to improve the efficiency of the powertrain and the transmission are:
➜ Engine downsizing, which involves making engines more compact;
➜ Common rail direct injection, which enables more precise management of combustion via electronic control systems;
➜ Optimisation of transmission systems via increases in the number of gearbox ratios, extending the highest gear or using semi-automatic transmissions.
8. The EURO IV, V and VI standards pertain only to non-CO2 pollutant emissions NOx, HC, CO, particulate matter.
Figure 39. Regulations on CO2 emissions for passenger vehicles
EUROPE95 gCO2/km-42% vs 2005
210gCO2/km
170
190
150
130
110
90
2005
2006
2007
2008
2009
2010
2011
2012
2013
2014
2015
2016
2017
2018
2019
2020
2021
2022
2023
2024
2025
MEXICO145 gCO2-17% vs 2008 BRAZIL
138 gCO2/km- 13% vs 2012
JAPAN 122 gCO2/km-28% vs 2005
CHINA117 gCO2/km-38% vs 2005
INDIA113 gCO2/km-27% vs 2005
SOUTH KOREA97 gCO2/km-50% vs 2005
US97 g CO2/km-47% vs 2005
CANADA97 g CO2/km-51% vs 2005
CANADAUS
EUROPE
JAPANCHINA
SOUTH KOREA
INDIAMEXICO
BRAZIL
Source: Mirova, based on (ICCT, 2014).

37
//////// Understand ////////
Other technologies such as electrifying auxiliary system management, improving motor thermal management and introducing start/stop systems could also contribute.
Furthermore, non-plug-in hybrid vehicles currently provide a 20% to 30% reduction compared to diesel, and 30% to 40% compared to petrol. However, these vehicles remain dependent on oil resources.
BMW, Nissan and Toyota are the leading manufacturers in the race to reduce CO2 emissions in the United States and Europe. On the supplier side, Continental, Valeo, Robert Boseh, Borgwarner, Magna and Delphi stand out for their solutions.
Weight reductionA reduction in vehicle weight can be achieved both by new designs (architectural changes, resizing, elimination of parts, thinning of structural elements, addition of ribs, etc.) and by including new materials that provide more resistance per mass unit, particularly high-strength steel and carbon fibre.
In the short term, particularly due to a significant price advantage, high-strength steel is expected to play an increasingly important role in the production of lighter vehicles. By 2020, high-strength steel should represent 15% to 20% of the total weight of constant steel-based vehicles. Advanced technologies with high-strength steel will come from expertise in steelmaking and hot pressing techniques (hot pressing is becoming increasingly difficult as steel becomes thinner and stronger).
Further on, technical advances in carbon fibre – a material with a higher potential for weight reduction – should reduce barriers to the development of this new technology and increase its large-scale inclusion in automobile production. Innovation is expected from manufacturers and producers of carbon fibre composites.
Solutions are coming from producers of hot-formed steel parts (Benteler, Gestamp), suppliers of hot presses (Schuler, APT) and manufacturers of carbon fibre composites (Hexcel, Torray).
Reduction of resistance forcesResistance forces can be reduced by:
➜ improving aerodynamics by reducing drag;
➜ reducing rolling resistance. The ground also creates resistance against a vehicle’s movement. Tyre suppliers offer tyres with increasingly low rolling resistance in order to reduce vehicle energy consumption. However, their margins for improvement are limited due to the existing restrictions on safety and lifespan. But suppliers have an important role in terms of resources: to diversify the sources of natural and synthetic rubber, and to strengthen the service economy to better manage the entire product cycle from design to recycling.
Renault made it possible to advance solutions in aerodynamics with the Eolab concept, and Michelin is known for its performance with tyre rolling resistance.
Figure 40. Potential for CO2 emission reduction allowed in internal combustion vehicles
Powertrain
Reduction ofresistance
Hybrid engine assistance
Downsizing coupled with turbocharging
Piezoelectric common rail direct fuel injection
Camless systems
Electric and telematics power steering
Start/stop system
Six-speed automatic transmission
Continuously variable transmission
Variable valve timing and variable poppet valve lift
Six-speed dual-clutch transmission (DCT)
Lightweighting
0% 5% 10% 15% 20% 25% 30% 35%
Reduction of rolling resistance
Aerodynamic improvements
Reduction of engine friction
Low-friction lubricants
Source: Mirova, based on (ICCT, 2014).

38
//////// Understand ////////
3 I 3 I 2 Air transport
The energy efficiency of aeroplanes has improved by about 33% since the early 2000s (IATA, 2015). The aviation industry set an objective of improving its energy efficiency by 1.5% per year, for carbon-neutral growth by 2020, and achieving a 50% decrease in CO2 emissions between 2005 and 2050. To reach these objectives, priorities in air transport are:
➜ Propulsion system efficiency;
➜ Reduction in the weight of structural elements and on board;
➜ Improving fineness9 and aerodynamic properties;
➜ Systems of air traffic management and operational changes.
Lastly, though the impact has not yet been clearly quantified, biofuels are also expected to contribute to reaching these goals from 2020 onwards.
Period Technologies
Increase in efficiency compared
to 2005
Present to 2020
Lightweighting: lighter aircraft furnishings and equipment (seats, cabins, trolleys (carts), slides)Aerodynamics: wings, longitudinal groovesOther improvements: management of energy consumption on board and green taxiing- -
6% - 9%
Propulsion systems: engine improvement (e.g. TRENT, LEAP-X engines)Weight reduction: inclusion of composite materials
9% - 20%
2015-2025 Propulsion systems: geared turbofan 10% - 21%
2020-2030
Propulsion systems: propfan or open rotor turbine engine Aerodynamics: laminar flow control system (HLFC) Other improvements: fuel cell use for on board energy managementTransformation/alternative fuels: second and third generation biofuels
27% - 40%
> 2030
Aerodynamics: flying wing aircraft Propulsion systems: radical change in engine technology Transformation/alternative engines: electric aircraft
> 50%
Figure 41. Technological leverage in the aviation industry
Source: Mirova based on (IATA, 2015).
These technologies are being developed by general manufacturers and suppliers such as Airbus, Bombardier, Boeing, Safran and Rolls-Royce.
3 I 3 I 3 Maritime transport
Although maritime transport emits the least CO2 among modes of freight transport, it nevertheless accounts for ~11% of transport-related emissions due to the significant volume of maritime trade (IPCC, 2014).
In order to limit this impact, the International Maritime Organisation (IMO) adopted measures in 2011 for improving the energy efficiency of maritime transport. The objective is a 50% reduction in CO2 emissions per tkm by 2050. Several technological and operational tools are to be deployed (ICCT, 2011) for propulsion systems, incorporation of electric engines, variable speed drives, on board energy management, ship size and design (hull, engine, propeller, energy recovery), and use of renewable energy and biofuels.
Besides the concerns about CO2, the sector need to make an effort to limit its impact on ocean acidification, emissions of sulphur and pollutants, and the introduction foreign species via ship ballast water.
3 I4 Development for the most efficient means of transport
From an environmental perspective, not all modes of transport have the same impact in terms of greenhouse gas emissions.
Figure 42. Direct CO2 emissions for passengerand freight transport (2010)
Source: Mirova based on (IPCC, 2014).
300
250
200
150
100
50
0Rail,
underground, tramway
Bus Passengervehicles
2- and 3-wheelers
Air
1400
1200
1000
800
600
400
200
0Rail -
electric train
Direct emissions gCO2/tkm
Direct emissionsgCO2/pkm
Rail - diesel train
Maritime -Freight
Heavy-duty vehicles - large
Heavy-duty vehicles - small
Among modes of passenger transport, air and road transport emit the most CO2. The relatively small difference between aeroplanes and automobiles is explained, in part, by the load factor. One of the areas needing work to contribute to energy transition is the search for alternative modes of transport to significantly reduce the use of motor vehicles with a single passenger. This would be a move towards metro systems and buses in urban settings and trains and coaches over longer distances. As maritime transport represents only a marginal share of passenger transport, it is not depicted in the figure above.
9. Fineness is equivalent to the lift to drag ratio.

39
//////// Understand ////////
Freight transport represents ~30% of transport energy consumption (IEA, 2008), 82% of which is for lorries (trucks). Road transport emits significantly more CO2 than rail and maritime transport. However, small boats have a significant carbon footprint, which necessitates ways to group deliveries and optimise fleet management. As regards air transport, while emissions per tonne transported are very high, this mode of transportation accounts for a marginal share of freight transport.
In view of these differences in emission levels, developing the modes of transport which emit the least CO2 seems to be one possible solution for reducing emissions from the sector.
3 I 4 I 1 Passenger transport
Urban settingsIn urban settings, public transport remains the main alternative for limiting daily time spent commuting to an acceptable level (the maximum acceptable level, also called Marchetti’s constant, is around one hour per day). This segment will continue its development in the years to come. The International Association of Public Transport (UITP) has thus set the objective of doubling the use of public transport by 2025 in urban commutes. This increase will largely be carried by China, India, South America and the Middle East (UITP, 2014).
Furthermore, increasing use of bicycles also appears to be a possible response, providing both environmental and health benefits (exercise and avoiding local pollution and noise). This could be developed through bike sharing schemes, which would also help strengthen the integration of bicycles into cities. Nearly 900 bike sharing systems have appeared in the past 15 years in Europe, the USA, Asia and Brazil.
Outside the urban perimeterJust as an acceptable duration of transport per day has been identified in urban settings, a critical distance of between 800 and 1000 km has been defined as decisive in choosing between train or road transport and air transport. Rail transport and public road transport offer viable alternatives to air transport for these lesser distances.
Rail transport, emitting nearly three times less CO2 than air transport and growing via high-speed lines, poses the greatest threat to short- and medium-haul flights for several reasons: an equivalent total duration, price advantages, and the relative proximity of train stations to city centres compared to airports. Nearly 32,000 additional kilometres of high-speed lines are planned or being built, including over 22,000 in China. Moreover, trains are increasingly fast and are now able to reach speeds of over 300 km/h. Although certain integrated players like Siemens, Alstom and Bombardier still have opportunities for growth, nearly 40% of the market is held by Chinese manufacturers.
A liberalising current in the motor-coach market provides new prospects in public ground transport. This liberalisation
makes it possible for private operators to run bus lines within national territory, thus leading to the emergence of prospects for significant growth in direct competition with automobile, rail and air transport. Several countries, such as the United Kingdom (1980), Argentina (1990), Norway (2003), Sweden (2012), and more recently Germany (2013) and France (2015) have thus liberalised their markets. Global demand for coach transport is expected to increase by 5% annually, reaching 664,000 units by 2018 (Freedonia, 2015).
3 I 4 I 2 Freight transport
Freight transport represents 40% of transport energy consumption (OECD/IEA, 2015). Points of action for freight transport are:
➜ growth of the proportion of rail and maritime transport among overall transport,
➜ inclusion of electric vehicles in road transport for short distances,
➜ traffic flow optimisation using information and communication technologies,
➜ development of multi-modal solutions.
3 I5 Avoid
3 I 5 I 1 ICT and mobility
Information and communication technologies contribute innovations in terms of ‘alternative or non-physical mobility’ via telecommuting, conference calls and video conferences, and shared home delivery of shopping. These avoidance solutions are very recent, and their impact is unmeasured. The use of GPS and flow management systems also make it possible to avoid useless commutes.
3 I 5 I 2 Shared services
Within cities, a car is unused and stopped 95% of the time on average (Ademe, 2014). In view of this fact, car sharing, which enables an individual or company to use a vehicle for a short period of time, addresses the evolution of society towards a less costly service economy. In less than 10 years, car sharing has seen accelerated development, growing from 11,500 vehicles in 2006 to 92,200 globally in 2014. Through 2020, the outlook is also favourable, with annual market growth of 30%. This dynamism is leading to the arrival of numerous players on the market, often then purchased by automobile manufacturers who are aware of the changes coming to their sector’s business model.
Ridesharing, which makes it possible to share a vehicle with others for occasional or regular trips, could also be used on a daily basis for commuting or occasionally for travel. Whether used for economic reasons or to make social connexions, ridesharing has also given rise to new business models.

40
//////// Understand ////////
3 I6 Summary of key players in sustainable mobility
Company Country Market cap mUSD)) Transform Improve Avoid
Tesla Motors Inc. United States 31,262Batteries : Gigafactory factory to reduce costs per kWhEV: pure player
Weight reduction: CFRP shells
Toyota Japan 199,103
PHEV: 0.2% of auto revenueFCEV: launch of Mirai model in Japan in late 2014 (cost: ~50,000 euros) – production goal of 700 to 3,000 units in 2017 - United States and in Europe in 2015
ICE: Top 5 performances in the United States and Europe
Car sharing: Creation of Ha:mo in 2014 (Japan, France) for individuals
BMW AG Germany 59,999 EV: 0.8% of automobile activity and the produc-tion chain dedicated to i3 and i8 electric vehicles
ICE: Top 5 CO2 performances in the United States and Europe CFRP: composites solutions - specific production
Car sharing: AlphaCity since 1997 for companies (13 countries) and DriveNow with Sixt since 2011 for individuals (4 countries)
Nissan Motor co Ltd. Japan 39,913 EV: 1.1% of automobile activity and leader
in terms of sales in 2014ICE: Top 5 CO2 performances in the United States and Europe Car sharing: Choimobi Yokohama
BYD Co Ltd. China 15,695
Li-ion batteries (LIB): 9% of 2014 revenue - prospect of ~5% of the market in 2017 EV/PHEV: leader in terms of EV and PHEV sales in China (3.4% of 2014 revenue in PHEVs) Electric buses: partner of Transport For London (UK) and 1% of the market in 2014
Renault SA France 25,328 EV: - 0.4% of automobile activity - strategy oriented towards electric vehicles
Aerodynamics: Eolab - concept car with a drag coefficient 30% lower than that of an equivalent vehicle
Kandi Technologies Group, Inc China 300 EV: 88% of 2014 revenue related to EVs Car sharing: 14,400 BEVs (Kandi
EV CarShare)
General Motors Co United States 45,326 REEV: 0.4% of automobile sales via the Volt model (Chevrolet)
ZotyeHolding Group Co Ltd. China Unlisted EV: leader of sales in China in 2015
Hyundai Motor Co South Korea 26,897 FCEV: launch of the ix35 Fuel Cell model (cost: ~60k euros) in Europe in 2013 - major series by 2020
Daimler Germany 88,433 Car sharing: Car2go and Ca2gether (~15 countries)
PSA Peugeot Citroën France 14,220
Car sharing: Citroen MultiCity, Mu/Peugeot Rent and Share your fleet with Sixt
Company Country Market cap (mUSD) Transform Improve
Magna Canada 20,292 EV : range of products for electric and hybrid vehicles, including packs of Li-ion batteries (exposure not calculated)
AHSS: Parts made from hot-formed steel ICE: solutions for improving vehicle energy efficiency
Continental AG Germany 43,530EV : permanent magnet synchronous motors and asynchronous motors - 1 of the 5 segments of the powertrain BU (19% of 2014 revenue)
ICE : Solutions for improving vehicle energy efficiency
Delphi Automotive plc United States 21,269 EV: range of products for electric and hybrid vehicles (exposure not calculated) ICE : Solutions for improving vehicle energy efficiency
Valeo France 10,317 EV: electric propulsion in the propulsion systems segment (26% of 2014 revenue) ICE : Solutions for improving vehicle energy efficiency
Robert Bosch GmbH Germany Unlisted EV: semiconductors ICE : Solutions for improving vehicle energy efficiency
Denso Japan 38,542EV: range of products for electric and hybrid vehicles in the powertrain segment (35% of 2014 revenue) EV recharging systems: suitable infrastructure
Michelin France 15,730 Tyres: rolling resistance, tyre design/recycling, lorry tyre rental system
NXP - Freescale Semiconductor Pays-Bas 21,837 EV: 12.9% of the market in 2014 (merger in June 2015)
Borgwarner United States 9,953 ICE : solutions for improving vehicle energy efficiency (transmissions)
Renesas Electronics Corporation Japan 9,362 EV: 10.4% of the market in 2014 (~3,021 MUSD revenue
in 2014)
Emerson United States 30,917 EV: electric engines (6% of 2014 revenue via the affiliate Leroy-Somer)
Infineon Technologies Germany 10,772 EV: 9.3% of the market in 2014 (~2,700 MUSD revenue in 2014)
Automobile suppliers
Automobile manufacturers

41
//////// Understand ////////
Company Country Market cap (mUSD) Transform Improve
Magna Canada 20,292 EV : range of products for electric and hybrid vehicles, including packs of Li-ion batteries (exposure not calculated)
AHSS: Parts made from hot-formed steel ICE: solutions for improving vehicle energy efficiency
Continental AG Germany 43,530EV : permanent magnet synchronous motors and asynchronous motors - 1 of the 5 segments of the powertrain BU (19% of 2014 revenue)
ICE : Solutions for improving vehicle energy efficiency
Delphi Automotive plc United States 21,269 EV: range of products for electric and hybrid vehicles (exposure not calculated) ICE : Solutions for improving vehicle energy efficiency
Valeo France 10,317 EV: electric propulsion in the propulsion systems segment (26% of 2014 revenue) ICE : Solutions for improving vehicle energy efficiency
Robert Bosch GmbH Germany Unlisted EV: semiconductors ICE : Solutions for improving vehicle energy efficiency
Denso Japan 38,542EV: range of products for electric and hybrid vehicles in the powertrain segment (35% of 2014 revenue) EV recharging systems: suitable infrastructure
Michelin France 15,730 Tyres: rolling resistance, tyre design/recycling, lorry tyre rental system
NXP - Freescale Semiconductor Pays-Bas 21,837 EV: 12.9% of the market in 2014 (merger in June 2015)
Borgwarner United States 9,953 ICE : solutions for improving vehicle energy efficiency (transmissions)
Renesas Electronics Corporation Japan 9,362 EV: 10.4% of the market in 2014 (~3,021 MUSD revenue
in 2014)
Emerson United States 30,917 EV: electric engines (6% of 2014 revenue via the affiliate Leroy-Somer)
Infineon Technologies Germany 10,772 EV: 9.3% of the market in 2014 (~2,700 MUSD revenue in 2014)
Company Country Market cap (mUSD) Transform Improve
GS Yuasa Japan 1,529Li-ion batteries: -~6% of the market in 2017 - 84% of 2014 revenue
Blue solutions France 712LMP batteries: - 100% of 2014 revenue - 2014 revenue: 57 MEUR
Umicore Belgium 4,473Li-ion batteries: Cathodes and recycling within theRechargeable Battery Materials BU, included in the Energy Materials segment (~19% of 2014 revenue)
Weight reduction: 10% of revenue in CFRP
Albemarle Corporation United States 4,974
Lithium supplier: acquisition in 2015 of Rockwood Holdings, Inc, holding company of Rockwood Lithium (~32% market share in 2014) / 14% of Q2 sales in 2015
Sichuan Tianqi Lithium Industries China 2,221 Lithium supplier: ~20% market share in 2014 / 11%
of 2014 revenue
SQM (Sociedad Quimica y Minera de Chile SA) Chile 5,268 Lithium supplier: ~26% market share in 2014 / 10.3%
of 2014 revenue
Storage batteries
Company Country Market cap (mUSD) Transform Improve Transfer
Air Liquide SA France 41,323Hydrogen: creation of the label Blue Hydrogen® to decar-bonise the production of hydrogen; > 60 distribution stations (USA, Japan, France, Germany, Denmark, Netherlands)
Linde AG Germany 32,110Hydrogen: objective of 100 stations in Japan (end of 2015), 70 in the United States (end of 2016), 50 in Germany (end of 2015))
Siemens Germany 87,663 Electric buses: LIFE+ / BeeBus project with the eBRT developed with PVI
Rail : revenue of 10% / 12% of the market
ABB Switzerland 87,663EV charging systems: exposure not calculated Electric buses: ultra fast-charging systems (TOSA project-city of Geneva)
Ship energyefficiency: portfolioof solutions
Schneider Electric France 36,777 EV charging systems: exposure not calculated
PVI France Unlisted
Electric buses: creation in 2013 of an affiliate in China for local demand for traction motors for heavy electric vehicles; LIFE+ / BeeBus project with the eBRT developed with Siemens (exposure not calculated)
AeroVironment United States 559 EV recharging systems: 15% of 2014 revenue
Car Charging Group Inc.
United States 23 EV recharging systems: 100% of 2014 revenue
Legrand France 15,293 EV charging systems: exposure not calculated
Company Country Market cap (mUSD) Transform Avoid
Volvo AB Sweden 23,193Electric buses: 12% market share in 2014; Project Life+: rechargeable hybrid bus, 7,900 being tested in Gothenburg, able to move 7 km on battery life and recharge in 7 minutes
Car sharing: Volvo Sunfleet Car Sharing AB created in 1999 (85 MSEK revenue)
Polaris Industries Inc. United States 8,642 Electric two-wheelers: via Brammo Inc. - exposure not calculated.
VDL Bus & Coach Netherlands UnlistedElectric buses: CITEA SLF Low-Floor electric (flexibility between 200 km of battery life or rapid charging (via catenary, induction, mains) - exposure not calculated
Zhengzhou Yutong China 6,654 Electric buses: 19% market share in 2014; potential partner of the RATP (France) - exposure not calculated
Ebusco Netherlands Unlisted Electric buses: pure player; 300 electric buses since 2010; potential partner of the RATP (France)
Jiangsu Xinri E-Vehicle Co Ltd. China Unlisted Electric two-wheelers: Pure player
Zero Motorcycles Inc United States Unlisted Electric two-wheelers: Pure player
Other electric motorisation
Industry

42
//////// Understand ////////
Company Country Market cap (mUSD) Transfer Avoid
Giant Manufacturing Taiwan 2,892 Bicycles and bicycle parts: pure player
Merida Industry Taiwan 1,757 Bicycles and bicycle parts: pure player
Shimano Inc. Japan 12,323 Bicycles and bicycle parts: 83% of revenue
Accell Group Netherlands 549Bicycles and bicycle parts and electric two-wheelers: pure player
Zhonglu co Ltd-a China 2,165 Bicycles and bicycle parts: 88% of revenue
Comuto SA France Unlisted Car sharing and ridesharing: creation of Blablacar in 2006, over 20 million members, present in 19 countries
CycleHop Unlisted Bike sharing: pure player
Nextbike Germany Unlisted Bike sharing: pure player
Smoove France Unlisted Bike sharing: pure player
Comovee Germany Unlisted Car sharing and ridesharing: creation of Comovee in 1986, 180,000 members (5 countries)
Ezee kinetics China Unlisted Electric bicycle: pure player
Cratoni United States Unlisted Cycling safety: pure player
Company Country Market cap (mUSD) Transform Transfer
CRRC Corp Ltd (CNR / CSR) China 47,094Electric buses: over 1,000 orders received for the ultra fast-charging electric bus developed by CSR Zhuzhou Electric Locomotive Research Institute Co., Ltd.
Rail: 100% of revenue, 37% of the market (2013)
Alstom France 10,017 Rail: 100% of revenue, 11% of the market (2013)
Ansaldo STS Italy 2,126 Rail: 100% of revenue
CAF Spain 1,092 Rail: 100% of revenue, 3% of the market (2013)
Faiveley Transport France 1,537 Rail: 100% of revenue
Talgo Spain 888 Rail: 100% of revenue, 2% of the market (2013)
Vossloh AG Germany 949 Rail: 100% of revenue
China Railway Signal & Com-h China 6,842 Rail: 100% of revenue
(rail signaling)
Eurolines Belgium Unlisted Coaches: group of nearly 30 coach operators in Europe (leader)
FlechaBus Argentina Unlisted Coaches: created in 1984
MegaBus United Kingdom Unlisted Coaches: created in 2008
Transmashholding Russia Unlisted Rail: 100% of revenue, 4% of the market (2013)
Urban solutions
Public transport

43
//////// Understand ////////
Company Country Market cap (mUSD) Improve
Hexcel Corp United States 4,624 CFRP: solutions - carbon fiber composites to lighten structures, primarily in the aeronautics industry and eventually automobiles.
Schuler AG Germany 971 AHSS: hot presses and coiling machines to produce advanced high-strength steels
SGL Carbon SE
Germany 1,510 CFRP: carbon fibre (22% of revenue) - carbon fibre composites
Company Country Market cap (mUSD) Transform
Solazyme Inc. United States 245 Biofuels (3G): pure player in algae-derived biofuels
Algae.Tec Ltd. Australia 7 Biofuels (3G): pure player in algae-derived biofuels
Inbicon Denmark Unlisted Biofuels (2G): pure player in biomass ethanol production
Iogen United States Unlisted Biofuels (2G): pure player in processes for bioethanol production from agricultural waste
Company Country Market cap mUSD) Transformer Improve Transfer
Rolls RoyceUnited
Kingdom 20,841 Propulsion: TRENT and eared turbofan (Ultrafan) enginesShips: energy efficiency
Safran France 31,490 Propulsion : LEAP-X et Open-Rotor Consommation à bord : APU/Green Taxiing
Airbus France 50,122 Electric aircraft: regional electric aircraft (E-Fan)
Weight reduction:CFRP Aerodynamics: HLCF
Bombardier Canada 2,057Electric buses: Primove (inductive energy transfer between the pavement and vehicles)
Weight reduction and aerodynamics: portfolio of solutions
Rail: 47% of revenue / 9%of the market (2013))
Zodiac Aérospace
France 8,994 Weight reduction: lighter componentsOn board consumption: via a fuel cell
Aerospace and defence*
Advanced materials
Second and third generation biofuels
Logistics
Company Country Market cap (mUSD) Transform Improve Avoid
Bolloré France 15,429Electric buses: BlueBus (electric buses); Bluetram (trolley that can charge at each station, 100 Bluetrams/year in 2015 and 200 after) EV: Bluecar
Car sharing: AutolibLogistics systems: IER
AP Moeller Maersk
Denmark 35,531 Ships: energy efficiency
Logistics systems: optimisation
Deutsche Post AG Germany 32,726 Logistics systems: optimisation
Fleetmatix United States 1707,9 Logistics systems: optimisation
* Players with significant exposure to defence are not included in Mirova’s Investment universe due to a lack of disclosure regarding their export policies.

44
//////// Understand ////////
4 I Buildings
4 I1 Buildings and the Environment
4 I 1 I 1 Trends in the building sector
All over the world, adequate shelter is a necessary prerequisite for a decent life. Indeed, housing is essential for meeting primary human needs such as safety, hygiene, health and wellbeing.
In OECD countries today, 80% of the population, on average, lives in cities. This number is likely to increase slightly in the coming years, and is expected to exceed 85% by 2050. Despite lingering housing issues, however, the existing housing stock is sufficient to accommodate nearly the entire population. Since demographic growth in the OECD area is expected to remain relatively stable, the main trends observed are related primarily to the increased comfort and surface of homes.
As a result, the construction industry is clearly turning to non-OECD regions, where both population and urbanisation are increasing dramatically. The urbanisation rate in non-OECD regions is expected to shift from approximately ~45% today, to somewhere around ~60% by 2050. The greater population density in these areas due to these shifts leads to an increase in the number and size of slums, raising health issues for these countries. In 2010, about one third of urban populations in developing countries lacked access to decent housing (UNHSP, 2010).
Figure 43. Residential space occupancy trends per capitaby region
Source: Mirova based on (IEA, 2014).
m2 /p
ers
0
20
2000 2011
United States European Union China
2025 2000 2011 2025 2000 2011 2025
40
60
80
100
4 I 1 I 2 Environmental impact of the building sector
The building sector accounts for more than 30% of global energy consumption and nearly 20% of greenhouse gas
(GHG) emissions. Both figures have been steadily increasing since the 1970s. Energy demand for this sector could well increase another 50% by 2050 (IEA, Transition to sustainable buildings, 2013).
Figure 44. Carbon emission profiles by building typeand lifecycle stage
Source: Mirova.
Traditional building New building(low energy)
Carb
on im
pact
Construction Use
Note: Numbers are average figures for all types of buildings (residential and commercial). LCA studies were conducted over a period of 100 years and fac-tored in usage and materials, according to a schedule of 85%-15% for existing
buildings and 50%-50% for low consumption buildings.
In a life cycle approach, use represents the bulk of energy consumption, ~80% for traditional buildings, which still constitute a very large majority of the existing housing stock. Construction itself and material manufacturing represent together only approximately 20% of total emissions. Emissions linked to the construction of recent low-consumption buildings are relatively close to those of traditional buildings.
Impact of occupation phase on total emissionsEnergy uses in the building sector have evolved considerably from the beginning of the industrial era to the first oil crisis and the first thermal regulations that accompanied it. Energy consumption profiles vary considerably according to uses, geographic areas, sub-sectors and the age of the buildings.
By regionIn developed countries, thermal comfort (heating and air conditioning) accounts for the bulk of energy consumption although its proportion of consumption has decreased somewhat since the first thermal regulations were introduced. The pattern of energy consumption in China and other emerging countries are converging towards similar trends. Energy in developing countries is, however, largely employed for cooking and domestic hot water, and traditional biomass use is still prominent. In some regions, cooking and domestic hot water represent almost the entirety of energy consumption.

45
//////// Understand ////////
Figure 47. Share and consumption of buildings in kWh/m²/year by construction period, Paris
Source: Mirova based on (APUR 2007).
Construction period
befor
e 180
0
1801
-1850
1851
-1914
1918
-1939
1945
-1967
1968
-1975
1976
-1981
1982
-1989
1990
-1999
2000
and m
ore
kWh ep
/m2 ye
ar
45010%
15%
49%
9%5%
3%
2%2%
4%
1%
400
350
300
250
200
150
100
50
0
Figure 45. Energy consumption by use in major world regions 2000/2011
Source: Mirova based on (IEA, Tracking clean energy progress 2014).
US, EU andother OECD
2000 2011 2000 2011 2000 2011
China and Othernon-OECD
Inde, Middle Eastand other dev.
Asia
Appliances and other
Cooking
Lighting
Water heating
Space cooling
Space heating
EJ
Appliances include ‘brown’ goods (information & telecommunications devices, audio-visual equipment and cooking appliances) and ‘white goods’ (appliances
such as washing machines, refrigerators, dryers, freezers etc.).
Contribution to the energy transition therefore, involves both an optimisation of the housing stock in developed countries, and the use of more efficient cooking appliances in the developing world.
By sectorTwo types of buildings are generally distinguished: residential buildings and commercial real estate.
Residential buildings represent, on average, two thirds of energy consumption of the entire sector. While commercial buildings are prevalent in OECD countries, where they constitute ~40% of energy consumption, their share in other regions remains relatively small, at less than 20%. Although energy consumption patterns in commercial and residential buildings differ slightly, the latter being skewed toward operation of appliances and fittings, control of indoor temperatures remains a central issue for both.
Figure 46. End-use energy consumption in residentialand commercial buildings by region (2010)
Source: Mirova based on (IPCC 2014).
India, Middle Eastand other dev. Asia
12 MWh/cap/yr
Residential Commercial
6 MWh/cap/yr 56.9 MWh/cap/yr
China andOther non OECD US, EU and Other OECD
39%
61%82%88%
18%12%
By date of constructionThe date at which a building was constructed is a determining factor in its energy consumption. Each historical period has relied on its own specific construction methods and favoured materials, and is thus associated with a particular average consumption level. The introduction of thermal regulations has given rise to new expertise and increased demand for lower consumption buildings. As a result, the energy consumption of new buildings has shown a gradual decrease from nearly 400kWh/m2/year to 50kWh/m2/year. Over the last decade, the building industry has demonstrated its ability to deliver structures that are self-sufficient in terms of energy consumption.
Worldwide, however, a majority of the housing stock, whose lifetime ranges from 20 to 150 years, on average, was built before thermal regulations. The figure below illustrates how the problem of building age affects the existing housing stock and associated energy consumption patterns, using the example of Paris, where most construction took place between 1851 and 1914, and overwhelmingly exhibits low energy performances.
Controlling impact: improving practices in the construction sectorAlthough environmental impacts are primarily due to the occupation phase because of duration, construction impacts are by no means negligible. Construction-related

46
//////// Understand ////////
consumption is mostly attributable to the production of building materials, mainly concrete and steel, which remain the most widely used materials worldwide. Improving the manufacturing processes for both seems to have reached a limit (cf. Part 5, Industry). Therefore, apart from substituting these materials with lower-impact alternatives such as wood,10 the available levers appear to be limited.
4 I 1 I 3 Changes driven by regulations
Today, programmes for GHG reduction have been established for the building sector, with ever more stringent regulations dictating higher targets.
Countries in the European Union have been the first to take action, setting goals for carbon emissions reduction by developing regulatory frameworks, which now require performance in the area of 70 kWhep/m2/year on average for new buildings. Although the European Union still serves as a role model, the US, China and India have, since 2015, entered into a partnership (APPCDC)11 and integrated a set of directives in their building codes. The aim of these provisions is to provide guidance for new construction in order to improve energy performance, take the life cycle of buildings into consideration, and integrate water and waste management while ensuring the social dimensions of comfort and hygiene. Looking ahead to how norms are likely to evolve, the work so far of existing certifying agencies, both in Europe (BEPOS, Minergie, PassivHaus) and elsewhere (Net Zero Energy Building or NZeb) paves the way for future legislation. Provisions applicable to construction and renovation will likely set energy consumption standards existant for both new and existing buildings.12
Most regulations to date, however, focus on new construction. Achieving objectives for reducing energy consumption will require that renovations to achieve energy efficiency be drastically accelerated, a problem legislators have for the most part avoided.
Alongside regulatory developments, voluntary actions are beginning to take shape, spearheaded by ’operational’ players: real estate companies, which own most commercial buildings, and construction groups. The latter take advantage of various environmental certifications such as LEED in the US, BREAM in the UK, HQE in Franceå, Energy Star in Australia, CASBEE in Japan, HK BEAM in China, SB Tool in Canada and GRIHA in India to highlight the environmental performances of new or existing buildings.
4 I 1 I 4 How can the building sector be rendered sustainable?
Energy transition toward lower emissions is contingent on an improvement in the energy performance of new constructions and equipment, as well as a transformation of existing buildings that involves renovating all relevant components. Opportunities for achieving these goals fall into three main categories:
➜ Insulating buildings, existing and new,
➜ Improving efficiency and reducing the emissions of indoor air management technologies (heating and air conditioning),
➜ Increasing the efficiency of fittingd and appliances used on a daily basis.
Figure 48. Breakdown of energy savings in residentialbuildings under an active reduction policy
Source: Mirova based on (IEA, 2012).
2 600M
toe
Energy demand Activity
Insulation
Internal airmanagement
Appliances& fittings
Reference scenario
2°C scenario
Insulation
Space heating
Cooling
Appliances
Lighting
Water heating
2 500
2 400
2 300
2 200
2 1002010 2015 2020 2025 2030 2035
4 I2 Improving buildings’ insulation
Thermal insulation and building airtightness are means of sealing out external draughts in order to maintain stable indoor temperatures. Efficient insulation depends on:
➜ Management of thermal bridges, i.e. areas in the building where the insulating barrier is breached (e.g. by the junctures of different materials, such as floor thresholds, lintels above windows and balconies), via efficient insulation of walls (~35% of energy loss), roofs (~25%) and floors (~15%);
➜ Improvement of thermal resistance at openings (~25% of energy loss), in particular windows and doors, but also through selection of ventilation mechanisms (double flow with heat recovery).
10. Wood is a recognized environmental strong point as it is seen as a ‘carbon sink’. It emits only 50kg CO2/t, compared to 1.8 tCO2/t for steel and 100 to 150 kgCO2/t for concrete. Wood-based construction systems therefore have a 10 to 20% lighter carbon footprint than concrete-based systems. 11. Asia-Pacific Partnership on Clean Development and Climate. 12. In France, for instance, the RT2020 is considering making energy-positive building, or BEPOS, a scheme devised by the RBR working group (Regulations for Responsible Building). These regulations assume a 15% improvement in energy performances for new construc-tion. A massive renovation effort should begin in 2025, with mandatory energy renovation for all privately owned residential buildings whose consumption exceeds 330 kWh/m²/year, with expectations of a one-class improvement every 8 years (according to the Energy Performance Certificate labelling A, B, C, D, E, F or G) and the goal of Low-Energy House (i.e. 50KWh/m²/year for new construction and 80kWh/m²/year performance for existing buildings, including heating, domestic hot water, air conditioning and lighting consumption) by the third or fourth iteration according to the ‘loi Royal sur la transition énergétique (Royal law on the energy transition) of May 26th 2015).

47
//////// Understand ////////
Glazing typeHeat Transmis-sion Coefficient
(W/m²K)
Light Transmis-
sion %
Solar Factor%
Solar Gain Coefficient
Reflective appearance Applications
Single Glazing Clear 5.8 to 6.8 90 86 0.86 neutral Not Recommended
Double Glazing Clear 2.8 81 76 0.76 neutral Not Recommended
Low Emissivity 1.6 70 to 80 55 to 75 0.71 neutralCold and Warm
Climates, Passive Solar Treatment
Absorbent 2.8 36 to 65 46 to 67 Green, Blue, Bronze... Cold Climates
Reflective 2.8 7 to 66 10 to 66 0.14 to 0.57 Metallic, Grey-green, Blue… Warm Climates
Low Emissivity and Reflective Coating
1.6 70 55 neutral Cold and Mixed Climates
Argon Based, Low Emissivity
1 to 1.3 70 55 0.58 neutral Warm and Mixed Climates
Argon Based, Low Emissiv-ity, Spectral Selection
1 to 1.3 71 33 to 40 0.39 neutral Warm and Mixed Climates, West Orientation
Triple glazing Clear 1 to 1.9 74 68 neutral New and Passive buildings
Argon Based, Low Emissivity
0.6 to 0.8 65 to 75 50 to 70 neutral New and Passive buildings
Argon Based, Low Emissivity (int.), Solar Control (ext.)
0.6 to 0.8 60 to 70 30 to 40 neutral New and Passive buildings
4 I 2 I 1 Insulation
The array of available insulation types display varying benefits in terms of cost, thermal resistance and embodied energy.13 The most prevalent insulation types on the market are insulating foams (polyurethane, polystyrene, phenolic, polyamide, vinyl and polythene), followed by glass fibre and mineral wool (glass or stone). Less frequent are natural insulation types, known as biobased products (cork, vegetable fibre, wool and feathers), and new generation insulating materials (porous mono-wall blocks, aerogel and vacuum insulated panels or VIPs made from perlite). VIPs are not in wide use and are still expensive, but are 5 to 8 times more effective than mineral wool or plastic foam panels.
Figure 49. Global insulation market 2013 (€26.6 bn)
Source: Mirova based on (Rockwool).
North America23%
Western Europe25%
Asia & others47%
Eastern Europeincl.Russia
5%
4 I 2 I 2 Openings
The current level of thermal resistance at openings, windows or doors, results from the reconciliation of multiple requirements, long seen as contradictory: handling (lightness), safety (solidity), transparency or occultation, low air permeability and water tightness, in addition to phonic and thermal insulation. Until recently, wood was the only material meeting these requirements for doors, then PVC took over the market despite a far worse LCA profile. As regards windows, the capacity to meet energy transition requirements involves a balance between effective thermal resistance (balance between heat transmission coefficient, light transmission and solar heat gain coefficient), window-framing materials with high insulating power (wood or PVC rather than metal), and adequate air flow systems (ventilation grids).
The most recent developments in the current market for windows offer significant benefits compared to traditional single glazing, and are available with a wide range of options adapted to the specific climatic environment of each building.
Thermal double-glazing is among the methods targeted for tax credit in many regions, and allows for a 50 to 80% reduction in heat loss. The cost of basic triple glazing is almost 80% higher than that of double-glazing, while differences between the two on transmission coefficient are negligible, thus its application to older properties can be qualified as over-insulation. Triple glazing is also more voluminous and
Source: Mirova.
Figure 50. Performance of various glazing types
13. Embodied energy is the sum of all energy required to produce any particular good or service.

48
//////// Understand ////////
heavy, and not adapted to traditional window frames, which bear the weight of openings. Its use is limited to the pursuit of optimal energy efficiency in low-consumption, passive or energy-plus buildings.
Figure 51. Distribution of glazing types (Europe)
Source: Mirova based on (Saint Gobain).
Modern low-ecoated double
glazing 12%
Triple glazing
2%Early uncoateddouble glazing
42%
Simpleglazing
44%
As is the case for insulating materials, the bulk of the market for doors and windows is tied to construction activities, with 50% of demand coming from China. This demand is more or less equally distributed between new construction and renovation.
Insulation methods in the form of foam, wool-based materials or glazing all create new industrial opportunities. Like the construction sector itself, the insulation value chain is highly fragmented and comprises numerous small size stakeholders and craftsmen.
Figure 52. Examples of players offering insulation solutions
Asahi Glass (Japan)
Saint-Gobain (France)
CSR LTD (Australia)
Guardian Industrie (US)
Johns Manville (US)
Kingspan Group P.L.C. (UK)
Knauf Insulation (Germany)
NSG Group (Japan)
Owens Corning (US)
Rockwool (Denmark)
4 I3 What developments can improve the efficiency of air and water management?
Indoor air management—heating and air conditioning—and domestic hot water production account for most of a building’s energy consumption and GHG emissions during its use phase. These functions are based on a common set of systems whose energy efficiency and performance are at the heart of opportunities associated with the energy transition.
4 I 3 I 1 Heating and domestic hot water
The bulk of heating and domestic hot water production is currently obtained by means of:
➜ Gas boilers that fuel circulating hot water heat and provide domestic hot water. Gas is the primary energy source for heating in developed markets;
➜ Electricity using electric radiators (e.g. electric convectors) and hot water tanks;
➜ Fuel oil boilers based on the same principles as gas counterparts.
These methods all suffer from limited global efficiency and considerable CO2 emissions. Traditional electric heating has a 100% conversion yield from electricity to heat, but electricity production itself generally has a 30 to 40% yield. Moreover, electricity production remains heavily dependent on fossil fuels. Except in countries where electricity production is highly decarbonised, electricity-based technologies therefore exhibit a severely negative environmental profile. This fact encourages legislation to favour alternative heating systems.
Oil and gas-fired boilers generally offer a 60 to 85% yield. The decentralised use of fossil fuels also induces unavoidable CO2 emissions.
Recent technologies now offer improved environmental outcomes. Without resorting to a complete review of how a building’s heating system functions, boilers based on traditional combustibles can be replaced with condensation boilers whose yield is close to 100%. These new generation boilers are able to recover the heat from combustion fumes by transforming them into steam.
Reaching emission reduction objectives will, however, require that technologies offering more significant reductions be implemented. Heat pumps are one way to ‘draw’ heat from an external heat source (air, water, ground). The vast majority of heat pumps work on electricity, but make it possible to reduce consumption by a factor of 2 to 6, depending on the specific technology and applications. Because of their significant installation constraints, heat pumps are mostly used in new construction, individual houses or major renovation projects (malls or office space). Despite the inconvenience of their high installation cost, the global expense of such systems is in most cases lower than traditional alternatives and the return on investment ranges from 5 to 15. Heat pumps are also subsidised by local authorities in a number of regions in the form of bonuses or tax credits. Their use should also grow alongside the development of Net Zero and energy-plus building construction, where heat pumps are required in order to reach efficiency targets.
Solar thermal energy can also play a role in building efficiency, in the form of panels or tubes set atop roofs to produce domestic hot water. The main market for this technology is now China. Unlike photovoltaics, thermal solar displays low production costs and a mature market dominated by small companies.
Source: Mirova.

49
//////// Understand ////////
Lastly, the transition towards modern biomass combustion technologies makes it possible to achieve a significant improvement in energy efficiency compared to open hearth uses.
4 I 3 I 2 Air Conditioning Systems
The air conditioning market is constantly growing and occupies an increasing portion of global energy consumption for both commercial and residential buildings worldwide. Climate change is bound to further accelerate this growth.
Due to the harmful environmental impact of refrigerant emissions,14 the most efficient solution for reducing emissions is to favour natural cooling systems over air conditioning systems:
➜ Evaporative-cooling systems: cooling by evaporation or voie humide, based on direct contact between water and air;
➜ Ground-coupled heat exchanger (only in residential and small size commercial buildings);
➜ Natural ventilation.
Greater energy performance can be obtained from traditional systems by improving standard air conditioning systems and developing ‘inverter’ or ‘variable frequency’ systems. These deliver continuous power instead of working in binary stop-start cycles, offering a 40% reduction in energy bills for users. However, these units still occupy a marginal market share because of their high cost (50% greater than fixed-speed systems).
Minimizing the environmental impact of refrigerants is the second key challenge for air conditioning systems. For absorption refrigerator systems, CO2, propane and ammonia are under consideration as alternatives to traditional refrigerants; they are however less efficient (CO2 is 20% less efficient than R.22 and R.410), and present increased flammability and toxicity risks. Consequently, research priorities are positioned on innovations to improve the quality of refrigerant fluids. The least noxious of these is R.32, an HFC (hydrofluorocarbon) whose heating power is 30% lower than the notorious HCFCs (hydrochlorofluorocarbons), allowing a 10% reduction in energy consumption.
As for insulation, the market for heating and air conditioning solutions is populated by a significant number of local companies. Some large groups, however, are also present in efficient technologies for indoor air management.
Figure 53. Examples of players offering indoorair management solutions
Centrotec Sustainable (Germany)
Daikin Industries (Japan)
Nibe Industrier (Sweden)
Rinnai (Japan)
Smith Corp (UK)
4 I4 Making Appliance Use More Economical
A growing proportion of building energy consumption worldwide (9% for residential and 32% for commercial) is tied to the use of appliances. This broad category includes ‘brown goods’ (telecommunications and information technology devices, televisions and cooking appliances) and ‘white goods’ (washing machines, refrigerators, dryers, freezers). Advances in technology, as well as the energy efficiency of appliances have allowed for significant savings since the 1990s encouraged by energy performance labelling on household appliances. Today’s refrigerators use only 20% of the energy required by those built in 1990. Limitations on the energy consumption of existing appliances have thus contributed to innovations in the area of energy performance improvement.
The main improvement levers currently are focused on energy efficient new lighting technologies. The propagation of modern cooking technologies in developing countries is another challenge, given the significance of this use as a proportion of total consumption. And lastly, thanks to new technologies, a trend toward automation in the construction industry is emerging; this should also enable significant reductions in the sector.
4 I 4 I 1 Lighting
Six basic lighting types are currently in use:
➜ Incandescent bulb lamps (filament bulbs and halogen) are mainly used in the residential sector—these are progressively being banned worldwide;
➜ Fluorescent lamps (compact fluorescent bulbs and tubes, types CFL and LFL), mainly used for industrial and commercial applications;
➜ Gas-discharge lamps (HID), mainly used for street lighting;
➜ LED lamps.
Each of these lighting types displays distinct characteristics.
Figure 54. Characteristics of the various lighting technologies currently available
Consumption LumensEffi-
ciencyLife
SpanLight Yield
Incandes-cent
60 Watts900
lumens12 to 20 lm/W
1 500 hours
1.35 mega lumen hours
Halogen 35 Watts700
lumens18 to 25 lm/W
2 500 hours
1.80 mlm hours
Compact Fluores-cent
25 Watts1230
lumens60 to 100
lm/W8 000 hours
6.6 mlm hours
CFL 15 Watts825
lumens55 lm/W
8 000 hours
6.6 mlm hours
LED 2012 12.5 Watts812
lumens65 lm/W
25 000 hours
20.3 mlm hours
LED 2017 6.1 Watts824
lumens134 lm/W
40 000 hours
33 mlm hours
Source: Mirova.14. 5 Types CFC, HCFC (progressively being banned) and even HFC (Hydrofluocarbons). Although the latter have no impact on the ozone layer, their global warming impact is still 4 to 11,000 times higher than that of CO2.
Source: Mirova.

50
//////// Understand ////////
Traditional types account for 80% of the lighting market, but LEDs are progressively increasing their share.
Lighting represents close to 19% of worldwide electricity consumption across all sectors; this percentage should noticeably decrease in the next years through the adoption of LEDs, which are being established as a credible alternative to incandescent or fluorescent technologies. Indeed, LEDs have demonstrated their numerous benefits, which include:
➜ Much higher yields enabling lower energy consumption. ➜ An extended life span permitting easier maintenance. ➜ A spectacular drop in prices that now makes possible
the widespread adoption of this lighting technology.
Given these developments, more and more players are now positioning themselves on this lighting solution.
Figure 55. Examples of players offering LED lighting solutions
Acuity Brands inc. (US)
Cree (USA)
Dialight (UK)
Lucibel (France)
Zumtobel (Germany)
4 I 4 I 2 Cooking
Cooking accounts for 50% of total residential energy consumption in the Middle East, Africa, India and other developing countries in Asia. This issue presents health as well as domestic safety challenges, and is largely restricted to countries where access to the energy grid is still difficult and costly. Cooking uses in these areas thus rely mostly on traditional biomass, which is the least efficient system in terms of energy use. The main improvement potential is therefore the modification of fuel types and cooking devices (closed hearth systems). Optimistic scenarios count on easier access to energy for the poorest populations by 2030 (cf. Energy section). Development assistance programs, as well as innovative economic models aimed at these populations are the main mechanism for meeting this development challenge (BOP models).
4 I 4 I 3 Automation
The development of ‘Smart Building’ systems offers solutions for managing energy consumption through innovations in information and communication technologies.
Building Management Systems (BMS),15 which began with the digitalization of existing processes (lighting, heating, air conditioning) allowing sensor-controlled activation and switch-off, are designed to integrate the management of all of a building’s functionalities so they work collaboratively and learn the specific preferences of multiple users. BMS can control the various functionalities of a building based on the presence or absence of users, for instance. They can also be completed with BEMS (Building Energy Management
Systems), which provide feedback on the performance of various functions, warnings in case of energy waste, and contribute to optimising the various components: BEMS couple the optimized management of an installation with a computer system which streamlines the energy use of the various devices monitored through sensors.
Smart Building applications enable cost reductions of up to 40% in a building’s energy consumption.
Section Potential Cost Reduction
Indoor Air Management 14-25%
Heating Scheduling 7-17%
Blinds 9-32%
Lighting 25-28%
Air Conditioning 20-45%
Total Average 11-31%
Figure 56. Potential reductions in cost attributableto automation, by application
Source: Mirova based on (ABB).
There are small and medium size businesses that currently offer a number of automation solutions for private individuals, but the development of these technologies at a larger scale still requires significant technological efforts. A number of large industrial players therefore dominate solutions for intelligent building management.
Figure 57. Examples of players involvedin ‘Smart Building’ solutions
ABB (Switzerland)
Honeywell (US)
Ingersoll Rand (Ireland)
Legrand (France)
Schneider Electric (France)
Siemens (Germany)
Tyco (Ireland)
4 I5 Conclusion
A wide variety of technologies tackling energy consumption reduction in the building sector are now available. Regulatory developments have encouraged the emergence of a market for energy efficiency in construction. However, these initiatives still face structural inertia in the sector, despite a strong correlation between energy and cost savings for users, which should drive change; this is due to diverging interests among owners, builders and users. The building market is also highly dispersed, involving a large number of small companies and craftsmen, which presents a challenge for broadly disseminating knowledge and best practices. Achieving energy efficiency targets will require that legislators and companies find innovative solutions to address these issues at different levels.
15. BMS are classified as falling into one of three types: static, semi-static and dynamic
Source: Mirova.
Source: Mirova.

51
//////// Understand ////////
5 I Industry
5 I1 Industry, energy and CO2
Because of the complexity and diversity of industrial activity, it is difficult to present an exhaustive overview of the sector, which comprises industries as varied as the agri-food business, the production of metals, chemicals, automobiles, cement, pulp and paper, etc. Despite this diversity of activities, the majority of energy consumption in industry is linked to two uses: the production of heat to fire ovens and the creation of mechanical movement.
In terms of heat production, most heavy industry needs to heat at high temperatures in order to transform raw materials. This heating represents the majority of the energy consumption of the five sectors that consume them most: the chemicals industry, steel and cement production, pulp and paper, and aluminium.
Chemicals27%
Steel14%
Cement8%
Non-ferrousmetals
3%
Otherindustries
33%
Otherindustries
43%
Chemicals 22%
Steel15%
Cement18%
Pulp and paper5%
Pulp and paper5%
Non-ferrousmetals
7%
Energy
GHG
Figure 58. Industrial energy consumption and GHG emissions - World
Source: Mirova based on (WRI, 2005).
Another way of assessing the energy consumption of industry consists in considering the distribution of emissions by type of energy consumed.
Figure 59. Industrial GHG emissionsby type of energy consumption - World
Source: Mirova based on (WRI, 2005).
Electricity & Heat (CO2) 35%
Process Emissions (CO2)10%
High GWP Gases (CO2)6%
Fossil Fuel Combustion (CO2)
49%
The emissions tied to the consumption of electricity of the sector represent more than a third of its total emissions. Furthermore, the share of electricity has grown constantly over the course of the past decades, from 30% at the beginning of the 1970s to almost 50% today. This consumption of electricity is essentially devoted to mechanical movement, with 70% of consumption tied to the use of electric motors (IEA, 2011).
Consequently, the energy efficiency of the sector can be improved in two ways:
➜ Action targeting the most energy-consuming industries. However, the potential energy efficiency of these sectors remains limited, given the substantial efforts already made to limit their consumption.
➜ Trans-sectoral action via the optimisation of electricity consumption. Many companies today are proposing solutions to this challenge.
5 I2 High consumption industries
5 I 2 I 1 Overview of regulation
From a regulatory point of view, CO2 emissions markets are the main mechanism that can have an impact on industries that consume massive amounts of energy.
To date, Europe remains the main area where such a market has had a concrete impact on emissions. However, given the risk of company relocation, the initial phase of quota attribution was very generous for the sectors concerned, which led to minimal emissions reduction. The system evolved slightly for the phase set to take place between 2015 and 2019, but a system of free allocation has allowed these sectors to face only limited constraints in terms of CO2.

52
//////// Understand ////////
5 I 2 I 2 Chemical and petrochemical products
The chemicals industry is complex, producing a wide range of goods through diverse means and furnishing almost every sector of the economy. Nevertheless, three categories of chemicals account for almost 70% of the energy consumption of the chemicals industry: the so-called HVC or ‘high-value chemicals’, namely, ethylene, propylene and BTX (benzene, toluene, xylene), in addition to ammonia and methanol.16
Figure 60. Contribution of the chemical industryto the economy of the European Union
Source: Mirova based on (Cefic, European Chemical Industry Council, 2012).
Rubber and plastics
Health and social work
ConstructionAgriculture
Wholesales &retail trade
Service
Pulp and paper
Automobile
Basic metalsTextiles
Other non-metallicmineral products
Fabricated metal productsMachinery and
equipmentFood and beverages
WoodPublishing and printing
Electrical machineryand apparatus
Furniture
Other manufacturingOther business activities
0% 5% 10% 15%
Figure 61. Global breakdown of energy consumption for chemical and petrochemical products (2009)
Source: Mirova based on (IEA, 2015).
Others31%
HVC47%
Ammonia18%
Methanol4%
HVC: High-value chemicals, i.e. ethylene, propylene and BTX (benzene, toluene, xylene)
From an environmental standpoint, the chemical industry is the industrial sector that consumes the most energy, accounting for almost 30% of industrial demand. The sector is responsible for 20% of industrial GHG emissions. This relatively low share of GHG emissions compared to energy consumption is due to the predominant use of energy as feedstock (75%). Nevertheless, even if this energy is not burned during the production process, most of the products will be during the end-of-life phase, thereby emitting CO2. This share of GHG emissions would be even lower were it not for the process gases of the chemical industry, such as CFCs, HFCs or SF6, which are powerful greenhouse gases.
Driven by considerations of cost, the chemical industry has already made substantial efforts to reduce its energy intensity. The ammonia production process, for instance, has considerably reduced its energy consumption over the past few decades. In Europe, the energy intensity of the sector was cut in half between 1990 and 2010.
Figure 62. Energy consumption of ammonia production
Source: Mirova based on (IEA, 2008).
500
Birkeland-Eyde electric arc method
Cyanamid Method
Haber-Bosch synthesis
Steam reforming natural gas
400
300
200
Gj/m
t am
mon
ia
100
1900 1925 1950 1975 2000 20250
Figure 63. Energy intensity of the European chemical industry
Source: Mirova based on (Cefic, European Chemical Industry Council, 2012).
Inde
x (1
990-
100
)
120
100
80
60
40
20
01990 1995 2000 2005 2010
These asymptotic curves suggest that production processes may have reached maximum efficiency. However, if we consider the diversity of existing industrial processes17 and the age difference among plants, there are still significant discrepancies in performance among chemical factories throughout the world which could allow for further reductions in consumption. In the long term, certain disruptive technologies, like the use of hydrogen, could provide for more substantial emissions reductions.
16. Actually, 18 chemical products (among thousands) account for 80% of energy demand in the chemical industry and 75% of its greenhouse gas emissions (DECHEMA, ICCA, IEA, 2013).
17. The top 18 high-volume chemicals are manufactured using 130 different industrial processes.

53
//////// Understand ////////
Figure 64. Energy use (excepting feedstock) in the productionof major chemicals throughout the world (2010)
Source: Mirova based on (IEA, 2013).
Chin
a, In
dia,
Uni
ted
Stat
es
Chin
a, In
dia,
Uni
ted
Stat
es
Best
Pra
ctic
e Te
chno
logi
es
Russ
ia
Unite
d St
ates
Braz
il an
d M
iddl
e Ea
st
Best
Pra
ctic
e Te
chno
logi
es
Wor
ld
Best
Pra
ctic
e Te
chno
logi
es
0
5
Olefins(ethylene, propylene)
Ammonia Methanol
10
15
20
GJ/t
It is difficult to go beyond global observations in this sector, as assessing companies’ performance in terms of energy efficiency is impossible given their level of transparency. Companies currently communicate only their total emissions, without providing performance levels by type of product. As a result, the evolution of companies’ GHG emissions may be just as dependent on changes in the product mix as on improvements in performance. Nevertheless, given that the industry is mature and relatively concentrated industry, it is likely that global observations also apply at the level of individual players.
5 I 2 I 3 Steel
Steel is at the heart of our economy as a key product for several industries:18
➜ Construction. In buildings, (~40% of the market), steel is primarily used for reinforcing concrete, sheet products, exterior cladding, for instance, or structural elements such as I-beams. In infrastructure (~15%), the end uses are approximately the same, with certain specific uses such as the production of train rail and pipes for oil, gas, water, etc.
➜ Industrial equipment (~15%). Steel is used to produce equipment like electric motors, pylons and cables. It is also used to produce a wide range of machines, from small workshop tools to large robotic machinery and rolling mills.
➜ Transport (~15%). Steel is used to produce cars, trucks and trains.
➜ Metal products. Steel is also used to produce many goods: domestic appliances such as refrigerators, washing machines or ovens, consumer packaging such as food tins or aerosol cans, and furniture.
From a production perspective, the steel industry has radically changed over the past 20 years. Production has doubled, with impressive growth in China, which represented less than 15% of global production in the early 90s and now accounts for almost half. Today, a slow-down in urbanisation and infrastructure development projects suggests that Chinese steel production should peak in the near future. However, global steel production should continue to increase for several decades, driven by demand in other emerging countries, and notably in India.
From an environmental standpoint, steel is the second most energy-consuming industrial sector, accounting for more than 20% of total expenditure. The sector is also responsible for roughly 30% of industrial GHG emissions. This significant share of GHG emissions as compared to energy consumption is due to the fact that, beyond energy-related CO2 emissions, the chemical transformation of iron ore into steel entails process emissions.
One generally distinguishes between the production of primary steel from iron ore and the production of secondary steel from recycled scrap. While the production of primary steel consumes from ~20 GJ/t to more than ~30 GJ/t depending on the type of facility, the production of secondary steel requires only between ~9 GJ/t and ~13 GJ/t of energy.19 Increasing the production of steel from scrap seems like a simple solution for reducing emissions. However, the amount of steel available for recycling is currently not sufficient to accommodate growing demand. This is especially true in emerging countries, and more particularly in China, where scrap availability is very limited compared to OECD countries.
Therefore, while increased recycling will remain one of the priorities for the energy efficiency of the sector as a whole, other measures focusing on the improvement of the energy efficiency of the processes themselves will be necessary to reduce the carbon intensity of the industry. Significant progress has nevertheless been made and the margins for further improvement seem relatively limited today.
Figure 65. Evolution of the energy consumptionof steel production
Source: Mirova based on (World Steel Association, 2008).
0
1975
1980
1985
1990
2000
1995
2005
2010
10
20
30
40
50
GJ/t
Ste
el
19. These differences are logical from a physical point of view. Indeed the reduction phase occurring in the blast furnace is not necessary when using scrap steel, and this phase is the most energy intensive in steel production (~75% of total primary energy consumption).18. All consumption figures are from Allwood, 2012.

54
//////// Understand ////////
In the long term, only carbon capture and storage (CCS) technology could allow for significant reductions in CO2 emissions. However, as evidenced by the recent failure of the CCS project at ArcelorMittal’s Florange site, this technology needs to be improved and requires a better regulatory framework in order to develop.
In terms of companies, following the growth of steel production in China, 6 of the largest steel producers in the world are now Chinese. The other players among the ten largest producers are multinationals based in Europe, or Japan.
Figure 66. Carbon performance of the principal steelproducers World
Source: Mirova based on company reports.
Country CO2/tonne steel
ArcelorMittal Luxembourg 2.09
Nippon Steel and Sumitomo Metal Corporation Japan 2.18
Hebei Steel Group China NA
Baosteel Group China NA
POSCO Korea 2.03
Shagang Group China NA
Ansteel Group China NA
Wuhan Steel Group China NA
JFE Steel Corporation Japan 2.00
Shougang Group China NA
Tata Steel Group India 2.43
Transparency concerning CO2 emissions is very limited for Chinese companies. In the rest of the world, performance in terms of CO2 varies little from one company to another. Moreover, since companies rarely disclose the proportion of primary and secondary steel in their production mix, it is difficult to assign a reliable carbon performance to such figures.
5 I 2 I 4 Cement
Cement is one of the world’s most ubiquitous materials, despite being almost entirely restricted to construction, buildings and infrastructure as the binding agent in concrete and mortar. Global production of cement exhibits a similar profile to that of the steel industry, with particularly high growth in China, where production has increased fivefold over the last 20 years, and now represents 60% of world output. As with steel, cement production in China will peak sometime in the near future. Nonetheless, global production of cement is expected to increase for several more decades on the strength of rising demand in emerging countries.
From an environmental perspective, the cement industry is the third largest energy consumer in the industrial category, representing approximately 9% of all industrial energy needs and about 25% of CO2 emissions. As in the case of steel, this significant ratio of GHG emissions to energy consumption is attributable to the fact that the chemical transformation of lime into cement creates CO2 emissions over and above those related to energy.
The main possibilities for reducing CO2 emissions arising from cement production involve:
➜ Increasing the energy efficiency of production processes. This can principally be achieved by adopting technologies that make the kiln more efficient (dry-process preheater-precalciner kilns). However, the margin for improvement here is now relatively limited, as most of the least efficient kilns have already been replaced.
➜ Increasing reliance on substitutes. For certain applications, cement can be replaced with products offering similar properties, such as waste products from steel production or coal-fired power plants (fly ash and slag). However, the available supply of substitutes is limited. Furthermore, since these alternatives are themselves by-products of CO2 intensive industries, the overall lifecycle carbon footprint of these substitutes is questionable.
➜ Shifting to alternative fuel sources, such as biomass. However, as covered earlier in this study, the carbon footprint of biofuels is a source of hot debate.
➜ Carbon capture and carbon sinks. The same uncertainty as to the development of this technology applies here as to steel or electricity production.
Some initiatives seek to offer cement alternatives with drastically lower emissions. For the moment, however, none of these has proven itself economically viable. Consequently, the prospects for significant reduction in the sector appear set to remain low until a technological breakthrough occurs.20
Figure 67. Projected reductions for CO2 emissionsin the cement industry
2006
2014
2022
2030
2038
2046
0
0,5
1
1,5
2
2,5BaU scenario
Energy Efficiency
Energy Efficiency
Substitution CCS
Alternative fuels
Gt C
O 2
Source: Mirova based on (WBCSD - CSI, 2010).
As regards the distribution of players for this industry, four of the world’s largest cement producers today are Chinese, consistent with the growth of this industry in China. Four are multinationals based in Europe, while the remaining two top ten players are from Mexico and India.
20. See part 4, ‘What innovations for Sustainable Building.’

55
//////// Understand ////////
Figure 68. The world’s primary cement producers
Country Gross emissions in kg CO2/t cement produced
Anhui Conch China ND
LafargeHolcim France 594
CNBM China ND
HeidelbergCement Germany 638
Italcementi Italy 692
Cemex Mexico ND
Taiwan Cement Corp Taiwan 653
China Resources China ND
Sinoma (China National Materials)
China ND
UltraTech India ND
Source: Mirova based on company disclosures. ND= Not Disclosed.
In terms of environmental performance, there is a significant difference in disclosure between the large multinationals, which are relatively transparent, and the Chinese companies, which exhibit very low levels of transparency. Western companies also report fairly similar levels of CO2 emissions, an observation supported for smaller players by industry statistics (WBCSD – CSI, 2010). It is therefore very difficult to point to particular actors as particularly noticeable for their carbon performance one way or the other.
5 I3 Cross-sector approach to energy efficiency
A specific focus must be placed on electric engines, which alone account for 70% of the electricity consumed by the industrial sector. Motors driven by electricity are used for a wide variety of applications in various industries. In particular, they are an essential component of the following systems:
➜ Pumps: water management and oil extraction ➜ Ventilators: air or gas circulation ➜ Compressors: cooling, air conditioning, air-compressing,
gas liquefaction (including LNG) ➜ Mechanical movements: tools used to laminate
metal, crush rocks or other mineral resources, extrude plastics, weave, wash and dry textiles, mix or blend food raw materials. Electric engines are also necessary components of elevators, escalators, freight conveyors, trains, electric vehicles, industrial robots, etc.
The prevalence of electric engines throughout the industrial sector offers an obvious opportunity for environmental improvements in the form of increasing reliance on renewable energies as a primary source of energy. But beyond this indirect effect, whose realisation depends on how power is generated, there are now several areas offering high potential for reducing the actual energy consumption of these motors.
➜ The current preponderance of low-efficiency engines compared to recent alternatives.
➜ The limited number of engines equipped with variable speed drive (VSD) for limiting consumption to what is needed for a given workload.
➜ An overall lack of system optimisation, with a substantial share of installed engines being oversized with respect to actual usage.
Engine efficiencyAt the international level, electric engines are classified according to 4 categories of energy efficiency, from IE1 (standard efficiency) to IE4 (super premium efficiency). An IE0 class is sometimes added as well, so as to identify older motors exhibiting below-average efficiency.
Figure 69. Average efficiency of electric engines’ energy efficiency classes by electricity consumed
Source: Mirova (based on IEA, 2011).
0,170
Effic
ienc
y %
80
90
100
1 10 100 1 000
IE2IE3IE4
KW
IE1
Publicly available data on the relative market share of each engine efficiency class is somewhat out-dated. Nonetheless, it appears that newer technologies are making noticeable progress in both the US and in Europe, with a certain advance in the US. While data available for the Chinese market are not as precise, electric engines in China are, on average, 3 to 5% less efficient than their Western counterparts. Extrapolating from current market trends, and taking into account that engines are aften used far past their theoretical lifetime of 10 to 20 years, (Brunner, 2013), it seems reasonable to suppose that the potential for deploying more efficient electric engine technologies remains high.
Variable Speed DrivesAccording to their technical specifications, most electric engines are less energy efficient when submitted to a weaker load than their rated output. This issue is more significant for older engines, whose efficiency founders when their load falls below 75%. Even when looking at more recent motors, performance drops dramatically when they are used at 50% or less than their nominal capacity.
Figure 70. Energy efficiency to load ratio of electric engines
Source: Mirova based on (Aníbal T. de Almeida, 2008; IEA, 2011).
00
20
40
60
80
100
20 40 60 80 100
Engine load (%)
Effic
ienc
y (%
)
Recent engine
Older engine

56
//////// Understand ////////
Due to this characteristic of electric engines, it is best to choose them as closely matched in capacity to their intended use as possible. Nonetheless, many functions of engines involve variable loads: the power required of an electric engine will change in the case of a conveyor according to the load it carries, in the case of a pump according to its output, which can fluctuate in certain applications.
It is possible to avoid yield losses in such cases by equipping the engine with an electric device called a variable speed drive (VSD), also known as a Variable Frequency Drive or Adjustable Speed Drive (ASD) which makes it possible to fine-tune power consumption according to need. The proportion of energy saved through the use of VSD depends on the application. For pumps, ventilation systems or compressors, it can reach as much as 50%.
As of today, 30% to 40% of the engines commercialized are equipped with VSD. As for engine technology itself, given the average lifetime of engines, the potential for further deployment is high.
System optimizationBeyond improvements related directly to engines themselves, further reductions in energy consumption can be achieved by acting on the systems within which such engines are integrated (IEA, 2007). These include:
➜ Implementing automated stop systems to shorten stand-by periods;
➜ Avoiding sudden increases in workload or the sudden halting of equipment;
➜ Avoiding sustained periods of overload;
➜ Ensuring equipment maintenance.
Finally, engines are systemically part of a larger device, whose global efficiency must be ensured (by reducing friction forces, optimizing the production process…). Monitoring these various parameters requires advanced technical expertise, paving the way for an increasing reliance on sensors, more advanced information systems, and specialized energy auditing and consulting services.
Given the breadth of applications possible, electric engines, although primarily associated with the industrial sector, are also used in construction, in the production of consumer goods, and to a lesser extent, in transport. The optimisation efforts listed above thus have implications beyond industry alone.
Currently, the development of these technologies is being further strengthened by stricter regulations in all the main areas of consumption.
United States The United States has long been in the vanguard of energy consumption regulation, with standards adopted as early as 1992, with the Energy Efficiency Act (EPAct), which contained provisions for labelling the energy efficiency of engines.
Starting in 1997, the federal government set minimum energy efficiency requirements. This regulation favoured the rise of type IE2 motors. First in 2005, then in 2007, standards were reinforced to encourage a shift toward type IE3 engines, and the United States is consequently a world leader in the energy efficiency of electric engines today.
EuropeIn Europe, producers reached a voluntary agreement in 1998 to propose a classification system for electric engines according to a common energy efficiency standard. However, it was only in 2009 that the European Commission issued its regulation 640/2009 defining the following norms:
➜ By June 2011: all new engines sold must satisfy the requirements of the IE2 standard;
➜ By January 2015: all new medium-power engines (7.5-375kW) sold must either meet IE3 standards or satisfy the requirements of the IE2 standard and be equipped with a VSD;
➜ By January 2017: all new engines (0.75-375kW) sold must either satisfy the requirements of the IE3 standard or meet the IE2 standard and be equipped with a VSD.
ChinaIn 2000, China established a domestic qualitative standard, encouraging the adoption of energy efficiency policies for devices using inefficient electric motors. This qualitative objective was reiterated in 2006, with the purpose of eliminating the least efficient engines and adopting VSD as well as other energy consumption reduction measures. The 11th five-year plan (2006-2010) set a 2% target for improving the energy efficiency of motors. The subsequent five-year plan again insisted on increasing the energy efficiency of engines in order to reach global optimization objectives.
These developments open up growth opportunities for players in the field of emissions reduction, which, to date, remain mostly Western companies.
Figure 71. Primary companies offering technological solutionsfor reducing energy consumption in the industrial sector
High efficiency engines Diversified players
ABB (Switzerland) Danaher (US)
Schneider Electric (France) Philips (Netherlands)
Emerson Electric (US) Mersen (France)
Eaton (US/Ireland) American superconductor (US)
Teco (Taiwan) Halma (UK)
Rockwell Automation (US) Spirax-sarco (UK)
WEG S.A. (Brazil) Siemens (Germany)
IMI (UK) Ingersoll Rand (Ireland)
Wartsila (Finland)
Source: Mirova.

57
//////// Understand ////////
CONCLUSION
While there remain many challenges yet to be faced, the transition toward a low carbon economy has unmistakeably begun. Increasing awareness of environmental issues has gradually pushed legislators to develop regulatory frameworks, thus encouraging research to seek cleaner technologies. A considerable number of solutions are now being implemented on an industrial scale, and continued innovation will accelerate the process of transformation. For companies, these changes are highly-charged sources of both opportunities and new risks. Renewable energy and energy efficiency solutions are experiencing tremendous growth. Conversely, coal is already under increasing pressure
all over the world: from mining investments to coal-fired power plants, many players are affected by the problem of ‘stranded assets’.
The struggle against climate change demands a global acceleration of these transformations. Investors who have adequately integrated the new paradigm will be in a position to adopt active management strategies, allocating their capital to projects and companies that offer solutions for achieving the transition. By contributing to the growth of these companies, such investments take part in transforming our economic model.
LIST OF FIGURES
Greenhouse gas emissions by sector 2010 9 Evolution of energy consumption World, 1965 - 2014 9 Primary energy consumption per capita 10Fossil reserves and carbon constraints 10Projection for the electricity mix in a 2°C scenario 10Cost of a solar module, 1976 - 2013 11Production of solar and wind electricity by date 11of installation in a 2°C scenario Principal suppliers of solar/wind equipment 11Production of hydro electricity by date of installation in a 2°C scenario 11Distribution of modes of transport overtime 12Reduction potential for mobility 13Development of the electric vehicle market 13Shifts in vehicle stock in a 2°C scenario 13GHG emissions by mode of transport 14Examples of companies offering solutions 14for sustainable mobility Per capita residential surface trends 14GHG emissions savings in the residential sector in an active 15reduction policy scenario Examples of companies proposing green building solutions 15Industrial GHG emissions - World Generic profile of energy consumption 15for heavy industry 1975 - 2012 Examples of companies offering energy efficiency solutions 16for industry Figure 1. Greenhouse gas emissions by sector 2010 18Figure 2. Global primary energy consumption 2012 18 Figure 3. CO2 emissions by energy source 2012 18Figure 4. Breakdown of principal uses of fossil 19and non-fossil fuels - World 2012 Figure 5. Change in global energy consumption 1965 - 2014 19 Figure 6. Breakdown of global primary energy consumption 20per sector, 2012 Figure 7. Global primary energy consumption per sector, 201970-2012 Figure 8. Breakdown of carbon content of proven 20 and ultimate hydrocarbon reserves Figure 9. Breakdown of various components of greenhouse 20gas emissions (GHG) Figure 10. Primary energy consumption per capita 21Figure 11. Change in the carbon intensity of global energy, 211965-2040 Figure 12. Main phases of international climate negotiations. 22Figure 13. Breakdown of greenhouse gas emissions by region 23Figure 14. European commitments on climate change 23Figure 15. Projections for 2040 of energy 24
demand per fuel type (IEA, Exxon, GWEC/EREC/Greenpeace) Figure 16. Direct consumption versus consumption 25of electricity Figure 17. Investments by energy type (2000-2012) 25Figure 18. Composition over time of the electricity mix 25in a 2°C scenario Figure 19. Wind turbine installation by region – net output 26Figure 20. Wind power generation costs 26Denmark 1980-2000 Figure 21. Wind power generation costs vs. coal 26and CCGT gas World 2013-2025 Figure 22. Projection of wind energy consumption 26in a 2°C scenario Figure 23. Main players in wind power 27Figure 24. Breakdown of annual onshore/offshore 27installations Figure 25. Solar PV installation by region – net capacity 27Figure 26. Production costs for a solar module - 1976-2013 27Figure 27. Estimated projections for solar generation costs 28Figure 28. Solar Modules 28Figure 29. Development of hydro generation 28by region 1965-2015 Figure 30. Development of hydroelectricity generation 28by region in a 2°C scenario by installation date Figure 31. Major hydro OEMs 29Figure 32. Carbon intensity of Europe’s main 31electricity producers Figure 33. Changes the in use of various transport modes 32over time Figure 34. Transport energy consumption and greenhouse 32gas emissions (2012) Figure 35. Evolution of the distribution of global energy 32consumption by mode of transport Figure 36. Projected GHG emissions savings related 33to mobility in the context of an active reduction policyFigure 37. Well-to-wheels carbon assessment of electric 34 vehicles in the primary sales zones (2014) Figure 38. Evolution of the electric vehicle market and stock 34 in circulation until 2050 to meet climate objectives Figure 39. Regulations on CO2 emissions for passenger 36 vehicles Figure 40. Potential for CO2 emission reduction allowed in 37 internal combustion vehicles Figure 41. Technological leverage in the aviation industry 38Figure 42. Direct CO2 emissions for passenger 38and freight transport (2010) Figure 43. Residential space occupancy trends per capita 44by region
Figure 44. Carbon emission profiles by building type 44and lifecycle stage Figure 45. Energy consumption by use in major 45world regions 2000/2011Figure 46. End-use energy consumption in residential 45and commercial buildings by region (2010) Figure 47. Share and consumption of buildings 45in kWh/m²/year by construction period, Paris Figure 48. Breakdown of energy savings in residential 46buildings under an active reduction policy Figure 49. Global insulation market 2013 (€26.5 billion) 47Figure 50. Performance of various glazing types 47Figure 51. Distribution of glazing Types (Europe) 48Figure 52. Examples of players offering insulation solutions 48Figure 53. Examples of players offering indoor 49air management solutions Figure 54. Characteristics of the various 49lighting technologies currently available Figure 55. Examples of players offering LED 50lighting solutions Figure 56. Potential reductions in cost attributable 50to automation, by application Figure 57. Examples of players involved 50in ‘Smart Building’ solutions Figure 58. Industrial energy consumption 51and GHG emissions - World Figure 59. Industrial GHG emissions 51by type of energy consumption - World Figure 60. Contribution of the chemical industry 52to the economy of the European Union Figure 61. Global breakdown of energy consumption 52 of chemical and petrochemical products (2009) Figure 62. Energy consumption of ammonia production 52Figure 63. Energy intensity of the European chemical industry 52Figure 64. Energy use (excepting feedstock) in the 53 production of major chemicals throughout the world (2010) Figure 65. Evolution of the energy consumption 53of steel production Figure 66. Carbon performance of the principal steel 54producers World Figure 67. Projected reductions for CO2 emissions 54in the cement industry Figure 68. The world’s primary cement producers 55Figure 69. Average efficiency of electric engines’ energy 55efficiency classes by electricity consumed Figure 70. Energy efficiency to load ratio of electric engines 55Figure 71. Primary companies offering technological 56solutions for reducing energy consumption in the industrial sector

58
//////// Understand ////////
ADEME. (2010). Guide des facteurs d’émissions. Retrieved from http://23dd.fr/images/stories/Documents/PV/Ademe_Metro_Chapitre_2_Energie.pdf
ADEME. (2014, January). Optimiser ses déplacements. Retrieved from https://www.ademe.fr/sites/default/files/assets/documents/20140418_Guide-Optimiser-ses-deplacements.pdf
Aníbal T. de Almeida, F. J. (2008). Retrieved from http://www.eup-network.de/fileadmin/user_upload/Produktgruppen/Lots/Final_Documents/Lot11_Motors_FinalReport.pdf
APUR. (2007). Consommations d’énergie et émissions de GES liées au chauffage des résidences principales pariesiennes. Retrieved from http://www.apur.org/sites/default/files/documents/246.pdf
Banque Mondiale. (2014). Data - Population, total. Retrieved from http://donnees.banquemondiale.org/indicateur/SP.POP.TOTL
Boitier. (2012). CO2 emissions production-based accounting vs consumption: Insights from the WIOD databases. Retrieved from http://www.wiod.org/conferences/groningen/paper_Boitier.pdf
BP. (2015). Statistical Review of World Energy. Retrieved from http://www.bp.com/en/global/corporate/about-bp/energy-economics/statistical-review-of-world-energy.html
Cefic, European Chemical Industry Council. (2012). Facts and Figures 2012 - The European chemicals industry in a worldwide perspective. Retrieved from http://www.cefic.org/Documents/FactsAndFigures/2012/Facts-and-Figures-2012-The-Brochure.pdf
Conrad U. Brunner, R. W. (2013). Market Transformation Program for Electric Motor Systems - Global progress report and outlook. Retrieved from https://www.motorsystems.org/files/otherfiles/0000/0158/086_paper_brunner.pdf
Dargay, J., Gately, D., & Sommer, M. (2007, Janvier). Vehicle Ownership and Income Growth, Worldwide: 1960-2030. Retrieved from http://www.econ.nyu.edu/dept/courses/gately/DGS_Vehicle%20Ownership_2007.pdf
Geelings, H., Shiftan, Y., & Stead, D. (2012). Transition towards sustainaible mobility. Retrieved from http://samples.sainsburysebooks.co.uk/9781409424703_sample_948935.pdf
GWEC, ENERC, Greenpeace. (2012). The Energy [R]evolution 2012. Retrieved from http://www.greenpeace.org/international/en/campaigns/climate-change/energyrevolution/
IATA. (2015, Juin). Fact Sheet : Climate Change. Retrieved from https://www.iata.org/policy/environment/Documents/iata-factsheet-climatechange.pdf
IATA. (2015, Juin). Fact Sheet: Technology Roadmap for Environmental Improvement. Retrieved from https://www.iata.org/pressroom/facts_figures/fact_sheets/Documents/fact-sheet-aviation-technology.pdf
ICCT. (2011, july. Reducing greenhouse gas emissions from ships. Retrieved from http://www.theicct.org/sites/default/files/publications/ICCT_GHGfromships_jun2011.pdf
ICCT. (2014, November 11). Global passenger vehicle standards. Retrieved from http://www.theicct.org/info-tools/global-passenger-vehicle-standards
IEA. (2007). Tracking Industrial Energy Efficiency and CO2
Emissions. Retrieved from http://www.iea.org/publications/freepublications/publication/tracking_emissions.pdf
IEA. (2010). Renewable Energy Essentials: Geothermal. Retrieved from https://www.iea.org/publications/freepublications/publication/Geothermal_Essentials.pdf
IEA. (2011). Energy-Efficiency Policy Opportunities for Electric Motor-Driven Systems. Retrieved from https://www.iea.org/publications/freepublications/publication/EE_for_ElectricSystems.pdf
IEA. (2011). World Energy Outlook 2010.
IEA. (2012). The Past and Future Cost of Wind Energy. Retrieved from https://www.ieawind.org/index_page_postings/WP2_task26.pdf
IEA. (2012). World Energy Outlook. Retrieved from http://www.iea.org/publications/freepublications/publication/WEO2012_free.pdf
IEA. (2013). Tracking Clean Energy Progress 2013. Retrieved from http://www.iea.org/publications/TCEP_web.pdf
IEA. (2013). Transition to sustainable buildings. Retrieved from http://www.iea.org/publications/freepublications/publication/transition-to-sustainable-buildings.html
IEA. (2014). IEA Statistics. Retrieved from http://www.iea.org/statistics/
IEA. (2014). Solar Heat Worldwide. Retrieved from http://www.iea-shc.org/solar-heat-worldwide
I E A . ( 2 0 1 4 ) . Te c h n o l o g y R o a d m a p : S o l a r Photovoltaic Energy. Retrieved from https://www.iea.org/publ icat ions/freepubl icat ions/publ icat ion/TechnologyRoadmapSolarPhotovoltaicEnergy_2014edition.pdf
IEA. (2014). Tracking clean energy progress. Retrieved from http://www.iea.org/publications/freepublications/publication/Tracking_clean_energy_progress_2014.pdf
BIBLIOGRAPHY

59
//////// Understand ////////
IEA. (2014). World Energy Investment Outlook. Retrieved from http://www.iea.org/publications/freepublications/publication/WEIO2014.pdf
IEA. (2015). Energy Technology Perspectives 2015. Retrieved from http://www.iea.org/etp/etp2015/
IEA. (2015). World Energy Outlook 2014. Retrieved from http://www.iea.org/publications/weo-2014
IFMO. (2012, November. Men shape a downward trend in car use among young adults - evidence from six industrialized countries. Retrieved from http://www.polsoz.fu-berlin.de/polwiss/forschung/systeme/ffu/international/tucd/tucd-1/7_publications/buehler-transport/Men_shape_downward_trend_in_car_use_among_young_adults.pdf
IPCC. (2014). Climate Change 2014: Mitigation of Climate Change. Retrieved from http://www.ipcc.ch/pdf/assessment-report/ar5/wg3/ipcc_wg3_ar5_summary-for-policymakers.pdf.
IPCC. (2014). Climate Change 2014 - Synthesis Report. Retrieved from http://www.ipcc.ch/pdf/assessment-report/ar5/syr/SYR_AR5_FINAL_full_wcover.pdf
OECD. (2013). Developing Infrastructure for alternative transport fuels and power-trains to 2020/2030/2050. Retrieved from http://www.oecd.org/futures/synthesisreport.pdf
OECD/IEA. (2013). CO2 emissions from fuel combustion - Highlights. Retrieved from http://dx.doi.org/10.1787/co2_fuel-2013-en
OECD/IEA. (2015). Global EV outlook 2015. Retrieved from http://www.iea.org/evi/Global-EV-Outlook-2015-Update_2page.pdf
OECD/IEA. (2015). Global EV outlook 2015 - key takeaways. Retrieved from http://www.iea.org/evi/Global-EV-Outlook-2015-Update_2page.pdf
OECD/IEA. (2015, may 4). Insights emerging from the 2015 Global EV Outlook (IEA). Retrieved from https://www.iea.org/media/workshops/2015/towardsaglobalevmarket/A.0IEA.pdf
OECD/IEA. (2015). Transport. Retrieved from https://www.iea.org/aboutus/faqs/transport/
OECD/IEA. (2012). Energy Technology Perspectives 2012. Retrieved from https://www.iea.org/publications/freepublications/publication/ETP2012_free.pdf
OECD/IEA. (2015). Global EV Outlook 2015. Retrieved from http://www.iea.org/evi/Global-EV-Outlook-2015-Update_1page.pdf
OECD/IEA. (2015). Tracking Clean Energy Progress 2015. Récupéré sur http://www.iea.org/publications/freepublications/publication/Tracking_Clean_Energy_Progress_2015.pdf
ICCT. (2012). Global Transportation Energy and Climate Roadmap. Retrieved from http://www.theicct.org/sites/default/files/publications/ICCT%20Roadmap%20Energy%20Report.pdf
State Smart Transportation Initiative. (2015, mars 16). For the first time in a decade, U.S. per capita highway travel ticks up. Retrieved from http://www.ssti.us/2015/03/for-the-first-time-in-a-decade-u-s-per-capita-highway-travel-ticks-up/
Stern, N. e. (June 2015). China’s «new normal» : structural change, better growth, and peak emissions. London School of Economics.
UNHSP. (2010). The Challenge of Slums : Global Report on Human Settlements 2010. Retrieved from http://unhabitat.org/books/the-challenge-of-slums-global-report-on-human-settlements-2003/
United Nations, D. o. (2015). 2015 Revision of World Population Prospects. Retrieved from http://esa.un.org/unpd/wpp/
WBCSD - CSI. (2010). Cement roadmap targets. Retrieved from http://www.wbcsdcement.org/pdf/technology/WBCSD-IEA_Cement%20Roadmap_centre_spread_actual_size.pdf
World Steel Association. (2008). Steel and energy Steel and energy. Retrieved from http://www.worldsteel.org/dms/internetDocumentList/fact-sheets/Fact-sheet_Energy/document/Fact%20sheet_Energy.pdf
WRI. (2005). Navigating the Numbers. Retrieved from http://pdf.wri.org/navigating_numbers.pdf

60
//////// Understand ////////
Lim
ited
liabi
lity
com
pany
- Sh
are
capi
tal 7
461
327
,50
- Reg
ulat
ed b
y A
MF
unde
r n°
GP
02- 0
14 -
RC
S Pa
ris n
° 39
4 64
8 21
6 - 2
1 qu
ai d
’Aus
terli
tz -
7563
4 Pa
ris C
edex
13.
Res
pons
ible
inve
stin
g : i
nves
tir re
spon
sabl
e
Sustainable development starts with responsible investment.Responsible investment is a powerful lever to develop a sustainable economic model.
To meet this challenge, we base our investment decisions on the strategies of forward-thinking companies and focus on creating long-term value. Our goal is to develop a new responsible investment model.
Mirova was voted Best at SRI among Asset Management Firms for 2014 by Thomson Reuters and the UK Sustainable Investment and Finance Association(*).
(*)The 2014 Survey represents the views of over 360 investment professionals from 27 countries, makingit the most extensive assessment of socially responsible investing (SRI) in the European investment community. Voting was conducted from 24th March to 7th May 2014. It reflects a contribution from 179 buy-side firms and 14 brokerage firms/research houses. Visit www.uksif.org for more information.Promotional material. Any reference to a ranking, a rating or an award provides no guarantee of future performance and is not constant over time.

61
TAKE ACTIONWhat investment strategies will finance a low carbon economy?
LISTED EQUITIES: Thematic investing for impact .....................................62FIXED INCOME: Green Bonds: forging a direct link between projects and financing ............................................................................................................. 76INFRASTRUCTURE: Renewable Energy Funds: A 100% low carbon allocation .. 81
////
////
Tak
e ac
tion
////
////
Lim
ited
liabi
lity
com
pany
- Sh
are
capi
tal 7
461
327
,50
- Reg
ulat
ed b
y A
MF
unde
r n°
GP
02- 0
14 -
RC
S Pa
ris n
° 39
4 64
8 21
6 - 2
1 qu
ai d
’Aus
terli
tz -
7563
4 Pa
ris C
edex
13.
Res
pons
ible
inve
stin
g : i
nves
tir re
spon
sabl
e
Sustainable development starts with responsible investment.Responsible investment is a powerful lever to develop a sustainable economic model.
To meet this challenge, we base our investment decisions on the strategies of forward-thinking companies and focus on creating long-term value. Our goal is to develop a new responsible investment model.
Mirova was voted Best at SRI among Asset Management Firms for 2014 by Thomson Reuters and the UK Sustainable Investment and Finance Association(*).
(*)The 2014 Survey represents the views of over 360 investment professionals from 27 countries, makingit the most extensive assessment of socially responsible investing (SRI) in the European investment community. Voting was conducted from 24th March to 7th May 2014. It reflects a contribution from 179 buy-side firms and 14 brokerage firms/research houses. Visit www.uksif.org for more information.Promotional material. Any reference to a ranking, a rating or an award provides no guarantee of future performance and is not constant over time.
Mirova, the subsidiary of Natixis Asset Management dedicated to Responsible Investment, offers engaged asset management that seeks to reconcile the creation of value with sustain-able development. A world of opportunities is opening up, opportunities to invest in and for the climate. The object of this chapter is to examine the potential of the equities, bond and infrastructure markets for contributing to financing a low carbon economy.

62
////
////
Tak
e ac
tion
////
////
LISTED EQUITIES: THEMATIC INVESTING FOR IMPACT
Léa Dunand-ChatelletHead of Equities
Clotilde BasselierSRI Portfolio Manager
TABLE OF CONTENTS
1 I Overview 631 I1 Introduction 631 I2 Outlining the universe 631 I 2 I 1 High impact: 40% of the MSCI World Index 641 I 2 I 2 Limited impact: 60% of the MSCI World Index 672 I An array of investment strategies for capitalising on the energy transition 692 I1 Positive carbon impact strategy: 100% Renewables 69
2 I2 High carbon impact strategy: 100% energy transition 692 I3 Optimised carbon impact strategy: energy transition plus diversification 703 I Investing in the energy transition 713 I1 Detailed topography of the universe 713 I2 Influence of regulations on the universe 723 I3 Valuation factors for the investment universe 733 I4 What impact do oil prices have on the performance of these themes? 74
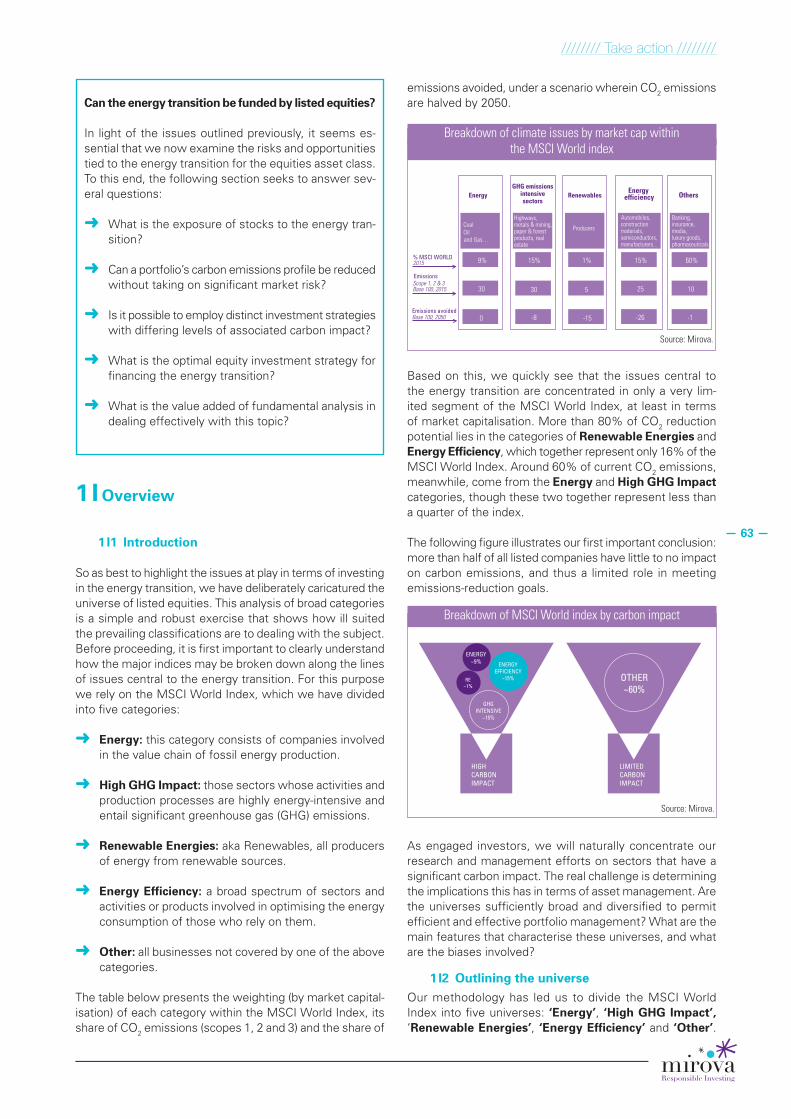
//////// Take action ////////
63
Can the energy transition be funded by listed equities?
In light of the issues outlined previously, it seems es-sential that we now examine the risks and opportunities tied to the energy transition for the equities asset class. To this end, the following section seeks to answer sev-eral questions:
➜ What is the exposure of stocks to the energy tran-sition?
➜ Can a portfolio’s carbon emissions profile be reduced without taking on significant market risk?
➜ Is it possible to employ distinct investment strategies with differing levels of associated carbon impact?
➜ What is the optimal equity investment strategy for financing the energy transition?
➜ What is the value added of fundamental analysis in dealing effectively with this topic?
1 I Overview
1 I1 Introduction
So as best to highlight the issues at play in terms of investing in the energy transition, we have deliberately caricatured the universe of listed equities. This analysis of broad categories is a simple and robust exercise that shows how ill suited the prevailing classifications are to dealing with the subject. Before proceeding, it is first important to clearly understand how the major indices may be broken down along the lines of issues central to the energy transition. For this purpose we rely on the MSCI World Index, which we have divided into five categories:
➜ Energy: this category consists of companies involved in the value chain of fossil energy production.
➜ High GHG Impact: those sectors whose activities and production processes are highly energy-intensive and entail significant greenhouse gas (GHG) emissions.
➜ Renewable Energies: aka Renewables, all producers of energy from renewable sources.
➜ Energy Efficiency: a broad spectrum of sectors and activities or products involved in optimising the energy consumption of those who rely on them.
➜ Other: all businesses not covered by one of the above categories.
The table below presents the weighting (by market capital-isation) of each category within the MSCI World Index, its share of CO2 emissions (scopes 1, 2 and 3) and the share of
emissions avoided, under a scenario wherein CO2 emissions are halved by 2050.
Energy
CoalOiland Gas…
30
0
GHG emissionsintensivesectors
15%
30
-8
Renewables
Producers
Automobiles, constructionmaterials,semiconductors,manufacturers...
Highways,metals & mining,paper & forestproducts, realestate
Banking,insurance,media,luxury goods,pharmaceuticals
1%
5
-15
Energyefficiency
15%
25
-26
Others
60%
10
-1
% MSCI WORLD 2015
Emissions Scope 1, 2 & 3 Base 100, 2015
Emissions avoided Base 100, 2050
9%
Breakdown of climate issues by market cap withinthe MSCI World index
Source: Mirova.
Based on this, we quickly see that the issues central to the energy transition are concentrated in only a very lim-ited segment of the MSCI World Index, at least in terms of market capitalisation. More than 80% of CO2 reduction potential lies in the categories of Renewable Energies and Energy Efficiency, which together represent only 16% of the MSCI World Index. Around 60% of current CO2 emissions, meanwhile, come from the Energy and High GHG Impact categories, though these two together represent less than a quarter of the index.
The following figure illustrates our first important conclusion: more than half of all listed companies have little to no impact on carbon emissions, and thus a limited role in meeting emissions-reduction goals.
HIGHCARBONIMPACT
LIMITEDCARBONIMPACT
ENERGY~9%
RE~1%
ENERGYEFFICIENCY
~15%
GHGINTENSIVE
~15%
OTHER~60%
Breakdown of MSCI World index by carbon impact
Source: Mirova.
As engaged investors, we will naturally concentrate our research and management efforts on sectors that have a significant carbon impact. The real challenge is determining the implications this has in terms of asset management. Are the universes sufficiently broad and diversified to permit efficient and effective portfolio management? What are the main features that characterise these universes, and what are the biases involved?
1 I2 Outlining the universe Our methodology has led us to divide the MSCI World Index into five universes: ‘Energy’, ‘High GHG Impact’, ‘Renewable Energies’, ‘Energy Efficiency’ and ‘Other’.

//////// Take action ////////
64
HIGH CARBON IMPACTLIMITED CARBON
IMPACT
MSCI world Energy High GHG Impact
Energy efficiency
Renewables energies Other
Number of stocks 1 639 168 332 342 16 781
Total capitalisation (Md$) 38 880 3 432 5 514 5 822 243 23 868
Average cap (in billions of $) 23.7 20.4 16.6 17.0 15.0 30.5
Max cap (in billions of $) 645 313 235 254 46 645
Min cap (in billions of $) 0.002 1 1.8 2 1.4 2.4
52% of the MSCI World Index by number of stocks38% of the MSCI World Index by weight
48% by number62% by weight
Source: Mirova.
Universe outlines
The first observation afforded by the table below is the pres-ence of significant biases within each universe: the universe of stocks with a more limited carbon impact is composed of the largest market caps in the index, as is the case with the Energy universe. In comparison, the Renewable Ener-gies universe contains only 16 companies, with the lowest average market cap (US$15 billion).
To better understand the implications of a management strategy whose objective is to contribute to the energy tran-sition, we must analyse each universe in terms of its carbon impact. Within the index of slightly more than 1,600 stocks, then, we will examine first those stocks identified as having a significant carbon impact (section 1.2.1), followed by those whose impact potential we deem limited (section 1.2.2).
1 I 2 I 1 High impact: 40% of the MSCI World Index
As outlined above, the high carbon impact universe is com-posed of four macro-sectors. The last line of the table below highlights the net carbon emissions for each of these four categories.
CoalOiland Gas…
30
0
0
15%
30
-8
1%
5
-15
15%
25
-26
% MSCI WORLD 2015
Emissions Scope 1, 2 et 3 Base 100, 2015
Base 100, 2050
Ajusted emissionsBase 100, 2050
9%
30 22 -10 -1
GHG emissionsintensivesectors
Energy Renewables Energyefficiency
Highways,metals & mining,paper & forestproducts, realestate
Producers
Banking,insurance,media,luxury goods,pharmaceuticals
Emissions avoided
Source: Mirova.
Macro sectors within the ‘High Carbon Impact’ universe
It is clear from what precedes that the Energy and High GHG Impact categories do not offer enough room for improve-ment to reduce their emissions profile within the index to any significant degree. In contrast, the Renewable Energies and Energy Efficiency categories have, at maturity, negative net emissions which contribute to overall carbon emissions reduction. Therefore, before going into further detail, we can again divide the categories into two broader classes, this time according to whether their carbon impact is negative (24% of the MSCI World Index by weight) or positive (16% of the MSCI World Index by weight).
NEGATIVECARBONIMPACT24% MSCIWORLD
POSITIVECARBONIMPACT16% MSCIWORLD
ENERGY~9%
ENERGYEFFICIENCY
~15%
RE~1%
GHGINTENSIVE
~15%
Source: Mirova.
Positive and negative impacts within the ‘High Impact’ universe
Negative carbon impactThe categories in the negative carbon impact class com-prise 500 stocks, slightly over 30% of all stocks in the MSCI World Index by number. Most strikingly, a cursory inspection reveals certain geographical biases, as Europe is over-represented in these sectors. The Asia-Pacific region is over-represented in the ‘Energy’ universe relative to North America, while North America is over-represented in the ‘High GHG Impact’ universe.
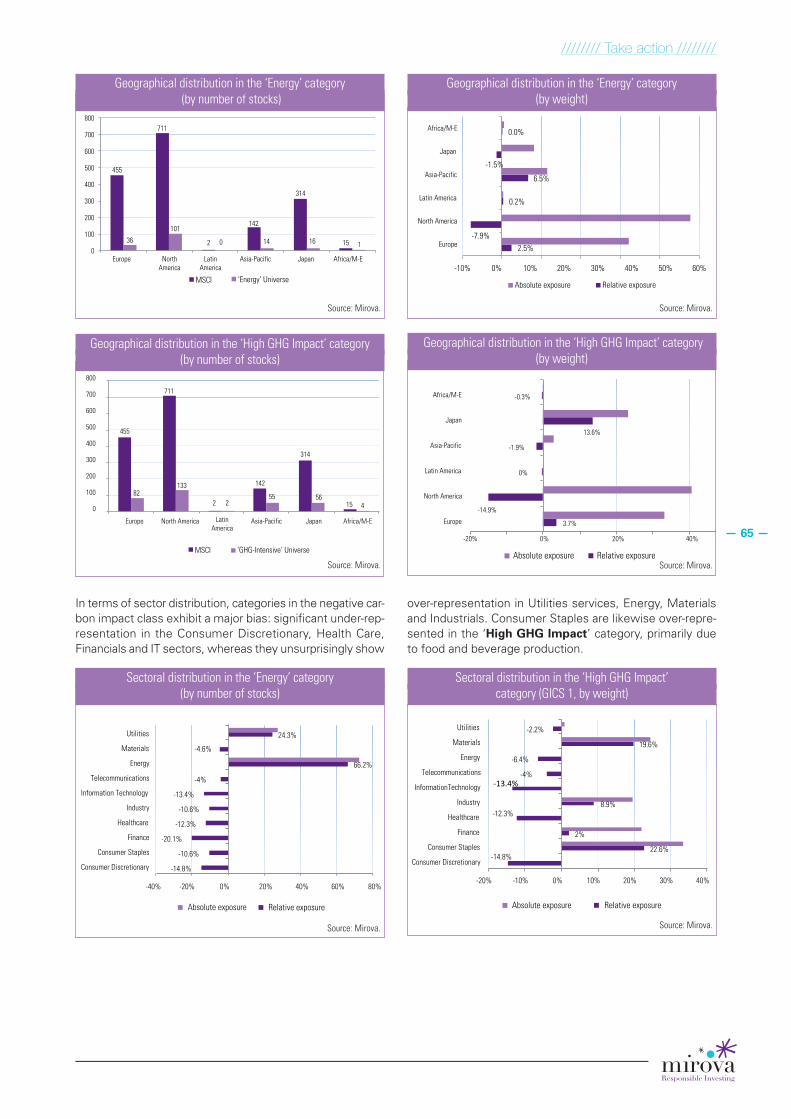
//////// Take action ////////
65
0
100
200
300
400
500
600
700
800
455
711
2
142
314
15
82133
255 56
4
MSCI ‘GHG-Intensive’ Universe
Europe North America LatinAmerica
Asia-Pacific Japan Africa/M-E
-20% 0% 20% 40%
Europe
North America
Latin America
Asia-Pacific
Japan
Africa/M-E
3.7%
-14.9%
0%
-1.9%
13.6%
-0.3%
Absolute exposure Relative exposure
-10% 0% 10% 20% 30% 40% 50% 60%
Europe
North America
Latin America
Asia-Pacific
Japan
Africa/M-E
2.5%-7.9%
0.2%
6.5%
-1.5%
0.0%
Absolute exposure Relative exposure
Sectoral distribution in the ‘Energy’ category(by number of stocks)
Sectoral distribution in the ‘High GHG Impact’category (GICS 1, by weight)
Geographical distribution in the ‘Energy’ category (by number of stocks)
Source: Mirova.
Geographical distribution in the ‘High GHG Impact’ category(by number of stocks)
Source: Mirova.
Geographical distribution in the ‘Energy’ category (by weight)
Source: Mirova.
Geographical distribution in the ‘High GHG Impact’ category(by weight)
Source: Mirova.
In terms of sector distribution, categories in the negative car-bon impact class exhibit a major bias: significant under-rep-resentation in the Consumer Discretionary, Health Care, Financials and IT sectors, whereas they unsurprisingly show
over-representation in Utilities services, Energy, Materials and Industrials. Consumer Staples are likewise over-repre-sented in the ‘High GHG Impact’ category, primarily due to food and beverage production.
455
711
2
142
314
1536
101
0 14 16 10
100
200
300
400
500
600
700
800
Europe NorthAmerica
LatinAmerica
Asia-Pacific Japan Africa/M-E
MSCI ‘Energy’ Universe
-14.8%22.6%
2%
-12.3%8.9%
-13.4%-4%
-6.4%
19.6%
-2.2%
-20% -10% 0% 10% 20% 30% 40%
Consumer Discretionary
Consumer Staples
Finance
Healthcare
Industry
InformationTechnology
Telecommunications
Energy
Materials
Utilities
Relative exposureAbsolute exposure
Source: Mirova. Source: Mirova.
-40% -20% 0% 20%20% 40% 60% 80%
Consumer Discretionary
Consumer Staples
Finance
Healthcare
Industry
Information Technology
Telecommunications
Energy
Materials
Utilities
-14.8%
-10.6%
-20.1%
-12.3%
-10.6%
-13.4%
-4%
-4.6%
66.2%
24.3%
Relative exposureAbsolute exposure

//////// Take action ////////
66
455
711
2
142
314
157 7 0 1 1 00
100
200
300
400
500
600
700
800
Europe NorthAmerica
LatinAmerica
Asia-Pacific Japan Africa/M-E
MSCI ‘Renewable Energies’ Universe
Europe
North America
Latin America
Asia-Pacific
Japan
Africa/M-E
28.9%
-18.1%
0%
-3.2%
-7.1%
-0.4%
-20% 0% 20% 40% 60%
Relative exposureAbsolute exposure
-20% 0% 20% 40%
Europe
North America
Latin America
Asia-Pacific
Japan
Africa/M-E
3.7%
-14.9%
0%
-1.9%
13.6%
-0.3%
Absolute exposure Relative exposure
2%
20%
47%
31%<3 $bn
3-7 $bn
7-25 $bn>25 $bn
7%
34%
41%
18%
<3 $bn
3-7 $bn
7-25 $bn>25 $bn
Geographical distribution in the ‘Renewable Energies’ category (by number of stocks)
Geographical distribution in the ‘Renewable Energies’ category (by weight)
Finally, breaking down the negative carbon impact class by company size uncovers essentially no bias aside from the ‘High GHG Impact’ category, which is overexposed to mid
caps (US$3 bn – US$7 bn market cap), with a 34% share compared to 25% within the index, over stocks with very large market caps (>US$25 billion).
Market cap distribution in the ‘high GHG impact’ category (by number of stocks)
Source: Mirova.
Market cap distribution in the ‘Energy’ category (by number of stocks)
Source: Mirova.
Positive carbon impactWe now continue our analysis with the positive carbon impact class, which comprises 358 stocks, or slightly un-der 22% of stocks in the MSCI World Index by number. We observe significant geographical bias in this class as well, due to over-representation by Europe, especially in ‘Renewable Energies’, with +29% relative to the MSCI
World. North America, by contrast, is very under-represented in this category with -15% and -18% respectively for ‘Energy Efficiency’ and ‘Renewable Energies’. Finally, exposure in Japan is contrasted along category lines, with +14% in ‘Energy Efficiency’ and −7% in ‘Renewable Energies’.
Geographical distribution in the ‘Energy Efficiency’ category (by number of stocks)
Source: Mirova.
Geographical distribution in the ‘Energy Efficiency’ category(by weight)
Source: Mirova.
455
711
2
142
314
15
103 109
0 15
114
1
MSCI ‘Energy efficiency’ Universe
0
100
200
300
400
500
600
700
800
Europe NorthAmerica
LatinAmerica
Asia-Pacific Japan Africa/M-E
Source: Mirova. Source: Mirova.

//////// Take action ////////
67
7%
28%
47%
18%
<3 $bn
3-7 $bn
7-25 $bn>25 $bn
1 I 2 I 2 Limited impact: 60% of the MSCI World Index
Having observed that the range of possible actions in the positive carbon impact class sectors is limited, balanced management demands that we also consider stocks that appear to have negligible carbon impact.
Comprising 781 companies, this universe represents 60% of the MSCI World index by number. The benefit of stocks with a limited carbon impact is that they offer advantageous
diversification to investors who seek it. Although the growth margins for the constituents of this class are slim, their share of total emissions represents only 10%, and their net emissions through 2050 thus remain low, as the base effect is favourable.
By definition, then, the ‘Other’ universe exhibits biases which go against those outlined previously, as detailed in the analysis below.
Unsurprisingly, the sectoral distribution among the cate-gories in the positive carbon impact class is highly biased in favour of Industrials (+38% for ‘Energy Efficiency’) and Commercial & Utilities (+90% for ‘Renewable Energies’).
Most other sectors are under-represented relative to the MSCI World Index, especially Financials, Consumer Staples and Health Care.
Sectoral distribution in the ‘Energy Efficiency’ category(GICS 1, by weight)
Source: Mirova.
Sectoral distribution in the ‘Renewable Energies’ category(GICS 1, by weight)
Source: Mirova.
Finally, the distribution of universes in the positive carbon impact class by company size shows a bias towards small caps (< US$3 billion) and mid caps (between US$3 billion and US$7 billion), which represent around 35% within the impact class, compared to 30% in the MSCI World Index. Contrary to what one might think, it appears that small and
mid caps do not constitute a majority of high carbon impact stocks. This is a result of low representation within the Re-newable Energies sector, precisely for reasons of size. This further confirms that, in terms of management strategy, the Renewable Energies category must be considered a distinct segment with unique features.
Market cap distribution in the ‘Energy Efficiency’ category(by number of stocks)
Source: Mirova.
Market cap distribution in the ‘Renewable Energies’ category(by number of stocks)
Source: Mirova.
Utilities
Absolute exposure Relative exposure
-3.1%
-40% -20% 0% 20% 40% 60%
3.3%-6.4%
-4%
5.2%
38.1%-12.3%
-20.1%
-10.6%10%
Materials
Energy
TelecommunicationsInformation Technology
IndustryHealthcare
FinanceConsumer Staples
Consumer Discretionary
<3 $bn
3-7 $bn
7-25 $bn>25 $bn
19%
44%
31%
6%
90.3%-4.6%-6.4%
-4.0%-12.2%
-5.6%-12.3%
-20.1%-10.6%
-14.8%
Utilities
Materials
Telecommunications
Information Technology
Energy
IndustryHealthcare
Finance
Consumer StaplesConsumer Discretionary
Absolute exposure Relative exposure
-20%-40% 0% 20% 40% 60% 80% 100%

//////// Take action ////////
68
<3 $bn
3-7 $bn
7-25 $bn>25 $bn
8%
45%41%
6%
Absolute exposure Relative exposure
Africa / M-E 0.1%
-2%
-0.9%
0%
5%
-2.2%
-10% 0% 10% 20% 30% 40% 50% 60%
Japan
70%
Asia-Pacific
Latin America
North America
Europe
OTHERS
60%
10
-1
9
% MSCI WORLD 2015
EmissionsScope 1, 2 & 3 Base 100, 2015
Emissions avoidedBase 100, 2050
Adjusted emissions Base 100, 2050
Banking,insurance,media,luxury goods,pharmaceuticals
Source: Mirova.
Characteristics of the ‘Limited Impact’ category
We note first that there are no strong geographical biases in the Other category, with North America exhibiting the great-est deviation from the index, with 60% exposure compared to 55% in the MSCI World.
Geographical distribution in the ‘Other’ category(by number of stocks)
Geographical distribution in the ‘other’ category (by weight)
By their nature, the sectors represented in the ‘Other’ category are themselves the category’s most significant bias. Industrials, Energy, Materials, and Commercial & Util-ities are significantly under-represented, while the fields of Health Care, Financials, Telecommunication Services, Consumer Discretionary, and Information Technology are in turn over-represented.
Sectoral distribution in the ‘Other’ category(GICS 1, by weight)
Source: Mirova.
Finally, the distribution of companies by size in the ‘Other’ universe shows a strong bias in favour of mid cap companies (US$3 billion – US$7 billion), which represent 45% within the category, compared to 25% in the MSCI World Index. Giant caps (>US$25 billion) are relatively scarce: 6% within the cat-egory compared to 24% in the index, by number.
Market cap distribution in the ‘Other’ category(by number of stocks)
Source: Mirova.
This first part has allowed us to show that only a relatively small proportion of listed companies have a significant carbon impact, whether positive or negative, around 40% of the stocks in the MSCI World Index. This division foregrounds certain sectoral biases that have a weakening effect on equity strategies aimed at energy efficiency. Only 15% of the MSCI World Index has a positive carbon impact profile through 2050, which leaves a very narrow field to choose from. It is for this reason that we undertake in the following part to lay out in detail several different management strategies according to their market risk. These strategies have carbon impact profiles of varying significance.
‘Others’ Universe
Europe NorthAmerica
LatinAmerica
Asia-Pacific
Japan Africa/M-E
MSCI
0
100
200
300
400
500 455
227
711
361
142
2 057
314
700
127
15 9
800
600
Consumer Discretionary
Consumer StaplesFinance
HealthcareIndustry
Technology
TelecommunicationsEnergy
Materials
Utilities
Absolute exposure Relative exposure
-10%
-3.1%-4.6%
-6.4%
-15%
2.5%3.9%
-9.8%
7.7%
7.5%-1%
-5% 0% 5% 10% 15% 20% 25% 30%3.3%
Source: Mirova.
Source: Mirova.

//////// Take action ////////
69
2 I An array of investment strategies for capitalising on the energy transition
In light of the foregoing, we consider it possible to finance the energy transition through listed equities, while holding portfolios exhibiting carbon footprints of varying sizes. Intuitively, of course, one assumes that the risk of an asset varies directly with its carbon impact, and for this reason a number of strategies are possible, depending on the specific needs of each investor. Carbon impact can be anticipated based on the level of risk exposure an investor is comfortable with.
We thus propose to describe three investment solutions offering distinctly different carbon footprints and asset management styles in order to examine how each has behaved historically to date.
POSITIVECARBONIMPACT
HIGH CARBONIMPACT
OPSTIMISEDCARBON IMPACT
Sector:Renewable Energy
Universe 150(90% outsideMSCI World)
Model portfolio25 securities
beta-1.5TE - 10/12
Active Share 99%
Model portfolio50 securities
beta-1.2TE - 7/8
Active Share ~95%
Model portfolio80 securities
beta-1.0TE - 3/4
Active Share ~90%
Universe 358 Universe 1150
Sectors: Renewable Energy& Energy Efficiency
Sectors: Renewable EnergyEnergy efficiency
& others
Carbon reduction investment strategies
Source : Mirova.
2 I1 Positive carbon impact strategy: 100% Renewables
Investing only in renewable energies offers the advantage of ensuring a positive carbon impact, since assets held in the portfolio emit little in the way of GHG today, and offer the most effective solutions available on the market horizon to 2050 for reducing emissions.
This strategy, however, does suffer from the limited possibilities for diversification discussed earlier, which lead to a management approach that has no reference index and a concentrated portfolio. The investment universe of 150 stocks largely falls outside the MSCI World index, which has a less than 1% direct exposure to Renewables by weight, consisting of 16 companies.
We therefore expanded our analysis to encompass all stocks with a minimum float of US$100 million, whose revenues are 100% directly related to renewable energies.
Performance analysis of the ‘Positive Carbon Impact’ universe over a decade reveals a high level of divergence between the unweighted calculations and those weighted by market capitalisation. This observation is easily explained by the large proportion of small and midsize companies. The table below also shows that one noticeable effect of this
strategy is a universe significantly more volatile than the MSCI World. This volatility is even more significant when looking at the unweighted universe.
sep 0
5de
c 05
mar 0
6jun
06se
p 06
dec 0
6ma
r 07
jun 07
sep 0
7de
c 07
mar 0
8jun
08se
p 08
dec 0
8ma
r 09
jun 09
sep 0
9de
c 09
mar 1
0jui
10se
p 10
dec 1
0ma
r 11
jun 11
sep 1
1de
c 11
mar 1
2jun
12se
p 12
dec 1
2ma
r 13
jui 13
sep 1
3de
c 13
mar 1
4jui
14se
p 14
dec 1
4ma
r 15
jun 15
-50
0
50
100
MSCI World NDR$ Renewable weighted by market cap
150
200
Renewable unweighted
26.86
72.03
135.45
Performance of the ‘positive carbon impact’ universeover the last decade
Source: Mirova.
Characteristics: Universe consisting of 146 securities, monthly performances as at 31/08/2015, in US$ with dividends reinvested.
Thus, implementing an investment strategy based on ‘pure Renewables’ requires extensive analysis of fundamentals to ensure selective and effective asset management for performance. Designing a concentrated portfolio comprising approximately 25 stocks produces management that deviates considerably from indices (Active Share >99%), with tracking error of 8-10 and a beta greater than 1.5.
Performance (10yr, as at 31/08/2015)
Volatility (10yr, m/m)
Unweighted universe 26.8% 23.7%
Universe weighted by Market Cap
135.4% 19.5%
MSCI World NDR $ 69.2% 16.1%
Source: Mirova.
Performance and volatility of the ‘positive carbon impact’ universe
2 I2 High carbon impact strategy: 100% energy transition
To create a strategy with a high impact on carbon emissions, we propose an eligible universe that comprises the macro-sec-tors ‘Renewable Energies’ and ‘Energy Efficiency’. For the purposes of this analysis, only stocks belonging to the MSCI World index are included. The purpose of this calculation is to ensure significant impact while broadening the available investment universe. The direct outcome is a portfolio whose carbon footprint is currently larger than that of the preced-ing example (inclusive of direct and indirect emissions), but whose contributions to solutions via the businesses invested in should significantly help to reduce carbon emissions within the 2050 horizon.
In terms of management, this strategy offers the advantage of a broader eligible universe (close to 350 stocks) whose sectoral and geographical characteristics, as well as size, are

//////// Take action ////////
70
much more balanced. As the financial and services sectors are entirely excluded, the portfolio displays statistics similar to those of a cyclically dominated fund, with higher volatility than diversified equities markets. Despite the broader investment universe (16% of the MSCI World), the portfolio associated with this strategy remains concentrated.
MSCI World NDR$ High carbone Impact universe unweighted High Carbon Impact universe market-cap weighted
sep.
05
jan.
06
may
06
sep.
06
jan.
07
may
07
sep.
07
jan.
08
may
08
sep.
08
jan.
09
may
09
sep.
09
jan.
10
may
10
sep.
10
jan.
11
may
11
sep.
11
jan.
12
may
12
sep.
12
jan.
13
may
13
sep.
13
jan.
14
may
14
sep.
14
jan.
15
may
15
-50
0
100
50
150
200
250
300
218.98
200.13
72.03
Performance of the ‘High Carbon Impact’ universeover the last decade
Source: Mirova.
Characteristics: Universe comprising 358 securities, monthly performances as at 31/08/2015, in $, dividends reinvested.
Analysing the performance of the ‘High Carbon Impact’ universe over the last ten years reveals a surprising lack of divergence between the unweighted universe and that weighted by market-cap. This result runs contrary to intuition, given that the universe remains heavily biased in terms of sector and market cap size. The table below further demon-strates that the primary effect of the strategy is to reduce volatility compared to the ‘Pure Renewables’ strategy. That said, this universe remains more volatile than the MSCI World as a whole.
Source: Mirova.
Performance (10yr, as at 31/08/2015)
Volatility (10yr, m/m)
Unweighted universe 200.0% 18.2%
Universe weighted by Market Cap
219.0% 18.5%
MSCI World NDR in $ 69.2% 16.1%
Performance and volatility of the ‘High Carbon impact’ universe
Given the above, a high carbon impact investment strategy can be designed around a portfolio of about 50 stocks. Active Share remains high (>95%) but tracking error is reduced to 7/8. This portfolio, like the preceding example exhibits higher risk than the market as a whole, with a beta in the neighbourhood of 1.2.
2 I3 Optimised carbon impact strategy: energy transition plus diversification
Achieving a balanced portfolio while maintaining a positive carbon impact requires the inclusion of stocks from the ‘Other’ macro-sector, which offers low or null impact arising
from carbon emissions. This strategy dilutes the total car-bon impact, which is thus optimised within the constraints of diversified portfolio management. Introducing equities from the financial, health, telecommunications or consumer goods sectors do not currently affect the portfolio’s carbon footprint, neither do they offer significant solutions to the challenges of energy transition within the 2050 horizon. The main effect is that of reducing the biases exhibited by the strategies previously described.
MSCI World NDR $ Optimised Carbon Impact unweighted Optimised Carbon Impact unweighted by market cap
sep.
05
jan.
06
may
06
sep.
06
jan.
07
may
07
sep.
07
jan.
08
may
08
sep.
08
jan.
09
may
09
sep.
09
jan.
10
may
10
sep.
10
jan.
11
may
11
sep.
11
jan.
12
may
12
sep.
12
jan.
13
may
13
sep.
13
jan.
14
may
14
sep.
14
jan.
15
may
15
-50
0
100
50
150
200
250
300
241.41
72.03
208.51
Performance of the ‘Optimised Carbon Impact’ universeover the last decade
Characteristics: Universe comprising 1139 securities, monthly performances as at 31/08/2015, in $, dividends reinvested.
Analysing the performance of this universe shows that the unweighted universe and market cap-weighted universe diverge noticeably. The table below also indicates that the diversification permitted by this strategy has the expected effect on volatility, reducing this aspect to levels akin to those of MSCI World.
Sources: Mirova.
Performance and volatility of the ‘Optimised Carbon Impact’ universe
Performance (10yr, as at 31/08/2015)
Volatility (10yr, m/m)
Unweighted universe 208.5% 16.5%
Universe weighted by Market Cap
241.4% 15.8%
MSCI World NDR in $ 69.2% 16.1%
The portfolio that might be designed in this case is less concentrated (close to 80 stocks), thanks to an eligible uni-verse of over 1,100 stocks, representing 75% of the MSCI World by market cap. With beta close to 1.0, and continuous tracking error limited to 2 or 3, this strategy offers an optimal solution for addressing carbon issues. To summarize, comparative analysis of these three strat-egies makes it possible to confirm that there is indeed a positive correlation between (desirable) carbon impact and the amount of risk assumed by an investor. It is therefore essential to offer portfolios that are adjusted to expected risk
Source: Mirova.

//////// Take action ////////
71
levels, while offering investment solutions that contribute effectively to carbon emissions reduction targets within the 2050 horizon. It also appears clear that the design of a positive impact portfolio must entail total exclusion of the macro-sectors ‘Energy’ and ‘High GHG Impact’.
OptimisedCarbonImpact
HighCarbonImpact
PositiveCarbonImpact
CARBON IMPACT
RISK
Relative risk / carbon impact profiles for the three investment strategies
Source : Mirova.
Mirova has concentrated on the ‘High Carbon Impact’ strategy, which reconciles a fairly balanced management style with investments offering meaningful impact. The macro-sectoral perspective we have presented here does, nonetheless, have a limitation, namely its reference index, the MSCI World. The added value of in-depth financial and extra-financial analysis is here to reveal additional oppor-tunities in the area of smaller stocks whose activities are directly related to the energy transition. This is a crucial step in a conviction-based management approach, which Part 3 of this article covers in detail.
3 I Investing in the energy transition
The fore analysis has focused on presenting a macroeco-nomic perspective on the exposure of global equities to the energy transition. This section is devoted to defining a narrower universe that combines financial and extra-financial analysis to better sketch its scope and perimeter. To this end, fundamental analysis of companies can help define three categories of investment themes for the energy transition:
➜ Low carbon energy: renewable energies and transition technologies;
➜ Energy efficiency: in the building sector, transport, and industry;
➜ Enabling technologies: electric vehicles, energy stor-age, etc.
The first two themes mentioned directly address the re-duction of GHG emissions, both in terms of production
(Renewables) and energy consumption (energy efficiency). The third theme involves technologies that do not directly lower emissions, but go hand in hand with the first two (such as electric vehicles).
Within each of these areas, we have identified the players offering solutions positioned at each phase of the value chain. Given the global nature of the challenges associated with the energy transition, the search for opportunities covers the entire world. If we take the solar industry, for example, opportunities include players involved in PV cell and module production, project development and financing, construction and installation, right down to the operators of solar energy farms.
3 I1 Detailed topography of the universe
Using a ‘bottom up’ approach, applied to various themes associated with the energy transition, we have designed an investment universe consisting of 316 stocks, distributed as follows (by weight): 55% in energy efficiency, 28% in low carbon energy solutions and 17% in enabling technologies. This approach allows us to incorporate ‘pure plays’, many of which are small in terms of capitalisation, particularly in the area of Renewables. As a result, Renewables represent 44% of the universe by number of companies, but 20% in terms of market cap.
ThemeNumber of
stocks% (nb)
Average mkt cap
($bn)
% (weight)
Enabling technologies
25 7.9% 17.34 17.3%
EV/Fuel cell 18 5.7% 21.46 15.4%
Smart grid/Storage
7 2.2% 6.74 1.9%
Energy efficiency
125 39.6% 11.04 54.9%
Buildings 38 12.0% 5.49 8.3%
Industry 19 6.0% 19.50 14.8%
Transport 68 21.5% 11.77 31.9%
Low carbon energy
166 52.5% 4.21 27.8%
Renewables 139 44.0% 3.68 20.4%
Transition technologies
27 8.5% 6.95 7.5%
Total 316 100.0% 7.95 100.0%
Distribution of the Energy Transition universe by theme
Source: Mirova.
This universe offers a healthy degree of geographical di-versity, consisting of: 36% European equities, 31% North American, and 28% Asian (including Japan). Companies located in emerging markets represent 21% of the total universe by number of companies.

//////// Take action ////////
72
Others
North America
EuropeJapanLatin America
Asia pacific
36%
21%
31%7%
4%1%
Geographical distribution of the Energy Transition universe(by number of companies)
Source : Mirova.
Consistent with the analysis conducted in Part 1, the spec-ificity of the theme leads to significant biases compared to a generic index such as the MSCI World.
➜ The predominance of the three following sectors (ac-cording to GICS classification): Industrials (44%), Con-sumer Discretionary (26%) and Utilities (14%). Com-pared to their relative weighting in the MSCI World index, these sectors are overweight by 14%, 13% and 11% respectively. Other sectors are practically absent from this universe: Financials, Health Care, Telecommu-nications Services and Consumer Staples (underweight relative to the MSCI World by 21%, 12%, 10%, and 9% respectively).
Distribution of the Energy Transition universe by GICS sectorcompared to MSCI world
Source : Mirova.
GICS1 ET Universe MSCI World Difference
Consumer Discretionary 26.2% 14.8% 11.4%
Consumer Staples 0.1% 10.7% -10.6%
Energy 2.0% 6.5% -4.5%
Financials 0.7% 20.2% -19.5%
Health Care 0.0% 12.2% -12.2%
Industrials 44.1% 10.6% 33.5%
Information Technology 3.6% 13.2% -9.7%
Materials 9.1% 4.8% 4.3%
Telecommunication Services 0.0% 4.0% -4.0%
Utilities 14.4% 3.1% 11.2%
Total 100.0% 100.0% 0.0%
➜ In terms of market capitalisation, the universe is charac-terised by the prevalence of small cap stocks (<$3bn), which constitute 56% of all stocks at the expense of large caps (>$25bn). Although this order reverses when looking at the weighted universe, since small caps comprise no more than 6.5% of the universe by weight, large caps lag behind the MSCI World at 55% compared to 70% for the index.
Distribution of the Energy Transition universe by market capitalisation
Source : Mirova.
Market cap ($bn)
ET Universe
(nb)
Univers TE
(weight)
MSCI World
(weight)Difference
3 > 55.7% 6.5% 0.3% 6.1%
3-7 18.7% 11.3% 4.8% 6.5%
7-25 16.1% 27.1% 25.0% 2.1%
> 25 9.5% 55.1% 69.9% -14.8%
Total 100.0% 100.0% 100.0% 0.0%
3 I2 Influence of regulations on the universe
One striking feature of this theme is the significant influence of regulation on several of its sectors. These legislative pressures can lead to the emergence of new technologies or products, as is the case in the realm of energy efficiency: transmission sys-tems and vehicle lightweighting have followed from standards limiting CO2 emissions in the automobile industry, incandescent lights are being replaced with LEDs in the lighting industry etc.
As concerns low-carbon energy, the significance of regulations is further increased by the fact that they impose regulations very real changes in the business models of traditional power producers. Despite the growing maturity of their business model, illustrated in the steep decline of production costs for solar and wind power, Renewables (20% of the investment universe by weight) remain dependent on the subsidisation schemes established in a number of countries, whether in the form of feed-in tariffs (Europe, China), tax credits (the ITC and PTC in the US), or long term contracts (Brazil).
In the United States, the ITC (Investment Tax Credit) is set to expire at the end of 2016 (the current 30% exemption rate will, in principle, drop to 0% for residential installations and 10% for commercial). The RPS (Renewable Portfolio Standards), thus far established in 29 of the 50 United States is expected to take over from the earlier subventions (RPS cover only on-grid utilities, not residential installations). Residential solar continues to be dependent on incentives such as ‘net metering,’ which allows individuals to sell green energy back to the grid at retail prices (43 states have enacted legislation of this type).
The EPA (Environmental Protection Agency) published the most recent draft of a project to regulate GHG emissions arising from the electrical utilities sector in August of 2015. The ‘Clean Power Plan’ contains provisions imposing a 32% reduction in CO2 emissions by 2030 (relative to 2005 levels). If passed, this legislation would force closure among a large number of coal-fired power plants (39% of the energy mix in 2014), benefiting clean energies such as hydroelectric, wind and solar power. The proportion of renewable energies (including hydro) in the mix should reach 28% of all electricity generated some time before 2030 (compared to 13% in 2014). The regulations contain provisions for financial assistance to states in order to support their investments in Renewables.
The majority of new solar capacity installations in the US (59% in 2014) consist of utilities-type solar energy farms, although the ‘Distributed Generation’ segment (solar panels installed on

//////// Take action ////////
73
the rooftops of houses or commercial buildings) is currently experiencing the highest growth rates. Beyond the households that wish to economise on their electricity bills (as in California), an emerging trend is for large companies to produce their own electricity using Renewables (Amazon, Walmart) and potentially go off grid (with access to affordable storage solutions).
Integrating Renewables, which are by nature intermittent ener-gy sources, requires that utilities make investments in several distinct areas: back-up solutions, such as Combined Cycle Gas-Turbines (CCGT), which are more flexible and efficient than traditional plants, and demand-response management systems in the form of smart grids. A number of players are investing in battery technology, like Tesla, which launched the powerpack in April 2015, as a solution to combine with rooftop solar as a means of reducing the generation costs associated with peaks in demand. Nextera Energy is another such company. Little by little we are edging toward a power generation model that is much less centralized and associated with energy storage solutions (batteries, electric vehicles etc.).
3 I3 Valuation factors for the investment universe
Analysis of the relevant market multiples for the 7 sub-themes contained in the universe reveals the following characteristics:
➜ The Energy Transition universe trades at valuation levels that are generally higher than average ratios for the market as a whole. This is attributable to the higher growth curve of the universe as a whole for the current year, average PE ratio is 21.8 for this investment universe compared to 17.2 for the MSCI World as a whole, which should be seen
alongside an expected EPS growth of 14.2% compared to 10.8% respectively, for the next 3-5 years. As regards other multiples, the universe carries a valuation premium compared to the MSCI World of somewhere between 20% (Price/Book) and 50% (Price/Cash Flow).
➜ Within the investment universe, the two sub-themes, Renewables and Electric Vehicles, are those displaying the highest ratios. EPS growth of close to 50% expected for this year should drive down the PE ratio of Renewables from 27.7 in 2015, to 19.7 in 2016. The 35x PE ratio an-ticipated for Electric Vehicles in 2016 is heavily influenced by the valuation of Tesla, which is expected to report a profit for the first time in its history in 2016, according to analysts’ projections.
➜ In the Energy Efficiency category, valuation levels tend to be somewhat below average for the universe, exception made for the Price/Book multiple in the Transport and Industry themes (situated at about 3 relative to an average of 2.4), justified by an above-average ROE (17% compared to a 14% average). Building exhibits an ROE of 12%, lower than other segments, however, its expected EPS is the strongest of the three segments, reflecting the potential for restructuring at several companies (Osram).
➜ The observed average dividend yield within the Energy Transition universe is higher than that of the MSCI World (3.18% versus 2.67%). This divergence is largely due to the Low Carbon Energy theme: in Renewables, the 4.10% yield is pushed upwards by yieldcos, whose function is to redistribute a high proportion of their cash flow; in the Transition Technologies category, infrastructure for the gas industry is currently the area producing the highest yields.
PE current year PE next year Price/Cash
flowPrice/sales current year Price/Book ROE
next yearDividend yield
current year
Low carbon energy
Renewables 27.65 19.66 17.49 2.10 1.75 13.35% 4.10%
Transition technology 19.01 17.11 9.24 1.73 2.58 14.21% 3.19%
Energy Efficiency
Transportation 19.42 17.46 15.14 1.62 3.08 16.68% 2.66%
Building 18.86 17.52 17.11 1.23 2.33 11.55% 2.53%
Industry 17.19 15.58 12.62 1.74 3.06 17.71% 2.74%
Enabling technologies
Electric vehicles / Fuel cell 12.10 35.10 20.43 1.80 4.33 11.61% 2.66%
Smart grid / Storage 16.99 12.79 9.68 1.33 1.79 5.68% 2.40%
Total 21.80 18.92 15.54 1.78 2.43 14.05% 3.18%
MSCI World 17.17 15.84 10.23 1.36 2.04 11.16% 2.67%
Valuation gap ET universevs MSCI World 27% 19% 52% 31% 19% 26% 19%
Energy transition - Stock market multiples (Sept 4th 2015)
Source: Mirova.

//////// Take action ////////
74
3 I4 What impact do oil prices have on the performance of these themes?
In the context of oil prices that have been falling since mid-2014 (-60% between peak and trough), we have attempted to analyse the impact of fluctuations in the price of energy on the prices of stocks in three core themes of the Energy Transition universe: wind power, solar and energy efficiency. The result of these analyses indicates that: 1/ the correlation is more or less strong according to the theme examined (weak for wind power); 2/ the correlation may be stronger during certain periods (particularly for solar); and 3/ a number of factors besides oil affect the stock market performance of these themes, particularly access to financing and prevailing interest rates.
Wind power: comparative performance against the Brent and MSCI WorldManufacturers of wind turbines began catching up on the markets beginning in January 2013 (+200%), a trend that has continued in 2015 (+50%), and this despite the falling price of oil. This upward movement of the wind power sleeve followed a veritable collapse of stock prices in 2008-2009 following the GFC. Several factors contribute to explaining the revaluation of wind sector. Improved order books at the beginning of 2013 were assisted by a stabilisation in the price of turbines; the decision at the end of 2014 to renew the PTC (Production Tax Credit) for a year in the US was also a factor, as were the effects of restructuring conducted by a number of manufacturers during the trough of the cycle.
30
300
2005 2006 2007 2008 2009 2010 2011 2012 2013 2014 2015
Year
Sector Index- market cap weighted Brent - 1 month future MSCI World
Pric
e (B
ase
100
- 01/
01/2
005)
Wind: sector performance compared to commodity prices2005-2015 (log scale)
Solar power: performance compared against the Brent and MSCI WorldThe correlation between solar stock prices and the oil barrel strengthened considerably on two occasions, in fall of 2014 and during the months of May through August 2015. This is due in part to technical factors (across the board sales of energy indices), but also attributable to solar’s imputed loss of competitiveness relative to fossil fuels. However, oil represents no more than 5% of the electrical power gener-ated worldwide. Furthermore, a long and steady decline in the cost of producing solar energy, coupled with the fiscal incentives offered by a number of countries, ought to support the continued growth of installed capacity.
EPS growth current year
EPS growth next 3-5
years
EBITDA margin
Sales growth last
5 years
Sales growth current year Debt/Equity Pay-out
ratio
Low carbon energy
Renewables 50.70% 17.80% -26.36% 15.30% 20.13% 1.43 61.3%
Transition technology 17.21% 7.31% 26.45% 10.00% 11.83% 0.95 51.3%
Energy Efficiency
Transportation 8.32% 11.60% 18.74% 6,59% 6.92% 2.94 42.6%
Building 33.04% 17.54% 5.27% 6.91% 7.14% 0.47 48.4%
Industry 28.41% 8.83% 16.85% 5.72% 0.96% 0.71 55.0%
Enabling technologies
Electric vehicles / Fuel cell 15.51% 19.76% -46.73% 34.49% 23.98% 0.83 29.2%
Smart grid / Storage 19.19% 13.78% 19.57% 7.66% 7.62% 0.65 20.9%
Total 30.74% 14.16% -5.67% 12.02% 13.71% 1.52 51.0%
MSCI World 5.37% 10.76% 16.59% na -6.17% 1.40 52.5%
Valuation gap ET universevs MSCI World ns 32% ns ns ns 8% -3%
Energy transition - Financial ratios (Sept 4, 2015)
Source : Mirova.
Source : Mirova.

//////// Take action ////////
75
Solar: Sector performance compared to commodity prices2005-2015 (log scale)
Sector Index- market cap weighted Brent - 1 month future MSCI World
Pric
e (B
ase
100
- 01/
01/2
005)
40
400
2005 2006 2007 2008 2009 2010 2011 2012 2013 2014 2015
Year
Energy efficiency: performance compared against the Brent and MSCI World
For the period under consideration it appears that stocks as-sociated with energy efficiency have exhibited better per-formance than the index overall, despite a recent spate of underperformance (beginning in summer 2014). This latter may indeed be related to the drop in energy prices having slowed investment in more efficient equipment and appliances. A sub-stantial amount of the recent weakness displayed by industrials can be attributed to the global macroeconomic environment, concerns about Chinese growth and anxieties regarding the potential rise of interest rates in the United States.
Industrial EE: Sector performance compared to commodityprices 2005-2015 (log scale)
Pric
e (B
ase
100
- 01/
01/2
005)
Sector Index- market cap weighted Brent - 1 month future MSCI World
50
2005 2006 2007 2008 2009 2010 2011 2012 2013 2014 2015
Year
500
Conclusion
The Energy Transition Universe, populated by companies that are positioned to offer solutions within the theme of reducing GHG emissions, exhibits significant biases compared to a generic index like the MSCI World. These include sectoral bi-ases (overweight industrials) and skewed capitalisation (high proportion of small caps). This universe is also considerably influenced by regulations touching certain business models, particularly that of power generation which are challenged by the emergence of renewable energies.
In terms of stock performances, the resurgent correlation between solar stocks and the price of oil does not appear to affect the other themes in the universe (particularly wind power and energy efficiency). Ten-year comparative perfor-mance analysis using the universe against the MSCI World (performance in euros, as at 31/08/2015, net dividends reinvested) indicates an outperformance of the Energy Tran-sition Universe (unweighted and market cap weighted). The primary contributor to the overall performance of the universe has been the Energy Efficiency theme.
142.19
85.68
274.12
-100
-50
0
50
100
150
200
250
300
350
400
aug.-
05
dec.-
05ap
r.-06
aug.-
06
de.c-
06ap
r.-07
aug.-
07
dec.-
07ap
r.-08
aug.-
08
dec.-
08ap
r.-09
aug.-
09
dec.-
09ap
r-10
aug.-
10
dec.-
10
apr.-1
1
aug.-
11
dec-1
1ap
r.-12
aug.-
12
dec-1
2ap
r-13
aug.-
13
dec-1
3ap
r.-14
aug.-
14
dec.-
14ap
r.-15
aug.-
15
ET Universe unweighted MSCI World index ET Universe market cap weighted
Performance of the Energy Transition Universe2005-2010
Source : Mirova.
Source : Mirova.
Source : Mirova.

76
////
////
Tak
e ac
tion
////
////
FIXED INCOME GREEN BONDS: FORGING A DIRECT LINK BETWEEN PROJECTS AND FINANCING
Hervé GuezHead of Responsible Investment ResearchMathilde DufourDeputy-head of Responsible Investment Research
Contributors : Marc Briand, Head of Fixed-Income Chris Wigley, Senior Portfolio Manager
76
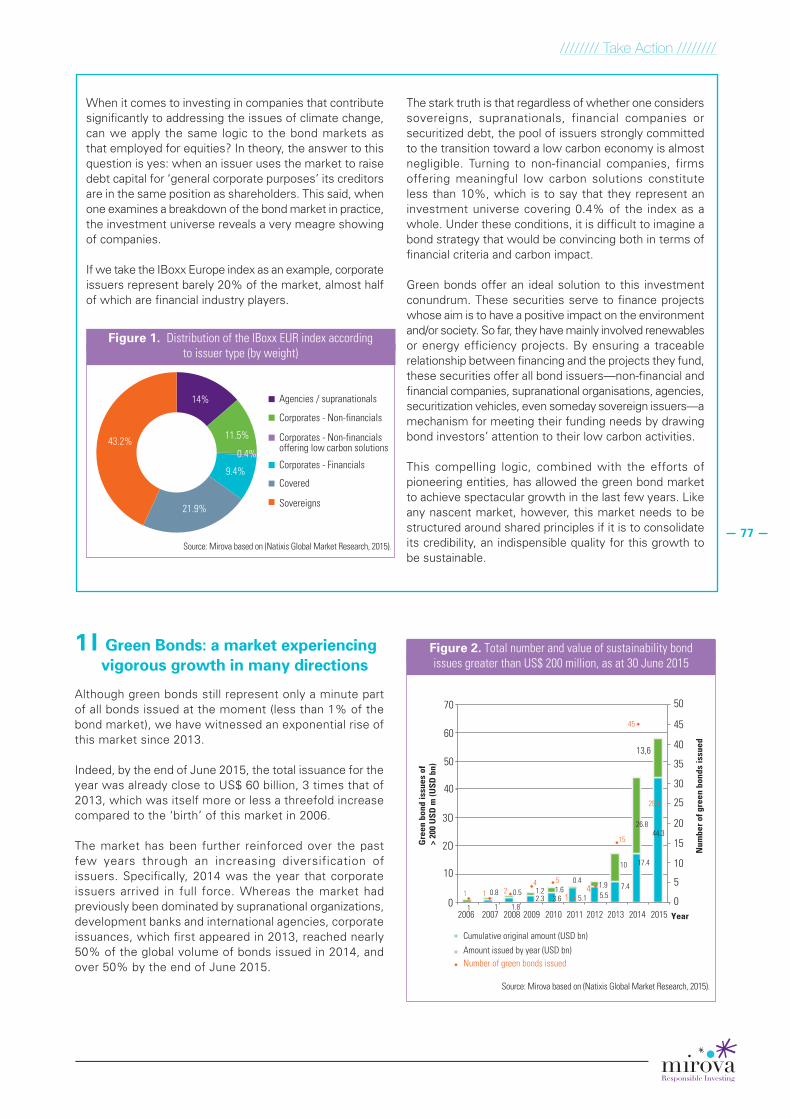
//////// Take Action ////////
77
1 I Green Bonds: a market experiencing vigorous growth in many directions
Although green bonds still represent only a minute part of all bonds issued at the moment (less than 1% of the bond market), we have witnessed an exponential rise of this market since 2013.
Indeed, by the end of June 2015, the total issuance for the year was already close to US$ 60 billion, 3 times that of 2013, which was itself more or less a threefold increase compared to the ‘birth’ of this market in 2006.
The market has been further reinforced over the past few years through an increasing diversification of issuers. Specifically, 2014 was the year that corporate issuers arrived in full force. Whereas the market had previously been dominated by supranational organizations, development banks and international agencies, corporate issuances, which first appeared in 2013, reached nearly 50% of the global volume of bonds issued in 2014, and over 50% by the end of June 2015.
45
50
45
40
35
30
25
20
15
10
5
002006
Cumulative original amount (USD bn)
Amount issued by year (USD bn)Number of green bonds issued
Num
ber o
f gre
en b
onds
issu
ed
Gre
en b
ond
issu
es o
f>
200
USD
m (U
SD b
n)
2007 2008 2009 2010 2011 2012 2013 2014 2015
10
1 1 24 5
14
15
25
1
0.8
1 1.8
0.5 1.22.3
1.63.6
0.4
5.1
1.95.5
10
7.4
17.4
44.326.8
13,6
2O
3O
40
50
60
70
Year
Figure 2. Total number and value of sustainability bond issues greater than US$ 200 million, as at 30 June 2015
Source: Mirova based on (Natixis Global Market Research, 2015).
When it comes to investing in companies that contribute significantly to addressing the issues of climate change, can we apply the same logic to the bond markets as that employed for equities? In theory, the answer to this question is yes: when an issuer uses the market to raise debt capital for ‘general corporate purposes’ its creditors are in the same position as shareholders. This said, when one examines a breakdown of the bond market in practice, the investment universe reveals a very meagre showing of companies.
If we take the IBoxx Europe index as an example, corporate issuers represent barely 20% of the market, almost half of which are financial industry players.
Agencies / supranationals14%
11.5%
Corporates - Non-financials
Corporates - Financials
Covered
Sovereigns
0.4%
9.4%
21.9%
43.2% Corporates - Non-financialsoffering low carbon solutions
Figure 1. Distribution of the IBoxx EUR index accordingto issuer type (by weight)
Source: Mirova based on (Natixis Global Market Research, 2015).
The stark truth is that regardless of whether one considers sovereigns, supranationals, financial companies or securitized debt, the pool of issuers strongly committed to the transition toward a low carbon economy is almost negligible. Turning to non-financial companies, firms offering meaningful low carbon solutions constitute less than 10%, which is to say that they represent an investment universe covering 0.4% of the index as a whole. Under these conditions, it is difficult to imagine a bond strategy that would be convincing both in terms of financial criteria and carbon impact.
Green bonds offer an ideal solution to this investment conundrum. These securities serve to finance projects whose aim is to have a positive impact on the environment and/or society. So far, they have mainly involved renewables or energy efficiency projects. By ensuring a traceable relationship between financing and the projects they fund, these securities offer all bond issuers—non-financial and financial companies, supranational organisations, agencies, securitization vehicles, even someday sovereign issuers—a mechanism for meeting their funding needs by drawing bond investors’ attention to their low carbon activities.
This compelling logic, combined with the efforts of pioneering entities, has allowed the green bond market to achieve spectacular growth in the last few years. Like any nascent market, however, this market needs to be structured around shared principles if it is to consolidate its credibility, an indispensible quality for this growth to be sustainable.

//////// Take Action ////////
78
0
5
10
15
20
25
30
2006 2007 2008 2009 2010 2011 2012 2013 2014 2015
1 0.8 0.5 1.2 1.4 0.4 0.60.5
0.5 1.8 1.2
6.9
1.3
4.2
9.7
1.5
1.9
7.6
13.8
0.7
Agencies / supranationalsCorporates Covered
Local Authorities
Valu
e of
issu
es >
200
m U
SD (i
n bn
USD)
Figure 3. Distribution of sustainability bonds greater thanUS$ 200 M by issuer type – as at 30 June 2015
Source: Mirova based on (Natixis Global Market Research, 2015).
Continued diversification can further strengthen the sustainability of the market by i) ensuring more corporate bonds with a broader variety of ratings (BBB and HY issuers); ii) attracting more North-American and Asian issuers; iii) fostering activity by sovereign issuers, and iv) growing the number of issues by current issuers in order to produce meaningful issuer yield curves.
In addition to increasing volume and diversity, the market is also gradually gaining in structure: creation of 100% green bond funds, as well as dedicated originators, indices, and external insurance products for projects etc.
Despite its size, which continues to be modest relative to the bond market as a whole, these developments confirm that green bonds are here to stay, creating a new sub class within fixed income.
2 I Issues of (self ?) regulation
Nonetheless, while green bonds do appear to offer an effective means of addressing climate concerns, a solid framework needs to be established to guarantee their credibility.
This structuring process was launched in 2014, with the announcement of the Green Bond Principles (GBP). A multi-stakeholder initiative, the GBP aim to provide guidelines for what constitute the elements required for a bond issuance to be considered Green, with the dual goal of helping issuers design their green bonds, and assisting investors in evaluating the environmental impact achieved by such bonds.
Rather than precisely defining the environmental impact sought, the GBP focus on the governance criteria a bond needs to use in order meet the definition of a green bond. As we see it, there are two critically important issues for ensuring the credibility of these instruments here: the qualitative and quantitative evaluation of projects’ environmental contributions, and the allocation of funds.
2 I1 Measuring impact
Analysing how well projects meet the goals of sustainable developmentTo ensure the ESG (environmental, social and governance) quality of green bonds, Mirova has developed a dedicated evaluation grid for this type of issue. One of its key aims is to determine whether a bond’s underlying projects meet the following criteria:
➜ Offers demonstrably improved practices that exceed business as usual, as well as a positive impact on an environmental concern, particularly climate issues;
➜ Does no exhibit negative exposure to any other sustainabi-lity issue (health, development, biodiversity, pollution, etc.).
We hope to enrich this basic framework for analysis as our knowledge and expertise of the standards and best practices prevailing in each sector progresses. A continuous learning and adjustment process is crucial if this new financial vehicle is to establish credibility as having genuine environmental and social value.
Measuring the amounts of CO2 avoidedQualitative analyses of the environmental and social benefits offered by the projects a green bond finances must be combined with quantitative assessment of their contributions to a low carbon economy. This must necessarily include a mesure of their carbon footprint, but also of any ‘carbon benefits’ they produce.
Given the importance and magnitude of the climate issue, it appears to us paramount that the methodology employed be widely shared, and entrusted to an external entity (certifying authority) whose job it is to ensure the carbon measurement of projects. A stringent and ambitious programme offering maximum disclosure provides a strong basis for credibility. Such a system would also make it easier for companies lacking the means to implement reliable methodologies internally to access the green bond market.
2 I2 The link between projects and their funding
Clarifying the ‘use of proceeds’ From investor’s point of view, the function of this market is to provide an opportunity to contribute to the ecological transition by providing the capital necessary to the development of low carbon business models. From this perspective, there is, beyond the ‘green’ quality of the underlying project, an additional question, which is the nature of the project.
The great strength of the green bond concept is to tie investment to specific underlying projects. Thus any company is entitled to participate on this market, as long as they have a viable project for transformation to offer. The counterpart to this inclusiveness is a need for stringent clarity standards as to the use of proceeds to finance investments that induce the promised transformation. And, as we know, capital markets are organized to ensure that debt instruments are as fungible as possible. Green and social bonds are at odds with this attitude, since their function is to bind together financing and investment. One might summarize the rationale of this market as follows: using green debt to finance green or social assets.

//////// Take Action ////////
79
The corollary of this principle is that there cannot be more green or social bonds than there are green or social assets on the issuer’s balance sheet, meaning that such bonds may not be used to cover operational losses, share buybacks, or to refinance existing debt, even if such losses, shares or debt were to belong to green or social companies.
Quality of dedicated reportingEven the greatest mastery of these elements, from the quality of environmental or social components, to the traceability of projects’ funding, is to no avail if lacking a high degree of transparency and gestures of commitment on the part of issuers on the following aspects: i) clear and verifiable criteria for determining projects’ eligibility to receive financing, ii) strong traceability as to use of proceeds, and iii) the existence of a reporting system for tracking the projects actually financed, and the impacts they achieve in practice.
3 I Shifting to low carbon bond portfolios
Green bonds are an eminently suitable approach for investors seeking to allocate their capital in ways that reflect climate issues. To illustrate this, we have attempted to quantify the capital requirements for green bonds across the overall IBoxx index.
For ‘non-financial corporate issuers’ exposed to an energy sustainable development theme, we analysed companies’ investments in energy and compared them with the projected investment needs for achieving climate change objectives. This exercise allowed us to get a general sense of how investments in this part of the index stack up against the funding needed to implement the energy transition for the +3.5°C and +2°C scenarios across several time horizons.
The IBoxx column provides an estimate of the distribution for energy investments within the index. The IEA NPS 2014-2020 and IEA NPS 2014-2035 columns illustrate
the investment distributions required to achieve the NPS (+3.5ºC) for the period under consideration. The IEA 450 2014-2035 column illustrates the investment distribution
necessary to achieve the ‘450 scenario (+2ºC) over the 2014-2035 period.
Coal (Upstream & Transport)
Iboxx0%
20%
40%
60%
80%
100%
Oil (Upstream & Transport)
IEA NPS(+3,5°C)
2014 - 2020
IEA NPS(+3,5°C)
2014 - 2035
IEA 450(+2°C)
2014 - 2035
Gas (Upstream & Transport)
Renewables (Elec)
Gas (Elec) Nuclear (Elec)
Energy efficiency T&D
Coal (Elec)
Figure 4. Energy segment of the IBoxx index comparedto scenarios published by the IEA
Source: Mirova based on (IEA, 2014).
The results of this exercise are in line with what has been announced by international organizations. Regardless of the scenario under consideration, it is now urgent that we shift a portion of investments into energy savings solutions and developing renewable energies. In an index such as the IBoxx—Non-Financials, energy represents slightly less than
34% of total investments by weight. Making this component of the index compatible with a 2°C scenario would entail allocating ~16% of capital to green bonds that finance investments dedicated to energy efficiency or renewables.
0%
20%
40%
60%
80%
100%
Iboxx - corporate non financial
Reduced investments in Iboxx
New investments in Energy efficiency /
Renewables
Coal (Upstream & Transport) Oil (Upstream & Transport)
Gas (Upstream & Transport)
Renewables (Elec)
Gas (Elec) Nucléaire (élec)
Energy efficiency T&D Ex-energy
Coal (Elec)
Figure 5. Redirecting investments (non-financial companies)
Source: Mirova based on (IEA, 2014).
As regards other types of issuers—sovereigns, agencies and supranationals, but also financials—it is not possible to devise such a clear test. It is hard enough to obtain information regarding the energy investments of corporations, and to date there are no indicators sufficiently reliable to provide guidance on financial issuers.For lack of such a tool, we have employed macroeconomic data to estimate the energy investments of these players. Using research from international agencies (IEA, 2014; UNCTAD, 2014), according our calculations, investments by the financial industry in energy, broadly speaking, represent approximately 10% of all investments GFCF (Gross Fixed Capital Formation).
Ex-energy
0%Iboxx Reduced
investment in Iboxx
New investments in Energy efficiency /
Renewables
20%
40%
60%
100%
80%
Conventional energy Green energy
Figure 6. Estimated redirection of investments (IBoxx overall)
Source: Mirova based on (IEA, 2014; UNCTAD, 2014).

//////// Take Action ////////
80
Leaving aside the possibility of an increased proportion of energy investments between now and 2035, compatibility with a 2°C scenario would entail reorienting ~5% of the entire index toward investments dedicated to energy efficiency or renewables via green bonds.
While the green bond market remains small for the moment, its exponential growth could allow an increasing number of investors to participate in the transition to low carbon. This established, the question for financial companies and regulators is: how to build a market infrastructure that favours the development of this new asset class? This is a high-stakes public issue that Mirova is deeply invested in and will continue to address.

8181
////
////
Tak
e ac
tion
////
////
INFRASTRUCTURERENEWABLE ENERGY FUNDS: A 100% LOW CARBON ALLOCATION
Céline LauverjatInvestment Director Renewable Energy Fund

//////// Take action ////////
82
1 I Renewables worldwide: 9.1% of electricity production
World supplemental electricity generating capacity from natural and renewable sources grew by 103 GW in 2014, a figure which represents half of all net supplemental power worldwide.In particular, 49 GW of wind-turbine capacity and 46 GW of solar photovoltaic capacity were added to the global energy matrix.This increase meant Renewables contributed 9.1% of worldwide electricity production in 2014, compared to 8.5% in 2013.
The economies of scale enabled by the rising tide of Renewables along with technological innovations have brought about a sharp decrease in renewable electricity production costs.1 ‘Network parity’ has thus been achieved with respect to ‘traditional’ energy sources, and there is now a gap of more than €10/MWh between the price of EPR nuclear and onshore wind power.2
Furthermore, the close linking of production and consumption allowed by this type of energy production reduces transportation infrastructure requirements while increasing overall energy efficiency in tandem with the development of smart grids.
Thus, on economic considerations alone, Renewables’ share of the global energy matrix should continue to grow.
1. For example, a decrease of more than 65% in construction costs for solar was observed for the period 2009-2012.2. The overall cost of electricity (Levelised Cost of Electricity, LCOE), which includes con-struction and operational costs throughout the equipment’s lifetime, is an indicator of this network parity.
0Q3 Q4
2009 2010 2011 2012 2013 2014 2015
Q1 Q2 Q3 Q4 Q1 Q2 Q3 Q4 Q1 Q2 Q3 Q4 H1 H2 H2 H3 H1
50
100
150
200
250
300
350
PV - thin film PV - c-Si PV - c-Si tracking Onshore wind Offshore wind
Evolution in cost price per mWh – photovoltaic (pv) and wind
Source: Mirova based on (IEA, 2014; UNCTAD, 2014).
2 I Sums invested in Renewables: $270bn in 2014; +$200bn over 10 years
Worldwide investment in renewable energy represented $270 billion in 2014, marking an increase of 17% despite the sharp downturn in crude oil prices. This growth is due in the greatest part to investments in solar energy ($149.6bn, +25%), while investment in wind power also rose by 11% ($99.5 bn).
In addition, economies of scale have succeeded over the past few years in bringing down the costs of renewable energy technologies (especially solar), which has made each new installation increasingly more powerful.The results posted in 2014 were thus characterised by the rapid expansion of renewable energy into new markets in
The infrastructure market can be divided into four major categories: transportation infrastructure, energy infrastructure, telecommunications infrastructure, and public services infrastructure.
In a context of low rates and stock market volatility, investors’ interest in infrastructure is increasing:1 around 2% of institutional investors are represented in this asset class, which is also particularly popular among insurers.The expected yields in infrastructure debt range between 3.5% and 6% net, varying according to the nature of the project and market conditions. In terms of equity, investing equity in a ‘brownfield’ transaction (i.e. the buying or refinancing of an existing piece of infrastructure) can yield around 5% to 10%, depending on the underlying risk and leverage effect. In a ‘greenfield’ transaction (i.e. construction financing), the expected yields are higher.
For this asset class, as for others, taking part in the energy transition means both (i) consuming less energy and (ii) better producing such energy.
1. As of the end of March 2014, European infrastructure funds held $87 billion under mana-gement.
A distinction may thus be made between, on the one hand, general infrastructure projects that benefit from ambitious energy performance contracts, and, on the other hand, natural and renewable energy undertakings that contribute directly to the objective of ‘decarbonising’ the world’s energy mix.
As concerns the first category, the market reality is that measures of energy performance are still too heterogeneous. While efforts are being made and various initiatives have been launched, these do not yet enable robust, comprehensive and widely comparable evaluations of their energy impact.
Thus, in the world of infrastructure, better energy production via renewable energy funds offers an adequate toolset for investors wishing to allocate their capital in projects that respond to the issues of the energy transition. While their carbon impact is undeniable, do such funds constitute an attractive alternative investment?

//////// Take action ////////
83
developing countries, where investment jumped by 36% up to $131.3bn,3 compared to $57.5bn in the EU-28.This expansion has continued in near linear fashion since 2004, and more than $2 trillion in all have been invested in the renewable energy sector in the last decade.
0
50
100
150
200
250
300
Total OECD Emerging
Other OCDE
Other renewables
PV
EU28
Investments in renewable energy - 2014 (in billions of $)
Source: Mirova based on (UNEP, March 2015).
3 I Project finance: the place of renewable energy funds
The financing of renewable energy projects has for 10 years represented the majority of funding in the renewable energy sector worldwide and has continued to reach as much as $244bn in 2014 (90% of funding in the sector; +10% in 2014).4
Projects of ‘commercial’ scale (>1 MW) have increased by 10% and now represent $170.7 billion. The growth in smaller-scale projects was even greater: +34%, reaching $73.5 billion. Indeed, large cost reductions have made rooftop solar a competitive option for businesses and households alike seeking to cover part of their energy needs with clean energies. The United States, Japan and China show the greatest increases in investment in smaller-scale projects.
20040
50
100
150
200
250
300
4573
112
154182 178
237
279256
232
270
Growth
62% 54% 37% 18% -2% 33% 18% -8% -10% 17%
2005 2006 2007 2008 2009 2010 2011 2012 2013 2014
Asset finance
VC/PE Government R&D Corporate R&D
Small distributed capacity Public Markets
Annual investments in renewable energy for the past 10 years by type of financing
Source: Mirova based on (UNEP, 2015).
3. China, with $83.3 billion invested, Brazil ($7.6 billion), India ($7.4 billion) and South Africa ($5.5 billion) were all among the 10 highest-investing countries, while more than $1 billion were invested in Indonesia, Chile, Mexico, Kenya and Turkey (Source: UNEP).4. Source: UNEP – March 2015.
Other investment categories in this sector include: renewable energy companies raising equity on the market ($15.1bn), risk-capital funds ($2.8bn) and R&D spending by businesses ($6.6bn) and by governments ($5.1bn).
It should be noted that the proportion of institutional investors has been growing regularly: they represent around 10% of the equity in project financing in Europe through the renewable energy funds in which they invest.
4 I Significant additional requirements: the trend continues
Meeting renewable energy objectives within the European energy mix will require an increase in installed capacity between now and 2020 of more than 100 GW (solar, onshore wind and biomass).
Onshore wind Solar PV Biomass
0
20
40
60
80
100
120
2014 2015 2016 2017 2018 2019 2020
Investments in renewable energy - 2014 (in billions of $)
Source: Mirova based on (Ernst and Young, 2014).
Reaching this goal, given current investment amounts in the sectors involved (which are unlikely to bear further strong reductions considering their maturity), will require a total additional investment of €236 billion, or an estimated equity requirement of €70bn.
As for the place of project financing in underlying investments in renewable energy, it can only be imagined that renewable energy funds will continue to grow based on a business model that is ever more secure (see below).
In like manner, renewable energy funds in so-called ‘emerging’ markets are sure to drive growth in this kind of financing.5
5 I The underlying business model of renewable energy funds
Funds dedicated to financing renewable energy production infrastructure (‘renewable energy funds’) are assets that are 100% orientated towards the energy transition and are particularly geared towards traditional institutional investors taking into account their risk, maturity and rate of return.
5. The risk premium is tied to the country and the way electricity prices are decided within the zone, but mostly to the technology involved.

//////// Take action ////////
84
The assets underlying these funds — such as windfarms, solar plants, hydroelectric plants and biomass conversion plants — rest on:
➜ Mature technologies;
➜ Straightforward business models now further upheld by the achievement of ‘network parity’;
➜ Proven project finance techniques.
The way renewable energy funds work, then, is by offering a project company (i.e. one dedicated to a specific kind of infrastructure) a relatively wide range of financing options (from subordinated debt to investment capital — or equity).
Investors’ net profitability varies in accordance with the type of financing and the specific risk of the project; in Europe this currently ranges between 6% and 10%.
Moreover, by distancing itself from the risk-capital model, a transparency approach lets an investor endorsed by the Solvency II Directive reduce his or her statutory capital requirement.6
The asset class made of renewable energy funds thus presents numerous advantages in terms of equity investment:
1. Renewable energy projects are tangible assets, tied to the real economy and responding directly to its needs.
6. According to the Standard formula, funds that finance renewable energy projects are classed in the ‘Other Equity’ category: the applied shock load is 49%. This should soon sink to 30% - 39%. A transparency approach, recommended by Solvency II, consisting in the separation of the compulsory portion from the asset portion for market risk, permits the refinement of capital requirements and benefiting from diversification, fitting well the project finance techniques that underlie renewable energy funds.
The yield on these investments is generated mainly by the projects’ returns throughout ownership (stable and recurrent cashflows), and to a lesser extent by the resale share price (on the secondary asset market).
2. A weak risk profile:
➜ Historical data and statistics on Renewables;
➜ Proven technologies and a long track record of projects;
➜ Reliable compensation (through outfitters and energy off-takers);
➜ A stable long-term contractual framework (buy-side operating contracts and sell-side power purchase agree-ments or feed-in tariffs).
3. Attractive yields and the prospect of value creation in association with an economic turnaround, a rise in the price of electricity and a strong demand for ‘brownfield’ infrastructure on the secondary market.
In proposing a market risk/yield ratio, infrastructure funds dedicated to renewable energy have increasingly appeared as a natural asset-allocation strategy in the move towards a low carbon economy. Additionally, the funds’ diversity in terms of maturity, nature of underlying assets (whether on the primary or secondary market) and degree of risk (geographical area, technology) presents a broad range of investment possibilities.

8585858585
IMPROVE ACCOUNTABILITYHow can we increase the financial sector’s engagement?
////
////
Impr
ove
Acco
unta
bility
///
////
/
ENGAGE: The financial sector’s levers for promoting a low carbon economy ............................................................................................. 86MEASURE: A Carbon impact methodology in linewith a 2 degree scenario ......................................................................................... 95
An economic agent committed to financing a low carbon economy should be accountable for how well it meets its res-ponsibilities. This last chapter presents the principles that guide Mirova, the subsidiary of Natixis Asset Management dedicated to Responsible Investment, both in measuring the impact of its investments and encouraging greater contributions from all players with a role in building a low carbon economy.

8686
////
////
Im
prov
e Ac
coun
tabi
lity /
////
///
ENGAGE THE FINANCIAL SECTOR’S LEVERS FOR PROMOTING A LOW CARBON ECONOMY
Zineb BennaniHead of Governance Research and Engagement
TABLE OF CONTENTS
1 I Transitioning to a low carbon economy: an issue of moment for long term investors 871 I1 Primary levers for promoting better integration of climate issues in long term investment strategies 87 1 I 1 I 1 Climate change: loaded with risks for investors,
but also a source of opportunities 87 1 I 1 I 2 Public opinion: a reputational risk factor
for investors 88 1 I 1 I 3 Beyond a rising awareness: anticipated
regulatory risks 891 I2 What levers for action are available to long-term investors ? 901 I 2 I 1 Financial innovation in the service of
a low carbon economy 901 I 2 I 2 Strategies for integrating climate risks
in investment decisions 90
2 I How can engagement contribute to a long-term investment strategy that supports a low carbon economy? 912 I1 Financing the transition to a low carbon economy: the priority engagement issue for long-term investors 91 2 I 1 I 1 Levers for action to promote the transition
to a low carbon economy 91 2 I 1 I 2 Role of finance in financing the transition
to a low carbon economy 922 I2 Integrating climate risks in financial products and services 922 I3 Reallocating capital toward the low carbon economy 93 2 I 3 I 1 Levers for financing the low carbon economy
by type of activity 932 I 3 I 2 Srategy for engagement with the financial sector
by type of activity 933 I Conclusion 94

//////// Improve Accountability ////////
87
1 I Transitioning to a low carbon economy: an issue of moment for long term investors
1 I1 Primary levers for promoting better integration of climate issues in long term investment strategies
1 I 1 I 1 Climate change: loaded with risks for investors, but also a source of opportunities
Climate change is at the origin of substantial envi-ronmental, social and economic risks that could have irreversible consequences for all our value chains and pro-
foundly affect the sustainable development of economies worldwide. The IPCC (Intergovernmental Panel on Climate Change) considers that a 2.5°C global temperature increase could, speaking conservatively, have an impact of between 2 and 20 basis points on world GDP, and that any increase above this cut-off could have much more serious outcomes that are impossible to calculate at any level, economic, social or environmental.
Climate disruption could, thus, to varying degrees, have an impact on all sectors, subjecting the economy, and society as a whole to a burdensome systemic risk. Seen this way, the extent to which companies integrate these risks in their models for growth is part of their sustainability, just as adapting investment strategies to deal with the risks
1. The Global landscape of climate finance, Climate policy initiative 2013
Situated at the nexus of environmental, social and eco-nomic issues, climate change constitutes a systemic risk that weighs on every one of the world’s econo-mies. To ignore this factor in funding and investment decisions is to invite the long-term erosion of value.
The year 2015, a sort of eleventh hour before the 21st United Nations Conference on Climate Change (COP21), has mobilised efforts to support the struggle against cli-mate change to an unprecedented degree. Both public authorities and private entities, even those recalcitrant players long hostile to any type of action, have multiplied their commitments to limiting the global temperature rise to 2°C between now and 2050. This vast mobilisation bears witness to the magnitude of the challenge we will confront in the coming decades, and to a newfound awareness of the need to accelerate the shift to a low carbon economy.
On the one hand, the path ahead seems to be clearer at the political level, on the other, the issue of how to finance mitigation and adaptation solutions to climate risks remains a major challenge. The IEA (International Energy Agency) estimates that, in order to meet 2°C objectives, the annual investment needed is in the vicinity of US$500 billion for the 2010-2020 period, and US$700-900 billion for 2020-2050.1 These estimates, however, do not take into account the additional costs associated with adaptation, which are impossible to estimate at this time. Current commitments don’t come close to being sufficient. Furthermore, con-tinuing to finance a carbon-intensive economy can only exacerbate future costs, which will carry economic and social costs it is practically impossible to evaluate, insofar as precise definitions of the full range of impacts escape us, and possible chain reactions remain unknown.
As a result, financing is a critical issue, central to making the transition toward a low-carbon economy. While we certainly need to mobilise additional financial resources, it is just as important that we redirect existing investments toward new technologies that offer solutions to climate
threats, both in order to reach climate goals and to ensure the future returns of investments.
Given this situation, public and private institutions both have a central role to play.
Public authorities must shoulder the responsibility of en-suring conditions favourable to channelling capital into a low carbon economy. This includes supporting R&D to accelerate the transition to green energy. It also involves removing the obstacles that drag on financing climate strategies. Several regulatory and fiscal mechanisms are available that could be employed to this effect: redirecting subventions to green technologies, taxing carbon, sup-porting a label for green investment funds, providing tax incentives for green investment funds, etc.
Financial actors play a crucial role in the strategies brought to bear on financing and have several levers through which they can contribute to making the economy low-carbon. These run the gamut from banking or financial innovation and reallocation of capital toward companies that offer solutions for adaptation or mitigation, to financing clean technologies and green infrastructure. Only when both public and private actors prove capable of considering the long term and anticipating the changes that will shape our world tomorrow will it become possible to develop innovative solutions for addressing climate change effec-tively and contribute to the sustainable development of our economies.
In the face of this challenge, what role might institu-tional investors play? What levers are at their disposal to help make the transition to a low carbon economy a reality? The present study examines this question within the context of a new collaborative engagement under-taken by Mirova, as part of its commitment to fully play its role as a responsible investor and act to promote the development of a new, low-carbon economy.

//////// Improve Accountability ////////
88 associated with carbon is part of ensuring the long-term financial health of a portfolio’s liabilities. Restricting the global temperature rise to 2°C entails a substantial downshift in our need for fossil fuels, in order to limit the emission of greenhouse gasses relative to a Business as Usual scenario. This adjustment is expected to provoke a significant drop in the stock prices of oil, gas, and mining companies.
This theory, despite the denials of certain players in the en-ergy sector, is far from being unreasonable, and is supported by the latest report by Standard & Poor’s, published in August 2015. The credit rating agency warns of a decline in the market for coal, which, according to them, has already lost 20% of its value in the last year, and 75% over a 5-year period. Probable causes for this trend include regu-latory developments, lower demand from China, and the rise of renewable energy sources, factors that structurally affect the market in long-term ways, with serious implications for corresponding investments.
Thus, even if uncertainty about the actual risks of future climate scenarios and the current low price of carbon make the immediate financial impact of climate change relatively small, continued investment in carbon-intensive sectors will eventually have a direct impact on these assets, whose value will depreciate as the market progres-sively integrates future risks in company valuations.
Conversely, investing in companies that are already aware and attuned to climate risk and incorporate it in their development strategy—whether via adoption
of carbon pricing, anticipation of regulations to come and adaptive production models, or by themselves offering new energy efficiency solutions or developing low carbon tech-nologies—can present opportunities for investors with a long-term investment horizon. See part 1 - Understand: What technologies can build a low carbon economy? p. 7
1 I 1 I 2 Public opinion: a reputational risk factor for investors
Beyond the governmental agreements likely to be conclud-ed, the COP 21 will inevitably prompt economic and financial actors to take unprecedented steps to combat global warming. This is clearly illustrated in the prolifera-tion of voluntary initiatives2 on the part of businesses and investors taking place alongside the official solutions being negotiated by States.
At the business end of things, the various announcements are part of a general trend that began several years ago to address the progressive tightening of regulations and seize opportunities created by the new markets ensuing from environmental concerns. It is worth noting, however, the abrupt change in tone from the petroleum industry, which as begun to collectively call for a carbon price signal to improve the competitiveness of gas relative to coal.
The area of finance, for its part, has seen an increase in efforts over the last year due to pressure from civil society.
0 ! ! 1 ! ! ! ! ! ! ! 5°C ! !
Water! !
Ecosystems ! !
Food ! !
production!
& Oceans !
! !
!
Hundreds of millions of people exposed to increased water stress ! !
! ! !
! !
! !! !
! !
! ! !
!
!
! !
! !
! !
!
! !
! !
Lower precipitation rate. Accelerated melting of the snowpack in spring causing increased riskrisk of flooding and water stress during summer months (Northern Hemisphere)
Complex negative impacts at the local level on small farmers and fishing communities
Increased damage due to flooding and storms
Exacerbation of effects due to malnutrition, diarrhoea, acute respiratoryand infectious diseases
Increased morbidity and mortality (due to heat, drought , flooding etc.)
Millions of people at greater risk of surge flooding in coastal areas
Coastlines
Health
2 3 4
Increased risk of extinctionfor 30% of species
Negative yield trends for cerealcrops at lower latitudes. Decreased precipitation
Lower yields for all crops atlower lattitudes.Exarcebated impactof agricultural parasites
Mass extinctionsthroughout theworld
Oceans warming, changes to ocean currents leading toecosystem disruption and violent losses of biodiversity
Figure 1. The principal consequences associated with climate change
Source : Mirova based on (IPCC, 2007; IPCC, 2014).
2. NACZA, is a platform launched for the COP 20 in Lima as a means of surveying the public and private initiatves undertaken to support the struggle against climate change in the lead-up to the signing of international agreements at COP 21.

//////// Improve Accountability ////////
89
Since 2012, investors have come under increasing pressure from movements such as ‘GoFossilFree’ which is sponsored by 305.org, a US-based non-profit, Divest/Invest, backed by philanthropic organisations, or ‘Keep it in the ground’, supported by British news The Guardian. The aim of these various groups is to secure divestment from companies emitting the highest levels of GHG.
Thanks to strong backing not only from universities in the US and Europe, religious organisations and non-profit foun-dations, but from public opinion, these movements have succeeded in influencing the investment strategies of several universities, pension funds, and private investors, which have publicly announced their intent to divest of coal and/or fossil fuels more generally. Thus far, more than 18 universities, holding a combined €e19 billion of assets have made such commitments, joining the assets of the Church of England (e12.4 billion in assets under management) and those of several large US cities (e18.4 billion in combined assets). These movements have become so influential that they exert considerable pull on actors in the financial industry, whose recent commitments bear witness to the magnitude of the double carbon/reputational risk they are exposed to.
The platform promoting investor initiatives for action on cli-mate change3 launched in May 2015 during ‘Climate Week’ by seven of finance’s major supranational organisations (PRI4, IIGCC5, CDP6, INCR7, IGCC8, UNEP FI9, AIGOCC10 ) now boasts 17 distinct initiatives bringing together a total of 400 investors that collectively represent US$ 25 trillion in assets. These efforts are classified as falling into four categories: measure, engage, reallocate and promote.
Figure 2. Investor initiatives to combat climate change
Source: Mirova based on Investor Platform For Climate Actions (2015).
Two of these 17 initiatives are considered particularly stra-tegic issues for the financial sector and, more specifically, the asset management industry. The first of these is the Montreal Carbon Pledge, under the aegis of the PRI, and the Portfolio Decarbonisation Coalition, supported by the
UNEP-FI. Launched in September 2014 during the Unit-ed Nations Climate Summit, these efforts are aimed at encouraging investors to measure the carbon footprint of their portfolios, and to decarbonise their investments. This represents an innovation for the asset management industry and articulates a distinct turning point in the investment strategies of financial players toward fa-vouring a low carbon economy.
Alongside these initiatives, banks, insurers and major pen-sion funds in Europe and the US have announced a flurry of intentions to divest from coal (Axa, Crédit Agricole, Bank of America, the Government Pension Fund of Norway, etc.) and increase investments in low carbon assets (Axa, APG, PensionDanemark, Calsters for a total amounting to US$ 34 billion). Novethic has also identified over 774 investors, representing e28 trillion in assets under management, that have committed to addressing climate change following 4 broad strategies: shareholder engagement, decarbonising portfolios, divestment and green investment.
Figure 3. Investor action to address climate change by strategy
Source: Mirova based on the Centre de Recherche Novethic (2015).
This increasing mobilisation of effort reflects a greater awareness of climate risks on the part of the financial community, and signals the beginning of a veritable energy revolution in favour of growth that is more resilient to climate change, a shift in which civil society has undoubtedly played an essential role at both the institutional and political levels.
1 I 1 I 3 Beyond a rising awareness: anticipated regulatory risks
Pressures from civil society and rising awareness of cli-mate issues as a systemic risk factor are likely to provoke a tightening of regulations. France, for instance, has taken a step along this path with its adoption of a law on the energy transition and green growth, which has already imposed new obligations on issuers and investors. As a provision of Article 173 of the loi sur la transition énergétique et écologique (law on the energy and ecological transition), issuers must henceforth ‘make clear the financial risks associated with the effects of climate change, and the measures undertaken
3. http://investorsonclimatechange.org/. 4. PRI: Principles for Responsible Investment. 5. IIGCC: Institutional Investors Group on Climate Change. 6. CDP: Carbon Disclosure Project. 7. INCR: Investor Network on Climate Risk. 8. IGCC: Investor Group on Climate Change. 9. UNEP FI: United Nations Environment Program Finance Initiative. 10. AIGOCC: Asia Investor Group On Climate Change.
$
MEASURE
Evaluating the exposure of protfolios to the risksassociated with climate change
69 48 trillion
trillion
trillion
> Carbon Montréal Pledge
> Portfolio Decarbonization Coalition> Low Carbon Registry
ENGAGE
$22300
REALLOCATE PROMOTE
1 7II
Reallocation of capital from CO2 intensive activitiesto low emissions activities
I $63 2 77
Any initiative that seeks to address the risks and opportunities arising from climate change, i.e. public policies, investment practices etc.
> Carbon Asset Risk Initiative> Investor expectations on Corporate Climate Risk à Management> Aiming A initiative> CDP Carbon Action> Ceres Shareholder Initiative on Climate & Sustainability> PRI Investor working group on Climate Corporate Lobbying> Regnan Climate Change Resilience Engagement
> Global Investor Statement on Climate Change> Climate Disclosure Standards Board> Statement of Investor Expectations for the Green Bond Market> EU and G20 Governments to enable more investment in enegry efficiency> Investor Expectations for Oil & Gas Companies> Climate Bonds Initiative
Dialogue between investors and companies to improve management and disclosure of risks and opportunities associated with climate change
I $Number of investors Number of initiatives AuM involved
336
326
288$
investors
99Shareholderengagement
Portfoliodecarbonisation
Divestment
Greeninvestments
774
€28 trillion

//////// Improve Accountability ////////
90
to reduce these by implementing a low-carbon strategy at every stage of their activities.’ Investors must, for their part, calculate and disclose the carbon footprint of their portfolios.
The French government is also separately working to devel-op a label to support the energy and ecological transition in order to increase the visibility to consumers of funds whose investments are directed toward companies that contribute positively. In the UK, the Bank of England has been assigned the task of studying the role of insurers in preventing climate risk. The European Commission is working on the question of investors’ fiduciary responsibility in the face of climate issues. This project is part of a broader review of how to generate economic growth in Europe, and indicates just how important climate change is for the sustainable development of Europe’s economies. At the international level, the G20 recently asked the FSB (Financial Stability Board, an inter-national economic group created in the wake of the Great Financial Crisis) to identify possible mechanisms by which the financial sector can take into account the issues associated with climate disruption.
Domestic policies in favour of climate measures also seem be be taking a new turn, more committed and stronger. The policy shift in countries historically reluctant to recognise the issue, such as the United States or China is evidence of this.
Given all this, it would be absurd to ignore the risk of tightening regulations that would affect all economic actors to varying degrees. A multi-lateral international agreement on a carbon signal price remains a possibility, despite the obstacles that face implementation of such a mechanism on an international scale. Beyond this carbon risk, domestic climate policies in various countries to favour the development of clean energy would not be without impact on current economic equations.
Carbon risks, reputational risks, and regulatory risks: all factors that justify ensuring that investment strategies take climate issues into account. Certain players have already launched strategies to this intent, demonstrat-ing the financial industry’s capacity for innovation and adaptation in the face of climate challenges.
1 I2 What levers for action are available to long-term investors ?
1 I 2 I 1 Financial innovation in the service of a low carbon economy
Beyond the recognition that climate change does indeed constitute a risk factor for investors, taking climate risk into account in investment strategies confronts a number of obstacles:
1. A disjunction between the temporality of physi-cal and economic impacts due to climate change, which are relatively long-term, and the investment horizon of financial markets, which focus on the short-term.
2. The prevalence of passive or index-hugging strat-egies, which, if a genuine and significant decarbon-isation of portfolios were to take place, would lead to an overly large deviance from current reference indices (tracking error).
3. Companies’ lack of transparency as to their own exposure to carbon risks, or, their strategy for developing green products.
4. Methodological limitations hampering the cal-culation of investments’ carbon impact, often limited to scope 1 and scope 2 emissions.
5. The lack of adequate methodologies for meas-uring the impact of climate on the risks and per-formance of portfolios.
These obstacles, despite their magnitude, are being over-come as awareness of the financial impact of carbon risks increases along with financial innovation and regulatory changes.
Three areas of progress in particular are worth noting:
➜ The development of low carbon investments, whether through ambitious equities strategies, the development of green bonds, renewable energy infrastructure invest-ment or low carbon—even carbon-positive—real estate.
➜ The emergence of more robust methodologies for cal-culating carbon impact that take into account both the emissions induced and those avoided over the entire life-cycle of products. This first step should encourage incorporation of carbon risk in investment strategies and a transition toward low carbon investments.
➜ The introduction of measures requiring issuers to dis-close the carbon impact of products and services of-fered. In France, this is exemplified by Article 173 of the loi sur la transition énergétique (energy transition law). Implementing such measures will provide investors with greater visibility to make investment choices that can contribute to sustainable growth.
1 I 2 I 2 Strategies for integrating climate risks in investment decisions
These advances pave the way for a better integration of climate risks within investment strategies. Five distinct levers can be used separately or in combination:
➜ Channelling investments into assets that contribute to the transition toward a low carbon economy
This can involve financing green infrastructure, clean tech-nologies or projects that seek to reduce carbon emissions. These can be designed around investment vehicles dedicated to infrastructure, or green bonds dedicated to projects with measurably positive environmental impacts.

//////// Improve Accountability ////////
91
➜ Changing portfolio construction models to conform to a 2°C scenario
This can be achieved using two complementary levers:
1. Sectoral reallocation: by adjusting the composition of portfolios, according heavier weighting to sectors that contribute to transitioning toward a low carbon economy (macro sector of renewables and energy transition) at the expense of positions in carbon intensive (oil, coal, gas, etc.), so as to achieve an energy mix within the portfolio that complies with a 2°C scenario.
2. Selection of securities: by favouring players that offer technological solutions, products, or services that address sustainable development issues.
➜ Divestment from fossil fuels
This entails systematic exclusion of sectors that emit the most GHG gasses and might jeopardise any attempt to limit the global temperature rise to 2°C, such as coal or oil.
➜ Carbon accounting
Measuring the carbon footprint of investments is a first step toward a transition to lower-carbon strategies. Awareness of the emissions associated with financing, both those induced and those avoided, makes it possible to gradually integrate risks in investment decisions and to progressively define targets for limiting the carbon footprint of portfolios.
➜ Engagement
Investing in green bonds, reallocating portfolios in favour of clean technologies, divesting from carbon-intensive sectors, creating low-carbon index funds etc. All these mechanisms constitute levers to be deployed according to a portfolio’s strategy, investment horizon and degree of aversion to climate risks. The array of solutions is broad, and makes it possible to meet the constraints of different categories of investors. Alongside measures that directly affect financing strategies, and thus, the allocation of cap-ital to a low carbon economy, shareholder engagement actions can serve as an appropriate collective mechanism for encouraging companies to take climate risks into ac-count in their own investment decisions.
2 I How can engagement contribute to a long-term investment strategy that supports a low carbon economy?
2 I1 Financing the transition to a low carbon economy: the priority engagement issue for long-term investors
2 I 1 I 1 Levers for action to promote the transition to a low carbon economy
Transitioning to a low carbon economy requires that we strengthen climate policies to reduce GHG emissions on the
one hand, while, on the other hand, adapting economic models for growth to the realities of climate change. Achieving these ambitions requires focused and coordinated action in three areas: regulations, solutions and financing.
➜ Regulations: actions concern adopting specific energy/climate goals, supporting new energy efficiency technolo-gies, and establishing incentives to channel capital toward a low carbon economy.
➜ Solution: this involves accelerating development of the green energies and new technologies that we will rely on tomorrow, as well as innovations to reduce dependence on fossil fuels to limit GHG emissions.
➜ Financing: this primarily involves redirecting flows of capital and money creation toward low carbon solutions and providing support for the development of clean energy.
Political support, commitment from industrial actors and contributions from financial players all facilitate the emer-gence of a new, low carbon, economic model. In terms of regulations, the upcoming 21st Climate Conference has driven unprecedented political activity that indicates a growing awareness as to the magnitude of this issue. Agreements have been drafted and legislation, such as France’s law on the energy and ecological transition, are beginning to emerge, clearing a path toward low carbon economies.
Private actors in the realm of industry have also seised on these subjects, and the technological revolution is moving forward. Renewable energy industry, electric vehicles, smart grids, energy efficiency solutions for buildings etc., are all solutions illustrating industry’s capacity for innovation and adaptation to climate issues.
But, however encouraging, these moves are no more than the first step toward a low carbon economy. The challenges and the stakes are both extreme, and mobilisation needs to step up the pace and strengthen its efforts if we are to achieve the objectives set by the established baseline scenarios.
This leaves the question of financing, ever a sticking point of climate policy. The financial industry’s efforts remain inadequate, while its contributions are essential to address-ing the issues raised by climate change for a number of reasons, including its enormous weight in the economy, and its ability to redirect capital flows toward solutions for mitigating and adapting to climate change.
According to the IEA (International Energy Agency) only 250 billion of the 1.6 trillion dollars invested in energy were allocated to renewable energy, despite that financing needs in the sector are somewhere in the vicinity of US$ 690 billion, based on a 2°C scenario.
Meanwhile, the bulk of investments in energy, 1.1 trillion dollars in fact, involve fossil fuels (extraction and transport, refining as well as construction of carbon-intensive power plants). If we extend these numbers to 2035, supplying

//////// Improve Accountability ////////
92
our societies with energy would represent 40 trillion dollars annuals, of which half would be dedicated to identifying new hydrocarbon deposits or building (obsolete) power plants.Considering investments in fossil fuels and carbon-intensive facilities, the current allocation of capital appears inefficient and requires reorientation toward low carbon assets in order to address climate issues. Money creation also re-mains neutral, in the absence of an adequate carbon signal price, despite it being imperative that authorities implement appropriate policies.
The financial sector is in the eye of the storm when it comes to climate issues, because of its vulnerability to carbon risks, and its role in financing. Furthermore, the weight of this sector in indices worldwide (20% of the MSCI World and 47% of the iBoxx bond index) exposes investors to a significant financial risk that makes it important to engage with the sector to ensure the long-term value of investments.
2 I 1 I 2 Role of finance in financing the transition to a low carbon economy
As discussed earlier, players in the financial sector are progres-sively incorporating the risks of climate change. Commitments to divest from the companies emitting the most carbon, to calculate the carbon footprint of portfolios, interest in green bonds and increased investments in clean energy are concrete manifestations of this shift.
The measures adopted so far, however, are far from being sufficient, as pointed out by the UNEP-FI in a working paper entitled ‘Climate risk to global economy’. According to the UN, few financial institutions have taken the full measure of climate issues, and most do little to integrate these concerns in their decision-making process.
This sector needs to focus its priorities on defining an inte-grated climate strategy, meaning one that takes into account not only the investment risks, but also the opportunities as-sociated with climate change. Doing so requires that areas of risk be identified for each business area, and integrated into
operational processes. It also demands that ambitious targets for financing the low carbon economy be established and met.
2 I2 Integrating climate risks in financial products and services
Within the financial industry, climate risks will have different effects on specific activities. In the short term, we see two main sources of risk:
➜ Regulatory risks: the commitments that States are currently making to limit GHG emissions will most likely translate to new constraints imposed on economic actors in order to ensure that that the goals being set are met. The financial sector may find itself directly affected via carbon risks, or indirectly, via its financing and investment activities in various sectors of the economy.
➜ Reputational risks: the increasing mobilisation of civil society in support of the struggle against climate change brings commensurate risks to bear on the financial sector, which is in the line of fire, for instance, from campaigns for fossil fuel divestment. These campaigns may also grow considerably as the effects of climate change ma-terialise.
Looking ahead to the longer term, financial actors are also exposed to risks related to climate change itself, the impact of which it is difficult to define. This notwithstanding, inte-grating these risks in investment and financing strategies is crucial, given the risks described earlier, and the imperative of attenuating climate risks to achieve sustainable growth in our economies.
Thus, the materialisation of carbon and climate risks will result in considerable financial losses that are expected to vary according to the activities, meaning lower yields for financing activities, loss of asset value for asset management and insurance, and counterparty defaults for lending activities (see Figure 4, Primary carbon and climate risks in the financial sector, by business activity).
Figure 4. Primary carbon and climate risks in the financial sector, by business activity
Main activities exposed to carbon/climate risks Type of risk
Financing and investment activities Comprises investments and financing of projects and companies
- Financing installations related to high-carbon assets that may prove unburnable (stranded assets).
- Financing sectors with high exposure to regulatory risks associated with restricting GHG gases, such as coal.
- Investments in companies exposed to climate risks
- Risk of lower yields on investment- Risk of defaults- Reputational risks
Savings Covers all types of investment activities across the various asset classes (equities, bonds etc…)
- Exposure of investments to high-carbon assets that may prove unburnable (stranded assets).
- Investments in the equity or debt of players with high exposure to regulatory risks associated with restricting GHG gases
- Risk of asset depreciation- Risk of legal action regarding the fiduciary
responsibility to investors - Reputational risks
InsuranceCovers term and whole life insurance and non-life products as well as asset management
- Exposure to carbon risks- Risk of asset depreciation- Reputational risks
Source : Mirova.

//////// Improve Accountability ////////
93
To attenuate the underlying impacts these risks refer to, a number of measures could be adopted:
➜ Creating a topography of risks by type of activity and sector;
➜ Pinpointing carbon impacts associated with clients or products;
➜ Establishing stringent policies for each sector;
➜ Integrating climate risks in the decision processes govern-ing investment and financing decisions;
➜ Measuring and tracking carbon impact;
➜ Collaborating with businesses to encourage them to make climate risks a component in their development strategies.
In addition to taking risks into account, it is essential that finance contribute to developing a low carbon economy in order to mitigate climate risks.
2 I3 Reallocating capital toward the low carbon economy
2 I 3 I 1 Levers for financing the low carbon economy by type of activity
Financing the transition to a low carbon economy presup-poses two strategies:
➜ Partial or total divestment from economic actors with high GHG emissions, and
➜ Massive investment in solutions aimed at mitigation or adaptation to climate change, such as clean energy and technology or financing green infrastructure projects, energy efficiency solutions etc.
Thus the issue is largely one of reallocating capital from car-bon intensive sectors toward cleaner sectors. The financing mechanisms and vehicles can, in fact, be remarkably diverse, from investing in the stock of sustainable companies and green bonds, to infrastructure project financing, climate change derivatives etc. To be more specific, the contributions of various banking activities to the energy transition can be achieved in the following ways:
➜ Retail banking: Given their business of taking deposits, making and managing loans, and advising individuals, households or small businesses regarding savings ve-hicles, banks are in a position to offer eco-loans to individuals for buying real estate that respects high environmental standards, conducting renovations aimed at energy efficiency, or purchasing an electric vehicle. Retail banks can also offer savings vehicles directed toward financing the low carbon economy.
➜ Corporate and investment banking: Corporate and investment banks play a key role in financing the energy transition. Due to their broad range of activities, players
in this industry possess significant levers for reallocat-ing capital into low carbon companies and/or sectors. Action can take the form of investments in the equity or debt of clean technologies, serve as originators for green bonds, or sponsor low carbon indices.
➜ Asset management companies: Like the previous category, these players possess considerable financing power and significant levers that can be put into effect by: developing savings vehicles with measurable en-vironmental impact, such as targeted thematic funds, green bond funds, green infrastructure funds, renewable energy project funds etc.
➜ Insurers: Insurance activities are largely concerned with identifying and managing risk. For insurers, creating products that offer advantageous premiums correlated to climate benefits can contribute to climate change objectives. With regard to insurers’ investment activi-ties, levers will be identical to those of asset managers.
2 I 3 I 2 Srategy for engagement with the financial sector by type of activity
As discussed above, the financial sector has two mechanisms available for integrating climate change issues:
➜ Taking into account the risks associated with climate change in the products and services offered by its various business activities;
➜ Reallocating financing toward solutions that sup-port mitigation and adaptation solutions.
Based on this observation, engagement with the financial sector can follow one of 3 avenues:
Avenue 1: Disclosing banks’ exposure to carbon and climate risks for all its activities.This entails that financial players measure the carbon im-pact associated with their investment and/or loan products and services on the one hand, and on the other that they evaluate their exposure to climate risks in terms of sectoral diversification.
Avenue 2: Designing a climate strategy for each type of activity and communicating its objectives clearly.This involves encouraging financial players to establish a climate strategy that can serve as a roadmap for integrating climate change issues into their banking activities.
Avenue 3: Establishing and publishing targets for con-tributions to financing the low carbon economy. This path focuses on encouraging financial players to under-take and make public commitments in the area of financing the low carbon economy.
The table presented here provides an overview of these pillars and their significance for the main business activities within banking.

//////// Improve Accountability ////////
94
3 I Conclusion
Climate change is a source of significant risks, but also opportunities for those actors with the foresight to antici-pate changes to come at both the economic and societal levels. Furthermore, the transition to a low carbon economy cannot take place in the absence of strong political support, transformative technological innovations, and an ambitious financing strategy. Public authorities, private actors and financiers all have crucial roles to play in this revolution.
Because of its position at the heart of financing the economy, the financial sector is a true keystone of this edifice, whose participation in the struggle against climate change will have a determining impact on shaping the future economic growth and development that our future societies will live with. The challenges are of a magnitude with the stakes themselves, and effectively mobilising financial players will be key to success.As a responsible investor, Mirova intends to fully shoulder its role in the transition to a low carbon economy. Beyond its choices of investment, which prioritise products and services that address sustainable development issues, and
tackling the difficulties of establishing a robust methodol-ogy for measuring the carbon footprint of its investments, while engaging alongside regulators to develop mechanisms with the power to move the transition toward a low carbon economy forward, Mirova now seeks to galvanise the financial sector to action on the issue of building a low carbon economy.
The engagement strategy will be implemented with support from the members of Mirova’s engagement platform, and will revolve around two primary objectives:
➜ Inciting players to integrate climate and carbon risks within their financing and investment activities, and
➜ Redirecting capital toward a low carbon economy.
Avenue 1 Disclosing exposure to
carbon and climate risks
Avenue 2 Designing a climate strategy for each type
of activity and publishing its objectives
Avenue 3 Publishing targets for
contributions to financing the low carbon economy
Corporate and Investment Banking
- Financing companies - Financing projects- Providing financial
solutions for companies
Identifying environmental and social issues by sector/project type/geographical region,Evaluating exposure of financ-ing/investments to climate and carbon risks,Evaluating the carbon footprint of financing/investments.
Design of a climate change strategy for financing and investment activities that integrates:
- Sector-specific policies for risk mitigation and adapta-tion to climate change,
- Targets that focus on reducing the carbon footprint of investments/ financing,
- Objectives for the integration of climate change issues in financing decisions, such as incorporating carbon footprint in investment yield,
- Targets for the financing of green assets,→Implementation of a strategy for financing the low carbon economy, i.e. developing the green bond market or financing green technologies.
Implementation of reporting on the climate change strategy that includes:
- Carbon footprint of financing and investments,
- Portion of investments/ financing dedicated to the transition to a low carbon economy.
Asset management- Investments on behalf
of third parties in equities, corporate or sovereign bonds, projects etc.
Defining investments’ exposure to climate issues.Evaluating the exposure of invest-ments to climate and carbon risks. Assessing the carbon footprint of investments.
Defining a responsible investment policy that incorporates objectives regarding:
- Allocating savings to green assets, i.e. energy transi-tion funds, green bond funds etc.,
- Integrating climate issues in portfolio construction and asset allocation
- Integrating climate issues in portfolio construction and asset allocation
- Reducing the carbon footprint of investments,- Engaging with issuers to encourage broader integra-
tion of climate risks in their strategies for business development.
Publishing reports on implementa-tion of the responsible investment policy that include:
- Metrics assessing the carbon impact of investments,
- The proportion of investments al-located to solutions for achieving a low carbon economy,
- Engagement initiatives support-ing the struggle against climate change and the transition to a low carbon economy.
Insurance-Insuring persons and propertyAsset management
Defining investments’ exposure to climate issues.Evaluating the exposure of invest-ments to climate and carbon risks. Assessing the carbon footprint of investments.→
Designing a policy for responsible insurers that includes targets in the following areas:
- Management of climate risks as a component insur-ance policies
- Inclusion of climate/ carbon issues in investments (cf. asset management).
Contributing to scientific research aimed at identifying the risks and opportunities associated with climate change.
Cf. Asset Management
Figure 5. Avenues for engagement with the financial sector on the topic of financing the energy transition, as applicable to the sector’s main activities
Source: Mirova.

95
MEASUREA CARBON IMPACT METHODOLOGY IN LINEWITH A 2 DEGREE SCENARIO
Manuel CœslierCarbon Analyst, PhD candidate
Esther FinidoriManager, Carbone 4
Contributor: Ladislas Smia, Deputy Head of RI Research
TABLE OF CONTENTS
1 I Why develop a new carbon methodology? 962 I Presentation of the main indicators 97 2 I1 Induced emissions 97 2 I2 Avoided emissions 982 I3 Carbon Impact Ratio 98 2 I4 Qualitative indicator 98 3 I Calculation principles 98 3 I1 Division into sectors around EnergyTransition 983 I2 Quantitative indicator 98
3 I3 Qualitative indicator 994 I Aggregation of results 100 4 I1 Company 1004 I2 Portfolio 100 4 I 2 I 1 Eliminating double-counting 100 4 I 2 I 2 Aggregation of quantitative results 101 4 I 2 I 3 Overall qualitative rating 1015 I From measuring impact to redirecting investment 101
////
////
Im
prov
e Ac
coun
tabi
lity /
////
///

//////// Improve Accountability ////////
96
Today, high expectations surround the measurement of carbon impact. Voluntary initiatives and – little by little – legislation push institutional investors to consider the impact that financial portfolios have on the climate and energy transition. However, current methods (of carbon footprint measurement) are not adequate to determine an investment portfolio’s contribution to these issues. Current approaches, which do not take a life-cycle vision of carbon footprinting, have the particular flaw of not accounting for emissions related to companies’ products and services. The impact of these products and services on the climate is, however, crucial in many sectors – whether positively in the case of renewable energy and energy efficiency solutions, or negatively in the case of fossil fuels.
Following this observation, Mirova and Carbone 4 decided to create a partnership dedicated to developing a new methodology capable of providing a carbon measurement that is aligned with the issues of energy transition: Carbon Impact Analytics (CIA).
Methodological principles
The CIA methodology focuses primarily on three indicators:
➜ A measure of emissions ‘induced’ by a company’s activity from a life-cycle approach, taking into account direct emissions as well as emissions from product suppliers;
➜ A measure of the emissions which are ‘avoided’ due to efficiency efforts or deployment of ‘low-carbon’ solutions;
➜ An overall evaluation that takes into account, in addition to carbon measurement, further information on the company’s evolution and the type of capital or R&D expenditures.
For these evaluations, the methodology employs a bottom-up approach in which each company is examined individually according to an evaluation framework adapted to each sector. Particular scrutiny is devoted to companies with a significant climate impact: energy producers, carbon-intensive sectors (industry, construction, transport), and providers of low-carbon equipment and solutions. Evaluations are then aggregated at the portfolio level while addressing instances of double-counting.
An indicator, and then what?
By adopting a life-cycle vision that accounts for both induced and avoided emissions, the CIA methodology is a reliable tool for measuring the contribution of investments to the issues surrounding the energy transition. Once the diagnostics are made public, financial players will face increasing pressure to improve their carbon performance. Accordingly, in the long term this measure can influence greater action in low-carbon investment strategies.
1 I Why develop a new carbon methodology?
Recent initiatives such as the Montreal Carbon Pledge and the Portfolio Decarbonisation Coalition show investors’ increasing interest in the production of a carbon1 report on investment portfolios. In France this interest, while first voluntary, has now – for the first time anywhere – been made a requirement: ‘[As of the financial year ending in December 2016,] investment companies [...] shall mention in their annual report and make available to their investors information regarding the measures taken to contribute to the energy and ecological transition. [...] Exposure to climate risks, in particular the measurement of greenhouse gas emissions related to the assets held [...] and the contribution to meeting the objective of limiting global warming [...]’2 are among the items to be made available.
The existing methodologies focus primarily on direct emissions (scope 1 + 2) and rarely consider indirect emissions (scope 3), in particular emissions related to the use of products sold. There are essentially two reasons behind these methodological choices. The first is that calculating emissions in a life-cycle approach creates issues of double-counting. The same tonne of carbon is attributed to several different companies and is therefore counted more than once. Addressing these instances of
1. The word ‘carbon’ is, in fact, a misnomer that designates all greenhouse gases, expressed in ‘carbon equivalent’ or C02eq.2. Article L533-22-1 of the French Monetary and Financial Code in effect on 31/12/2016, amended by article 173 of the law on energy transition for green growth.
double-counting involves complex analysis and allocation choices. The other issue is that companies often have limited transparency regarding carbon, thus requiring estimations when information is lacking.
Methodologies that focus primarily on direct emissions quickly reach their limits and can even result in a misleading assessment. Consider the following example: a first portfolio, primarily made up of companies in the service sector, will probably have a low carbon footprint even when indirect emissions are taken into account. A second portfolio, primarily made up of companies in the energy sector that offer innovative products with significant environmental added value, will have a significant carbon footprint, higher than that of the first portfolio.
Let’s look at another example: in the case where scope 3 indirect emissions are not taken into account, an aeroplane manufacturer or an oil producer would have a carbon footprint significantly lower than that of an airline that uses aeroplanes and burns kerosene. Yet each of these players has a key role to carry out in limiting the final carbon footprint: improving fuel upstream, optimising the aeroplane’s fuel consumption in the design stage, optimising routes downstream, etc.These simple examples show that relying exclusively on a company’s direct carbon footprint is not recommended for investors, whether the objective is to measure the efficacy of a strategy implemented upstream or to play a role in strategic decision-making like that involved in portfolio composition.

//////// Improve Accountability ////////
97
How to go further
Active contribution to the energy transition – and thus to limiting global warming – involves a precise analysis of the sectors that are highly exposed to climate issues: oil, gas, electricity producers, heavy industry, transport, construction, etc. There is no ‘perfect’ indicator that, by itself, makes it possible to measure the contribution of an investment portfolio – and, by extension, of an investor – to the energy transition. However, a measurement of a company’s relative performance must necessarily take a life-cycle approach to the company’s products (scopes 1, 2 and 3), and give an indication of potential emissions that are avoided by using ‘green’ technologies. Lastly, a company and its contribution to energy transition cannot be assessed only on quantitative indicators. Some climate change issues are not (yet) reflected in numbers. Thus two companies that are completely identical in their tangible assets may make very different strategic decisions that are determinant in their future climate impact. Investments and R&D choices effectively provide information on the company’s future. Yet these investments, which are strategic company information, are rarely available with details on the technologies involved. The pertinence and future impact of these strategies are therefore qualitative estimates.
From this, it is clear that ‘the contribution to meeting the objective of limiting global warming’ which institutional investors will have the regulatory obligation to disclose in France from 2016 onward cannot be limited to current carbon footprint measurements.
Drawing on this, Mirova formed a partnership with the consulting firm Carbone 4, which specialises in providing support for companies’ strategic climate concerns, in order to develop a new methodology to address responsible investment issues and requirements. The CIA methodology favours a company-by-company assessment in order to establish an objective evaluation of companies’ impact on
energy transition. Beyond merely measuring the carbon footprint, the objective here is to assess the contribution – positive or neutral – of a company with regard to the climate objective. So as not to fall into the trap of sector and/or geographical averages, which have a tendency to ‘smooth out’ performances, each company must be examined in depth so that it can be objectively compared to its peers.
2 I Presentation of the main indicators
In order to measure a company’s performance with regard to the energy transition, the CIA methodology draws on various complementary indicators. Firstly, it considers the quantitative indicators on the company’s induced and avoided emissions, making it possible to establish the company’s position with regard to its peers and assess its contribution to the objective of decarbonising the economy. Secondly, it considers the qualitative indicators that enable the assessment of the company’s evolution over time and its ability to achieve optimal or satisfactory performance in the coming years, which is an essential point in investment choices.
2 I1 Induced emissions
The emissions induced by the company are calculated across its entire reach, thus also including scope 3 when this is relevant. Scope 1 and 2 emissions are often drawn from data furnished by the companies, which now provide comparable evaluations as they are based on the same standards. When direct emissions and/or electricity consumption are not provided, the methodology estimates the emissions using activity data. By contrast, the methodology bases its calculations for scope 3 primarily on activity data with emission factors applied. The data are thus more uniform across companies, and can be compared without concern for what choices were made regarding how to present their data (scope used, calculation method, etc.).
Focus: emission scopes
Emission scopes, as defined in the Greenhouse Gas (GHG) Protocol (the main tool for standardising carbon accounting in companies), make it possible to consider a company’s GHG emissions in terms of a simple dis-tinction: are the emissions those for which the company is directly responsible, or rather emissions elsewhere (upstream or downstream) in the value chain of the company’s products or services?The emission scopes are defined as follows:
Scope 1: All GHG emissions, in particular related to combustion in engines belonging to the company, to the production of chemical products by internal pro-cesses, etc.
Scope 2: Indirect GHG emissions from consumption of purchased electricity, heat or steam.
Scope 3 upstream: Other indirect emissions, such as those related to the extraction and production or pur-
chase of fuels or any other emission that occurs during the life cycle of input products for the company.
Scope 3 downstream: All emissions that appear in the life cycle of outputs, i.e. the goods or services sold.
CO2
CO2
Automobile manufacturerElectricityproducer
SteelProducer
User
Scope 1
Scope 2Scope 3
CO2 CO2
Figure 1. Diagram representing emission scopes foran automobile manufacturer
Source: Mirova.

//////// Improve Accountability ////////
98
2 I2 Avoided emissions
The scope used for the calculation of avoided emissions is the same as that for induced emissions. The objective here is to quantify the emissions that a company did not induce in comparison to a reference. The sectoral nature of the CIA method means that this reference can vary substantially. A company with avoided emissions is therefore a company that uses more efficient processes and products than the reference.
Figure 2. Representation of avoided emissions in relationto induced emissions and reference situation
The concept of avoided emissions is already widespread in project finance for the measurement of carbon impact, and is directly derived from methodologies that were used in the Kyoto Protocol’s Clean Development Mechanisms.
Avoided emissions are virtual emissions: they would have existed without the efforts made by the company to decrease them. Induced emissions already account for this decrease with respect to the reference scenario. There is therefore no point to subtracting the avoided emissions from the induced emissions, as this would count these ‘negative emissions’ twice.
2 I3 Carbon Impact Ratio
This is the ratio of the avoided emissions to the induced emissions. It is an easily understandable indicator of a company’s carbon impact, allowing easy comparison between peers within a same sector.
A company’s Carbon Impact Ratio =Avoided emissions (tCO2eq)
Produced emissions (tCO2eq)
If the ratio is zero, it means the company has no avoided emissions. A ratio of ten signifies that the company’s products made it possible to avoid the emission of ten times the quantity of GHG needed to manufacture, distribute and use the product, as compared to the subsector reference product.
2 I4 Qualitative indicator
As a complement to this quantitative analysis, the methodology also provides a qualitative indicator evaluating the trend in induced and avoided emissions. This estimation involves an analysis of capital and R&D investments that will contribute to a decrease – or increase – in the company’s GHG emissions, as well as its positioning and strategy with
regard to the energy transition. As reporting is relatively incomplete on the topic of investments, particularly when it comes to distinguishing them by sector, the first version of the methodology will strive to provide a qualitative estimation of the future impact of the company’s strategy.
3 I Calculation principles
3 I1 Division into sectors around Energy Transition
Whether the objective is to measure a carbon footprint, quantify the GHG emissions that a company makes it possible to avoid, or qualify a company’s strategy on energy transition, the methods, indicators and expertise vary based on the relevant economic sector. The granularity of the sector divisions used in finance is not suitable to a specific study of energy transition issues. The CIA method is therefore based on a new classification, covering the entire economy and built around the carbon issue. The first distinction is made between high-stakes companies with regard to the energy transition, and the others. The high-stakes companies are then distinguished according to three macro-categories, which differ according to their levers in energy transition:
➜ Energy providers: Their objective is to shift their energy mix towards less carbon-intensive sources and to reduce their direct emissions
➜ Suppliers of low carbon-potential equipment: Their objective is to innovate and to make these innovations accessible to the market
➜ Carbon-intensive sectors: Their objective is to implement energy efficiency solutions in order to achieve ‘optimal climatic performance’
These macro-categories are broken down into sectors and subsectors.
Subsectors were broken down in this way because their respective issues regarding energy transition are each quite different. Agriculture needs to focus particularly on reducing its methane and nitrous oxide emissions, while the construction sector must focus on heating efficiency and insulation. The analyses, while the same across all sectors, are therefore distinct in terms of their calculation parameters, which are unique to each subsector.
The other sectors, which represent the rest of the economy, have a lower potential impact on the energy transition. The assessment of their climate impact can therefore be simplified using quicker estimations, due to this limited climate impact.
3 I2 Quantitative indicator
For each of the CIA methodology’s macro-sectors, the quantitative indicators depend on distinct parameters. For induced emissions, the main question is that of the scope of study. For avoided emissions, the issue is sensitive since
Reference situation
Producedemissions
Avoidedemissions
Source: Mirova.

//////// Improve Accountability ////////
99
the choice of reference forms the basis for all subsequent assessments. The choice of this reference varies depending on the relevant macro-category – sometimes even depending on the sector – as the objective is to evaluate companies according to ambitious criteria, which can vary depending on the issues inherent to each sector.
Calculation principles for produced emissions
Scopes 1 + 2 + 3, upstream and downstream (combustion of fuels produced or sold in
the course of the year)
Calculation principles for avoided emissions
Only for electricity: Comparison of the carbon intensity of the electricity produced by the company with a reference scenario
Results of the analysis: produced emissions
The comparison of carbon intensities makes it possible to select low-carbon companies. In fossil energies in particular, companies with
lower emissions are preferred.
Results of the analysis: avoided emissions
In the electric sector, the companies with avoided emissions have a lower carbon
intensity per energy source than an ambitious reference
Figure 2. Energy suppliers
Figure 3. Suppliers of low carbon-potential equipment
Calculation principles for produced emissions
Scopes 1 + 2 + 3 downstream (due to the products and services sold by the company)
The produced emissions account for future emissions due to the products sold in the course
of the year (if they consume energy) over their entire life cycle
Calculation principles for avoided emissions
The emissions avoided due to efficient products sold in the course of the year are calculated
over the life cycle of the products and in com-parison with the products that were replaced
Results of the analysis: produced emissions
High-emission companies are those that sell products that consume energy during their life
cycle (cars, buildings, etc.). Emissions alone are not enough to determine the carbon impact
of companies in this category
Results of the analysis: avoided emissions
Carbon-efficient companies are those that have high Carbon Impact Ratios as well as significant
avoided emissions in per euro revenue
Figure 4. Carbon-intensive sectors
Calculation principles for induced emissions
Scopes 1 + 2 + 3
Calculation principles for avoided emissions
Decrease in the company’s carbon intensity over the past five years (carbon intensity per unit of volume produced or managed) and,
in certain cases, comparison with a reference scenario
Results of the analysis: induced emissions
The companies with the lowest induced emissions are the top performers
N.B.: The carbon intensities of the activities of different companies can be compared with-in the same subsector. However, operational differences (vertical integration, subcontract-ing) can also explain variations in intensity.
Results of the analysis: avoided emissions
Those companies which have most signifi-cantly reduced their carbon intensity over the previous 5 years achieve the highest carbon
impact ratios.
3 I3 Qualitative indicator
This evaluation is based on the estimation of the two indicators on a scale from - - to ++.
Concerning strategy and positioning with regard to low-carbon transition
➜ ++ : The company incorporates combating climate change as a key point in its strategy, its induced emissions are low and/or it has significantly reduced its emissions per product unit sold, and it has ambitious reduction goals. The share of sales in line with climate change objectives is greater than 50% with a trend towards growth in the medium term.
➜ + : The company incorporates combating climate change as an important point in its strategy and it
Key categories Sectors Subsectors
Energy sector suppliersFossil fuels Oil, gas and carbon industriesElectricity Electricity industry
Suppliers of low carbon-potential equipment
Suppliers of:Energy solutions for buildings: construction and equipment
Energy solutions for industry and IT and communicationEnergy solutions for transport
Energy solutions for electricity productioné
Carbon-intensive sectors
Heavy industry
Cement and clinker productionSteel production
Aluminium productionPlastics productionChemical industryGlass productionSugar production
Forest and paper Wood and forest productsPaper production
Transport Transport operators
Construction Buildings – Fleet managers and owners
Agriculture Agriculture, fishing, Agro-food and Fertilisers
Figure 1. CIA methodology sector classification

//////// Improve Accountability ////////
100
reduced its emissions per product unit sold and/or has ambitious reduction goals. The share of sales in line with climate change objectives falls between 20% and 50% with a trend towards growth in the medium term.
➜ - : The company has high levels of induced emissions, but has reduced them or has set objectives for reducing them. However, these reductions are unambitious or do not seem entirely credible. The share of sales in line with climate change objectives falls between 5% and 20%, with expected stability in the medium term.
➜ -- : The company is carbon-intensive and has not incorporated climate change as an important factor in its strategy. The share of sales in line with climate change objectives is less than 5%, and there is no indication that this will increase in the medium term.
Concerning investment and R&D spending:
➜ ++ : The company’s investment and R&D policy are in line with the struggle against climate change. The share of investments and R&D spending related to energy transition is greater than 50%.
➜ + : Although climate change objectives are included in the company’s investment and R&D policy, these do not represent the majority of spending. They generally account for between 20% and 50% of expenditures.
➜ - : Climate change objectives are taken into account to a limited extent in the company’s investment and R&D policy. They generally represent only 5% to 20% of spending.
➜ -- : The company has not included climate objectives in its investment and R&D policy. They generally therefore represent less than 5% of spending.
The overall qualitative rating is then determined based on the two qualitative ratings mentioned above. The evaluation obtained by this method is supplemented with an evaluation of quality and the company’s transparency in order to pave the way for dialogue and engagement.
4 I Aggregation of results
4 I1 Company
When a company is being analysed, its sectors of activity are reviewed first. The company is thus ‘distributed’ between the subsectors of the CIA methodology, with each subsector requiring different activity data (whether this be physical or financial).
These data make it possible to calculate the quantitative indicators for each of the company’s CIA subsectors: induced emissions, avoided emissions and emissions reported by the company.
The analysis then involves producing the quantitative indicators for the whole company:
➜ Induced emissions: sum of emissions induced in each of the company’s sectors of activity;
➜ Avoided emissions: sum of emissions avoided in each of the company’s sectors of activity;
➜ Carbon Impact Ratio: ratio of the sum of avoided emissions to the sum of induced emissions.
Lastly, the methodology provides an overall rating of the company’s carbon performance. This rating is determined by an evaluation committee on the basis of two criteria:
➜ The company’s results for the methodology’s quantitative and qualitative indicators, which provide an overview of the intrinsic carbon performance;
➜ The comparison of this performance with the performances of other companies in the same subsector.
The overall rating is the result of a careful assessment that contextualises a company’s carbon performance within its sector, and therefore can assist the fund manager in making decisions.
4 I2 Portfolio
The aggregation of the assessments, both quantitative and qualitative, at the portfolio level presents numerous methodological problems that we will address in this section. From eliminating double-counting to aggregating qualitative ratings, as well as attributing emissions to the investor in order to total them, each issue requires a precise methodology in order to obtain relevant results.
4 I 2 I 1 Eliminating double-counting
Double-counting is not a problem at the company level, since it is only the company’s impact that matters. Two companies in the same sector can thus be compared without recalculating emissions, as the higher-performing company will necessarily have a lower overall carbon intensity. The problem appears when attempting to add the emissions of multiple companies that operate within the same value chains. The emissions from one are invariably also included in the emissions from another, and it is therefore impossible to assert a quantity of ‘induced’ or ‘avoided’ carbon at the portfolio level. Whatever the quantitative indicator observed (induced emissions or avoided emissions), the risk of double-counting is the same: one tonne of CO2, induced or avoided, might be counted multiple times within the same value chain. Take the example of a lorry (truck): emissions related to fuel combustion are counted as direct emissions attributed to the freight company operating the lorry, and as indirect emissions to the automobile manufacturer and oil producer. In short, if these three companies are present in the same investment portfolio, the tonnes of GHG emitted by said lorry will be counted three times. Rules for allocating these emissions are therefore necessary in order to distribute them across the different players responsible for them. The first three independent categories that can be highlighted are the macro-categories of the CIA methodology:

//////// Improve Accountability ////////
101
➜ Energy suppliers (the oil producer in our example);
➜ Historically carbon-intensive companies (our freight company);
➜ Companies that supply solutions and equipment (automobile manufacturers)
The methodology thus distributes emissions in equal shares among these three categories, making it possible to eliminate most instances of double-counting.
4 I 2 I 2 Aggregation of quantitative results
One universal issue is that of attributing a financial asset holder to a share of the underlying company’s carbon footprint. Thus the methodologies that only cover stocks distribute emissions only among a company’s stockholders, while the methodologies that also include bond (or, more often, mixed) portfolios use the share of the enterprise value3 held in the portfolio.
Once instances of double-counting have been addressed, the induced and avoided emissions can be calculated at the portfolio level. To do this, investors must first determine what portion of a company’s induced and avoided emissions can be attributed to them. As the methodology applies to both stocks and bonds, this is achieved by determining what proportion of the enterprise value is held in the portfolio. In order to complete the aggregation, the next step is to calculate the carbon intensity per euro of enterprise value for each company in the portfolio.4 To summarise, the quantitative indicators at the portfolio level are calculated in three steps:
1) Calculation of the company’s carbon intensity expressed in tCO2 eq/euro of Enterprise Value
2) Multiplication by the portfolio’s exposure to this company, in millions of euros
Reprocessed (tCO2eq)
Enterprise Value (€M)Portfolio exposure (€M)
= Emission to add (tCO2eq)
*
3) Addition of the induced emissions across the entire portfolio, and the same for the avoided emissions
4 I 2 I 3 Overall qualitative rating
The qualitative rating on the portfolio level is obtained using the distribution of the evaluations of the underlying companies. The result is a proportion of portfolio securities that are expected to decrease in carbon intensity in the near future (having been evaluated as + or ++), as well as a proportion of securities with the opposite trend.
3. Defined as the sum of the company’s market capitalisation and financial debt.4. Based on the hypothesis that GHG emissions are equally distributed across the company’s stocks and bonds.
Figure 5. Sample distribution of a portfolio’s qualitative ratings
Qualitative rating Weight in the portfolio
++ 10 %
+ 55 %
- 30 %
-- 5 %
The investor also has access to an overall qualitative rating, which is equivalent to the weighted mean of the overall ratings of each underlying company.
5 I From measuring impact to redirecting investment
We have described a methodology with the purpose of estimating an investment portfolio’s impact on energy transition. By considering carbon, a transverse indicator of the climate issue, this methodology makes it possible to determine a portfolio’s contribution to the objective of decarbonising the economy, as well as whether or not it tends to be aligned with this objective. These measures, which are communication components, should above all be parameters for investment decisions, as a complement to traditional financial indicators. Redirecting investments towards renewable energy and the energy efficiency recommended to limit the rise in the Earth’s surface temperature to 2°C need to be backed up by tangible indicators that enable investors to make the right choices.

Visit us: www.mirova.com
Follow us: @Mirova_RI
Mirova profile

This information purpose only document is a non-contractual document intended only for professional/not-professional clients in accordance with MIFID. It may not be used for any purpose other than that for which it was conceived and may not be copied, distributed or communicated to third parties, in part or in whole, without the prior written consent of Mirova.No information contained in this document may be inter-preted as being contractual in any way. This document has been produced purely for informational purposes. Mirova reserves the right to modify any information contained in this document at any time without notice.This document consists of a presentation created and prepa-red by Mirova based on sources it considers to be reliable. However, Mirova does not guarantee the accuracy, ade-quacy or completeness of information obtained from external sources included in this document.
These simulations/assumptions are made/indicated for example, they do not constitute an undertaking from Mirova and Mirova does not assume any responsibility for such simulations/assumptions.
Figures contained in this document refer to previous years. Past performance and simulations of past and future per-formances are not a reliable indicator and therefore do not anticipate future results. Reference to a ranking and/or a price does not indicate the future performance of the strategy or the fund manager.
The scenarii and investment strategies referenced herein represent the views of Mirova as of the date indicated. There can be no assurance that developments will transpire as may be forecasted in this material. These are subject to change, depending on market evolution and regulation in force.
Under Mirova’s social responsibility policy, and in accordance with the treaties signed by the French government, the funds directly managed by Mirova do not invest in any company that manufactures sells or stocks anti-personnel mines and cluster bombs.
All information is the opinion and analysis of the authors, it is not guaranteed, and is subject to change without notice. None of the information contained in this document should be interpreted as having any contractual value.
Where required by local regulation, this material is provided only by written request. • In the EU (ex UK) Distributed by NGAM S.A., a Luxembourg management company autho-rized by the CSSF, or one of its branch offices. NGAM S.A., 2, rue Jean Monnet, L-2180 Luxembourg, Grand Duchy of Luxembourg. • In the UK Provided and approved for use by NGAM UK Limited, which is authorized and regulated by the Financial Conduct Authority. • In Switzerland Provided by NGAM, Switzerland Sàrl. • In and from the DIFC Distri-buted in and from the DIFC financial district to Professional Clients only by NGAM Middle East, a branch of NGAM UK Limited, which is regulated by the DFSA. Office 603 – Level 6, Currency House Tower 2, P.O. Box 118257, DIFC, Dubai, United Arab Emirates. • In Singapore Provided by NGAM Singapore (name registration no. 5310272FD), a division of Absolute Asia Asset Management Limited, to Institutional Investors and Accredited Investors for information only. Absolute Asia Asset Management Limited is authorized by the Monetary Authority of Singapore (Company registra-tion No.199801044D) and holds a Capital Markets Services License to provide investment management services in Sin-gapore. Registered office: 10 Collyer Quay, #14-07/08 Ocean Financial Centre. Singapore 049315. • In Hong Kong Issued by NGAM Hong Kong Limited. • In Taiwan: This material is provided by NGAM Securities Investment Consulting Co., Ltd., a Securities Investment Consulting Enterprise regulated by the Financial Supervisory Commission of the R.O.C and a business development unit of Natixis Global Asset Mana-gement. Registered address: 16F-1, No. 76, Section 2, Tun Hwa South Road, Taipei, Taiwan, Da-An District, 106 (Ruentex Financial Building I), R.O.C., license number 2012 FSC SICE No. 039, Tel. +886 2 2784 5777. • In Japan Provided by Natixis Asset Management Japan Co., Registration No.: Director-General of the Kanto Local Financial Bureau (kin-sho) No. 425. Content of Business: The Company conducts discretionary asset management business and investment advisory and agency business as a Financial Instruments Business Operator. Registered address: 2-2-3 Uchisaiwaicho, Chiyoda-ku, Tokyo.
The above referenced entities are business development units of Natixis Global Asset Management, the holding com-pany of a diverse line-up of specialised investment manage-ment and distribution entities worldwide. Although Natixis Global Asset Management believes the information provided in this material to be reliable, it does not guarantee the accuracy, adequacy or completeness of such information.
DISCLAIMER
MIROVA Mirova is a subsidiary of Natixis Asset ManagementLimited liability company - Share capital €7 461 327.50Regulated by AMF under n°GP 02-014RCS Paris n°394 648 216 Registered Office: 21 quai d’Austerlitz – 75013 Paris
NATIXIS GLOBAL ASSET MANAGEMENTLimited Company - Share Capital: €156 344 050RCS Paris 453 952 681 00022 Registered Office: 21 quai d’Austerlitz - 75634 Paris Cedex 13
Mirova.Responsible investing
Visit us: www.mirova.com Follow us: @Mirova_RI
Mirova profile

NOTES

NOTES

NOTES

NOTES

NOTES

NOTES

NOTES

NOTES

NOTES

logo FSC
Lim
ited
liabi
lity
com
pany
- Sh
are
capi
tal 7
461
327
,50
- Reg
ulat
ed b
y A
MF
unde
r n°
GP
02- 0
14 -
RC
S Pa
ris n
° 39
4 64
8 21
6 - 2
1 qu
ai d
’Aus
terli
tz -
7563
4 Pa
ris C
edex
13.
Res
pons
ible
inve
stin
g : i
nves
tir re
spon
sabl
e
Short term thinking won’t take you very far.A financial industry out of touch with economic, ecological and social realities has no future. That is why our investment decisions are motivated primarily by the industrial strategies of the companies we back. Our experts perform extensive analyses of sustainable business models that are engines for growth, employment and innovation, shaping the world of tomorrow.
Mirova was voted Best at SRI among Asset Management Firms for 2014 by Thomson Reuters and the UK Sustainable Investment and Finance Association(*).
(*)The 2014 Survey represents the views of over 360 investment professionals from 27 countries, makingit the most extensive assessment of socially responsible investing (SRI) in the European investment community. Voting was conducted from 24th March to 7th May 2014. It reflects a contribution from 179 buy-side firms and 14 brokerage firms/research houses. Visit www.uksif.org for more information.Promotional material. Any reference to a ranking, a rating or an award provides no guarantee of future performance and is not constant over time.
Mirova a subsidiary of Natixis Asset Management specialized in Responsible Investment, offers engaged investment management aiming to combine value creation and sustainable development.Mirova favours a global approach to responsible investment and has a team of around fi fty experts in thematic investment management, fund managers specialising in different business sectors, engineers, fi nancial and extra-fi nancial analysts, experts in project fi nancing and solidarity fi nance. Mirova has also developed a research partnership with the University of Cambridge and actively participates within various international organisations.
Head of publication:Hervé Guez, Head of RI Research
Authors: Basselier, Clotilde, SRI Portfolio ManagerBennani, Zineb, Head of Governance and EngagementCoeslier, Manuel, Carbon Analyst, PhD candidateDufour, Mathilde, Deputy Head of RI ResearchDunand-Chatellet, Léa, Head of EquitiesGuez, Hervé, Head of RI ResearchLauverjat Céline, Investment Director Renewable Energie TeamOstiari, Emmanuelle, SRI AnalystSmia, Ladislas, Deputy Head of RI Research
Additional contributions from:Bonnin, Marguerite, SRI AnalystBriand, Marc, Head of Fixed IncomeFavier, Julien, SRI AnalystFinidori, Esther, Manager, Carbone 4Wigley, Chris, Senior Portogolio Manager, Green Bonds
Translation and editing: Jacqueline Dobie, Susannah Mary Ellis, Elizabeth Lefer, Elsa Perrin, Christopher Treadwell, Shannon Kiernan, Rachel Zerner (Copy Editor)
Design:Agence Fargo, 91 rue Réaumur – 75002 Paris
Printing: Tanghe Printing, Boulevard Industriel, 20, B-7780 CominesPrinted on Cocoon Silk with vegetable-based inks
First issue:May 2013
Visit us: www.mirova.com
Follow us: @Mirova_RI Profi l Mirova

MIROVAMirova is a subsidiary of Natixis Asset ManagementLimited liability company - Share capital: € 7,461,327.50Regulated by AMF under n°GP 02-014RCS Paris n°394 648 216Registered Offi ce: 21 quai d’Austerlitz – 75 013 Paris
NATIXIS GLOBAL ASSET MANAGEMENTLimited Company - Share Capital: €156 344 050RCS Paris n°453 952 681Registered Offi ce: 21 quai d’Austerlitz – 75 634 Paris Cedex 13 - France
Visit us: www.mirova.com
Follow us: @Mirova_RI Profi l Mirova
# 4
MIR
OVA’
S IN
SIGH
TS 4
IN
VEST
ING
FOR
A L
OW C
ARBO
N E
CON
OMY
# 4
Desi
gn: a
genc
e Fa
rgo
- 10
/201
5
INVESTING FOR A LOW
CARBON ECONOMY
Special issue COP21