carbon clean 200: investing in a clean energy future
TRANSCRIPT

CARBON CLEAN 200INVESTING IN A CLEAN
ENERGY FUTURE
TM

ABOUT THE AUTHORSTOBY HEAPS is the chief executive officer and co-founder of Corporate Knights. He spearheaded the first global ranking of the world’s 100 most sustainable corporations in 2005,and in 2007 coined the term “clean capitalism.” He sits on the Ashoka Canada Board and theUniversity of Toronto’s Environment and Finance Committee. Toby has been published in theFinancial Times, Wall Street Journal, and the Globe and Mail. In 1998, he played centerfield for theYugoslav National Baseball Team.
MICHAEL YOW is Director of Research of Corporate Knights, responsible for corporatesustainability data integrity and benchmarking. He is the research lead for the Global 100 MostSustainable Corporations in the World (Global 100) index, as well as the Sustainable CountriesIndex and the Sustainable Stock Exchanges Global Benchmarking Study.
ANDREW BEHAR is the CEO of As You Sow (description below.) Previously, Andrewfounded a clean-tech start-up developing innovative fuel cell technologies for grid-scale energystorage. He is on the board of US Social Investing Forum (US-SIF) and was named one of 30 “Eco Rock Stars and Environmental Mavericks” in Origin Magazine’s August 2015 issue. His book, The Shareholder Action Guide will be published in November 2016.
ABOUT CORPORATE KNIGHTS: Founded in2002, Corporate Knights seeks to provide information thatempowers people to harness markets for a better world. Thecompany has a media and research division, which includes theaward-winning business and society magazine Corporate Knights. The research division produces corporaterankings, research reports and financial product ratings based on corporate sustainability performance includingCleancapitalist.com and Decarbonizer.co. Its best-known rankings include the Best 50 Corporate Citizens inCanada and the Global 100 Most Sustainable Corporations. In June 2013, Corporate Knights was namedMagazine of the Year by Canada’s National Magazine Awards Foundation.
For more information about Corporate Knights, please visit www.corporateknights.com
ABOUT AS YOU SOW®: Founded in 1992, As YouSow is a 501(c)(3) tax-exempt nonprofit organization dedicated topromoting environmental and social corporate responsibility throughshareholder advocacy, coalition building, and innovative legalstrategies. Our efforts create large-scale systemic change by establishing sustainable and equitable corporatepractices. As You Sow was founded on the belief that many environmental and human rights issues can beresolved by increased corporate responsibility. As investor representatives, we communicate directly withcorporate executives to collaboratively develop and implement business models that reduce risk, benefit brandreputation, and protect long-term shareholder value while simultaneously bringing about positive change for theenvironment and human rights.
SPONSORS: This report was made possible by the generous support of Invoking the Pause and theShugar Magic Foundation. Additional support was provided by the Arntz Family Foundation, The Keith CampbellFoundation for the Environment, Firedoll Foundation, Hanley Foundation, The Libra Foundation, ManaakiFoundation, New Belgium Family Foundation, The Roddenberry Foundation, Roy and Patricia Disney FamilyFoundation, and Singing Field Foundation.
ACKNOWLEDGEMENTS: Thanks to our researchers, peer reviewers, editors, designers, andother contributors including: Ahmed Nagi, Andrew Montes, Taraneh Arhamsadr, Kristin Costa, Danielle Fugere,Amelia Timbers, Sarah Milne, and John Opet.

CARBON CLEAN 200: INvESTING IN A CLEAN ENERGY FUTURE 1
FOREWARDBY THE AUTHORS** As You Sow and Corporate Knights are not investment advisors nor do we provide financial
planning, legal or tax advice. Nothing in the Carbon Clean 200 Report shall constitute or be
construed as an offering of financial instruments or as investment advice or investment
recommendations.**
The global economy is in a monumental transition from an energy system based on fossil fuels to one basedon clean renewable energy sources and technologies. Our purpose in developing the Clean200 list andpublishing this report is to start a broad and dynamic dialogue about how all investors can co-create a clean energy economy and how best to evaluate and highlight companies that are already onthe continuum of transition.
It has been over six years since the first students began to call on their university endowments to divest fromfossil fuels—to urge their universities to stop profiting from companies that were destroying their future. Overtime, many of those investments have hurt university endowment portfolios, and the trustees who listenedto their students and aligned their institutions’ investing with the school’s mission ended up avoidingconsiderable financial pain.
A great deal of effort has been devoted to identifying the fossil fuel companies that most threaten our fragileclimate. This report asks a different set of questions: which companies currently are profiting from makingthe decision to participate in the clean transition and what is the best way to spot them? To answer thesequestions we decided to rely on the Bloomberg New Energy Finance (BNEF) database. We wanted to makeour analysis simple to understand and to look at stable companies rather than startups, so we started witha pool of global companies that have at least a $1bn market cap and have at least 10% “Clean EnergyRevenue” as defined by BNEF. We then excluded oil/gas/coal companies, companies that manufactureweapons, utilities with less than 50% renewables, companies that profited from deforestation, and companiesthat engage in child/forced labor. We then took the top 200 and ranked them by estimated clean revenue—the “Clean200”.
We compared the Clean200 to the Carbon Underground 200, the list of the largest fossil fuel companiesthat the Divest-Invest movement and many fossil free mutual funds use as a screen. We also compared theClean200 to the S&P 1200 global benchmark and what we saw is telling. First, over 1/3 of the Clean200companies are Chinese, which speaks to a quiet green energy revolution afoot in what is now the world’slargest economy. Another interesting finding is that 26 countries are represented. Our Clean200 list alsoraised questions about BNEF’s methodology; how do they count hybrid cars that burn gas, putting Toyotaat #1? And finally, we recognize that we need to find a systematic way to put a more stringent human rightsscreen on the list.
We realize that this first pass is just a start. What will be more interesting is how our Clean200 methodologymay be improved and change over time. So we decided to make a spreadsheet with all of this data availableto anyone and to update the list quarterly to track the changes and trends. We welcome suggestions onways to improve the methodology. We will share all ideas that we receive, as well as our subsequent analysesand testing.
Stating it one more time: The Clean200 is not intended to be a stock-pick-list or an index. It suggests thatthere are ways to identify the companies that are paving the way to the “Great Transition” to a clean energyeconomy. It is an invitation to open a broad and transparent global conversation. We hope that the bestminds will find this thought exercise as exciting as we do and join us.
With great hope and optimism for the future,
Toby Heaps Andrew Behar

CARBON CLEAN 200: INvESTING IN A CLEAN ENERGY FUTURE 2
THE CARBON CLEAN 200: THE BIGGEST 200 PUBLIC COMPANIESRANKED BY GREEN ENERGY REVENUES
Over the past five years, and growing dramatically leading up to and post-Paris COP 21, a movement of
institutional and individual investors representing more than $3.4tn in assets under management have divested
a portion of their fossil fuel investments and committed to divesting the balance in the next five years. The corollary
of divesting fossil fuels is re-investing in the clean energy future. As an invitation to a larger discussion of how we
can invest in a clean energy future, we created the Carbon Clean 200 (Clean200TM)—a list of the 200 largest
companies worldwide ranked by their total clean energy revenues.
The Clean200 is intended as the clean energy inverse of the Carbon Underground 200TM. Where the
Carbon Underground 200TM (which evolved from the seminal Carbon Tracker Initiative report, Unburnable Carbon:
Are the World’s Financial Markets Carrying a Carbon Bubble?1), ranks the largest publicly listed companies by
the carbon intensity of their coal, oil, and gas reserves; the Clean200 ranks the largest publicly listed companies
by their total clean energy revenues, with a few additional screens to help ensure the companies are indeed
building the infrastructure and services needed for what Lester Brown and many others have called “The Great
Energy Transition2” in a just and equitable way.
The moral case for divesting from fossil fuels has been well argued, but for many, the economic case is less clear.
However, as clean energy growth rates take off and demand growth for fossil fuels flatlines, it is probable that
divesting fossil from fuels in favor of a clean energy future does not have to come at a sacrifice to long-term
investment returns.
On the risk side, divesting is about not getting stuck holding stranded fossil fuel assets that cannot be burnt if the
world is to adhere to a given carbon budget, a topic on which Mark Carney, governor of the Bank of England, has
expressed concerns in a landmark speech to global insurer Lloyd’s of London.3 On the opportunity side, investing
in the transition from a high-carbon to a low-carbon economy represents “the largest economic opportunity of the
21st century” according to John Doerr4 a major venture capitalist at Kleiner-Perkins in Silicon valley.
It might seem counter-intuitive for an investor to sell their fossil fuel stocks when most people are still driving
internal combustion cars and burning fossil fuels every day. However, the point and the power dynamic of investing
is that, as an investor, you have the power to bet on and capitalize the creation of the world that you want to see.
If you are wrong, you will lose money. If you are right, you will profit from and add momentum to the change you
believe in. While many mission-driven investors believe that the arc of history bends towards justice—that
companies which create positive rather than negative externalities will prevail—in the case of climate friendly
investing, it may actually be true. Many investors have found this out the hard way. Indeed, in a world of limited
capital every investment has opportunity cost. When people vote with their investment dollars in favor of clean
energy over dirty it sends a message as powerful as any ballot box that the time has come to stop using the
atmosphere as a free dumping ground.
Take coal, which accounts for over 40% of global greenhouse gas emissions.5 The industry is declining rapidly
in value, especially in the United States. Peabody Energy, the largest private-sector coal company in the world,
filed for Chapter 11 bankruptcy protection this April, following Arch and Alpha. The Dow Jones Coal Index
dropped 93% over the past five years. Oil companies are facing similar problems. Fifty-two have filed for

CARBON CLEAN 200: INvESTING IN A CLEAN ENERGY FUTURE 3
Methodology: To calculate the performance of the Carbon Underground 200 versus the
Clean200 versus the S&P 1200, a ‘snapshot in time’ analysis was used consisting of the current
constituents of the Clean200 (July 1, 2016), S&P 1200 (July 1, 2016) and the most recent publicly
available list of the Carbon Underground 200 (May 15, 2015). The ‘snapshot-in-time analysis’ was
necessitated due to the absence of historical data series for Bloomberg’s BNEF New Energy
Exposure field. All three lists were equally weighted and re-balanced quarterly from January 1,
2006 to July 1, 2016. Returns were calculated using Bloomberg monthly total returns including
gross dividends for each security. Rebalancing takes effect immediately after the rebalancing date.
A ‘snapshot-in-time analysis’ based on a static list introduces a survivorship bias. Survivorship
bias can be present when stocks which do not currently exist (because they have failed, for
example) are excluded from the historical analysis. This bias can result in the overestimation of
past returns.
bankruptcy since 2015, and over a third of the world’s biggest oil and gas companies have crushing debt loads
(over $150 billion) and cash flows depressed by low oil prices, according to the Deloitte Center for Energy
Solutions6 and a recent study by As You Sow.7
Major investment indices are now only half as exposed to the fossil fuel sector (1.5% to coal, 7% to oil and gas)
as they were five years ago. This is not due to any active decision to divest, but rather because fossil fuel stocks
have lagged while other sectors have produced healthy returns.
While fossil fuel stock performance stagnates, clean energy is taking off. The world is currently adding twice as
much clean power capacity as coal, oil, and gas combined, according to Bloomberg New Energy Finance
(BNEF).8 Wind’s market share of power generation has doubled four times in the past 15 years, and solar has
doubled seven times. It’s also getting cheaper to make power from wind and solar, thanks to technology, better
financing and economies of scale. Increased demand for a technology generally reduces prices, whereas
increased demand for a commodity increases prices. This basic calculus has driven the price of a renewable
kilowatt of energy ever downward, making the choice of energy an economic one. Companies which make
a significant amount of their revenue from environmental solutions now make up 5% of global investment
indices; the Clean200 list of companies have a collective value over $1 trillion.
In the next 10 years, McKinsey9 expects oil demand growth to flatten due to growing fuel efficiencies and
competitive technologies such as the electric car. Battery prices fell 35% last year, and electric car sales rose by
60%. By 2022, BNEF estimates electric vehicles will cost the same as their internal combustion counterparts,
and if growth continues at the current pace, oil displacement by electric cars will reach 2 million barrels per day
by 2023—the size of the current oil glut and enough to drive global oil prices to record lows. Factoring in
autonomous cars and ride-sharing services, electric cars could reach 50% of new car sales by 2040, according
to BNEF, 50 times higher than what OPEC is projecting.10, 7
None of this portends an imminent conclusion to our fossil fuel age, but it does suggest an end to fossil fuels
as a long-term growth market and the beginning of a long run expansion of clean energy demand. This sentiment
has been ratified, sanctified, and tallied by the political, moral, and financial bellwethers of our time, from the
Paris climate talks (195 countries committed to phase out fossil fuels this century) to the vatican (Pope Francis
has made moral invocations to drastically reduce use of fossil fuels in the encyclical Laudato Si’11) to the
Bank of England (the bank’s governor Mark Carney has warned not to get stuck holding a bag of stranded
fossil fuel assets).
CARBON CLEAN 200: INvESTING IN A CLEAN ENERGY FUTURE 4
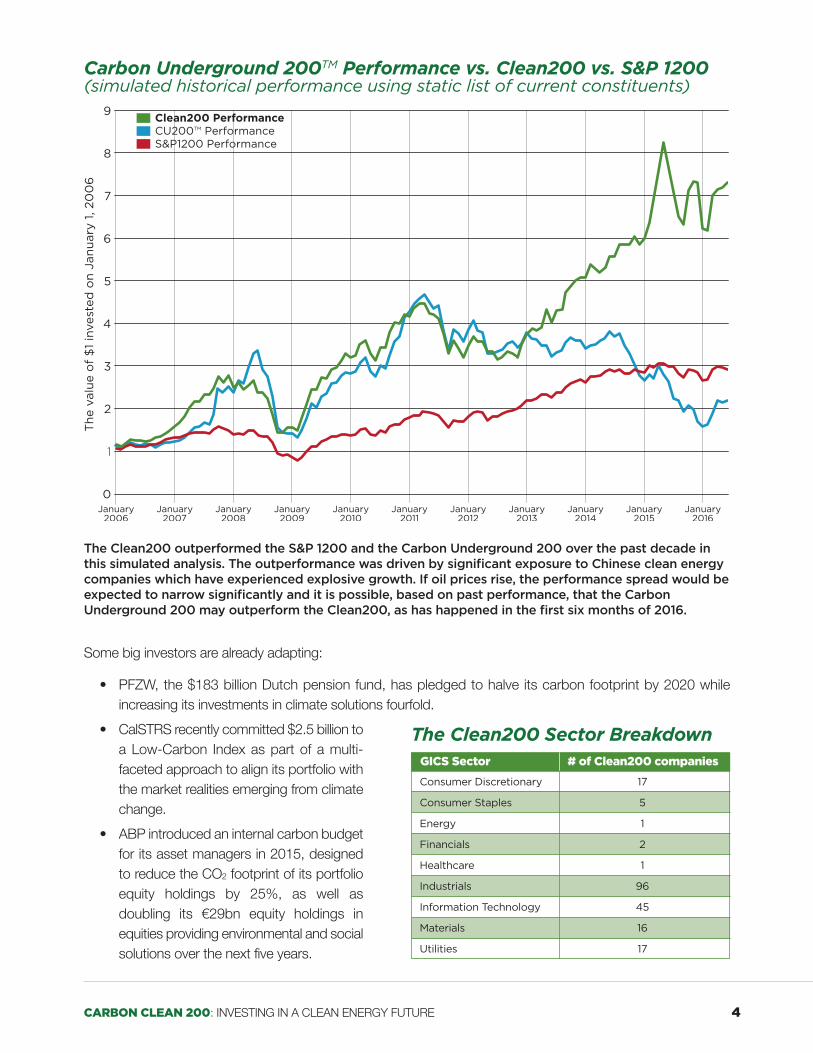
Carbon Underground 200TM Performance vs. Clean200 vs. S&P 1200 (simulated historical performance using static list of current constituents)
The Clean200 outperformed the S&P 1200 and the Carbon Underground 200 over the past decade inthis simulated analysis. The outperformance was driven by significant exposure to Chinese clean energycompanies which have experienced explosive growth. If oil prices rise, the performance spread would beexpected to narrow significantly and it is possible, based on past performance, that the CarbonUnderground 200 may outperform the Clean200, as has happened in the first six months of 2016.
Some big investors are already adapting:
• PFZW, the $183 billion Dutch pension fund, has pledged to halve its carbon footprint by 2020 while
increasing its investments in climate solutions fourfold.
• CalSTRS recently committed $2.5 billion to
a Low-Carbon Index as part of a multi-
faceted approach to align its portfolio with
the market realities emerging from climate
change.
• ABP introduced an internal carbon budget
for its asset managers in 2015, designed
to reduce the CO2 footprint of its portfolio
equity holdings by 25%, as well as
doubling its €29bn equity holdings in
equities providing environmental and social
solutions over the next five years.
Consumer Discretionary
Consumer Staples
The Clean200 Sector BreakdownGICS Sector
17
5
Energy 1
Financials 2
# of Clean200 companies
Healthcare 1
Industrials 96
Information Technology 45
Materials 16
Utilities 17
CARBON CLEAN 200: INvESTING IN A CLEAN ENERGY FUTURE 5
• AXA divested from all coal holdings (mining companies and electric utilities deriving over 50% of their
turnover from coal) in 2015 and committed to triple its green investments by 2020.
Corporate Knights and As You Sow are committed to updating this list on a quarterly basis and ensuring that it
remains in the Creative Commons12 as a public good. We invite anyone to make it better and share any new
ideas to improve the methodology for the next quarter. It can be downloaded at www.clean200.org.
THE CLEAN200 METHODOLOGYThe Clean200: The biggest 200 public companies ranked by green energy revenues, was first published on
August 15, 2016 by Corporate Knights and As You Sow.
The Clean200 are listed by their estimated green revenues in USD. The dataset is developed by multiplying a
company’s most recent year-end revenues by its BNEF New Energy Exposure Rating mid-point. In order to be
eligible, a company must have a market capitalization greater than $1 billion (end of Q2 2016) and earn more
than 10% of total revenues from New Energy13 sources.
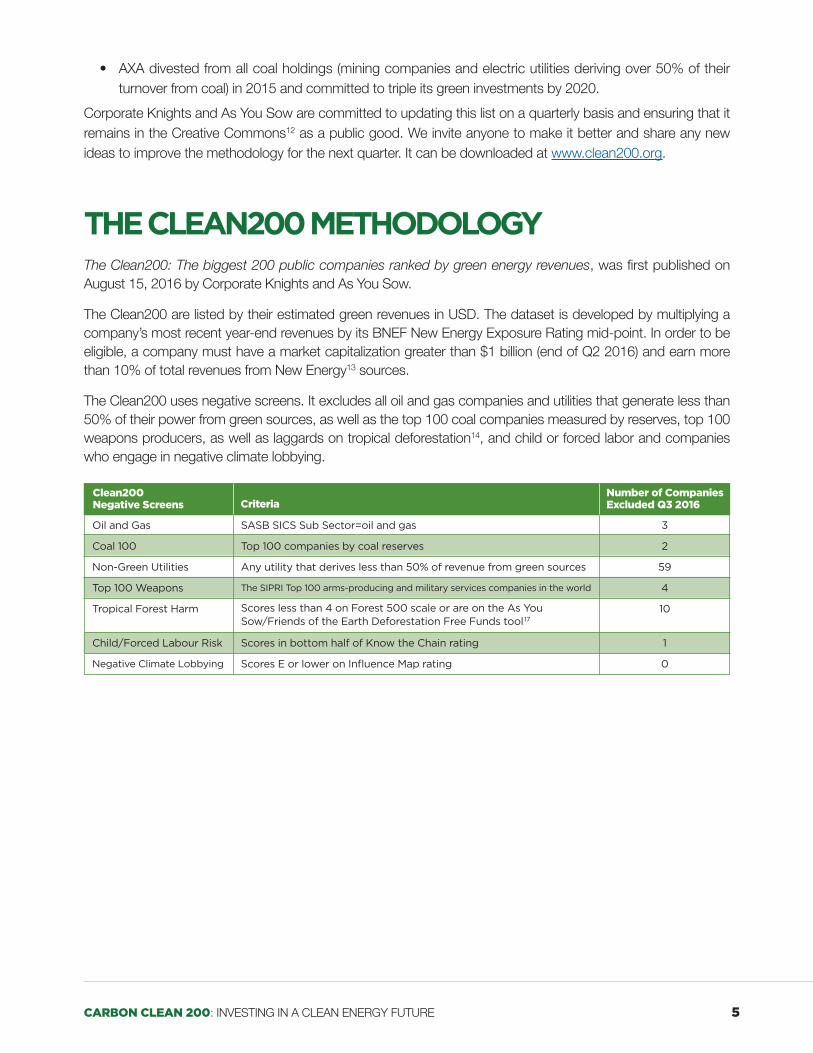
The Clean200 uses negative screens. It excludes all oil and gas companies and utilities that generate less than
50% of their power from green sources, as well as the top 100 coal companies measured by reserves, top 100
weapons producers, as well as laggards on tropical deforestation14, and child or forced labor and companies
who engage in negative climate lobbying.
Oil and Gas
Coal 100
Clean200 Negative Screens Criteria
3
2
Non-Green Utilities 59
Top 100 Weapons 4
Number of Companies Excluded Q3 2016
Tropical Forest Harm 10
Child/Forced Labour Risk 1
Negative Climate Lobbying
SASB SICS Sub Sector=oil and gas
Top 100 companies by coal reserves
Any utility that derives less than 50% of revenue from green sources
The SIPRI Top 100 arms-producing and military services companies in the world
Scores less than 4 on Forest 500 scale or are on the As YouSow/Friends of the Earth Deforestation Free Funds tool17
Scores in bottom half of Know the Chain rating
Scores E or lower on Influence Map rating 0

CARBON CLEAN 200: INvESTING IN A CLEAN ENERGY FUTURE 6
THE CLEAN200 LIST AUGUST 15, 2016
Rank Name Rank Name
1 TOYOTA MOTOR
2 SIEMENS AG-REG
3 JOHNSON CONTROLS
4 SCHNEIDER ELECTR
5 PANASONIC CORP
6 EMERSON ELEC CO
7 VESTAS WIND SYST+
8 PHILIPS LIGHTING+
9 ABB LTD-REG
10 KONINKLIJKE PHIL
11 DONG ENERGY A/S
12 UMICORE
13 XINJIANG GOLD-A+
14 EATON CORP PLC
15 SHARP CORP
16 BOMBARDIER INC-B
17 TESLA MOTORS+
18 GAMESA+
19 FIRST SOLAR INC+
20 HELLA KGAA HUECK
21 ANDRITZ AG
22 GCL-POLY ENERGY+
23 SAMSUNG SDI CO
24 DOOSAN HEAVY
25 CHINA LONGYUAN-H+
26 SVENSKA CELL-B
27 KINGSPAN GROUP+
28 SPIE SA
29 TBEA CO LTD-A
30 WACKER CHEMIE AG
31 BYD CO LTD-H
32 KYOCERA CORP
33 TE CONNECTIVITY
34 ACUITY BRANDS+
35 NORDEX SE+
36 OWENS CORNING
37 HYOSUNG CORP
38 ROCKWOOL INTL-B+
39 SHIN-ETSU CHEM
40 CHINA AGRI-INDUS
41 NIDEC CORP
42 APPLIED MATERIAL
43 CHINA SHIPBUIL-A
44 REPUBLIC SVCS
45 LS CORP
46 EBARA CORP
47 SUMITOMO FOREST
48 ITRON INC+
+ Majority of Revenues Derived from “Clean Energy” as defined by BNEF.

Rank Name Rank Name
49 PRYSMIAN SPA
50 BORGWARNER INC
51 HANWHA Q CEL-ADR+
52 EDP RENOVAVEIS S+
53 QUANTA SERVICES
54 STANLEY ELEC CO
55 COVANTA HOLDING+
56 CREE INC+
57 BROOKFIELD RENEW+
58 HANWHA CHEM CORP
59 SUEDZUCKER AG
60 SUNPOWER CORP+
61 NIBE INDUSTRIE-B+
62 CHINA HIGH-SPEED+
63 DIC CORP
64 EMCOR GROUP INC
65 INFINEON TECH
66 XIANGTAN ELEC-A+
67 SUZLON ENERGY+
68 DELTA ELECT INC
69 OSRAM LICHT AG
70 NXP SEMICONDUCTO
71 DONGFANG ELECT-A
72 SMITH (A.O.)CORP
73 HITACHI HIGH TEC
74 HUANENG RENEWA-H+
75 XJ ELECTRIC-A+
76 SMA SOLAR TECHNO+
77 CHINA EVERBR INT+
78 OCI CO LTD
79 GCL SYSTEM INT-A+
80 HAREON SOLAR T-A+
81 ANDERSONS INC
82 ZHONGLI SCIENC-A
83 XIAN LONGI SIL-A+
84 ZHEJIANG CHINT-A
85 KINDEN CORP
86 BHARAT HEAVY ELE
87 ARCADIS NV
88 TOFAS
89 SAFT GROUPE SA+
90 RISEN ENERGY-A+
91 REGAL BELOIT COR
92 ATLANTICA YIELD+
93 EGING PHOTOVOL-A+
94 COMFORT SYSTEMS
95 ANALOG DEVICES
96 SANAN OPTOELEC-A+
97 ENERGY DEVELOPME+
98 NARI TECHNOLOG-A
99 VALMET OYJ
100 SUNGROW POWER -A+
CARBON CLEAN 200: INvESTING IN A CLEAN ENERGY FUTURE 7
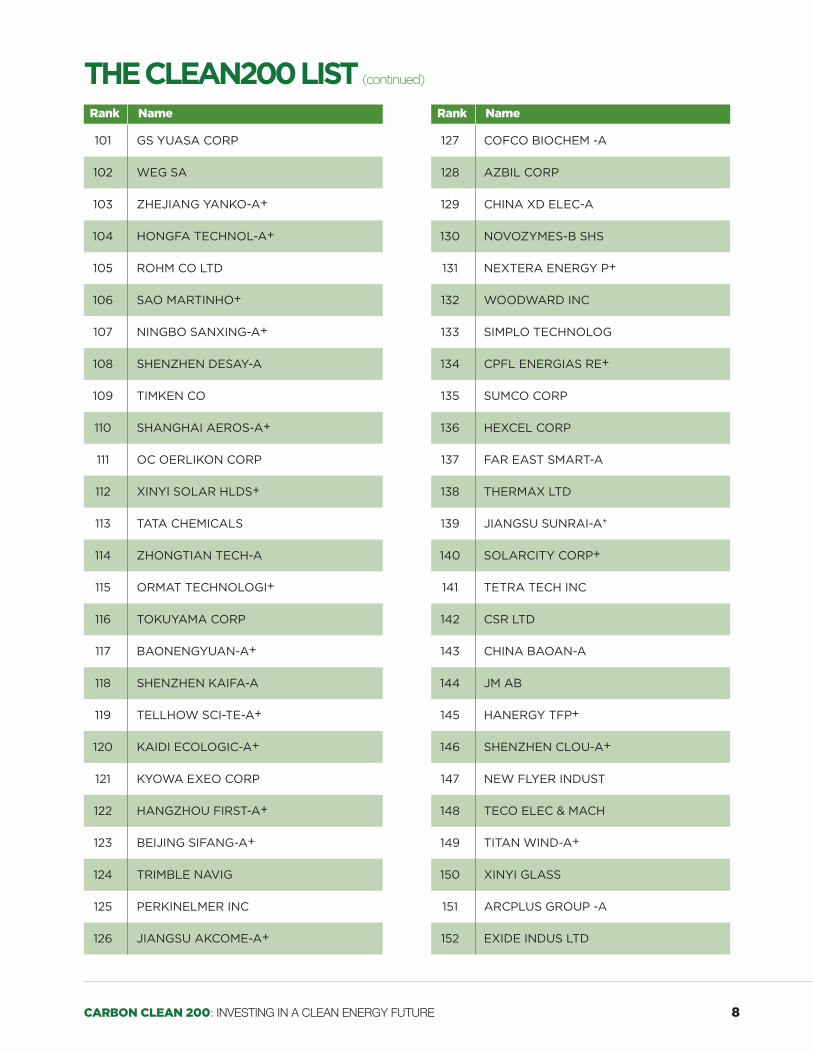
THE CLEAN200 LIST (continued)
CARBON CLEAN 200: INvESTING IN A CLEAN ENERGY FUTURE 8
Rank Name Rank Name
101 GS YUASA CORP
102 WEG SA
103 ZHEJIANG YANKO-A+
104 HONGFA TECHNOL-A+
105 ROHM CO LTD
106 SAO MARTINHO+
107 NINGBO SANXING-A+
108 SHENZHEN DESAY-A
109 TIMKEN CO
110 SHANGHAI AEROS-A+
111 OC OERLIKON CORP
112 XINYI SOLAR HLDS+
113 TATA CHEMICALS
114 ZHONGTIAN TECH-A
115 ORMAT TECHNOLOGI+
116 TOKUYAMA CORP
117 BAONENGYUAN-A+
118 SHENZHEN KAIFA-A
119 TELLHOW SCI-TE-A+
120 KAIDI ECOLOGIC-A+
121 KYOWA EXEO CORP
122 HANGZHOU FIRST-A+
123 BEIJING SIFANG-A+
124 TRIMBLE NAVIG
125 PERKINELMER INC
126 JIANGSU AKCOME-A+
127 COFCO BIOCHEM -A
128 AZBIL CORP
129 CHINA XD ELEC-A
130 NOVOZYMES-B SHS
131 NEXTERA ENERGY P+
132 WOODWARD INC
133 SIMPLO TECHNOLOG
134 CPFL ENERGIAS RE+
135 SUMCO CORP
136 HEXCEL CORP
137 FAR EAST SMART-A
138 THERMAX LTD
139 JIANGSU SUNRAI-A+
140 SOLARCITY CORP+
141 TETRA TECH INC
142 CSR LTD
143 CHINA BAOAN-A
144 JM AB
145 HANERGY TFP+
146 SHENZHEN CLOU-A+
147 NEW FLYER INDUST
148 TECO ELEC & MACH
149 TITAN WIND-A+
150 XINYI GLASS
151 ARCPLUS GROUP -A
152 EXIDE INDUS LTD
THE CLEAN200 LIST (continued)

CARBON CLEAN 200: INvESTING IN A CLEAN ENERGY FUTURE 9
Rank Name Rank Name
153 PATTERN ENER+
154 IDFC LTD
155 SUZHOU DONGSHA-A
156 DELTA ELEC THAI
157 FAIRCHILD SEMICO
158 HENGDIAN DMEGC-A
159 DIALOG SEMICOND
160 SWECO AB-B
161 SHENZHEN JIAWE-A+
162 GUANGDONG EAST-A
163 BEIJING NEW BU-A
164 ENERGY ABSOLUTE+
165 HAVELLS INDIA
166 CSG HOLDING CO-B
167 ESCO TECH INC
168 ZHONGTONG BUS-A
169 GUANGZHOU HONG-A+
170 BEIJING JINGYU-A+
171 HITACHI CAPITAL
172 GIBRALTAR INDUST
173 CHINA NORTHERN-A
174 FOSHAN ELEC-B
175 APOGEE ENTERPR
176 SINOVEL WIND-A+
177 SCHWEITER TEC-BR
178 CECEP WIND POW-A+
179 NISSIN ELECTRIC
180 ZHEJIANG DUN'A-A
181 CHINA SHIPBUIL-A
182 SHENZHEN HEMEI-A+
183 GENTHERM INC
184 INNERGEX RENEWAB+
185 UNIVERSAL DISPLA+
186 ZHUZHOU KIBING-A
187 TRANSALTA RENEWA+
188 ZHEJIANG NARAD-A
189 TONGYU HEAVY-A
190 HUNAN CORUN NE-A+
191 DO-FLUORIDE-A
192 ASM INTL NV
193 MONOLITHIC POWER
194 HUAYI ELECTRIC-A
195 SIEYUAN ELECTR-A
196 RONGXIN POWER -A
197 DONGGUAN KINGS-A+
198 TERRAFORM POWE-A+
199 GUANGDONG CHAN-A
200 QINGDAO TGOOD-A
THE CLEAN200 LIST (continued)

CARBON CLEAN 200: INvESTING IN A CLEAN ENERGY FUTURE 10
DISCLAIMERThe aggregated data comprising the Clean200™ represents a snapshot of the top-ranked “clean” companies as measuredby total green energy revenue based on a methodology developed by Corporate Knights and As You Sow from data in theBloomberg New Energy Finance database. The list should not be considered current or complete, or a substitute for financialdata provided by a licensed financial advisor. Estimation methodologies are subject to limitations in modelling andmeasurement.
The information provided in the Clean200 and in this report is provided “AS IS” without warranty of any kind. CorporateKnights and As You Sow each makes no representations and provides no warranties regarding any information or opinionsprovided herein, including, but not limited to, the advisability of investing in any particular company or investment fund orother vehicle. While we have obtained information believed to be objectively reliable, neither As You Sow nor CorporateKnights, or any of each of their employees, officers, directors, trustees, or agents, shall be responsible or liable, directly orindirectly, for any damage or loss caused or alleged to be caused by or in connection with use of or reliance on any informationcontained herein, including, but not limited to, lost profits or punitive or consequential damages. Past performance is notindicative of future returns.
As You Sow and Corporate Knights do not provide investment, financial planning, legal or tax advice. We are neither licensednor qualified to provide any such advice. The content of our programming, publications and presentations is provided forinformational and educational purposes only, and should not be considered as information sufficient upon which to baseany decisions on investing, purchases, sales, trades, or any other investment transactions. We do not express an opinionon the future or expected value of any security or other interest and do not explicitly or implicitly recommend or suggest aninvestment strategy of any kind.
Our events, websites, and promotional materials may contain external links to other resources, and may contain commentsor statements by individuals who do not represent As You Sow or Corporate Knights. As You Sow and Corporate Knightshave no control over, and assume no responsibility for, the content, privacy policies, or practices of any third party websitesor services that you may access as a result of our programming. As You Sow and Corporate Knights shall not be responsibleor liable, directly or indirectly, for any damage or loss caused or alleged to be caused by or in connection with use of orreliance on any such content, goods or services available on or through any such websites or services.
Copyright © 2016 As You Sow and Corporate Knights. All rights reserved.
ENDNOTES1 http://www.carbontracker.org/report/carbon-bubble/
2 http://www.earth-policy.org/books/tgt
3 http://www.bankofengland.co.uk/publications/Pages/speeches/2015/844.aspx
4 https://www.americanprogress.org/issues/green/news/2007/05/23/3044/change-the-rules/
5 https://www.iea.org/publications/freepublications/publication/CO2EmissionsFromFuelCombustionHighlights2015.pdf
6 https://www2.deloitte.com/content/dam/Deloitte/ro/Documents/energy-resources/us-er-crude-downturn-2016.pdf
7 http://www.asyousow.org/ays_report/unconventional-risks-the-growing-uncertainty-of-oil-investments/
8 http://about.bnef.com/press-releases/electric-vehicles-to-be-35-of-global-new-car-sales-by-2040/
9 http://www.mckinsey.com/industries/oil-and-gas/our-insights/is-peak-oil-demand-in-sight
10 http://www.bloomberg.com/features/2016-ev-oil-crisis/
11 http://w2.vatican.va/content/francesco/en/encyclicals/documents/papa-francesco_20150524_enciclica-laudato-si.html
12 https://creativecommons.org/
13 Bloomberg New Energy Finance’s estimate of the percent of an organization’s value that is attributable to its activities in renewable energy,energy smart technologies, carbon capture and storage (CCS), and carbon markets. To arrive at its estimate, Bloomberg New Energy Financeassesses an organization’s sectors and subactivities within these clean energy areas, and then calculates an estimate using reportedsegmented revenues (as the preferred metric), along with any other available metrics such as segmented Earnings Before Interest, Taxes,Depreciation and Amortization (EBITDA), GWh breakdown of energy production and megawatt breakdown of generation assets.
Bloomberg New Energy Finance’s exposure estimate is presented as one of these units:
A1 Main driver (50-100% of value) 50 to 100% of the organisation’s value is estimated to derive from this activity
A2 Considerable (25-49% of value) 25 to 49% of the organisation’s value is estimated to derive from this activity
A3 Moderate (10-24% of value) 10 to 24% of the organisation’s value is estimated to derive from this activity
A4 Minor (<10% of value) Less than 10% of the organisation’s value is estimated to derive from this activity
14 www.deforestationfreefunds.org

CARBON CLEAN 200: INvESTING IN A CLEAN ENERGY FUTURE 11
APPENDIX: Clean 200 vs Carbon Undergound 200 vs S&P 1200Performance Analysis by KKB Research and Development1
Backtest Methodology:To calculate the performance of the Carbon Underground 200 versus the Clean200 versus the S&P 1200, a ‘snapshot intime’ analysis was used consisting of the current constituents of the Clean200 (July 1, 2016), S&P 1200 (July 1, 2016) andthe most recent publicly available list of the Carbon Underground 200 (May 15, 2015). The ‘snapshot in time’ analysis wasnecessitated due to the absence of historical data series for Bloomberg’s BNEF New Energy Exposure field. All three listswere equally weighted and re-balanced quarterly from January 1, 2006 to July 1, 2016.2 Returns were calculated usingBloomberg monthly total returns including gross dividends for each security. Rebalancing takes effect immediately after therebalancing date. A ‘snapshot in time analysis’ based on a static list introduces a survivorship bias. Survivorship bias can bepresent when stocks which do not currently exist (because they have failed, for example) are excluded from the historicalanalysis. This bias can result in the overestimation of past returns.
The Clean200 list significantly outperformed the Carbon Underground 200 and the S&P 1200 list. This outperformance islargely driven by the allocation effect to high performing companies from China and Hong Kong SAR. Companies from Chinaor Hong Kong SAR make up 36.5% of the Clean200 versus just 1.8% for the S&P 1200. The top ten companies by cumulativereturn in the Clean200 list all hail from China. The returns of Clean200 ex-China and Hong Kong SAR were lower, but still
superior to the S&P 1200 and Carbon Underground 200.
As the chart below illustrates, the Clean200 outperformed the S&P 1200 andCarbon Underground 200 in 7 of 11 time periods. It is interesting to note theoutperformance of the Carbon Underground 200 in the first half of 2016,coinciding with a period of oil price increases. The tracking error of theClean200 versus S&P 1200 was 13.45% and the information ratio for theClean200 versus S&P 1200 was 0.75.
200620072008200920102011201220132014201520163
19.70%110.70%-43.50%99.90%44.50%-12.60%-1.20%0.60%
-22.40%-38.30%29.30%
Calendar Year Returns (simulatedhistorical performance using static list of current constituents)
S&P 1200CU20046%
89.10%-43.10%110.20%27.80%-24%9.80%
44.50%15%
24.80%-0.20%
29%15.30%
-36.50%51.70%22.40%-4.20%22.90%30.10%6.80%-1.10%2.60%
Clean200
Average Annualized ReturnsTotal Cumulative Return in %Annualized VolatilityAnnualized Sharpe Ratio (Rf=0%)Median Cumulative Return
7.84%121%
29.43%0.266491
-10%
S&P 1200CU20021.82%629%
24.05%0.8656231
106%
10.73%192%17.78%
0.6038526103%
Clean200
Carbon Clean 200Initial list of securities prepared on: July 1, 2016
Starting Universe: Bloomberg BNEF NewEnergy Revenue Exposure Coverage=6690publicly listed companies.
Methodology: The Clean200™ identifies the200 largest public companies based on totalestimate clean energy revenues, excludingcompanies which fail social and environmentalscreens.
Carbon Underground 200Initial list of securities prepared on: May 15, 2015 (most recent publicly available list at time of analysis).
Starting Universe: Fossil Free Indexes’ master database of over 750 current and past publicly-listed companies.
Methodology: The Carbon Underground 200™ identifies the 100 largest public coal and 100 largest public oil and gasreserve owners based on the potential CO2 emissions of their reported reserves.
S&P 1200Initial list of securities prepared on: July 1, 2016
Starting Universe: The S&P Global 1200 provides exposure to the global equity market, capturing approximately 70% ofglobal market capitalization.
Methodology: The S&P 1200 is constructed as a composite of 7 headline indices, many of which are accepted leaders intheir regions. These include the S&P 500® (US), S&P Europe 350, S&P TOPIX 150 (Japan), S&P/TSX 60 (Canada),S&P/ASX All Australian 50, S&P Asia 50 and S&P Latin America 40.
1 www.kkb.io
2 New firms were added on quarterly rebalancing as they came into existence. Note, all lists have significant survivorship bias.
3 2016 returns as of July 1, 2016
1. SANAN OPTOELEC-A2. HANERGY TFP3. CHINA NORTHERN-A4. HUNAN CORUN NE-A5. CHINA EVERBR INT6. ZHONGTONG BUS-A7. ARCPLUS GROUP -A8. ZHONGTIAN TECH-A9. BYD CO LTD-H10. SHENZHEN DESAY-A
6991%3457%3188%2686%2417%2262%1668%1608%1436%1311%
Top 10 Securities Cumulative Return (over testing period): Clean200CountryTotal ReturnCompany
Information TechnologyInformation TechnologyMaterialsIndustrialsIndustrialsIndustrialsMaterialsIndustrialsConsumer DiscretionaryIndustrials
ChinaChinaChinaChinaChinaChinaChinaChinaChinaChina
GIS Sector

1611 Telegraph Ave., Ste. 1450 • Oakland, CA 94612 • 510.735.8158
www.asyousow.org
© 2016 As You Sow and Corporate Knights. All Rights Reserved.
147 Spadina Ave, Ste. 206 • Toronto, ON M5v2L7 • 416.203.4674
www.corporateknights.com