investigation of the mechanisms of type-ii hot corrosion
TRANSCRIPT

Corrosion Science 80 (2014) 408–415
Contents lists available at ScienceDirect
Corrosion Science
journal homepage: www.elsevier .com/locate /corsc i
Investigation of the mechanisms of Type-II hot corrosion of superalloyCMSX-4
0010-938X/$ - see front matter � 2013 Elsevier Ltd. All rights reserved.http://dx.doi.org/10.1016/j.corsci.2013.11.048
⇑ Corresponding author. Address: Neil Armstrong Hall of Engineering, 701 WestStadium Avenue, West Lafayette, IN 47907, United States. Tel.: +1 765 494 6405;mobile: +1 765 418 4547.
E-mail address: [email protected] (R.W. Trice).
Pongpat Lortrakul, Rodney W. Trice ⇑, Kevin P. Trumble, Mysore A. DayanandaPurdue University, School of Materials Engineering, 701 West Stadium Avenue, West Lafayette, IN 47907, United States
a r t i c l e i n f o
Article history:Received 6 June 2013Accepted 29 November 2013Available online 4 December 2013
Keywords:A. SuperalloysC. Hot corrosionC. OxidationC. Sulfidation
a b s t r a c t
A microstructural investigation of Type-II hot corrosion was carried out on a single crystal Ni-basedsuperalloy (CMSX-4) pre-coated with Na2SO4 at 700 �C in a flowing O2–SO2–SO3 atmosphere. Corrosionoccurred by rapid dissolution of the alloy by molten sulfate eutectics, forming an outer layer rich in Coand Ni and an inner layer rich in Cr and Al. The outer layer transformed into mixed oxides of Co andNi, with concurrent evolution of the continuous S-rich inner layer. A multicomponent analysis providesinsight into diffusional interactions among Co, Ni, and S. Crystal orientation and microstructure effectswere also studied.
� 2013 Elsevier Ltd. All rights reserved.
1. Introduction
Uncoated areas of gas turbine blades, such as below the plat-form, can experience significant hot corrosion [1] in the presenceof sodium sulfate (Na2SO4) [2,3] at temperatures as low as�700 �C, particularly in marine applications. In this temperaturerange pits can form in the alloy, creating localized high stresses un-der service loading. Cracks can initiate and propagate from thesepits, causing premature failure [4]. Hot corrosion occurs on Ni-and Co-based superalloys, as well as on their Cr- and Al-rich coat-ing alloys, and under a range of different conditions [5–13].
There are two temperature-dependent regimes of Na2SO4 hotcorrosion as observed by peaks in corrosion rate, which are moreaggressive than in air exposure alone. These two corrosion ratepeaks occur at �900–1000 �C (Type-I) and �600–750 �C (Type-II).Type-I hot corrosion is associated with melting of Na2SO4
(Tm = 884 �C) and its interaction with the surface. In Type-II hotcorrosion, also known as low-temperature hot corrosion, molteneutectic Na2SO4–MSO4 (where M is Ni or Co) forms that acts to de-grade the surface. Type II corrosion does not proceed without aminimum SO3 partial pressure [6]. The present study focusesexclusively on Type II hot corrosion at 700 �C.
Type II hot corrosion mechanisms have been described by Pettitand Meier [5,6] and Luthra [7,8]. Na2SO4, which is applied to thesurface, is a solid phase at 700 �C. With sufficient pSO3
in the
atmosphere, sulfation of the NiO or CoO occurs to form NiSO4 orCoSO4. The minimum SO3 pressures to form NiSO4 and CoSO4 areapproximately 2 � 10�4 and 2 � 10�5 atm, respectively [8,14,15].Either compound will further react with excess Na2SO4 on thesurface to form the eutectic liquid Na2SO4–MSO4. The pureNa2SO4–CoSO4 and Na2SO4–NiSO4 liquid phases form at 576 �C[16,17] and 631 �C [18,19], respectively. Luthra [8] attributed thelow-temperature corrosion of cobalt-based alloys to the rapiddissolution of cobalt oxides by the sulfate liquid, preventing theformation of protective Cr2O3 or Al2O3.
An extensive search of the literature on Type II hot corrosionrevealed that the studies of Luthra [7,8] remain the most defin-itive work on the general mechanisms [6]. Using model Co–Cr,Co–Al, and Co–Cr–Al alloys, Luthra [8] described the Type II cor-rosion mechanism in Co-alloys as occurring by inward transportof S through the Na2SO4–CoSO4 liquid via S2O2�
7 generated at themolten sulfate surface by reaction with SO3 gas and SO2�
4 . CoOdissolution in the molten salt and counter-diffusion of Co ionswas proposed, with Co2+ moving outward and Co3+ inward.Although Al2O3 and Cr2O3 were predicted to be stable underthe conditions studied, they were not observed and dissolutionof the Co oxides (acidic fluxing) was proposed to prevent theformation of a protective Al2O3/Cr2O3 layer and sustain continu-ous attack.
Extending this mechanism to Ni-based alloys containing no Co,Luthra noted that comparatively little sulfation of NiO is predictedon thermodynamic grounds. Chiang, Pettit and Meier [5] proposedthat in Ni-based alloys the sulfidation/oxidation of Al and Cr occursunder Type II conditions, although in general the transitionfrom fluxing to stable sulfide/oxide formation is still not well

P. Lortrakul et al. / Corrosion Science 80 (2014) 408–415 409
understood [6,20]. Other recent reviews [10,13] do not indicate anymore detailed mechanistic studies on the Type II hot corrosion inthe Ni-based alloys and point out [21] the ‘‘dearth’’ of open litera-ture on effects of microstructure on Type II corrosion in general.
The majority of recent work (Type I or Type II) has been on Cr-and Al-rich coating alloys [21–28]. Most of the studies on c/c0
superalloys, which contain lower Cr and Al concentrations thanthe coating alloys, have primarily focused on Type I behavior andnot on microstructural mechanisms. An early study on the oxida-tion and hot corrosion of uncoated single crystal c/c0 superalloysincluded limited investigation of Type II hot corrosion specimenon one of the alloys [29]. Whereas more recent work on singlecrystal alloys [30,31] has focused on Type I behavior and/or coatedalloys, systematic studies of Type II hot corrosion on a single crys-tal nickel-based superalloy under well-defined condtions arelacking.
In the current study, an investigation of Type-II hot corrosion ofthe single crystal Ni-based superalloy CMSX-4 was conducted toexamine the microstructural development of the corrosion scale.Oriented samples of an as-cast crystal were pre-coated with Na2-
SO4 and tested at 700 �C in a flowing, controlled O2–SO2–SO3 atmo-sphere. The development of the corrosion scale and subscalemicrostructure was studied using scanning electron microscopy(SEM), energy dispersive spectroscopy (EDS) and X-ray diffraction(XRD).
2. Experimental procedure
All hot corrosion tests were performed on samples cut from asingle 75 mm � 50 mm � 12 mm slab of as-cast CMSX-4 crystalproduced by Alcoa Howmet Research Center, Whitehall, MI.The nominal composition of CMSX-4 (in wt.%) is: balance Ni,9.0 Co, 6.5 Cr, 6.5 Ta, 6.4 W, 5.6 Al, 3.0 Re, 1.0 Ti, 0.6 Mo and0.1 Hf. The slab was within the standard alloy specification, asconfirmed by EDS analysis conducted at Purdue University. Thealloy was intentionally used in the as-cast condition in orderto study the effects of microstructural features, including fineand coarse c0 precipitates (�1 lm) interdendritic c/c0 eutectic(�20–50 lm) and microporosity, as well as crystallographic ori-entation, on hot corrosion behavior. The crystallographic orienta-tion of the slab was confirmed using a Bruker GADDS X-raydiffractometer. The results showed that the longitudinal slabaxis (growth direction) varied less than 7� from the [001] direc-tion and the transverse directions less than 4� from [100] and[010].
Hot corrosion specimens, 10 mm � 10 mm � 10 mm, weremade by cutting with a low speed diamond saw. Specimens wereprepared to examine hot corrosion on (100) = (010) surfaces(transverse to the dendrite growth axis) and on (001) surfaces(growth direction). All surfaces were fine-ground with 600 gritSiC paper, then degreased with acetone, rinsed in deionized waterand dried at 150 �C. The Na2SO4 was applied by spraying a0.7 wt.% Na2SO4–water solution from a 25 cm distance onto theone surface of each sample being corroded. Details of this processare available in [32]. A dried salt layer of 0.3 ± 0.03 mg/cm2 wasachieved via several 10-s sprays, and optical microscopy revealeda fine distribution of the salt on the sample surface. The esti-mated thickness of the applied salt layer was �1.2 lm based ona Na2SO4 density of 2.66 g/cm3. Individual specimens were setin alumina dishes, placed in a 90 cm long tube furnace andheated to 700 ± 5 �C at a rate of 10 �C/min. A premixed gas of1000 ppm SO2 in O2 was flowed into the furnace at 50 cc/minat 1 atm pressure. A honeycomb Pt catalyst was placed at the en-trance of the furnace to accelerate the O2–SO2–SO3 equilibriumcondition, corresponding to pSO3
¼ 7:2� 10�4 atm, which wasgreater than the amount required to meet the minimum criteria
to create a Type-II hot corrosion environment for both Ni andCo [8,14].
Specimens were exposed at temperature for 3, 15, and 30 min,and 5 and 50 h, with a single salt application. Samples could notbe removed from the furnace immediately after the testing timeexpired. Rather, the SO2/O2 gas flow was stopped and the furnacewas turned off and allowed to cool naturally. Direct measurementsof the cooling transient indicated that within 30 min the speci-mens cooled to �600 �C, at which the relative rate of thermallyactivated processes would be negligible compared to 700 �C. Itshould be noted that the heating and cooling transients make theeffective reaction time longer than the hold times, although thisdifference is systematic and a precise determination of the reactionkinetics was not the aim of this study.
Following testing, corrosion products on the surface of the sam-ples were identified via XRD using a Bruker D8 Focus diffractome-ter. Samples were next mounted in a room-temperature curingepoxy, cross-sectioned, and polished using diamond abrasivesand 0.3-lm alumina suspension in the final step. Kerosene wasused as the carrier during polishing instead of water to preventthe loss of any water-soluble compounds in the scale. A final ultra-sonic cleaning step in ethanol was used to remove polishing resi-due in the surface crevices. In some specimens the structure ofthe alloy was revealed by immersion etching with a solution of33 vol.% deionized water, 33 vol.% acetic acid, 33 vol.% nitric acid,and 1 vol.% hydrofluoric acid for �5 s. Microstructure and EDSanalysis (point and area mapping) were performed on a PhillipFEI XL-40 SEM operated at 25 keV, with a thin-window detectorfor the standardized EDS analyses.
The volume fraction and size of the c0 precipitate structureswere measured on SEM images using standard stereology tech-niques [33,34]. The area fraction (AA) = volume fraction (VV) andnumber of c/c0 boundary intersections per unit length (PL) weredetermined with Image-J (version 1.44p). From these measure-ments the precipitate size as mean intercept length ðL3 ¼ 2VV=PLÞwas calculated.
3. Results
3.1. Scale development as a function of corrosion time
Cross-section micrographs of the scale development with timeare shown in Fig. 1. A 3-min test was selected to examine thevery early stages of hot corrosion (Fig. 1a), which resulted in a1–2 lm thick corrosion scale, including any residual sodium sul-fate. When the test duration was increased to 15 min two distinctlayers were observed, identified as outer and inner layers, asshown in Fig. 1b. The corrosion scale, consisting of these two lay-ers, increased with time as shown in Fig. 1c and d for samplestested for 5 h and 50 h, respectively. The scale produced after50 h testing spalled off from the CMSX-4 during cooling andwas mounted without the CMSX-4 substrate in Fig. 1d. A distinc-tive feature of the scale cross-sections is that the natural markerbetween the two layers is flat and sharp, in contrast to the freesurface and substrate interface with the inner layer, especiallyat longer times.
Variations of the thicknesses of the inner and outer layers, aswell as of the total corrosion scale as a function of time are pre-sented in Fig. 2. The data plotted are the average and standarddeviation of 50–100 systematic (equally spaced) measurementsof the inner and outer layers, and overall scale thickness for eachtest condition. The outer layer was usually thicker than the innerlayer. The growth of the scale exhibited approximate parabolickinetics, but then slowed, most likely reflecting the limiting effectof the single salt application.

Time Inner Layer Thickness,
µµµµm
Outer Layer Thickness,
µµµµm
Overall Thickness,
µµµµm15 min 3.2+/-0.9 3.5+/-0.4 6.7+/-1.3
5 h 9.3+/-2.3 12.1+/-4.4 21.4+/-5.950 h 14.3+/-0.9 17.2+/-1.5 31.2+/-2.4
0
5
10
15
20
25
30
35
0 10 20 30 40 50
Thic
knes
s, µ
m
Exposure Time, hours
Inner Layer
Outer Layer
Total Scale
Fig. 2. A plot of scale thickness for CMSX-4 specimens tested in Type II hotcorrosion versus exposure time. The inner and outer layers and total thickness ofthe scale are plotted. The data for 5 h are offset slightly in time for clarity.
(a) (b)
(c) (d)
Fig. 1. SEM images showing the development of Type-II hot corrosion scale as a function of test time. Each sample was coated with 0.3 mg/cm2 Na2SO4 prior to heating to700 �C for (a) 3 min, (b) 15 min, (c) 5 h and (d) 50 h.
410 P. Lortrakul et al. / Corrosion Science 80 (2014) 408–415
3.2. Reaction products as a function of corrosion time
EDS mapping performed on the 3-min specimen shown inFig. 1a did not compositionally distinguish the structure withinthe thin scale. The compositional distribution after 15- and 30-min tests (also not shown) were similar to the pattern in the 5 htest shown in Fig. 3, but the overall scale thickness in each wasthinner. As shown in Fig. 3, a Co-rich layer was observed to develop
above a continuous Ni-rich layer as part of the outer layer. EDSmaps of Cr and Al (see Fig. 3) indicated their distribution mainlyin the inner layer.
A point-by-point EDS line analysis was conducted for Co, Ni,and S, beginning in the outer layer, through the inner layer and intothe CMSX-4 alloy for a sample corroded for 5 h. These results areshown in Fig. 4, where xo represents the original uncorroded sur-face of the base alloy, xI the interface between the outer and innerlayers and xII the interface between the inner layer and the base al-loy. After 5 h of hot corrosion, xo, xI and xII were 8.9 lm, 10.6 lm,and 22.3 lm, respectively. The concentration of Co, beginning inthe original alloy at �8 at.%, decreases in the inner layer and thenrises significantly over the last 2–3 lm in the outer layer, consis-tent with the Co EDS map shown in Fig. 3. The concentration ofNi (Fig. 4b) decreases in the inner layer, but rises in the outer layer,before decreasing near the external surface. The S concentrationprofile after 5 h (Fig. 4c) exhibits a higher level in the inner layerthan the outer layer, consistent with Fig. 5, as well as distinct Senrichment near the two interfaces.
When the exposure time was increased to 50 h, discrete Co-richregions (see Fig. 5) replaced the continuous Co-rich layer observedafter a 5 h test (Fig. 3). Like the EDS concentration plot for S after5 h of hot corrosion (see Fig. 4c), the S is concentrated at the inter-faces xI and xII, with less S found in the middle of the inner layer.Whereas, Cr and Al are localized in the inner layer, similar to the5 h condition shown in Fig. 3.
XRD of the surfaces after hot corrosion was used to identify thevarious reaction products after 30 min, 5 h and 50 h testing. The re-sults are presented in Fig. 6. After 30 min, NiSO4, a reaction productof Na2SO4 and NiO, was detected. NiO was also shown to be present

Cr SAl
20 m
iNoC
Fig. 3. SEM image of the scale after 5 h of Type II hot corrosion and the corresponding EDS maps for Co, Ni, Al, Cr, and S. The white line indicates the original surface.
0
10
20
30
40
50
Atom
ic %
of C
obal
t
Distance, x, µm
xo
xI
xII
(a)
0
20
40
60
80
100
Atom
ic %
of N
icke
l
Distance, x, µm
xo
xI
xII
(b)
0
10
20
30
40
50
0 5 10 15 20 25 0 5 10 15 20 25 0 5 10 15 20 25
Atom
ic %
of S
ulfu
r
Distance, x, µm
xo
xI
xII
(c)
Fig. 4. EDS plots for (a) Co, (b) Ni and (c) S versus distance after 5 h of Type II hot corrosion. Zero distance represents the surface of the corroded specimen.
NiS
Co
20 mµµ
Fig. 5. SEM images of the scale after 50 h of Type II hot corrosion and thecorresponding EDS maps for Co, S, and Ni. Not shown are the EDS maps for Al andCr, which remained concentrated in the inner layer.
Fig. 6. X-ray diffraction results of the surface scale after 30 min, 5 h and 50 h of hotcorrosion testing.
P. Lortrakul et al. / Corrosion Science 80 (2014) 408–415 411
[35]. As shown in Fig. 6, after 5 h of testing the Na2SO4 disappearedand was replaced by CoO and NiO peaks. The CoO and NiO have thesame crystal structure (NaCl-type) with lattice parameters of 0.426

2 m
Residual ’ cuboids
CMSX-4
Outer Layer
Inner Layer
µµ
Fig. 7. SEM images after 15 min showing the presence of residual c0 cuboidstructure in the inner layer and their progressive dissolution from the externalsurface.
(a)
(b) (c)
Fig. 8. (a) SEM micrograph of the CMSX-4 as-cast microstructure showing aninterdendritic (region a) and dendrite core (region b). The surface was the (010)plane. Images (b and c) show higher magnifications of the interdendritic anddendrite core zones, respectively.
412 P. Lortrakul et al. / Corrosion Science 80 (2014) 408–415
and 0.418 nm, respectively. The diffraction peaks associated withCoO, with a slightly larger lattice parameter, always appear tothe left of the NiO diffraction peaks in Fig. 6. For 5 h of hot corro-sion testing, the CoO peaks were all less intense than the NiOpeaks, and were shifted slightly to the right of their expected 2Hpositions. This suggests that the CoO contains some NiO as well. In-deed, CoO does have considerable solubility for NiO at 700 �C [36].After 5 h of testing there were also numerous low-intensity peaks,most likely attributed to sulfides. However, CoS was the most likelypeak identified [35]. A more detailed microscopy investigationsuch as transmission electron microscopy would be required tomore precisely identify the compounds occurring for this testingcondition.
The 50-h hot corrosion results are also shown in Fig. 6. Thesame closely spaced peaks from CoO and NiO as after 5 h are evi-dent in the XRD spectra. However, the CoO peaks are now of great-er intensity than the NiO peaks. No peaks associated with Ni or Cosulfides could be verified.
3.3. c/c0 Microstructure after corrosion
Fig. 7 shows a polished and etched cross-section after 15 min ofhot corrosion testing. The c0 cuboidal precipitate morphology isstill partially visible within the inner layer of the scale. Similarobservations were made for both the 5 h and the 50 h tests. Thepresence of the residual c0 cuboids in a region of the sample thathas clearly been corroded indicates a slower corrosion rate for thisphase compared to the c matrix. Thus, the c matrix, which is pri-marily composed of Ni, Co, and Cr, appears to be the first phase dis-solved by the eutectic liquid. However, with further time the c0
cuboids also corrode completely. Microanalysis by EDS in the innerscale regions containing the residual c0 cuboids indicated high con-centrations of W and Ta (�20 wt.%), although there is some uncer-tainty due to peak overlap for these elements.
3.4. Effect of CMSX-4 microstructure on hot corrosion
The characteristic dendritic structure of the as-cast CMSX-4 isshown in Fig. 8a. This surface is the (010) plane or side surface rel-ative to crystal growth direction and plan view of the surfaces onwhich most of the corrosion tests were conducted. Prominent fea-tures are the eutectic c/c0 pools, which form in the interdendriticregions in the last stage of local solidification. The occasionalsolidification shrinkage pore is also present in these regions. Theinterdendritic regions (region a in Fig. 8a) also exhibit coarser
c0 precipitates, which form on cooling in the solid state, comparedto the dendrite cores (region b). Fig. 8b and c are higher magnifica-tion images that compare the coarse and fine c0 precipitatestructures. Quantitative microstructural analysis showed that boththe size and volume fraction of the c0 precipitates were larger inthe interdendritic regions, with mean intercept sizes (L3) of1.28 ± 0.14 and 0.56 ± 0.05 and volume fractions (VV) of0.77 ± 0.01 and 0.65 ± 0.01, respectively, compared to in the den-drite cores.
Elemental analysis by EDS (not shown) was used to detect dif-ferences in the distribution of alloying elements in the interden-dritic and dendrite core regions. The Cr was nearly all depletedand the Co partially depleted in the interdendritic regions. How-ever, the Ni, Al, Ta, and Ti concentrations in the interdendriticzones were slightly higher than those in the dendrite cores. Similarcompositional differences in the interdendritic and dendrite coreswere observed when viewing the (001) plane of the sample (i.e.,viewing in the crystal (dendrite) growth direction).
Direct comparison of hot corrosion in the interdendritic regionsand dendrite cores after 5 h is shown in Fig. 9. At every locationwhere the interdendritic regions intersect the surface, and thusinteract directly with corrodent, a small upward perturbationwas observed in the inner layer. Such regions are indicated by ar-rows in Fig. 9a and at higher magnification in Fig. 9b. The observa-tions indicate that these regions corroded less than in the dendritecore regions where the c0 precipitates are of smaller volume frac-tion and size. If preferred reaction with Co is initially driving theformation of the scale, it is not unreasonable to expect that theinterdendritic region, containing less Co, would form a thinnerscale. In addition, with 12 vol.% more c0 precipitate in the interden-dritic regions, less scale formation would be expected, as the c ma-trix appears to corrode first based on the observations in Fig. 7.Likewise, the larger cuboids of c0 in the interdendritic regions im-ply smaller c channels for the molten liquids to travel through dur-ing hot corrosion. Ultimately, further study is required to delineatethese mechanisms.
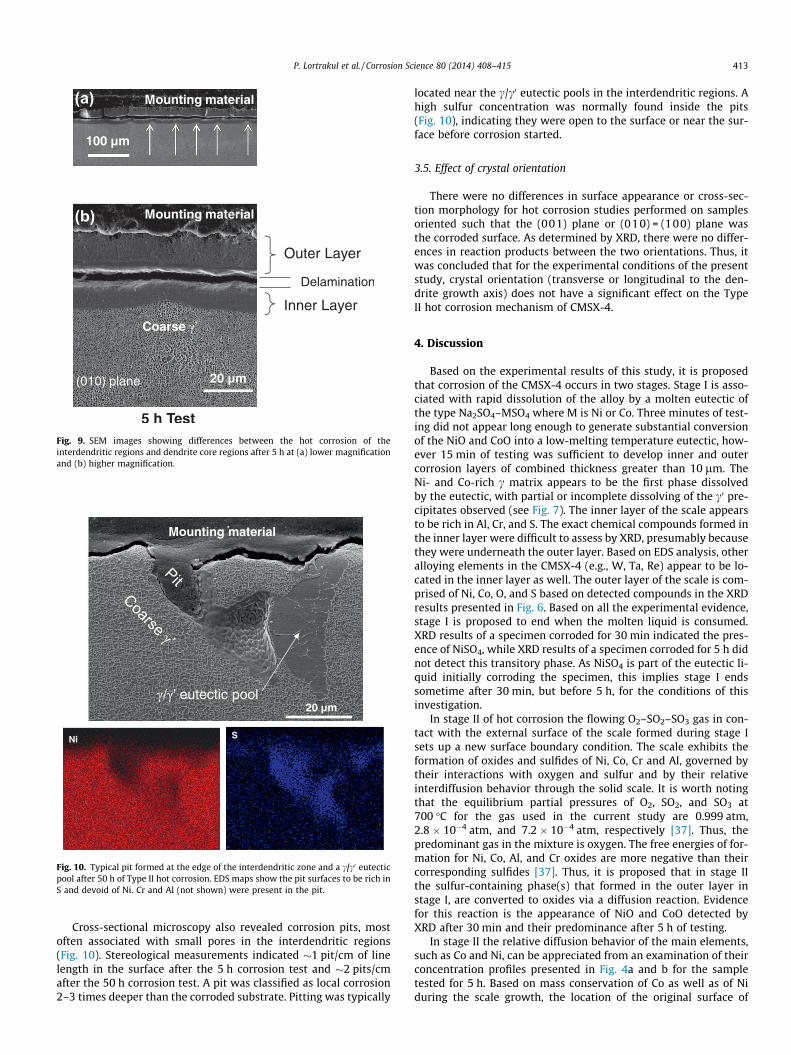
Fig. 10. Typical pit formed at the edge of the interdendritic zone and a c/c0 eutecticpool after 50 h of Type II hot corrosion. EDS maps show the pit surfaces to be rich inS and devoid of Ni. Cr and Al (not shown) were present in the pit.
(a)
(b)
Fig. 9. SEM images showing differences between the hot corrosion of theinterdendritic regions and dendrite core regions after 5 h at (a) lower magnificationand (b) higher magnification.
P. Lortrakul et al. / Corrosion Science 80 (2014) 408–415 413
Cross-sectional microscopy also revealed corrosion pits, mostoften associated with small pores in the interdendritic regions(Fig. 10). Stereological measurements indicated �1 pit/cm of linelength in the surface after the 5 h corrosion test and �2 pits/cmafter the 50 h corrosion test. A pit was classified as local corrosion2–3 times deeper than the corroded substrate. Pitting was typically
located near the c/c0 eutectic pools in the interdendritic regions. Ahigh sulfur concentration was normally found inside the pits(Fig. 10), indicating they were open to the surface or near the sur-face before corrosion started.
3.5. Effect of crystal orientation
There were no differences in surface appearance or cross-sec-tion morphology for hot corrosion studies performed on samplesoriented such that the (001) plane or (010) = (100) plane wasthe corroded surface. As determined by XRD, there were no differ-ences in reaction products between the two orientations. Thus, itwas concluded that for the experimental conditions of the presentstudy, crystal orientation (transverse or longitudinal to the den-drite growth axis) does not have a significant effect on the TypeII hot corrosion mechanism of CMSX-4.
4. Discussion
Based on the experimental results of this study, it is proposedthat corrosion of the CMSX-4 occurs in two stages. Stage I is asso-ciated with rapid dissolution of the alloy by a molten eutectic ofthe type Na2SO4–MSO4 where M is Ni or Co. Three minutes of test-ing did not appear long enough to generate substantial conversionof the NiO and CoO into a low-melting temperature eutectic, how-ever 15 min of testing was sufficient to develop inner and outercorrosion layers of combined thickness greater than 10 lm. TheNi- and Co-rich c matrix appears to be the first phase dissolvedby the eutectic, with partial or incomplete dissolving of the c0 pre-cipitates observed (see Fig. 7). The inner layer of the scale appearsto be rich in Al, Cr, and S. The exact chemical compounds formed inthe inner layer were difficult to assess by XRD, presumably becausethey were underneath the outer layer. Based on EDS analysis, otheralloying elements in the CMSX-4 (e.g., W, Ta, Re) appear to be lo-cated in the inner layer as well. The outer layer of the scale is com-prised of Ni, Co, O, and S based on detected compounds in the XRDresults presented in Fig. 6. Based on all the experimental evidence,stage I is proposed to end when the molten liquid is consumed.XRD results of a specimen corroded for 30 min indicated the pres-ence of NiSO4, while XRD results of a specimen corroded for 5 h didnot detect this transitory phase. As NiSO4 is part of the eutectic li-quid initially corroding the specimen, this implies stage I endssometime after 30 min, but before 5 h, for the conditions of thisinvestigation.
In stage II of hot corrosion the flowing O2–SO2–SO3 gas in con-tact with the external surface of the scale formed during stage Isets up a new surface boundary condition. The scale exhibits theformation of oxides and sulfides of Ni, Co, Cr and Al, governed bytheir interactions with oxygen and sulfur and by their relativeinterdiffusion behavior through the solid scale. It is worth notingthat the equilibrium partial pressures of O2, SO2, and SO3 at700 �C for the gas used in the current study are 0.999 atm,2.8 � 10�4 atm, and 7.2 � 10�4 atm, respectively [37]. Thus, thepredominant gas in the mixture is oxygen. The free energies of for-mation for Ni, Co, Al, and Cr oxides are more negative than theircorresponding sulfides [37]. Thus, it is proposed that in stage IIthe sulfur-containing phase(s) that formed in the outer layer instage I, are converted to oxides via a diffusion reaction. Evidencefor this reaction is the appearance of NiO and CoO detected byXRD after 30 min and their predominance after 5 h of testing.
In stage II the relative diffusion behavior of the main elements,such as Co and Ni, can be appreciated from an examination of theirconcentration profiles presented in Fig. 4a and b for the sampletested for 5 h. Based on mass conservation of Co as well as of Niduring the scale growth, the location of the original surface of
414 P. Lortrakul et al. / Corrosion Science 80 (2014) 408–415
the CMSX-4 was calculated and has been marked as xo at a distanceof 8.9 lm from the external surface (xs), as shown in Fig. 4a and b.The total scale thickness is about 22.3 lm and the interface xI be-tween the outer and inner layers of the scale is located at10.6 lm from xs. For these calculations the molar density, q (mo-les/m3), within the diffusion zone is assumed invariant with time.The interface between the CMSX-4 alloy and the inner layer of thescale is identified at xII. From the concentration profiles of the indi-vidual components, profiles of interdiffusion fluxes can be gener-ated on the basis of the relation [38,39]
eJ iðxÞ ¼12t
Z CiðxÞ
Cþi
ðx� xoÞdCi ði ¼ Co; Ni; etc:Þ ð1Þ
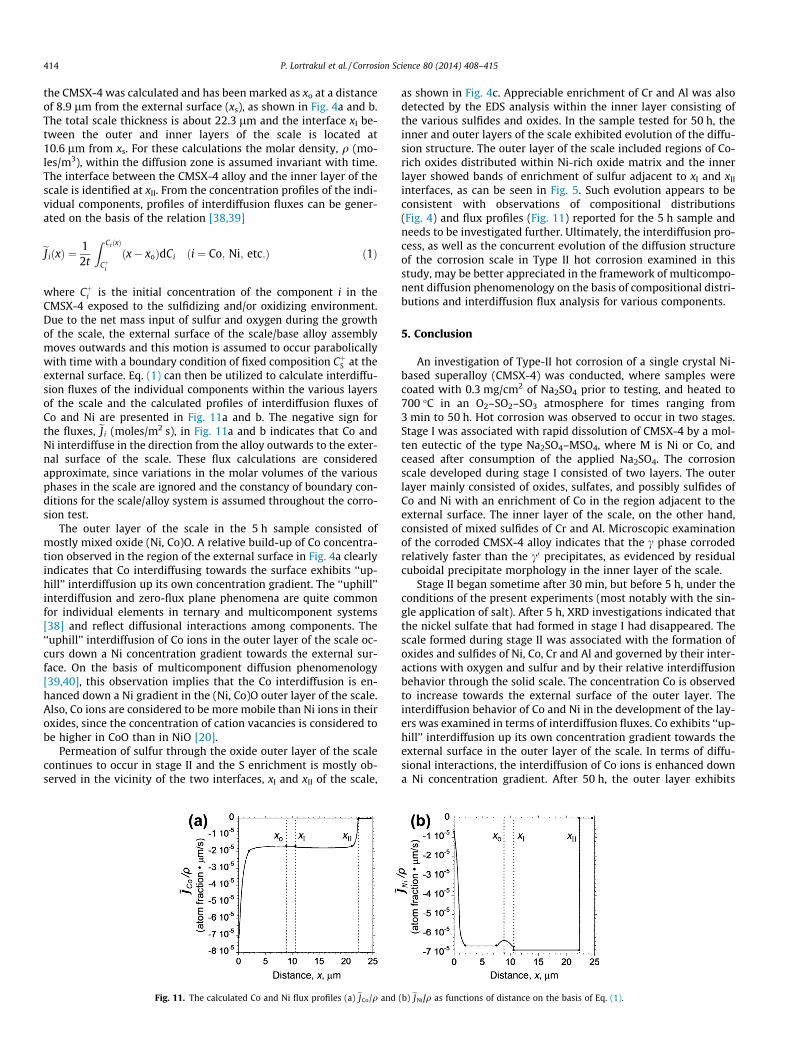
where Cþi is the initial concentration of the component i in theCMSX-4 exposed to the sulfidizing and/or oxidizing environment.Due to the net mass input of sulfur and oxygen during the growthof the scale, the external surface of the scale/base alloy assemblymoves outwards and this motion is assumed to occur parabolicallywith time with a boundary condition of fixed composition CþS at theexternal surface. Eq. (1) can then be utilized to calculate interdiffu-sion fluxes of the individual components within the various layersof the scale and the calculated profiles of interdiffusion fluxes ofCo and Ni are presented in Fig. 11a and b. The negative sign forthe fluxes, eJ i (moles/m2 s), in Fig. 11a and b indicates that Co andNi interdiffuse in the direction from the alloy outwards to the exter-nal surface of the scale. These flux calculations are consideredapproximate, since variations in the molar volumes of the variousphases in the scale are ignored and the constancy of boundary con-ditions for the scale/alloy system is assumed throughout the corro-sion test.
The outer layer of the scale in the 5 h sample consisted ofmostly mixed oxide (Ni, Co)O. A relative build-up of Co concentra-tion observed in the region of the external surface in Fig. 4a clearlyindicates that Co interdiffusing towards the surface exhibits ‘‘up-hill’’ interdiffusion up its own concentration gradient. The ‘‘uphill’’interdiffusion and zero-flux plane phenomena are quite commonfor individual elements in ternary and multicomponent systems[38] and reflect diffusional interactions among components. The‘‘uphill’’ interdiffusion of Co ions in the outer layer of the scale oc-curs down a Ni concentration gradient towards the external sur-face. On the basis of multicomponent diffusion phenomenology[39,40], this observation implies that the Co interdiffusion is en-hanced down a Ni gradient in the (Ni, Co)O outer layer of the scale.Also, Co ions are considered to be more mobile than Ni ions in theiroxides, since the concentration of cation vacancies is considered tobe higher in CoO than in NiO [20].
Permeation of sulfur through the oxide outer layer of the scalecontinues to occur in stage II and the S enrichment is mostly ob-served in the vicinity of the two interfaces, xI and xII of the scale,
Fig. 11. The calculated Co and Ni flux profiles (a) eJCo/q and
as shown in Fig. 4c. Appreciable enrichment of Cr and Al was alsodetected by the EDS analysis within the inner layer consisting ofthe various sulfides and oxides. In the sample tested for 50 h, theinner and outer layers of the scale exhibited evolution of the diffu-sion structure. The outer layer of the scale included regions of Co-rich oxides distributed within Ni-rich oxide matrix and the innerlayer showed bands of enrichment of sulfur adjacent to xI and xII
interfaces, as can be seen in Fig. 5. Such evolution appears to beconsistent with observations of compositional distributions(Fig. 4) and flux profiles (Fig. 11) reported for the 5 h sample andneeds to be investigated further. Ultimately, the interdiffusion pro-cess, as well as the concurrent evolution of the diffusion structureof the corrosion scale in Type II hot corrosion examined in thisstudy, may be better appreciated in the framework of multicompo-nent diffusion phenomenology on the basis of compositional distri-butions and interdiffusion flux analysis for various components.
5. Conclusion
An investigation of Type-II hot corrosion of a single crystal Ni-based superalloy (CMSX-4) was conducted, where samples werecoated with 0.3 mg/cm2 of Na2SO4 prior to testing, and heated to700 �C in an O2–SO2–SO3 atmosphere for times ranging from3 min to 50 h. Hot corrosion was observed to occur in two stages.Stage I was associated with rapid dissolution of CMSX-4 by a mol-ten eutectic of the type Na2SO4–MSO4, where M is Ni or Co, andceased after consumption of the applied Na2SO4. The corrosionscale developed during stage I consisted of two layers. The outerlayer mainly consisted of oxides, sulfates, and possibly sulfides ofCo and Ni with an enrichment of Co in the region adjacent to theexternal surface. The inner layer of the scale, on the other hand,consisted of mixed sulfides of Cr and Al. Microscopic examinationof the corroded CMSX-4 alloy indicates that the c phase corrodedrelatively faster than the c0 precipitates, as evidenced by residualcuboidal precipitate morphology in the inner layer of the scale.
Stage II began sometime after 30 min, but before 5 h, under theconditions of the present experiments (most notably with the sin-gle application of salt). After 5 h, XRD investigations indicated thatthe nickel sulfate that had formed in stage I had disappeared. Thescale formed during stage II was associated with the formation ofoxides and sulfides of Ni, Co, Cr and Al and governed by their inter-actions with oxygen and sulfur and by their relative interdiffusionbehavior through the solid scale. The concentration Co is observedto increase towards the external surface of the outer layer. Theinterdiffusion behavior of Co and Ni in the development of the lay-ers was examined in terms of interdiffusion fluxes. Co exhibits ‘‘up-hill’’ interdiffusion up its own concentration gradient towards theexternal surface in the outer layer of the scale. In terms of diffu-sional interactions, the interdiffusion of Co ions is enhanced downa Ni concentration gradient. After 50 h, the outer layer exhibits
(b) eJNi/q as functions of distance on the basis of Eq. (1).

P. Lortrakul et al. / Corrosion Science 80 (2014) 408–415 415
Co-rich oxides distributed within the Ni-rich oxide matrix. In theinner layer a relative enrichment of sulfur is observed in the vicin-ity of the outer layer/inner layer interface as well as at the innerlayer/CMSX-4 interface with lower sulfur concentrations observedbetween these two interfaces.
The bilayer corrosion mechanism characterized in this studydoes not appear to have been described previously in the literature.Based on the microstructural and microchemical observation ofthis study on CMSX-4, it should also be operative in other c/c0
superalloys.
Acknowledgements
The authors wish to thank Alcoa Howmet Research, Whitehall,MI, for providing the slab of CMSX-4 used in the present study. Fur-thermore, Dr. Lortrakul wishes to thank SCG-Chemicals of Thailandfor providing the scholarship to obtain a Ph.D. at PurdueUniversity.
References
[1] D.A. Shifler, High-Temperature Corrosion in Military systems, in Corrosion:Environments and Industries, ASM Handbook, vol. 13C, ASM International,Materials Park, OH, 2006. pp. 156–170.
[2] N. Eliaz, G. Shemesh, R.M. Latanision, Hot corrosion in gas turbine components,Eng. Fail. Anal. 9 (2002) 31–43.
[3] J.M. Gallardo, J.A. Rodriguez, E.J. Herrera, Failure of gas turbine blades, Wear252 (2002) 264–268.
[4] Alten F. Grandt Jr., Fundamentals of Structural Integrity: Damage TolerantDesign and Non Destructive Evaluation, Wiley, New York, 2004.
[5] K. T. Chiang, F. S. Pettit, G. H. Meier, Low temperature hot corrosion, in: R.A.Rapp (Ed.), High Temperature Corrosion, NACE-6, Houston, 1981, pp. 519–530.
[6] F. Pettit, Hot corrosion of metals and alloys, Oxid. Met. 76 (2011) 1–21.[7] K.L. Luthra, Low-temperature hot corrosion of cobalt-base alloys, Part I.
morphology of the reaction product, Metall. Trans. 13A (1982) 1843–1852.[8] K.L. Luthra, Low-temperature hot corrosion of cobalt-base alloys, Part II.
reaction mechanism, Metall. Trans. 13A (1982) 1853–1864.[9] J.A. Goebel, F.S. Petitt, Na2SO4-induced accelerated oxidation (hot corrosion) of
nickel, Metall. Trans. 1 (1970) 1943–1954.[10] G.H. Meier, A review of advances in high-temperature corrosion, Mater. Sci.
Eng. A120 (1989) 1–11.[11] D. Deb, S.R. Iyer, V.M. Radhakrishnan, A comparative study of oxidation and
hot corrosion of a cast nickel base superalloy in different corrosiveenvironments, Mater. Lett. 29 (1996) 19–23.
[12] R.A. Rapp, Hot corrosion of materials: a fluxing mechanism?, Corros Sci. 44(2002) 209–221.
[13] H. Singh, D. Puri, S. Prakash, An overview of Na2SO4 and/or V2O5 induced hotcorrosion of Fe- and Ni-based superalloys, Rev. Adv. Mater. Sci. 16 (2007) 27–50.
[14] K.P. Lillerud, P. Kofstad, Sulfate-induced hot corrosion of nickel, Oxid. Met. 21(1984) 233–270.
[15] K.L. Luthra, O.H. LeBlanc Jr., Low-temperature hot corrosion of Co–Cr–Al alloys,Mater. Sci. Eng. 87 (1987) 329–335.
[16] M. Durand-Charre, The Microstructure of Superalloys, CRC Press, Boca Raton,FL, 1997.
[17] K.A. Bol’shakov, P.I. Fedorov, Fig. 01120-System Na2SO4–NiSO4, Zh. Obshch.Khim. 26 (1956) 348–350.
[18] M.R. Joyce, X. Wu, P.A.S. Reed, The effect of environment and orientation onfatigue crack growth behavior of CMSX-4 nickel base single crystal at 650 �C,Mater. Lett. 58 (2004) 99–103.
[19] K.A. Bol’shakov, P.I. Fedorov, Fig. 01115-System Na2SO4–CoSO4, Zh. Obshch.Khim. 26 (1956) 348–350.
[20] N. Birks, G.H. Meier, F.S. Pettit, Introduction to the High TemperatureOxidation of Metals, second ed., Cambridge University Press, Cambridge, 2006.
[21] M.N. Task, B. Gleeson, F.S. Petitt, G.H. Meier, The effect of microstructure on theType II hot corrosion of Ni-base MCrAlY alloys, Oxid. Met. 80 (2013) 125–146.
[22] P. Knutsson, H. Lai, K. Stiller, A method for investigation of hot corrosion bygaseous Na2SO4, Corros. Sci. 73 (2013) 230–236.
[23] K. Zhang, M.M. Liu, S.L. Liu, C. Sun, F.H. Wang, Hot corrosion behavior of acobalt-base super-alloy K40S with and without NiCrAlYSi coating, Corros. Sci.53 (2011) 1990–1998.
[24] J. Ma, S.M. Jiang, J. Gong, C. Sun, Behavior and mechanism of alkali-sulphate-induced hot corrosion on composite coatings at 900 �C, Corros. Sci. 58 (2012)251–259.
[25] M. Qiao, C. Zhou, Hot corrosion behavior of Co modified NiAl coating on nickelbase superalloys, Corros. Sci. 63 (2012) 239–245.
[26] W.H. Lee, Oxidation and sulfidation of Ni3Al, Mater. Chem. Phys. 76 (2002) 26–37.
[27] W.H. Lee, Hot corrosion mechanism of intermetallic compound Ni3Al, Mater.Chem. Phys. 77 (2002) 86–96.
[28] A. Magdziarz, Z. Kalicka, Hot corrosion behavior of Ni3Al in sulphate-chloridemixture in the atmosphere, Corros. Sci. 49 (2007) 1869–1877.
[29] M. Levy, R. Huie, F. Petitt, Oxidation and hot corrosion of some advancedsuperalloys at 1300–2000 �F (704–1093 �C), Corrosion 45 (1989) 661–674.
[30] M. Li, X. Sun, W. Hu, H. Guan, S. Chen, Hot corrosion of a single crystal Ni-basesuperalloy by Na-salts at 900 �C, Oxid. Met. 65 (2006) 137–150.
[31] N.J. Simms, A. Encinas-Opopesa, J.J. Nicholls, Hot corrosion of coated anduncoated single crystal gas turbine materials, Mater. Corros. 59 (2008) 476–483.
[32] P. Lortrakul, Ph.D. Thesis, Purdue University, 2011.[33] K.J. Kurzydlowski, B. Ralph, The Quantitative Description of the Microstructure
of Material, CRC Press, New York, 1995.[34] E.E. Underwood, Quantitative Stereology, Addison Wesley, Reading, MA, 1970.[35] NiO: JCPDS 4–835; CoO: JCPDS 43–1004; CoS: JCPDS 25–1081.[36] R.J. Moore, J. White, Equilibrium relationships in the system NiO–CoO–O2, J.
Mater. Sci. 9 (1974) 1393–1400.[37] O. Kubaschewski, C.B. Alcock, Metallurgical Thermochemistry, fifth ed.,
Pergamon Press, Oxford, 1979.[38] M.A. Dayananda, C.W. Kim, Zero-flux planes and flux reversals in Cu–Ni–Zn
diffusion couples, Metall. Trans. 10A (1979) 1333–1339.[39] M.A. Dayananda, Diffusion in ternary alloys, in: Bornstein Landoldt (Ed.),
Diffusion in Solid Metals and Alloys, vol. 26, Springer-Verlag, Berlin, 1990.[40] M.A. Dayananda, Diffusion structures and diffusion paths in ternary systems-
selected unusual observations, Solid State Phenom. 72 (2000) 123–134.