electrochemical investigation of corrosion …
TRANSCRIPT
ELECTROCHEMICAL INVESTIGATION OF CORROSION RESISTANCE OF
WELDMENTS IN STEEL BRIDGES
A Thesis
Submitted to the Graduate Faculty
of the
North Dakota State University
of Agriculture and Applied Science
By
Qusay Adel Al-Kaseasbeh
In Partial Fulfillment of the Requirements
for the Degree of
MASTER OF SCIENCE
Major Department:
Civil and Environmental Engineering
November 2015
Fargo, North Dakota

North Dakota State University
Graduate School
Title ELECTROCHEMICAL INVESTIGATION OF CORROSION
RESISTANCE OF WELDMENTS IN STEEL BRIDGES
By
Qusay Adel Al-Kaseasbeh
The Supervisory Committee certifies that this disquisition complies with North Dakota State
University’s regulations and meets the accepted standards for the degree of
MASTER OF SCIENCE
SUPERVISORY COMMITTEE:
Dr. Zhibin Lin
Chair
Dr. Mija Yang
Dr. Fardad Azarmi
Dr. Yechun Wang
Approved:
11/18/2015 Dr. Dinesh Katti
Date Department Chair

iii
ABSTRACT
Welding is commonly used for connecting steel components in steel bridge fabrication
and construction. Welding processes change the microstructures, properties of surrounding steel
and its surface texture. In this study, an investigation of corrosion behavior of steel bridge welds
was performed under simulated corrosive environments in the laboratory. Four electrochemical
tests: a) open circuit potential, b) Rp/Ec Trend, c) electrochemical impedance spectroscopy and d)
potentiodynamic polarization, were identified and conducted to gain fundamentals to weldment
corrosion in two commonly used bridge steels (A572 and A588). In addition, three coating
systems (3-coat, Calcium sulfonate alkyd, and metallizing coating) in steel bridges were
deposited on the bridge steels. Test results revealed that the bridge steel welds exhibit higher
corrosion initiation over base metals, regardless the types of steel or coating. The protective
coating systems can delay the corrosion initiation at the welds, thus enhancing the corrosion
resistance of bridge steel welds.

iv
ACKNOWLEDGMENTS
I would like to express my deepest gratitude to my advisor Dr. Zhibin Lin for his
continuous encouragement, patience, and motivation. His guidance supported me in this research
and writing this thesis. I would also like to thank my committee member, Dr. Yechun Wang who
gave me a lot of support and suggestion. Many thanks also for my committee member, Dr.
Fardad Azarmi for his generous support and coating material supply, and Dr. Mijia Yang for his
motivation and encouragement in NDSU.
I would also like to thank my peers in Dr. Lin’s group: Fei Yan (PhD student), Mohsen
Azimi (PhD student), Mingli Li (PhD student) and Xingyu Wang (MS student), for their support
and valuable suggestion.
My sincere appreciation for all supports throughout my research: special thanks to
Contech Engineered solution LLC for bridge steel donation, Watson coating, INC. for CSA
coating samples, Pacific Painting Company and NDDOT for 3-coat samples, Coating and
Polymer department and Dr. Xiaoning Qi who gave us valuable suggestion and help. Special
appreciation for helps from Dr. Mehdi Salimi Jazi from mechanical engineering department and
undergraduate student, Jason Lange, from Chemistry department.

v
DEDICATION
To
My father Adel Kasasbeh
My mother Saharieh Dalaeen
My brothers and sisters
My fiancée Ala’a Alemaryeen
My uncle Monther Dalaeen
My uncle Natheer Dalaeen
My aunts Dalaeen
My uncle Eng. Tarq Dalaeen
My uncle Neaz Jawazneh
Jordanian pilot Moath Kasasbeh
My beloved country Jordan

vi
TABLE OF CONTENTS
ABSTRACT ................................................................................................................................... iii
ACKNOWLEDGMENTS ............................................................................................................. iv
DEDICATION ................................................................................................................................ v
LIST OF TABLES ......................................................................................................................... ix
LIST OF FIGURES ........................................................................................................................ x
LIST OF ABBREVIATIONS ....................................................................................................... xii
LIST OF APPENDIX FIGURES................................................................................................. xiii
CHAPTER 1. INTRODUCTION ................................................................................................... 1
1.1. Introduction ...........................................................................................................................1
1.2. Problem Statement ................................................................................................................1
1.3. Objectives .............................................................................................................................3
1.4. Thesis Organization ..............................................................................................................3
CHAPTER 2. LITERATURE REVIEW ........................................................................................ 7
2.1. Introduction ...........................................................................................................................7
2.2. Weldment Corrosion in Steel Civil Infrastructure ................................................................8
2.2.1. Weldment corrosion in steel pipelines .......................................................................... 8
2.2.2. Weldment corrosion in desalination plants, vessel and boiler steels .......................... 11
2.2.3. Weldment corrosion in steel bridges ........................................................................... 11
2.3. Summary .............................................................................................................................12
CHAPTER 3. CORROSION MECHANISM AND ITS MEASUREMENTS ............................ 17
3.1. Introduction .........................................................................................................................17
3.2. Corrosion Mechanism of Bridge Steel Welds ....................................................................17
3.2.1. Corrosion as an electrochemical process .................................................................... 17
3.2.2. Corrosion behavior in bridge steel welds .................................................................... 18

vii
3.2.3. Critical factors affecting the corrosion of bridge steel welds ..................................... 20
3.3. Electrochemical Testing Methods and Their Applicability ................................................23
3.3.1. OCP test ...................................................................................................................... 23
3.3.2. Rp/Ec trend test ............................................................................................................ 24
3.3.3. EIS test ........................................................................................................................ 25
3.3.4. Potentiodynamic polarization test ............................................................................... 27
3.3.5. Summary of the methods and their applicability ........................................................ 28
3.4. Corrosion Current and Corrosion Rate Predictions ............................................................28
3.5. Summary .............................................................................................................................30
CHAPTER 4. EXPERIMENTAL PROGRAM ............................................................................ 34
4.1. Introduction .........................................................................................................................34
4.2. Experimental Plan ...............................................................................................................34
4.3. Material Preparation ...........................................................................................................34
4.3.1. Chemical compositions for bridge steel ...................................................................... 35
4.3.2. Welding process .......................................................................................................... 35
4.3.3. Coating ........................................................................................................................ 35
4.4. Test Setup and Instrumentation ..........................................................................................40
4.5. Test Procedures ...................................................................................................................41
CHAPTER 5. CORROSION RESISTANCE OF STEEL BRIDGE WELDS ............................. 51
5.1. Introduction .........................................................................................................................51
5.2. Corrosion Tendency in Welds ............................................................................................51
5.2.1. Corrosion tendency over three period of time ............................................................ 51
5.2.2. Corrosion tendency under three different coating system .......................................... 52
5.2.3. Summary of corrosion tendency in welds ................................................................... 52
5.3. Corrosion Behavior over Time and PWC Effects in Welds ...............................................52

viii
5.3.1. PWC effects in welds .................................................................................................. 53
5.3.2. Corrosion rate over time ............................................................................................. 53
5.3.3. Summary of corrosion behavior and PWC effects in welds ....................................... 53
5.4. Corrosion Behavior of Welds under Varying Coating Systems .........................................54
5.4.1. Corrosion behavior in welds ....................................................................................... 54
5.4.2. Coating performance in welds .................................................................................... 55
5.4.3. Summary of coating performance in welds ................................................................ 57
CHAPTER 6. SUMMARY, CONCLUSIONS AND FUTURE WORK ..................................... 74
6.1. Summary .............................................................................................................................74
6.2. Conclusions .........................................................................................................................74
6.3. Future Research ..................................................................................................................75
REFERENCES ............................................................................................................................. 76
APPENDIX. EXPERIMENTS PICTURES ................................................................................. 84

ix
LIST OF TABLES
Table Page
2.1: The corrosion potential and corrosion current density in each zone ..................................... 13
2.2: Potentiodynamic polarization scans parameters in water ...................................................... 13
2.3: Potentiodynamic polarization scans parameters in 0.5% NaCl solution ............................... 14
3.1: Electrochemical testing methods and their applicability ....................................................... 31
4.1: Test matrix for all the electrochemical tests .......................................................................... 43
4.2: Chemical composition of A588 and A572 ............................................................................ 44
4.3: Chemical composition of filler material (ASW). ................................................................... 45
4.4: Welding process parameters of SMAW. ............................................................................... 46
5.1: The open circuit potential for all sample tests ....................................................................... 58
5.2: Corrosion rate over the time for bare samples ....................................................................... 59
5.3: Electrochemical impedance and corrosion parameters of A572 steel samples in NaCl
solution. ................................................................................................................................. 60
5.4: Electrochemical impedance and corrosion parameters of A588 steel samples in NaCl
solution. ................................................................................................................................. 61
5.5: Potentiodynamic polarization scans parameters in 3.5 wt. % NaCl for steel sample. ........... 62

x
LIST OF FIGURES
Figure Page
1.1: Weld metal corrosion in carbon steel ...................................................................................... 4
1.2: Weldment intergranular corrosion ........................................................................................... 4
1.3: Ever-increasing corrosion in steel bridges ............................................................................... 4
1.4: Corrosion of weldment at the gusset plates observed on the Hwy 43 bridge in
Winona, MN ............................................................................................................................ 5
1.5: Corrosion and corrosion-induced fatigue cracks inspected at welded joints in a steel
bridge ....................................................................................................................................... 5
1.6: Weldment corrosion at the interstate bridge I 703: a) overview of the bridge, b)
corrosion in a welded joint at the girder end, and c) corrosion in a fillet weld at the
web-flange junction ................................................................................................................. 6
2.1: Types of corrosion in welded joint ........................................................................................ 15
2.2: Corrosion-induced pipeline accident (Taiwan, 2014). ........................................................... 15
2.3: Potentiodynamic polarization curves of the welds ................................................................ 16
2.4: Calculated corrosion rate vs. time results for tests (a) and (b). ............................................. 16
2.5: Potentiodynamic polarization test curves .............................................................................. 16
3.1: Schematic diagram of electrochemical corrosion cells on iron ............................................. 31
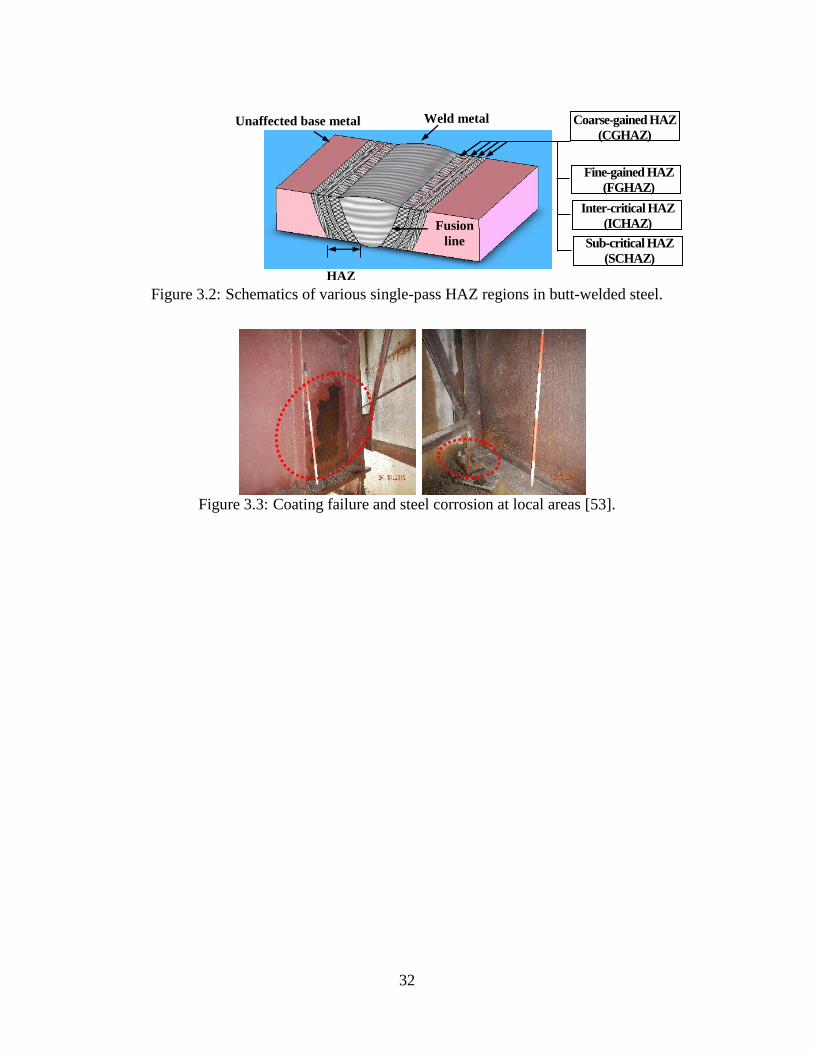
3.2: Schematics of various single-pass HAZ regions in butt-welded steel. .................................. 32
3.3: Coating failure and steel corrosion at local areas .................................................................. 32
3.4: Comparison of different coatings over 20 years. ................................................................... 33
3.5: Equivalent electrical circuit models for a) uncoated and b) coated samples. ........................ 33
4.1: Flowchart of the proposed experimental plan........................................................................ 47
4.2: Butt joint using SMAW. ........................................................................................................ 47
4.3: Schematic diagram of a paint system .................................................................................... 48
4.4: Three-coat system samples. ................................................................................................... 48
4.5: CSA samples. ......................................................................................................................... 48

xi
4.6: Hard coating samples. ............................................................................................................ 49
4.7: Accelerated corrosion system. ............................................................................................... 49
4.8: (a) Saturated Calomel Electrode and (b) platinum counter electrode. ................................... 50
4.9: Electrochemical cell under testing ......................................................................................... 50
5.1: Open circuit potentials immediately for: (a) 3-coat system, (b) CSA, (c) Hard
coating, and (d) uncoated samples. ........................................................................................ 63
5.2: Open circuit potentials after 3 days for: (a) 3-coat system, (b) CSA, (c) Hard coating,
and (d) uncoated samples. ...................................................................................................... 64
5.3: Open circuit potentials after 7 days for: (a) 3-coat system, (b) CSA, (c) Hard coating,
and (d) uncoated samples. ...................................................................................................... 65
5.4: OCP for all coating system over the time. ............................................................................. 66
5.5: Corrosion rate over time for bare samples. ............................................................................ 67
5.6: EIS diagrams (1 and 2 Bode plots; 3 Nyquist plot) for: (a) A572UW, (b) A572W, (c)
A588UW, (d) A588W samples immediately. ........................................................................ 68
5.7: EIS diagrams (1 and 2 Bode plots; 3 Nyquist plot) for: (a) A572UW, (b) A572W, (c)
A588UW, (d) A588W samples after 3 days. ......................................................................... 69
5.8: EIS diagrams (1 and 2 Bode plots; 3 Nyquist plot) for: (a) A572UW, (b) A572W, (c)
A588UW, (d) A588W samples after 7 days. ......................................................................... 70
5.9: Comparison of corrosion properties. ..................................................................................... 71
5.10: Comparison of dielectric properties of coating.................................................................... 72
5.11: Potentiodynamic polarization curves for: (a) 3-coat, (b) CSA, (c) hard, and (d)
uncoated samples. ................................................................................................................ 73

xii
LIST OF ABBREVIATIONS
AWS ...................................................American welding society
Corrate (mills) ....................................Corrosion rate (mill inch per year)
CSA ....................................................Calcium sulfonate alkyd
DOT ...................................................Department of Transportation
EIS......................................................Electrochemical impedance spectroscopy
EPA ....................................................Environmental Protection agency
FHWA ................................................Federal Highway administration
GDP ...................................................Gross domestic product
HAZ ...................................................Heated affected zone
KCl ....................................................Potassium chloride
OCP ....................................................Open circuit potential
PWC ...................................................Preferential welding Corrosion
SCE ....................................................Saturated Calomel electrode
SMAW ...............................................Shield metal arc welding
UW .....................................................Unwelded sample
VOC ...................................................Volatile organic compound
W ........................................................Welded sample
ZAR....................................................Zero resistance ammeter

xiii
LIST OF APPENDIX FIGURES
Figure Page
A1: Comparison of 3-Coat system sample before and after of the test ........................................ 84
A2: Comparison of CSA coated sample before and after of the test. ........................................... 85
A3: Comparison of Hard coated sample before and after of the test. ........................................... 86
A4: Comparison of bare sample before and after of the test. ....................................................... 87
A5: Light microscope pictures (X20) of 3-coat system samples before and after the test. .......... 88
A6: Light microscope pictures (X20) of CSA samples before and after the test. ........................ 89
A7: Light microscope pictures (X20) of hard coating samples before and after the test. ............ 90
A8: Light microscope pictures (X20) of bare samples before and after the test. ......................... 91

1
CHAPTER 1. INTRODUCTION
1.1. Introduction
Structural Steel, due to its superior properties, such as high strength and high toughness as
well as light weight, is the most widely used engineered material in civil transportation
infrastructures, including bridges, pipelines, tunnels and railways. Use of structural steel in bridges
goes back over one century. By the 1890, the Forth Rail Bridge in Scotland was made of steel,
with a total span length of 2528.7 m [1]. According to the data in NACE (2013), more than 200,000
steel bridges were built in the United States.
Similar to most metals that tend to be oxidized back to their lower energy state with
surrounding environmental conditions, structural steel is susceptible to corrosion when freely
exposed to aggressive environments. Corrosion has an adverse effect on structural steel products
in terms of reduction of their cross section, damage of their surface, and thus shortens their service
life. Corrosion of steel has become one big threat to the society and economy in the United States
and worldwide. A review shows that total amount of annual corrosion costs one trillion by 2015,
approximately 6.1% of U.S. GDP. There was over 10 billions of dollars alone in highway bridges
in accordance with the recent report in Federal Highway Administration (FHWA) in 2015, while
also, corrosion of onshore gas and liquid transmission pipelines are responsible for over $7 billion
cost [2]. Huge economy burdens have raised more widespread attention to corrosion-induced issue
in these key infrastructures.
1.2. Problem Statement
Welding is commonly used for connecting structural steel components in steel bridge
fabrication and construction. Welding processes change the microstructures and properties of
surrounding steel and its surface texture. As a result, welded joints are susceptible for both pitting
2
corrosion (see Fig. 1.1) and intergranular corrosion (see Fig. 1.2). Weldment corrosion has
frequently been reported in bridges, pipelines, and other steel civil infrastructure, particularly the
higher severity for those infrastructure systems located at high-chloride coastlines or cold regions
with increasing of deicing salts application during winter. The corrosion in welded joints leads to
pits or cracks, while these corrosion-induced cracks allow fatigue effects due to traffic in bridge
to locally propagate out of this corrosion pitting, ultimately resulting in malfunction of steel
components. These developed cracks, in turn, may further accelerate the corrosion process at a
higher rate and cause the severer corrosion behavior of welds [3].
There are ever-increasing steel bridge deteriorations in the United States due to corrosion,
as typically observed in Fig. 1.3. More and more highway agencies have reported the weldment
corrosion in existing steel bridge systems. As clearly observed in several steel bridges from
Minnesota Department of Transportation (DOT), Rhode Island DOT and Delaware DOTs in Figs.
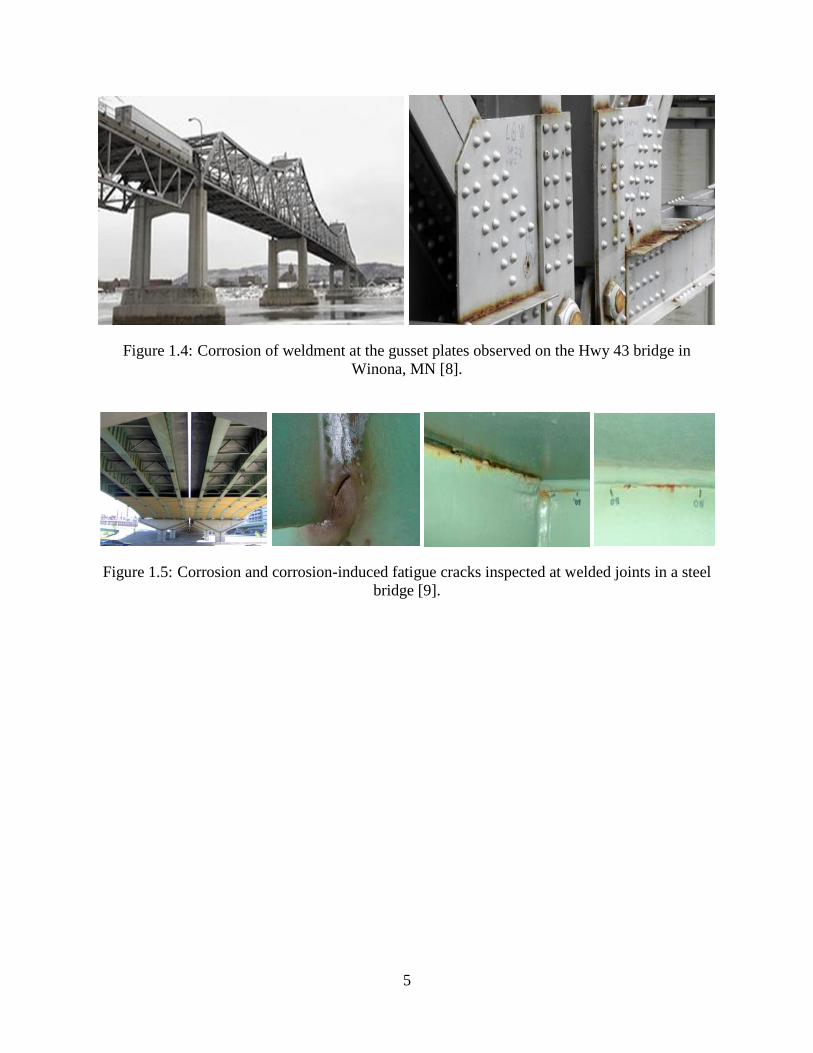
1.4 through 1.6, welded joints in steel bridges are particularly vulnerable to initiate the corrosion
and corrosion-induced fatigue cracks. The welded joints may locate at the fillet weld (see Fig. 1.4),
or web-flange junction (see Figs. 1.5 and 1.6).
Various treatments are used by industry and highway agencies for preservation of steel
bridges. Cathodic protection and protective coating systems have commonly been used as
corrosion control strategies in steel bridges. None of these, however, can fully protect steel bridges
against the corrosion due to high variation in operational environments and traffic conditions.
Weldment corrosion still appears as one of the main failure reasons in welded steel bridges. No
clear relationships are well documented for determining the appropriate corrosion behavior of
welded joints in steel bridges. Thus, research is needed to gain the foundational understanding of

3
performance of weldments and its potential corrosion behavior, and establish these relationships
for determining the timing for corrosion control and management.
1.3. Objectives
The major goal of this research work is to gain the understanding of the performance of
welded joints and investigate impact of corrosion effect on steel bridges welds. The objectives of
this study were:
1) To investigate the corrosion behavior of steel bridge welds;
2) To investigate preferential welding corrosion attacks in steel bridge welds; and
3) To evaluate the coating performance in welds and corrosion resistance under three
types of coating systems.
1.4. Thesis Organization
This thesis is organized into six chapters as follows: the first part includes the introduction
and background about weldment corrosion of steel in Chapters 1 to 2. A review of existing studies
and experimental tests on corrosion of welded joints is provided in Chapter 2. The fundamental of
corrosion mechanism and experimental program are described in details in Chapter 3 and 4. The
tests results and data analyses were documented in Chapter 5, which provides a better
understanding for the corrosion behavior of steel bridge welds. In addition to summary, main
conclusions, a series of subjective were identified for future studies in Chapter 6.

4
Figure 1.1: Weld metal corrosion in carbon steel [4].
Figure 1.2: Weldment intergranular corrosion [5,6]
Figure 1.3: Ever-increasing corrosion in steel bridges [7].
a) Bridge girder b) Bridge support
5
Figure 1.4: Corrosion of weldment at the gusset plates observed on the Hwy 43 bridge in
Winona, MN [8].
Figure 1.5: Corrosion and corrosion-induced fatigue cracks inspected at welded joints in a steel
bridge [9].

6
Figure 1.6: Weldment corrosion at the interstate bridge I 703: a) overview of the bridge, b)
corrosion in a welded joint at the girder end, and c) corrosion in a fillet weld at the web-flange
junction [10]

7
CHAPTER 2. LITERATURE REVIEW
2.1. Introduction
Welded joints in steel bridges maybe have more tendency to corrode due to high variation
in steel composition experienced during welding processes in fabrication and/ construction.
Typical corrosion types [11] are schematically displayed in Fig. 2.1. First type is to assume
corrosion spreads uniformly at the same rate, as shown in Fig. 2.1(a). The second and third types,
illustrated in Figs. 2.1(b) and 2.1(c), the weld metal corrodes less than base metal or versa vice.
Figs. 2.1(d) and 2.1(e) show where HAZ may be corroded in specific regions due to metallurgical
variation during welding process.
Base metal and filling materials, weld design, residual stress, ambient conditions are
critical factors that affect the final corrosion resistance of the weldment [12]. Welded joints
corrosion cannot be fully avoided [12], even though proper base metal and filler material are
selected in accordance with specified standards to deposit the welds with suitable shapes and
manners. The heating and cooling cycles during the welding processes cause compositional and
microstructural variations in metallurgical of weldment zones, and thus affect the corrosion
resistance of the surrounding steel nearby the welds, which may be different to the base metal. As
a result, welds may exhibit unusual manners with a superior corrosion resistance as compared to
the base metal in some cases, but may not in other cases. Thus, a critical review was carried out
for available information on domestic and foreign practice and specification, performance data,
research findings, laboratory testing, and other information related to steel welds. Information
related to the steel pipelines and steel bridge welds was of particular interest, as displayed below.

8
2.2. Weldment Corrosion in Steel Civil Infrastructure
2.2.1. Weldment corrosion in steel pipelines
Pipelines have been grown in fluid transportation field due to high capacity, safety, and
environmental considerations. Recently, thousands of miles of pipelines are used for oil and gas
transmission to support the U.S. societal and economy needs. Safety and durability of steel
pipelines especially against the corrosion failure has become a major challenge in maintaining
pipelines integrity. External corrosion of pipelines responds for approximately 80% of corrosion
accidents [13]. Corrosion results in contamination or loss of products, reduction in efficiency, and
costly maintenance [14]. Corrosion is one of the leading causes of failures of steel pipelines in the
United States and worldwide. Corrosion of onshore gas and liquid transmission pipelines were
responsible for over $7 billion cost. A gas pipeline in Brooke County, West Virginia, exploded at
2012 and directly affected daily life of over 1,600 local residents nearby. Oil pipeline explosion in
2013 at Qingdao, China, led to death toll of 62 and the blast cost over $123.9 million in damage.
Another gas pipe explosion in 2014 at Taiwan killed 32 people and totally destroyed urban streets,
as shown in Fig. 2.2. Investigation report of all cases revealed that external corrosion was mainly
blamed in terms of thinning the pipeline thickness in some spots, which eventually caused the
tragedies.
Corrosion frequently starts in and near weldment in pipeline systems and weldment
corrosion has been reported in pipeline industries wherever steel pipelines are used, even though
they may have protective coating and cathodic protections. Severe pitting corrosion was observed
near welded joint zones: nearby base metal, heated affected zone (HAZ), and weld metal [15, 16].
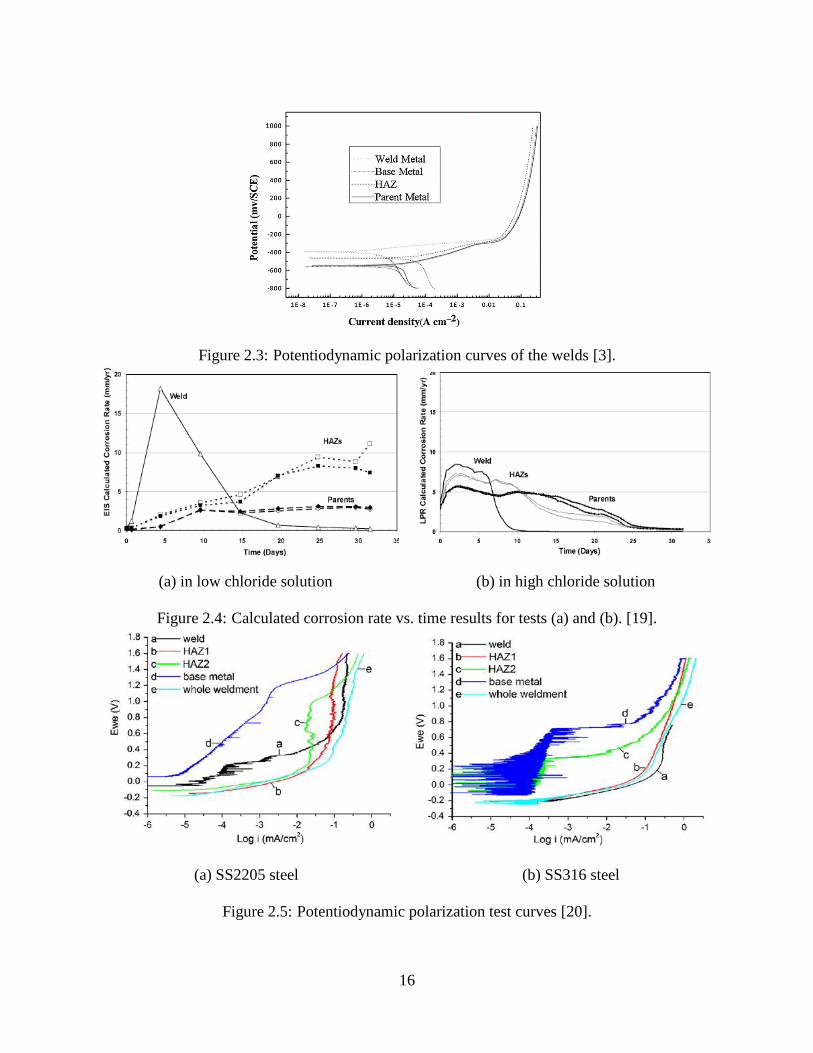
Wang et al. [3] documented their recent investigation on the corrosion behavior of
submarine pipeline steel X65 using both Electrochemical and immersion tests, as shown in Table
9
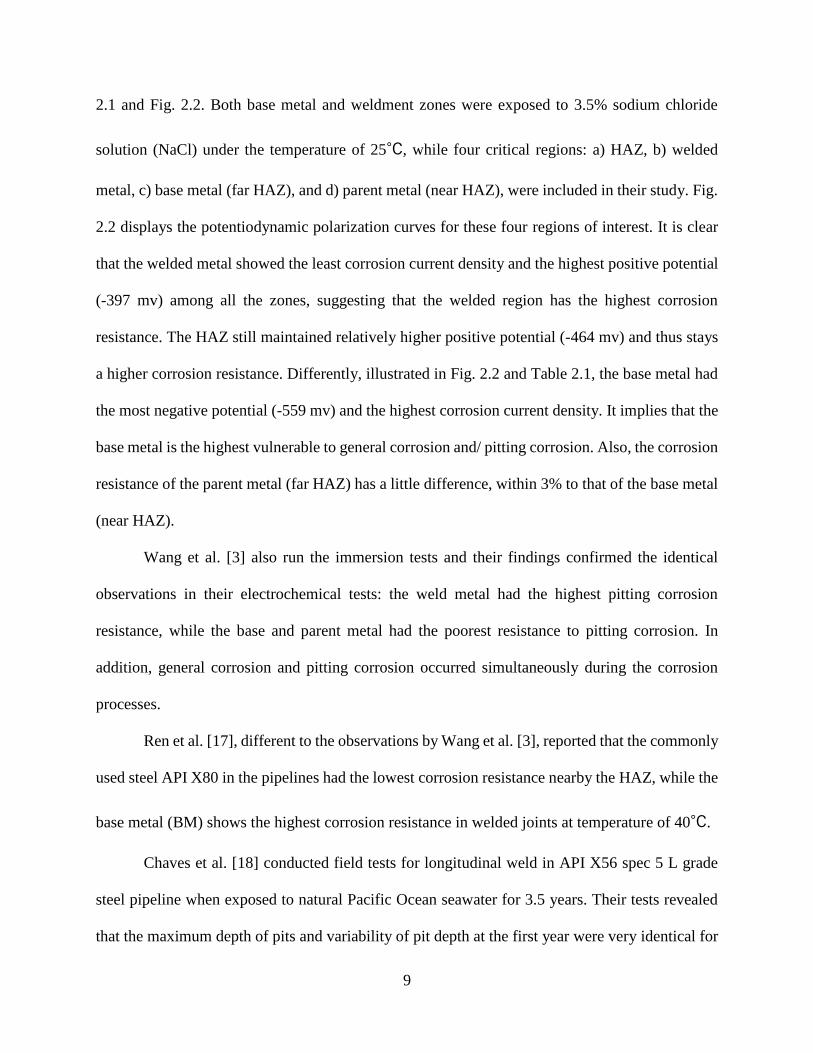
2.1 and Fig. 2.2. Both base metal and weldment zones were exposed to 3.5% sodium chloride
solution (NaCl) under the temperature of 25℃, while four critical regions: a) HAZ, b) welded
metal, c) base metal (far HAZ), and d) parent metal (near HAZ), were included in their study. Fig.
2.2 displays the potentiodynamic polarization curves for these four regions of interest. It is clear
that the welded metal showed the least corrosion current density and the highest positive potential
(-397 mv) among all the zones, suggesting that the welded region has the highest corrosion
resistance. The HAZ still maintained relatively higher positive potential (-464 mv) and thus stays
a higher corrosion resistance. Differently, illustrated in Fig. 2.2 and Table 2.1, the base metal had
the most negative potential (-559 mv) and the highest corrosion current density. It implies that the
base metal is the highest vulnerable to general corrosion and/ pitting corrosion. Also, the corrosion
resistance of the parent metal (far HAZ) has a little difference, within 3% to that of the base metal
(near HAZ).
Wang et al. [3] also run the immersion tests and their findings confirmed the identical
observations in their electrochemical tests: the weld metal had the highest pitting corrosion
resistance, while the base and parent metal had the poorest resistance to pitting corrosion. In
addition, general corrosion and pitting corrosion occurred simultaneously during the corrosion
processes.
Ren et al. [17], different to the observations by Wang et al. [3], reported that the commonly
used steel API X80 in the pipelines had the lowest corrosion resistance nearby the HAZ, while the
base metal (BM) shows the highest corrosion resistance in welded joints at temperature of 40℃.
Chaves et al. [18] conducted field tests for longitudinal weld in API X56 spec 5 L grade
steel pipeline when exposed to natural Pacific Ocean seawater for 3.5 years. Their tests revealed
that the maximum depth of pits and variability of pit depth at the first year were very identical for

10
all regions (i.e., HAZ, weld metal, and base metal). However, the depth of pits became deeper and
the greatest increasing depth was observed in the region of the HAZ, similar to the observation of
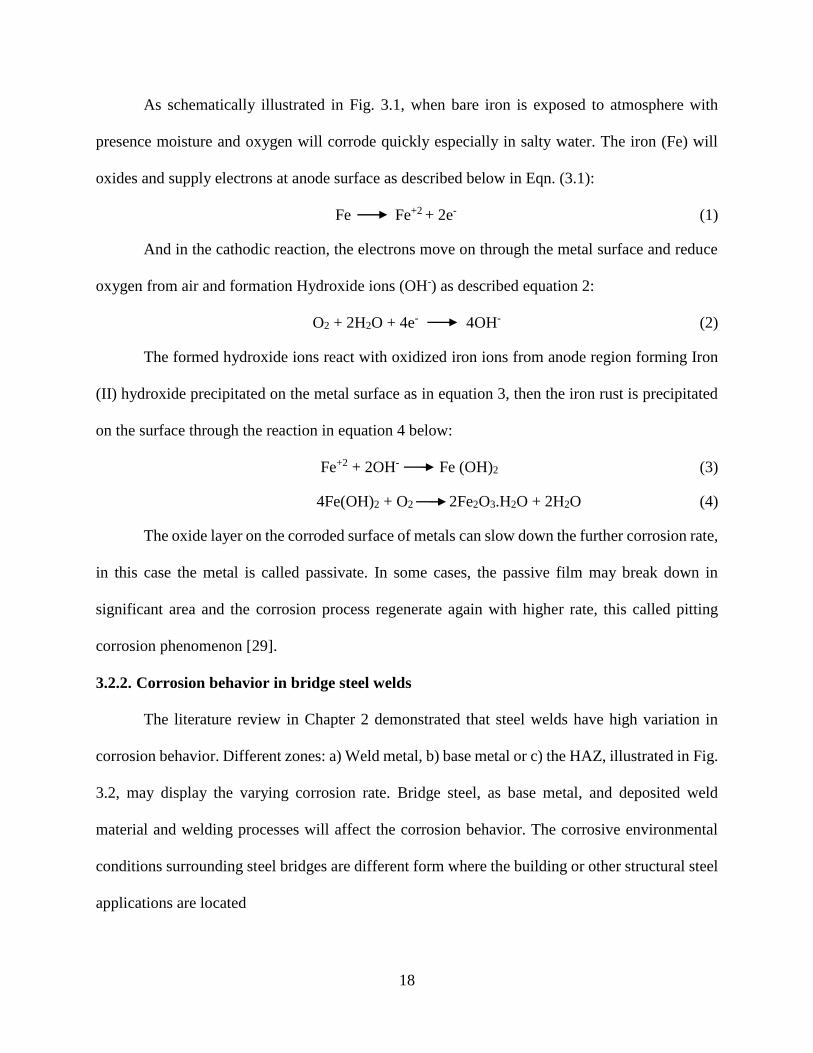
Lee et al. [19] investigated the effect of composition and microstructure of X52 and X65 grade
pipeline steels on preferential weldment corrosion (PWC) in environment that contains CO2, in
which the PWC refers to selective and rapid corrosion processes in weldments of carbon and low
alloy steels, and usually results in a groove-like severe defect. Figs. 2.4 (a) and 2.4 (b) show
corrosion rates calculated for tests samples in both low and high chloride solution at temperature
of 60℃, respectively. In the earlier days of the tests, the weld metal at both cases, illustrated in
solid lines in Figs. 2.4 (a) and 2.4 (b), apparently displayed the highest corrosion rate due to the
principle of preferential weldment corrosion. After the short certain period of time (about 5 days),
it was believed that a protective scale was formed on the sample surfaces. This was the main reason
that a sharp drop in the corrosion rate was observed for the weld metal at both cases. Differently,
parents metal at the low temperature (see Fig. 2.4 (a)) had a certain increase in the corrosion rate
at the initial 10 days and then maintained the constant value, while gradually decreased after the
initial increase for the second case at the high temperature (see Fig. 2.4 (b)). The HAZs had a total
different corrosion behavior than their counterparts (weld and parents metals). The HAZs at the
low temperature case had a steady increase over the whole test period and became one dominant
corrosion near the end, which confirms the similar conclusions by other studies [17, 18]. With the
increasing temperature, the HAZs had a corrosion rate within the envelope of the weld and parent
metals and decrease to certain small rate after the initial high corrosion rate.

11
2.2.2. Weldment corrosion in desalination plants, vessel and boiler steels
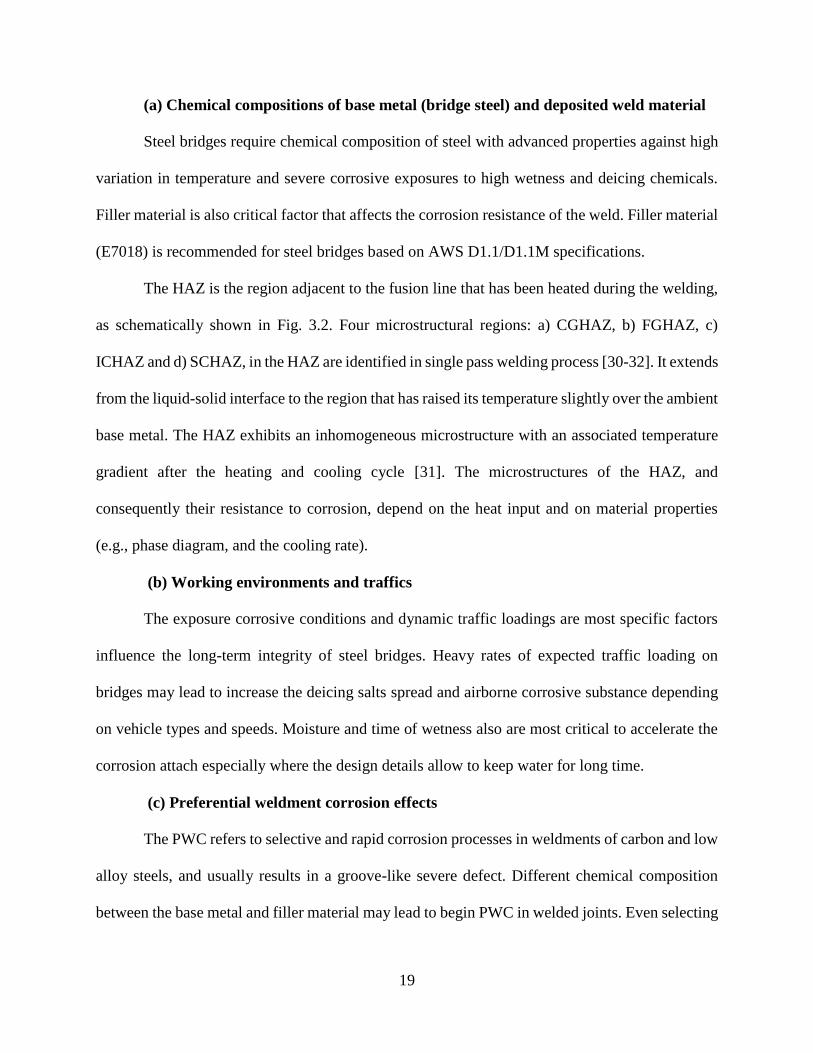
Xiong et al. [20] carried out potentiodynamic testing on stainless steels, SS316 and SS2205,
in desalination plants, as shown in Figs. 2.5 (a) and 2.5 (b). The tests demonstrated that the highest
corrosion resistance was found at the base metal and far HAZ, while weld metal and near HAZ
had the least corrosion resistance. Deen et al. [21] conducted the electrochemical tests on the vessel
and boiler steels, as summarized in Tables. 2.2 and 2.3, and they results showed the weld metal
had the least corrosion resistance under both water and NaCl solution, while the HAZ appeared
the best corrosion resistance.
Similar to the pipelines, there were conflict conclusions for where the highest corrosion
resistance was and where was the least. Tomlison et al. [22] tested the 405 stainless steel weldment
and they found that the weld region has the susceptibility for intergranular corrosion, particularly
in the HAZs. Garcia et al. [23] confirmed these findings based on their research on welded joints
of austenitic stainless steels, AISI 304 and 316 L.
No significant effects on corrosion behavior was observed at the locations where welded
joints of stainless steel and mild steel welded together nor stainless steel samples welded together
in desalination plants in seawater exposure at 25℃ and 60℃ , but general susceptibility for
corrosion was founded when mild steel samples welded together with different severity corrosion
degree which depends on welding process parameters and oxygen content in seawater [24].
2.2.3. Weldment corrosion in steel bridges
Steel bridges account for over 200,000 bridges in the United States. Corrosion of steel
bridges has been a big concern and reported in highway infrastructures from various state DOTs.
The overall of corrosion cost in highway bridges including steel bridges is over $8.0 billion
annually [25]. Similar to steel pipeline systems, welding process in bridge steels changes the

12
composition and microstructure nearby the weld, and thus change their corrosion resistance, which
affects the desirable service life of steel bridges.
Although highway agencies have reported the weldment corrosion in existing steel bridge
systems as shown in Figs. 1.4 through 1.6, no study on steel bridge welds has been found in the
literature. Lack of information for the corrosion behavior of steel bridge welds hinders the timely
corrosion control and management.
2.3. Summary
In summary, the literature review revealed that welded joints exhibit high variation in
corrosion behavior. Some studies showed that weld metal may display the highest corrosion rate,
but other may show the HAZ or base metal has the highest potential in corrosion. It is clear that
the nature and location of the corrosion may be affected by complex interaction of numerous
factors, including chemical compositions of base metal, deposited weld material, welding
procedure, temperature, and ambient conditions. Any changes of these factors may lead different
corrosion behavior, and these parameters are interrelated and it is not easy to evaluate their effects
individually. Thus, this study will aim to gain fundamental understanding of the corrosion behavior
of steel bridge welds, and investigate the corrosion resistance of weldment of bridge steel with and
without coatings in the following chapters.

13
Table 2.1: The corrosion potential and corrosion current density in each zone [3].
Position Corrosion potential
(Ecorr/mV)
Corrosion current density
icorr/mA cm-2
Weld metal -396 4.02E-7
HAZ -464 2.47E-5
Parent metal -544 3.35E-5
Base metal -559 3.5E-5
Table 2.2: Potentiodynamic polarization scans parameters in water [21].
Solution
Water
Eoc
(mV)
Ecorr
(mV)
Icorr
(𝜇𝐴/𝑐𝑚2)
𝛽𝑎
(mV/decade)
𝛽𝑐
(mV/decade)
CR(Tafel)
(mpy)
Plain
BM -747.2 -751.0 4.17 80.7 241.6 1.906
HAZ -741.1 -752.0 3.61 85.0 194.0 1.648
WZ -719.4 -717.0 7.79 92.4 397.8 3.559
Aerated
BM -647.1 -528.0 66.4 100.2 1.0E+18 -
HAZ -618.75 -461.0 168 353.7 4.147E+6 -
WZ -570.3 -502.0 75.8 337.9 668.0E+6 -

14
Table 2.3: Potentiodynamic polarization scans parameters in 0.5% NaCl solution [21].
Solution
0.5%
NaCl
Eoc
(mV)
Ecorr
(mV)
Icorr
(𝜇𝐴/𝑐𝑚2)
𝛽𝑎 (mV/decade)
𝛽𝑐 (mV/decade)
CR(Tafel)
(mpy)
Plain
BM -736.2 -779.0 7.0 74.4 300
HAZ -720.9 -746.0 5.12 63.5 188.6
WZ -720.7 -719.0 20.8 65.2 353.6
Aerated
BM -599.0 -455.0 74.6 93.10 412.8 -
HAZ -664.0 -557.0 108 91.7 1.0E+18 -
WZ -624.2 -618.0 143 98.1 1.0E+4 -

15
Figure 2.1: Types of corrosion in welded joint [11].
Figure 2.2: Corrosion-induced pipeline accident (Taiwan, 2014).
16
Figure 2.3: Potentiodynamic polarization curves of the welds [3].
(a) in low chloride solution (b) in high chloride solution
Figure 2.4: Calculated corrosion rate vs. time results for tests (a) and (b). [19].
(a) SS2205 steel (b) SS316 steel
Figure 2.5: Potentiodynamic polarization test curves [20].

17
CHAPTER 3. CORROSION MECHANISM AND ITS MEASUREMENTS
3.1. Introduction
This Chapter is to provide fundamentals of corrosion mechanism experienced in steel
bridges and the corresponding measurements and strategies used. This information will assist to
select the suitable methods and strategies for the next chapter to quantify corrosion behavior of
weldments in steel bridges.
3.2. Corrosion Mechanism of Bridge Steel Welds
3.2.1. Corrosion as an electrochemical process
Metallic corrosion is an electrochemical processes [26]. Electrochemical reaction at the
metals surfaces occur due to tendency of metals to react with water, oxygen, and other substances
when the metal in contact with a liquid which is called electrolyte solution. Electrochemical
reaction is chemical reactions composes of oxidation and reduction reactions in the interface of
the metal surfaces and electrolyte which involve the transfer of electrons from certain surface areas
to others areas through the electrolyte solution.
In corrosion process, the deterioration and oxidation of the metals occurs where the ions
are formed then release electrons at the anodic surfaces. Simultaneously, reduction reaction begins
to consume the generated electrons from anodic reaction that is called cathodic reaction. The
electrons that produced by corrosion reaction in anode tend to neutralize and reduce positive ions
in electrolyte solution (often O2 or H+) or form negative ions. At the equilibrium state, the flow of
electrons between oxidation and reduction reactions is balanced, since the anodic and cathodic
reactions must occur at the same rate and simultaneously [27]. The anode is refer to the portion of
metal surface that is actually corroding while cathode describes the metal surface where the
produced electrons by corrosion reaction are consumed [28].
18
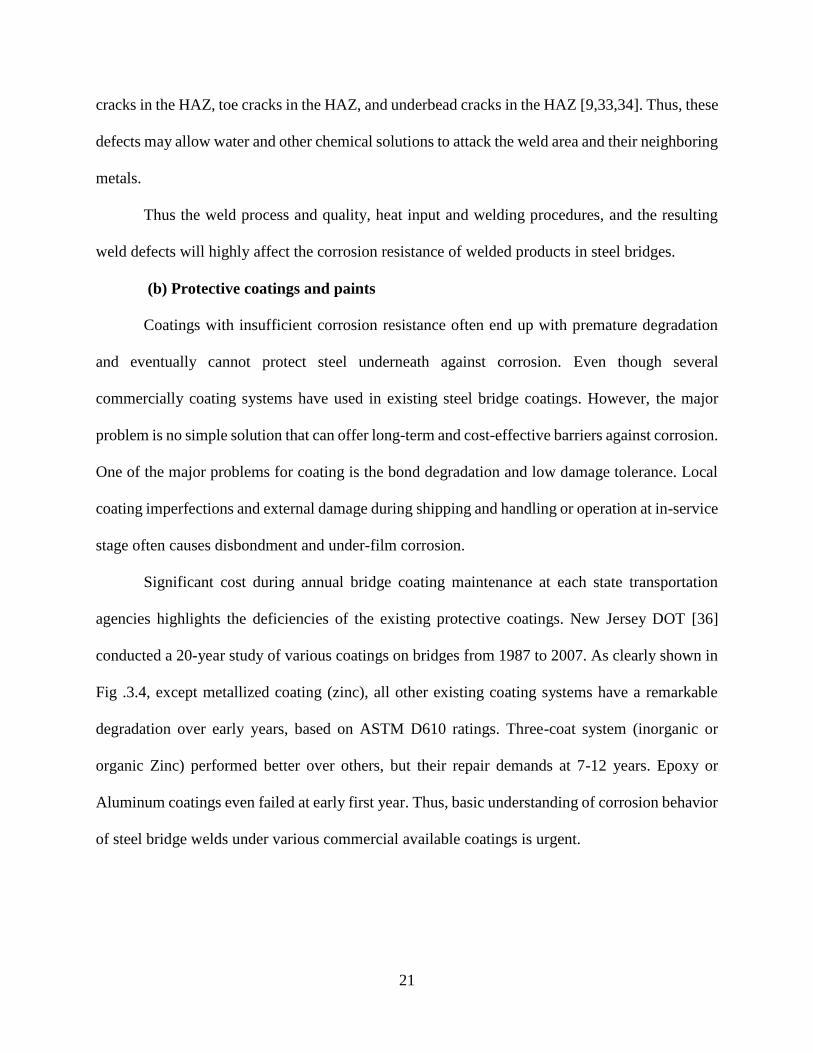
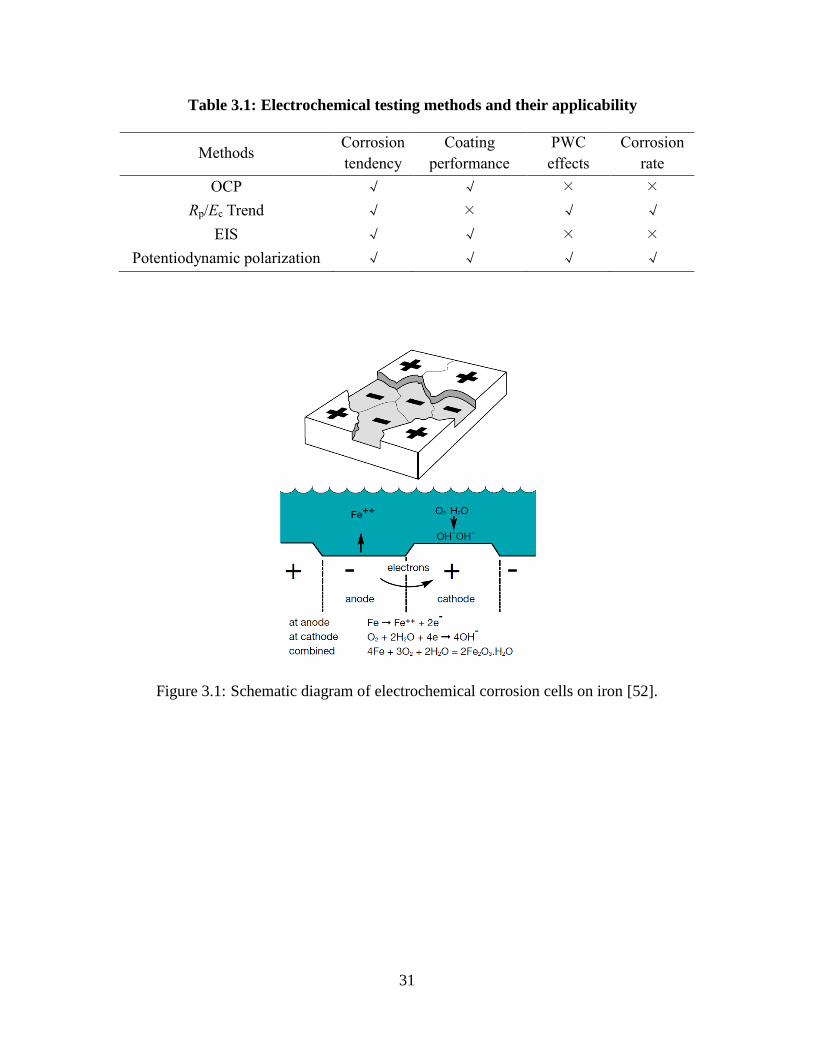
As schematically illustrated in Fig. 3.1, when bare iron is exposed to atmosphere with
presence moisture and oxygen will corrode quickly especially in salty water. The iron (Fe) will
oxides and supply electrons at anode surface as described below in Eqn. (3.1):
Fe Fe+2 + 2e- (1)
And in the cathodic reaction, the electrons move on through the metal surface and reduce
oxygen from air and formation Hydroxide ions (OH-) as described equation 2:
O2 + 2H2O + 4e- 4OH- (2)
The formed hydroxide ions react with oxidized iron ions from anode region forming Iron
(II) hydroxide precipitated on the metal surface as in equation 3, then the iron rust is precipitated
on the surface through the reaction in equation 4 below:
Fe+2 + 2OH- Fe (OH)2 (3)
4Fe(OH)2 + O2 2Fe2O3.H2O + 2H2O (4)
The oxide layer on the corroded surface of metals can slow down the further corrosion rate,
in this case the metal is called passivate. In some cases, the passive film may break down in
significant area and the corrosion process regenerate again with higher rate, this called pitting
corrosion phenomenon [29].
3.2.2. Corrosion behavior in bridge steel welds
The literature review in Chapter 2 demonstrated that steel welds have high variation in
corrosion behavior. Different zones: a) Weld metal, b) base metal or c) the HAZ, illustrated in Fig.
3.2, may display the varying corrosion rate. Bridge steel, as base metal, and deposited weld
material and welding processes will affect the corrosion behavior. The corrosive environmental
conditions surrounding steel bridges are different form where the building or other structural steel
applications are located
19
(a) Chemical compositions of base metal (bridge steel) and deposited weld material
Steel bridges require chemical composition of steel with advanced properties against high
variation in temperature and severe corrosive exposures to high wetness and deicing chemicals.
Filler material is also critical factor that affects the corrosion resistance of the weld. Filler material
(E7018) is recommended for steel bridges based on AWS D1.1/D1.1M specifications.
The HAZ is the region adjacent to the fusion line that has been heated during the welding,
as schematically shown in Fig. 3.2. Four microstructural regions: a) CGHAZ, b) FGHAZ, c)
ICHAZ and d) SCHAZ, in the HAZ are identified in single pass welding process [30-32]. It extends
from the liquid-solid interface to the region that has raised its temperature slightly over the ambient
base metal. The HAZ exhibits an inhomogeneous microstructure with an associated temperature
gradient after the heating and cooling cycle [31]. The microstructures of the HAZ, and
consequently their resistance to corrosion, depend on the heat input and on material properties
(e.g., phase diagram, and the cooling rate).
(b) Working environments and traffics
The exposure corrosive conditions and dynamic traffic loadings are most specific factors
influence the long-term integrity of steel bridges. Heavy rates of expected traffic loading on
bridges may lead to increase the deicing salts spread and airborne corrosive substance depending
on vehicle types and speeds. Moisture and time of wetness also are most critical to accelerate the
corrosion attach especially where the design details allow to keep water for long time.
(c) Preferential weldment corrosion effects
The PWC refers to selective and rapid corrosion processes in weldments of carbon and low
alloy steels, and usually results in a groove-like severe defect. Different chemical composition
between the base metal and filler material may lead to begin PWC in welded joints. Even selecting

20
very close chemical composition of base and filler material, but the filler material as a welded may
be completely different and cause PWC as well different microstructure in HAZ as a welded may
tend to be corroded [19].
(d) Galvanic corrosion effects
Steel weld consists of base metal (bridge steel), weld metal and the HAZ. Thus, as
identified in the literature that plain carbon steel weldments may exhibit galvanic attack, the steel
bridge welds may experience similar galvanic corrosion effects due to the fact that welding
electrode may have a high anodic to base metal in ambient environment.
3.2.3. Critical factors affecting the corrosion of bridge steel welds
It is clear that corrosion of bridge steel welds will be affected by complex interaction of
numerous factors, including chemical compositions of base metal, deposited weld material,
welding procedure, temperature, and ambient conditions. Any changes of these factors may lead
different corrosion behavior, and these parameters are interrelated.
(a) Weld process, heat input and weld procedures, and weld flaws
The heat input is the amount of heat used to melt the electrode and is a critical factor used
to control the welding process. Increasing heat input will increase the cooling rate, and thus vary
the width of the affected zone. Using high heat input, for example, generally coarsen the austenite
grain sizes in the region of CGHAZ, which in turn will increase hardenability in this region, and
high amounts of coarse microstructures can dramatically diminish corrosion resistance.
In addition, it is common practice to assume that weld flaws is present [33-35]. The flaw
size and features, component geometry, traffic loading conditions and the base/filler material
property will affect the corrosion behavior and corrosion resistance of the steel bridge weld.
Besides that, most cracks initiate at the HAZs (see Fig. 1.5), including longitudinal or transverse
21
cracks in the HAZ, toe cracks in the HAZ, and underbead cracks in the HAZ [9,33,34]. Thus, these
defects may allow water and other chemical solutions to attack the weld area and their neighboring
metals.
Thus the weld process and quality, heat input and welding procedures, and the resulting
weld defects will highly affect the corrosion resistance of welded products in steel bridges.
(b) Protective coatings and paints
Coatings with insufficient corrosion resistance often end up with premature degradation
and eventually cannot protect steel underneath against corrosion. Even though several
commercially coating systems have used in existing steel bridge coatings. However, the major
problem is no simple solution that can offer long-term and cost-effective barriers against corrosion.
One of the major problems for coating is the bond degradation and low damage tolerance. Local
coating imperfections and external damage during shipping and handling or operation at in-service
stage often causes disbondment and under-film corrosion.
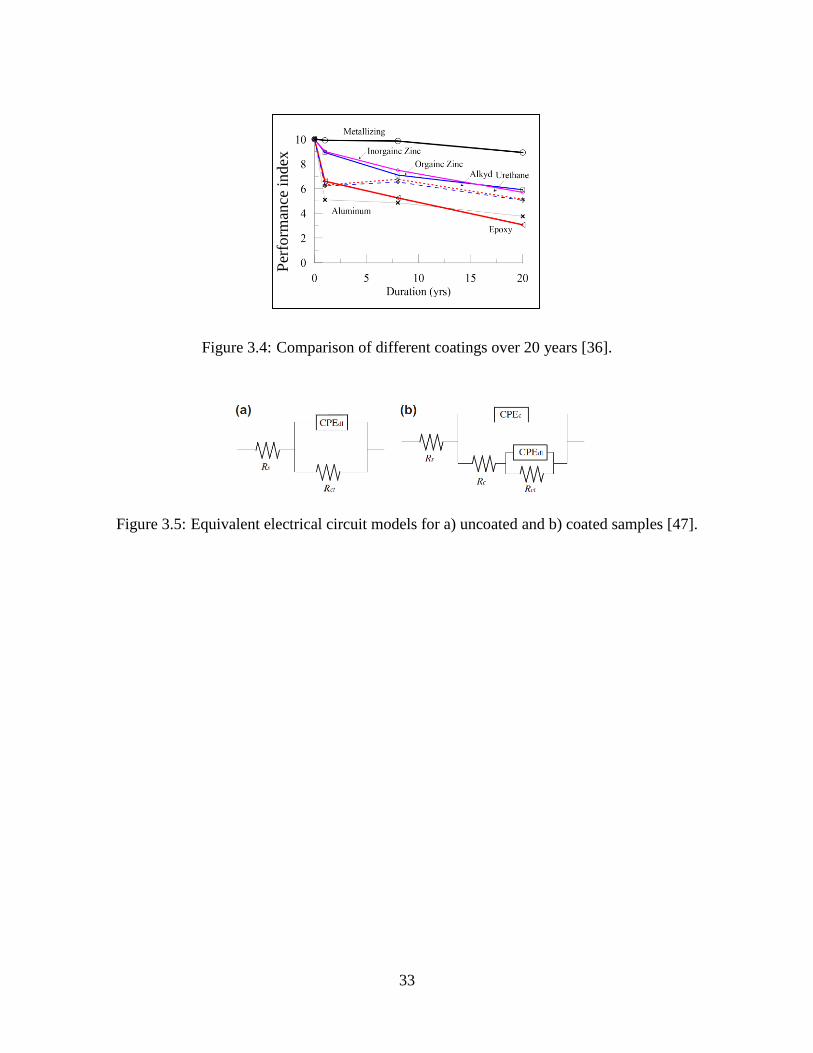
Significant cost during annual bridge coating maintenance at each state transportation
agencies highlights the deficiencies of the existing protective coatings. New Jersey DOT [36]
conducted a 20-year study of various coatings on bridges from 1987 to 2007. As clearly shown in
Fig .3.4, except metallized coating (zinc), all other existing coating systems have a remarkable
degradation over early years, based on ASTM D610 ratings. Three-coat system (inorganic or
organic Zinc) performed better over others, but their repair demands at 7-12 years. Epoxy or
Aluminum coatings even failed at early first year. Thus, basic understanding of corrosion behavior
of steel bridge welds under various commercial available coatings is urgent.
22
(c) Ambient conditions
Steel bridges display higher corrosion rate under aggressive environments, such as high-
chloride coastlines or salts and de-icing chemicals in cold regions. Among all factors contributing
to the failure of coatings and their protected steel substrate, the salt water and uptake process is
important since salt water is the medium for the diffusion of oxygen and ions, and it also nucleates
coating delamination and blistering [37-39]. A major driving force for water percolation is the
osmotic pressure. Due to the difference in salt concentration between the small volume of water
entrapped between coating and substrate and aqueous/moist environment above the coating,
osmotic pressure drives water to diffuse into the coating. An extensive study by Wang et al. [38,
40] shows that pure water even generates a relatively larger osmotic pressure across a coating layer
as compared with NaCl solutions, tends to accelerate the percolation of water into the coating, and
eventually causes failure of the coating, as similarly stated by other researchers [41]. Thus,
determination of corrosion resistance of bridge steel welds under such aggressive environments
are demanded for further corrosion control.
(d) Geometrical shapes and locations
Protective coating and the protected steel typically fails in localized areas of steel highway
bridges, which normally comprise a relatively small percentage of the surface area [42-44]. These
“hot spot” regions are usually located at certain critical locations, such as bridge girder ends,
bearing beneath of expansion joints and H-pile head. These critical locations of bridges, including
bridge girder ends, and h-pile head, may not be visible or accessible during routine National Bridge
Inspection Standards (NBIS) inspections. Limited vision or access arises the difficulty in detecting
them and timely assessing their corresponding conditions, which are recently responsible for
several big incidents and huge economic cost. According to the Society for Protective Coatings
23
(SSPC) and the National Association of Corrosion Engineers (NACE) guides, the action on
damaged protective coatings to avoid further corrosion consists of: a) spot touch-up (SSPC
Standard SP-6), b) zone coating (SSPC Standard SP-6), c) overcoating (SSPC Standards SP-1
through SP-3), and d) re-coating (SSPC Standards SP-6 and SP-10). Combining this
understanding with the fact that degradation of coatings initiates at certain regions, understanding
the corrosion performance of welded joints at the critical zones will be crucial for corrosion
mitigation.
(e) Aging effects
The aging deterioration of the corrosion resistance of steel bridge welds should be one
critical concern for addressing long-term durability of steel bridges. Experiences have shown that
aged welds may be more vulnerable to aging effects, thus resulting in a higher corrosion rate.
Combined effects by aging and fracture/fatigue loading will accelerate the corrosion of steel bridge
welds.
3.3. Electrochemical Testing Methods and Their Applicability
Reviews show that several electrochemical testing methods, including open circuit
potential (OCP) test, Rp/Ec Trend test, electrochemical impedance spectroscopy (EIS) test and
potentiodynamic polarization test, are used in the characterization of corrosion behavior of steel
welds. A brief introduction of methods and their applicability are summarized below.
3.3.1. OCP test
It is the measured potential of the working electrode relative to reference electrode (SCE)
with absence of external potential or current. OCP is the measured potential of electrode when the
anodic and cathodic reaction rates are equal, and it can change over time a resulting from surface
changes of sample. OCP of the sample is a thermodynamic parameter which indicates about the

24
tendency of the electrode to participate in electrochemical reactions with surrounding
environments, more positive OCP indicates more noble metal and shows less tendency to
participate in corrosion process [29].
In our work, OCP was measured immediately after the sample had been immersed into the
electrochemical cell in which no potential applied to the cell for 1 hour and repeated for the same
samples after 3, and 7 days to see whether the potential was increased or decreased during the
testing of the specimens. Corrosion measurements should be run after the stable potential is
reached and that takes a certain time depending upon the metal and electrolyte.
3.3.2. Rp/Ec trend test
Rp is the polarization resistance, and the Ec is the corrosion potential. The primary purpose
of Rp/Ec trend technique is to pursue the corrosion rate changes of metal sample as a function of
time. During the Rp/Ec Trend test, a repetitive loop of polarization resistance is running for total
time of experiment in hours with repeat time in minutes. In each test, the sweep potential is applied
within the scan range from initial potential Ei to the final potential Ef, and optimal current is
measured at a fixed time during the potential sweep. When the polarization resistance scan is done,
the electrochemical cell is switched off till the time for the next test, open circuit potential is
recorded prior to the Rp/Ec trend experiment. In general, the polarization resistance is a technique
is used to measure the corrosion current (Icorr) of metal sample in a solution within the few minutes
which is used to estimate the corrosion rate.
In this study, the estimation of corrosion rate is achieved by Rp/Ec trend along 48 hours
with 60 minute as a repeat time, since the Rp/Ec trend is employed the linear polarization resistance
method (LPR) to estimate the corrosion rate in steel samples, assuming the linear relationship of
measured corrosion current with applied potential, usually within (10-20 mV) range [22].

25
3.3.3. EIS test
The electrochemists and material scientists were discovered the power of electrochemical
impedance spectroscopy as a useful technique to study sophisticated and difficult systems around
the beginning 1970s [45].
EIS test is used to evaluate the interface properties between a substrate and conductive
electrolyte solution. Potentiostat device with counter and reference electrodes that are immersed
in electrolyte solution are required to perform EIS experiments. This potentiostat is employed for
applying both DC potential and small superimposed AC excitation to working electrode which is
immersed in conductive solution. After AC current and potential measurements are collected over
a very wide range of frequency excitation, then the collected data of current and potential of
electrochemical cell are converted into complex impedance vs. frequency curve. DC current and
potential values also should be measured. The impedance-frequency plot analysis produces useful
information about metal and dielectric properties that are not available accurately or easily form
other electrochemical tests. The main applications of EIS test are coating performance evaluation,
electrochemical mechanisms and rate analysis, and battery performance.
EIS can predict the change of coating on a substrate before any visible defects or damages
appear. Since EIS is very sensitive detector for change conditions of coatings and substrates. EIS
is not a destructive technique, and EIS spectrum is utilized to make a comparison among different
EIS spectrums. Electrochemical techniques are normally used for conductive materials such as
metals, batteries, etc. Electrochemistry is a common technique used to study the metal corrosion
and protective coatings, which are applied to control corrosion of metals on marine and industrial
environmental conditions [46].
26
EIS techniques is useful for coating performance evaluation on the metals surfaces, since
EIS can measure the failure of protective coating caused by exposure for electrolyte solution, and
the substrate corrosion rate increasing due to penetration of electrolyte into substrate after coating
deterioration. In EIS experiment, an AC potential over a wide range frequency range is applied to
the metal sample. Using high and low frequency allows for EIS to collect so much information in
one EIS experiment, since this feature gives EIS a super advantage over other DC electrochemical
techniques [46].
EIS techniques information includes resistances and capacitances values in the
electrochemical system. For quantifying the physical and chemical parameters, an appropriate
equivalent electrical circuit should be selected and each element in equivalent circuit simulate a
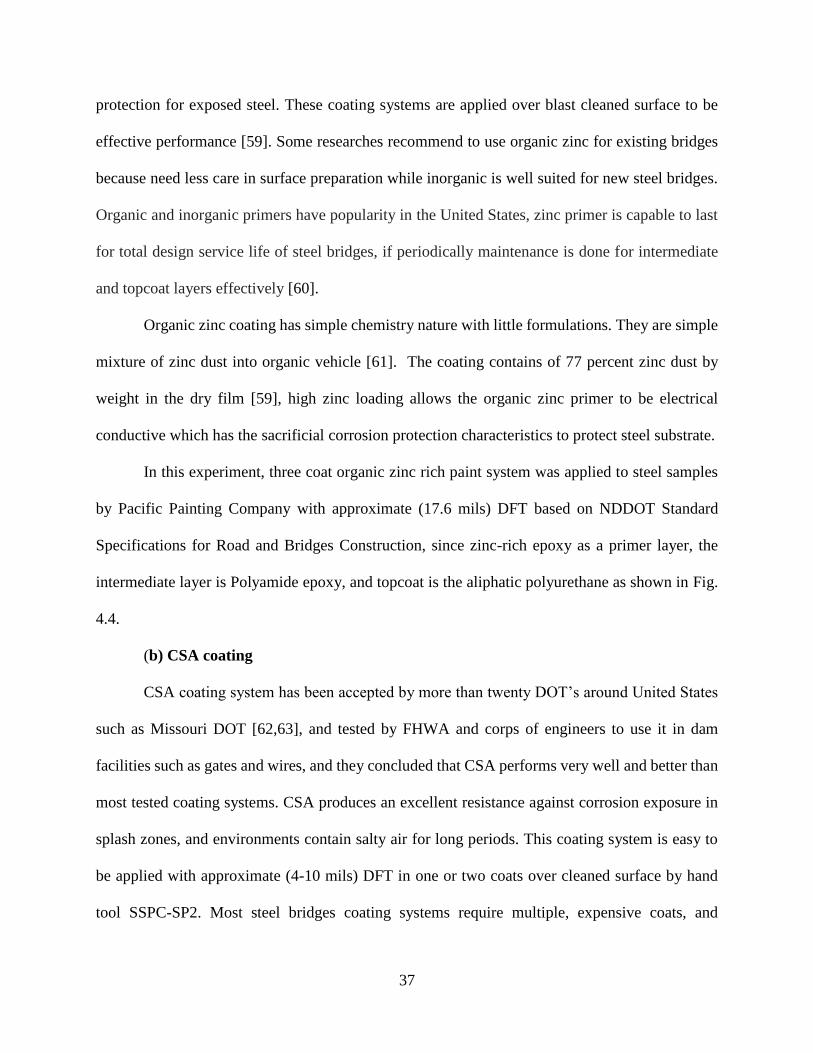
specific parameter of the sample [46]. The most commonly used models for fitting the EIS
experiment results by researchers to measure the corrosion resistance of steel samples with and
without coating are illustrated in Fig. 3.5 [47].
Since Rs represents the electrolyte solution resistance and it is usually very low value and
can be neglected [48]. Rct symbolizes charge transfer resistance, CPEdl symbolize double layer
capacitance, coating resistance is represented by Rc, and coating capacitance CPEc. In the
beginning, Rct and Rc are quite high values and they decrease with time as a result of coating failure
and corrosion attack after electrolyte solution penetration into substrate [48]. Due to the non-
homogeneity in corrosion process, capacitance was replaced by constant phase element CPE in the
equivalent electric circuit models [47]. Periodic EIS experiments should be carried out to evaluate
the coating performance about it is failure, then coating failure rate can be measured and coating
series may be ranked in a specific exposure conditions. Testing a specific type of metal or coating
requires testing the sample in service environmental conditions the metal or coating will encounter.

27
Then an index should be selected to track the metal or coating changes such as resistance or
capacitance. EIS results may vary depending on metal substrate, coating type, thickness, and
number of layers [48]. In this study, EIS tests were performed with 5-points/ decade versus open
circuit potential with a sinusoidal potential excitation of 10 mV and frequency ranging from 100
kHz to 0.005 Hz, since the sweep usually starts from the higher to the lower frequencies to
minimize the perturbation of samples [49].
3.3.4. Potentiodynamic polarization test
The potentiodynamic polarization electrochemical technique is generally used to examine
and interpret the corrosion behavior of metal/ solution system. It produces useful qualitative data
that are used for graphing and plots comparison. In a potentiodynamic technique, the potential of
metal sample is controlled, since the potential sweep is changed slowly over a wide potential range,
and corrosion rate (current) is measured. During the potential sweep, anodic and cathodic reactions
take place in the surface of the metal specimen.
The graphical results of potentiodynamic polarization is plotted as a relationship between
current changes resulting from potential (driving force) changes over a wide potential range,
common presented graphs as potential verses log corrosion density, often known as Stern or Evans
diagram. The potential verses log current density graph produces useful such as corrosion potential
(Ecorr), a rough estimated corrosion current, passivation, localized corrosion (e.g., pitting
corrosion) and mechanistic studies. Generally it is not recommended to employ the
potentiodynamic results for corrosion rates estimation, because a high scan rate used for
acquisition of current results, and the traditional potentiodynamic test is considered as destructive
test, since the a utilization wide potential rate may cause changes in specimen surface that gives

28
inaccurate corrosion estimation. The potentiodynamic tests requires more electrochemical
backgrounds to interpret the results than other electrochemical tests [50].
In this study, the potentiodynamic polarization test was run as the last experiment after EIS
tests because it is a destructive test and the surface will degrade over the tests.
3.3.5. Summary of the methods and their applicability
A summary of these methods in Sections 3.3.1-3.3.4 in quantifying corrosion behavior and
corrosion mechanism is listed as shown in Table 3.1. The factors that affect corrosion behavior
considered in these methods are summarized, and their applicability.
3.4. Corrosion Current and Corrosion Rate Predictions
Corrosion current Icorr is a necessary parameter, which is used for predicting corrosion rate.
Icorr cannot be measured by direct way, but be estimated from galvanic cell and polarization
resistance, such as Tafel method or polarization resistance data. Based on potential-log current
plot, corrosion current can be identified and employed to calculate corrosion rate of metals. Sweep
the potential within the scan rate ±0.5 volt from the OCP and fitting the log current-potential plot
to obtain a theoretical model, which used to calculate corrosion rate. The electrochemical reactions
obey the Tafel equation by the form.
𝐼 = 𝐼0 𝑒2.303(𝐸−𝐸0)/𝛽 (3.5)
where:
𝐼 : The reaction current.
𝐼0 : Reaction dependent constant called the exchange current.
E : Electrode potential.
𝐸0 : Equilibrium potential.
𝛽 : Tafel constants of reaction.

29
Butler-volmer equation describe both cathodic and anodic reactions in corrosion system as
follows:
𝐼 = 𝐼𝑐𝑜𝑟𝑟 . 𝑒2.303(𝐸−𝐸𝑐𝑜𝑟𝑟)/𝛽𝑎 - 𝑒2.303(𝐸−𝐸𝑐𝑜𝑟𝑟)/𝛽𝑐 (3.6)
where:
𝐼 : Reaction current.
𝐼𝑐𝑜𝑟𝑟 : Reaction dependent constant called the exchange current.
E : Electrode potential.
𝐸𝑐𝑜𝑟𝑟 : Equilibrium potential.
𝛽𝑎 : Anodic Tafel constants of reaction in volts/ decades.
𝛽𝑐 : Cathodic Tafel constants of reaction in volts/decades.
When 𝐸 = 𝐸𝑐𝑜𝑟𝑟 in Eqn. (3.6), the exponential terms equal one and thus the current of
electrochemical cell equals zero. Within the small scan range potential sweep, both anodic and
cathodic reaction contribute to overall measured electrochemical cell current. With scan range
increasing far from the OCP, anodic or cathodic reaction become predominates the cell current
and the other reaction can be neglected. At that moment, the log current verses potential will be a
straight line. Polarization resistance (ohm) is the slope of the straight line which is employed with
Tafel slope coefficients (𝛽𝑎 , 𝛽𝑐 ) to measure corrosion rate by Stern-Geary equation in the
following:
𝐼𝑐𝑜𝑟𝑟 = 1
𝑅𝑃
𝛽𝑎∗𝛽𝑐
2.303(𝛽𝑎+𝛽𝑐) (3.7)
Then Faraday’s law according to the following formula can measure corrosion rate:
𝐶𝑅 = 𝐼𝑐𝑜𝑟𝑟𝐾 𝑊𝑒𝑞
𝜌𝐴 (3.8)

30
where:
𝐶𝑅 : Corrosion rate in mm/year or milli-inch/year.
𝐾 : Constant define the unit of calculated corrosion rate.
Weq : Equivalent weight (g/equivalent).
𝜌 : Density of material (g/cm3).
𝐴 : Sample area (cm2).
Polarization resistance can be approximated from potentiodynamic technique near OCP or
using stepwise potentiostatic polarization using single small potential step ∆𝐸 within the ±10 mv,
and ±5, 20 mv are commonly used. After steady state achieved, the current of working electrode
is measured to yield plot current verses potential and in modern program, the potential- log current
density is plotted. [51].
3.5. Summary
Weldment corrosion is one of the leading causes in structural failures, while corrosion
mechanism of steel bridge welds may be influenced by base metal, filler materials, and welding
processes. Different to other structural welds, steel bridge welds are severely exposed to aggressive
environments and ever-increasing traffics, thereby leading to being more vulnerable to corrosion
initiation and corrosion-induced failures. Four types of methods are identified for determining the
corrosion behavior of metals, while the tests results will help to yield the corrosion current and
corrosion rate of interest. Those information helps to guide the experimental plans and data
collection in the following chapter.
31
Table 3.1: Electrochemical testing methods and their applicability
Methods Corrosion
tendency
Coating
performance
PWC
effects
Corrosion
rate
OCP √ √ × ×
Rp/Ec Trend √ × √ √
EIS √ √ × ×
Potentiodynamic polarization √ √ √ √
Figure 3.1: Schematic diagram of electrochemical corrosion cells on iron [52].
32
Figure 3.2: Schematics of various single-pass HAZ regions in butt-welded steel.
Figure 3.3: Coating failure and steel corrosion at local areas [53].
Coarse-gained HAZ
(CGHAZ)
Weld metal Unaffected base metal
Fine-gained HAZ
(FGHAZ)
Inter-critical HAZ
(ICHAZ)
Sub-critical HAZ
(SCHAZ)
Fusion
line
HAZ
33
Figure 3.4: Comparison of different coatings over 20 years [36].
Figure 3.5: Equivalent electrical circuit models for a) uncoated and b) coated samples [47].
Per
form
ance
index

34
CHAPTER 4. EXPERIMENTAL PROGRAM
4.1. Introduction
This chapter is to present a comprehensive experimental study for understanding corrosion
behavior of steel bridge welds. Four electrochemical testing methods, as identified in Chapter 3,
are used in this study for quantify the critical information, including corrosion initiation, coating
performance at welded regions, and corrosion rate. Detailed experimental program is presented
below.
4.2. Experimental Plan
An experimental plan, illustrated in Fig. 4.1, is developed to fully consider the corrosion
behavior of welds and coating performance in welds through four electrochemical tests, as
identified as three objectives in this study.
OCP testing will be used to quantify both Objectives 1 and 3 as identified in Chapter 1:
corrosion tendency and coating performance in welds; Rp/Ec trend testing will be used for
determining corrosion behavior of welds over time (Objective 1) and also understanding the PWC
effects in welds (Objective 2). EIS testing will be used to identify corrosion mechanism of welds
and also corrosion resistance affected by coating systems, while potentiodynamic polarization
testing will be used to quantify both coating performance and PWC effects in welds. The matrix
testing is illustrated in Table 4.1.
4.3. Material Preparation
The experiments were planned to investigate the corrosion behavior of welded joints in
steel bridges with and without three types of coating. Steel specimens were designed as plates with
a 3 by 3 by 0.25 in. dimension with and without coatings. All experimental test samples were
cleaned using dry sand blasting with suitable profile.

35
4.3.1. Chemical compositions for bridge steel
Bridge steel is used as major structural materials in steel bridges to withstand the traffic-
induced fatigue loading and severe environments. Thus the bridge steel usually has some favorable
mechanical properties, including high fracture toughness, and high resistance to corrosion. Two
commonly used bridge steels: AASHTO M270/ASTM A709 grades 50 (A572) and 50W (A588)
[54] are selected in this study. The chemical composition for two bridge steels are listed in Table
4.2. As stated in [55] ASTM A572 grade 50 steel exhibits the higher strength obtained from the
small amounts of vanadium with 0.01-0.15% (see Table 4.2), as compared to carbon-manganese
chemistry of conventional A 36 steel, while weathering A588 steel has enhanced corrosion
resistance from combinations of copper (with 0.25-0.4%) and chromium (0.4-0.65%), as compared
to the grade 50 chemistry.
4.3.2. Welding process
Steel plate samples were welded through the butt joint using the shielded metal arc welding
(SMAW). The SMAW is known as a stick welding in steel bridges construction, in accordance
with the AWS codes and standards [56]. Designated filler material (E7018) was recommended by
the AWS D1.1/D1.1M specifications (see AWS D1.1/D1.1M, Table 3.1) for A572 and A588 steels.
The chemical composition of the selected filler material, and welding parameters are given in
Tables 4.3 and 4.4, respectively. A completed welded sample is illustrated in Fig. 4.2. The sample
has a full weld penetration, proper shape and counter as shown in Fig. 4.2.
4.3.3. Coating
Protective coatings are usually used to protect steel bridges against corrosion due to harsh
environments. Bridge coating system mainly consists of a primer, undercoat layer and topcoat with
a certain predetermined thickness, as schematically shown in Fig. 4.3. Each layer has a specific

36
function. The primer is applied on blast cleaned surface and is to provide prevention of moisture
penetration into steel surfaces through defects and faults that may occur during application process
of coating to steel substrate. The main primer function is not to resist the environmental conditions,
but helps to protect exposed steel as sacrificial metals, and therefore adequate topcoat must be
applied [58].
Many factors should be considered to select appropriate coating systems for varying bridge
types, traffic and environmental conditions. Besides protection against corrosion, the protective
coatings should have other favorable features, including low cost, maintenance free and easy
installation. Fig. 3.4 plots the results of actual bridge coating performance in field over 20 years.
Metallizing coating (hard coating) exhibited the best performance and there is a minimum
degradation over 20 years. The second best coating system is three coat organic/inorganic zinc rich
paint systems, referred as 3-coat system. This coating performs well over 7-10 years without repair.
Calcium sulfonate alkyd (CSA) are also commonly accepted coating in bridge owners and agencies.
Thus, these three coating systems are selected in this study to quantify the coating performance in
welds.
(a) 3-coat system
The most popular bridge coating system is the 3-coat system by use of organic/inorganic
zinc-rich primer, epoxy intermediate, and urethane topcoat. This 3-coat system has the most
popularity in department of transportations (DOTs) in the United States, such as Ohio,
Pennsylvania, and Michigan [57].
Zinc-rich coating for steel bridges grouped into two categories; inorganic and organic zinc,
both of them apply directly to steel surfaces in multicoated system. The significant attractive
characteristic for these coating is electrical conductivity, which is created to provide sacrificial
37
protection for exposed steel. These coating systems are applied over blast cleaned surface to be
effective performance [59]. Some researches recommend to use organic zinc for existing bridges
because need less care in surface preparation while inorganic is well suited for new steel bridges.
Organic and inorganic primers have popularity in the United States, zinc primer is capable to last
for total design service life of steel bridges, if periodically maintenance is done for intermediate
and topcoat layers effectively [60].
Organic zinc coating has simple chemistry nature with little formulations. They are simple
mixture of zinc dust into organic vehicle [61]. The coating contains of 77 percent zinc dust by
weight in the dry film [59], high zinc loading allows the organic zinc primer to be electrical
conductive which has the sacrificial corrosion protection characteristics to protect steel substrate.
In this experiment, three coat organic zinc rich paint system was applied to steel samples
by Pacific Painting Company with approximate (17.6 mils) DFT based on NDDOT Standard
Specifications for Road and Bridges Construction, since zinc-rich epoxy as a primer layer, the
intermediate layer is Polyamide epoxy, and topcoat is the aliphatic polyurethane as shown in Fig.
4.4.
(b) CSA coating
CSA coating system has been accepted by more than twenty DOT’s around United States
such as Missouri DOT [62,63], and tested by FHWA and corps of engineers to use it in dam
facilities such as gates and wires, and they concluded that CSA performs very well and better than
most tested coating systems. CSA produces an excellent resistance against corrosion exposure in
splash zones, and environments contain salty air for long periods. This coating system is easy to
be applied with approximate (4-10 mils) DFT in one or two coats over cleaned surface by hand
tool SSPC-SP2. Most steel bridges coating systems require multiple, expensive coats, and

38
sandblasting which results lead containments. While CSA supplies a single component, high-solid,
VOC-compliant bridge coat which can be applied in just one coat layer over minimal surface
preparation to protect the structural steel for many years [63].
CSA system is produced from calcium resins, which are used in undercoating products and
automotive rustproofing from 1970s with combing solvent-born alkyd enamels to provide firmer,
harder coating. The calcium sulfonate is considered an extremely corrosion resistant that provides
a barrier protection against moisture, salts, and other sever chemicals. CSA coating systems are
intended to be used in field maintenance coating in aged and weathered steel over lead-based
coating in existing steel bridges and most coating systems without removing the old paints.
FHWA carried out a study to make a comparison among eight one-coat systems including
high-ratio CSA and two control coating systems (two-coat and three-coat system), the
comprehensive performance evaluation demonstrated promising performing for CSA in
accelerated laboratory testing ALT and outdoor exposure conditions. Since the best performance
was the tree-coat system followed by high-ratio CSA [64]. Over past two decades, several credible
evaluation testing reviewed the CSA performance from various manufacturing aspects, all testing
were carried out in accelerated test chambers and different natural exposure environments
concluded that CSA performs very competitively and within the top two or three coating system
being tested in term of corrosion resistance, when tested under control environmental and
laboratory conditions. This indicates that CSA has a good performance relative to other products
marketed for coating applications.
CSA coatings are limited by long time for curing after application, since they tend to be
soft for long time and dry slowly depending on environmental and specific formulating conditions,
this can be a problem in a highway environments with ease to be damaged and containments pickup.

39
So CSA is not the preferred choice if the aesthetics is a main requirement [61]. In this study, all
samples were deposited with the CSA system with approximate (4-10 mils) DFT, as shown in Fig.
4.5, in the standardized spray room at Coating and Polymer Department at NDSU.
(c) Hard coating
Soft coatings have been traditionally used for steel structures protection to isolate the steel
substrates from the corrosive environmental conditions, and enhance the properties against the
corrosion attack. For several advantages, hard coting used and provided indefinitely resistance
period under normal environmental conditions, and the production cost is compensated due to
repeatability and automated application process [65]. Hard coatings are used to enhance the
corrosion protection properties [66]. Thermal spraying method has been utilized to eliminate the
corrosion attack on the steel structures since 1970s [66], since the molten, semi-molten, or powder
is applied to the substrate by thermal spray technique and forming a thin layer of hard coating [68].
High velocity oxygen fuel (HVOF) techniques are widely employed to provide the heat for molten
materials, since the spray gun applies a combustion conditions which implies the mixing the
oxygen and fuel and generating a gas stream with ultrasonic speed. In combustion chamber in
spray gun, the molten material or powder is imparted and combined with gas stream to deposit
onto the surface of substrate [68].
In the mechanical engineering department (NDSU), the HVOF thermal spraying coating
process was applied in closed spray room with a self-contained air conditioning system to deposit
a copper (Cu) layer with approximate 10 mils thickness with feed rate 60 gr/min, 75 psi fuel
pressure, 210 psi oxygen pressure, and 520 psi air pressure under a temperature of Typical coated
samples are shown in Fig. 4.6.

40
4.4. Test Setup and Instrumentation
Four electrochemical tests are conducted using the Gamry Equipment (Reference 600
potentio/Galvanostat/ZRA) under accelerated corrosive environments. The test setup is shown in
Fig. 4.7. The Corrosion testing will have two opposing anodic and cathodic reactions. As clearly
illustrated in Fig. 4.7, the test sample is connected to additional electrodes that are immersed in
an electrolyte solution. A potentiostat, illustrated in Fig. 4.7, is employed to control the potential
difference between working electrode (sample) and reference electrode, and measures the current
cell between counter (Auxiliary) electrode, which are involved in electrochemical cell with three
electrodes (Working, reference, and counter electrode) [29].
a). Working electrode:
In corrosion system, the representative small sample of studied metal serves as working
electrode where the electrochemical reactions occur, since the cell potential is controlled and
measure the cell current flow on the specimen surface. In Gamry device, the representative
sample is connected to green lead (working) and blue (working sense) to green.
b). Reference electrode:
The most common reference electrode is employed in the laboratories is the Saturated
Calomel electrode (SCE) to measure the working electrode potential as shown in Fig. 4.8(a) . In
this study the SCE is also used and connected to white lead [29]. Before and after each test, the
reference electrode potential was measure to see how much the measurement drift. And it was
checked prior the utilization to make sure it was filled with saturated KCl solution.
c). Counter (Auxiliary) electrode:
In general, a noble conductor like platinum or graphite is employed to complete the cell
circuit, since the current flow that produced on working electrode surface leave the electrolyte

41
solution via counter electrode. In this study, Platinum electrode (2.54 cm x 2.54 cm) is connected
to the cell by red lead (counter) and orange lead (counter sense) as shown in Fig. 4.8(b) [29]. Prior
to each test, the counter electrode was cleaned thoroughly and made sure it is free from debris.
4.5. Test Procedures
The objective of this work to study the weldment corrosion behavior of two types of steel
(A588 and A572) for bare (uncoated) and coated samples with three types of coatings (three-coat
system CSA, Hard coating). All experiments were performed under the room temperature. The
accelerated electrochemical corrosion test was carried out by immersion the sample (working
electrode) being tested in 3.5% NaCl electrolyte solution, which has an electrical connection to
allow for electron to flow within the solution.
PVC pipe with 1.5-in. diameter was mounted to the top tested sample surface area with
Loctite glue to keep the working electrode is exposed to electrolyte solution to create an exposure
similar to a highway environment. The exposed metal surface geometric area (11.4 cm2) for bare
(uncoated) samples and for coated samples, and samples were cleaned by dry sandblasting with
suitable profile, washed with distilled water and rinsed in acetone before exposure to
electrochemical corrosion tests as shown in Fig. 4.9.
Steel samples were tested using electrochemical corrosion methods, with 7.87 g/cm3
density and 27.92 equivalent weight as follows:
1) The OCP of all bare and coated samples was measured over an hour.
2) The Rp/Ec trend for bare samples was carried out with a duration of 48 hours at 60
minute repeat time, at -20 to 20 mV vs. Ecorr, scan rate 0.166 mV/sec., and sample rate
by 1 sec. to get curves of corrosion rate over time.

42
3) The electrochemical impedance spectroscopy tests were carried out for both bare and
coated samples with 5 points per decade, 10 mV sinusoidal potential, and frequency
ranging from 100 kHz to 0.005 Hz
4) Potentiodynamic sweep for all samples was measured at -0.3 to 1.5 V vs. Eoc with scan
rate 0.166 mV/sec as recommended by ASTM standards after EIS test.
5) The steel samples and test setups were disassembled and the pictures were taken for
the visual observation.

43
Table 4.1: Test matrix for all the electrochemical tests
Sample/test OCP Rp/Ec
trend EIS Potentiodynamic
3-
Coat CSA Hard Bare
3-
Coat CSA Hard Bare
3-
Coat CSA Hard Bare
3-
Coat CSA Hard Bare
A572UW 3 3 1 3 -- -- -- 3 3 3 1 3 3 3 1 3
A572W 3 3 1 3 -- -- -- 3 3 3 1 3 3 3 1 3
A588UW 3 3 1 3 -- -- -- 3 3 3 1 3 3 3 1 3
A588W 3 3 1 3 -- -- -- 3 3 3 1 3 3 3 1 3

44
Table 4.2: Chemical composition of A588 and A572 [69]
Element Composition,%
A572 A588
Carbon 0.23 max. 0.19 max.
Manganese 1.35 max. 0.8-1.25
Phosphorus 0.04 max. 0.04 max.
Sulfur 0.05 max. 0.05 max.
Silicon 0.15-0.4 0.3-0.65
Nickel ----- 0.4 max.
Chromium 0.005-0.05 0.4-0.65
Copper ----- 0.25-0.4
Vanadium 0.01-0.15 0.02-0.1
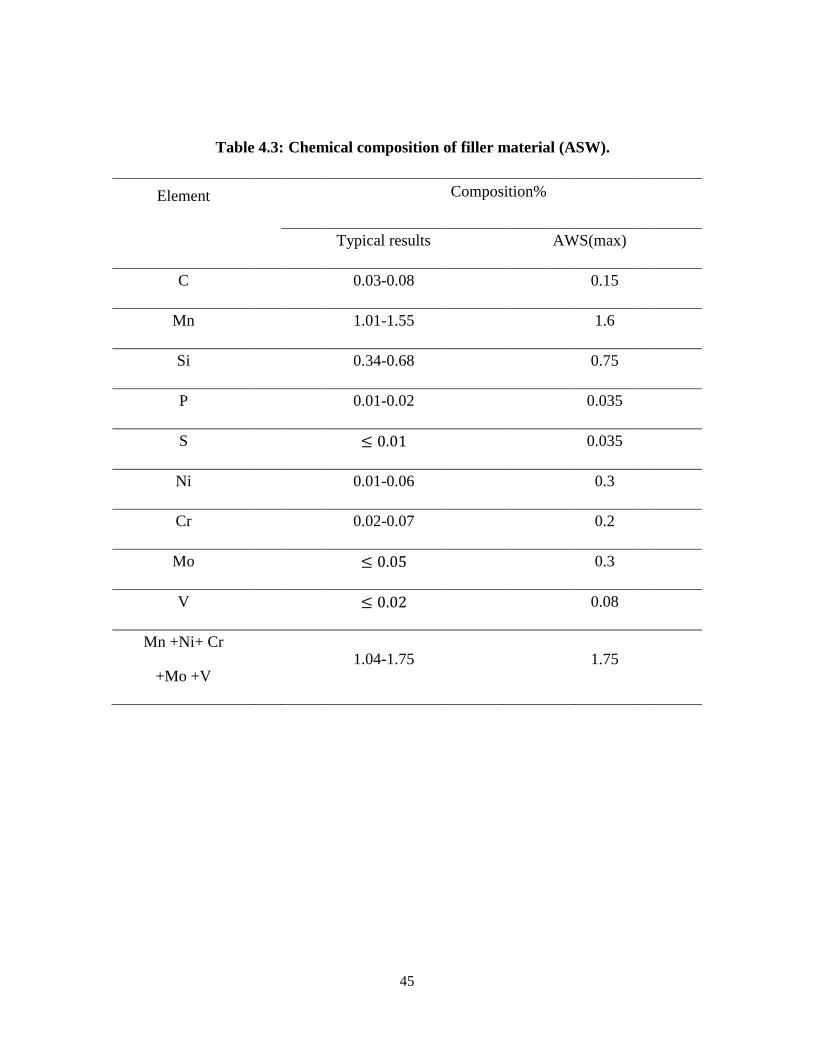
45
Table 4.3: Chemical composition of filler material (ASW).
Element Composition%
Typical results AWS(max)
C 0.03-0.08 0.15
Mn 1.01-1.55 1.6
Si 0.34-0.68 0.75
P 0.01-0.02 0.035
S ≤ 0.01 0.035
Ni 0.01-0.06 0.3
Cr 0.02-0.07 0.2
Mo ≤ 0.05 0.3
V ≤ 0.02 0.08
Mn +Ni+ Cr
+Mo +V 1.04-1.75 1.75
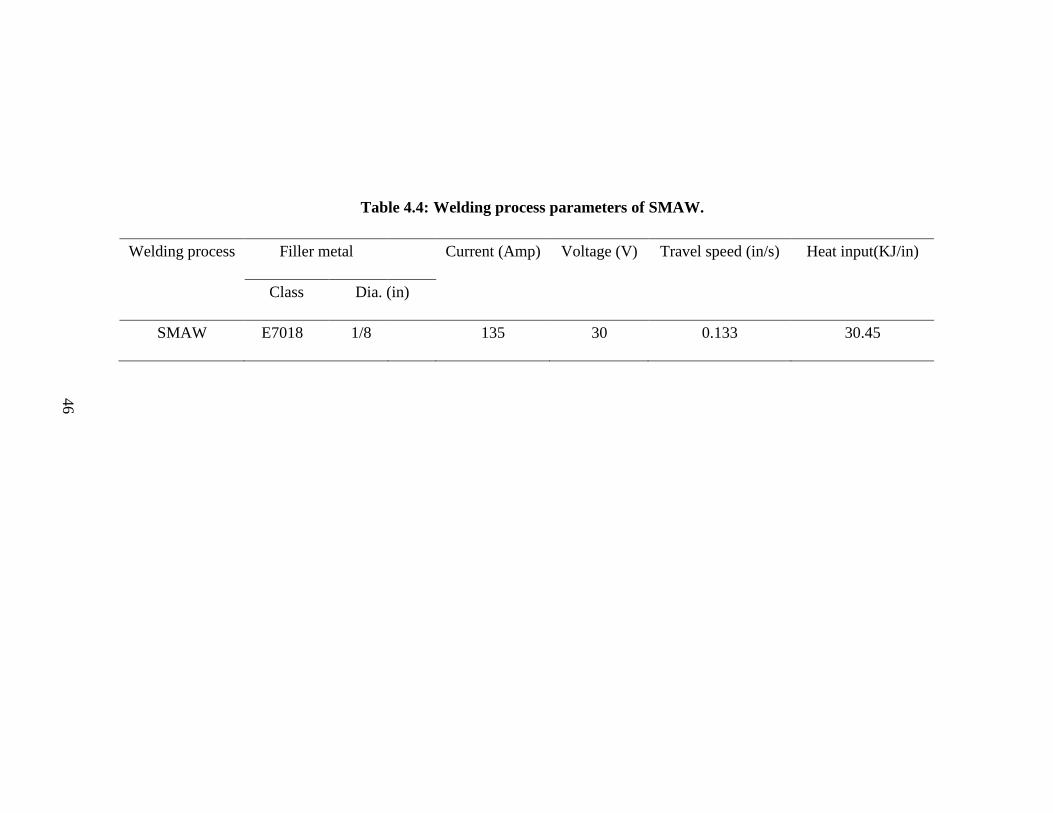
46
Table 4.4: Welding process parameters of SMAW.
Welding process Filler metal Current (Amp) Voltage (V) Travel speed (in/s) Heat input(KJ/in)
Class Dia. (in)
SMAW E7018 1/8 135 30 0.133 30.45

47
Figure 4.1: Flowchart of the proposed experimental plan.
Figure 4.2: Butt joint using SMAW.
1.5 in

48
Figure 4.3: Schematic diagram of a paint system (replot after [70]).
Figure 4.4: Three-coat system samples.
Figure 4.5: CSA samples.
1.5 in
1.5 in

49
Figure 4.6: Hard coating samples.
Figure 4.7: Accelerated corrosion system.
1.5 in

50
(a) (b)
Figure 4.8: (a) Saturated Calomel Electrode and (b) platinum counter electrode.
Figure 4.9: Electrochemical cell under testing

51
CHAPTER 5. CORROSION RESISTANCE OF STEEL BRIDGE WELDS
5.1. Introduction
This chapter will discuss the results through four electrochemical tests and gain basic
understanding of corrosion tendency of bridge steel welds, and also quantify the coating
performances in welds as follows.
5.2. Corrosion Tendency in Welds
5.2.1. Corrosion tendency over three period of time
Open circuit potentials tests were used to quantify corrosion tendency of welds. The OCP
of the sample is a thermodynamic parameter which indicates about the tendency of the electrode
to participate in electrochemical reactions with surrounding environments, more positive OCP
indicates more noble metal and shows less tendency in corrosion process [29]. The potentials were
measured for a period 3600 sec. immediately for the bare and three types of coated samples that
were inserted into 3.5 wt. % NaCl solution. The OCP tests were repeated for the same samples
after 3 and 7 days to record the changes of corrosion tendency over time.
Fig. 5.1 shows the changes in open circuit potentials for all bare and three types of coated
samples up to an hour immediately after immersion. It is almost observed in both steel types the
OCP values for welded samples were lower than unwelded samples regardless of steel or coating
system used with exception of A572 coated sample with hard coating after 7 days (see Table 5.1).
The corrosion potential curves were shifted towards more negative values in all welded samples.
The identical trend was observed after 3- and 7-day immersion as shown in Figs. 5.2 and 5.3
respectively. Corrosion potential of both steel types had similarity in trend regarding to coating
system used to protect the samples from corrosion attack.

52
5.2.2. Corrosion tendency under three different coating system
The 3-coat system, illustrated in Fig.5.4, shows the best corrosion resistance comparing
with other coatings over the experiment period (see Table 5.1). The corrosion potential ranges
between -115.3 mV to -11.18 mV, and no rust or damages appear on any 3-coat samples after the
electrochemical tests. The corrosion potential of CSA coating ranged from – 403.4 mV to -261
mV showing the second highest corrosion resistance for steel bridges. Hard coating provides
unexpected corrosion resistance, since the corrosion potential ranges from -597.6 mV to -467.1
mV due to presence of pores and hair crakes in the surface, which allows for solution penetration
and corrosion initiates, and OCP value was from -970.2 mV to -663 mV for uncoated samples.
The pictures were taken before and after the corrosion tests show the difference among all these
kinds of coatings (3-coat, CSA, and Hard coating) and uncoated samples as shown in Figs. in
appendix.
5.2.3. Summary of corrosion tendency in welds
To sum up, the bridge steel welds exhibit higher corrosion initiation over base metals,
regardless the types of steel or with coatings; Weathering bridge steel (A588) welds show the
higher resistance to corrosion initiation, as compared to low carbon iron steel (A572). Moreover,
the protective coating systems can delay the corrosion initiation at the welds, thus enhancing the
corrosion resistance of bridge steel welds.
5.3. Corrosion Behavior over Time and PWC Effects in Welds
Experimental plan shown in Fig. 4.1 identified two testing methods: a) Rp/Ec trend and b)
EIS tests, for determining the corrosion behavior over time. Also the PWC effects in welds will
be identified by the Rp/Ec trend or the Potentiodynamic polarization tests.
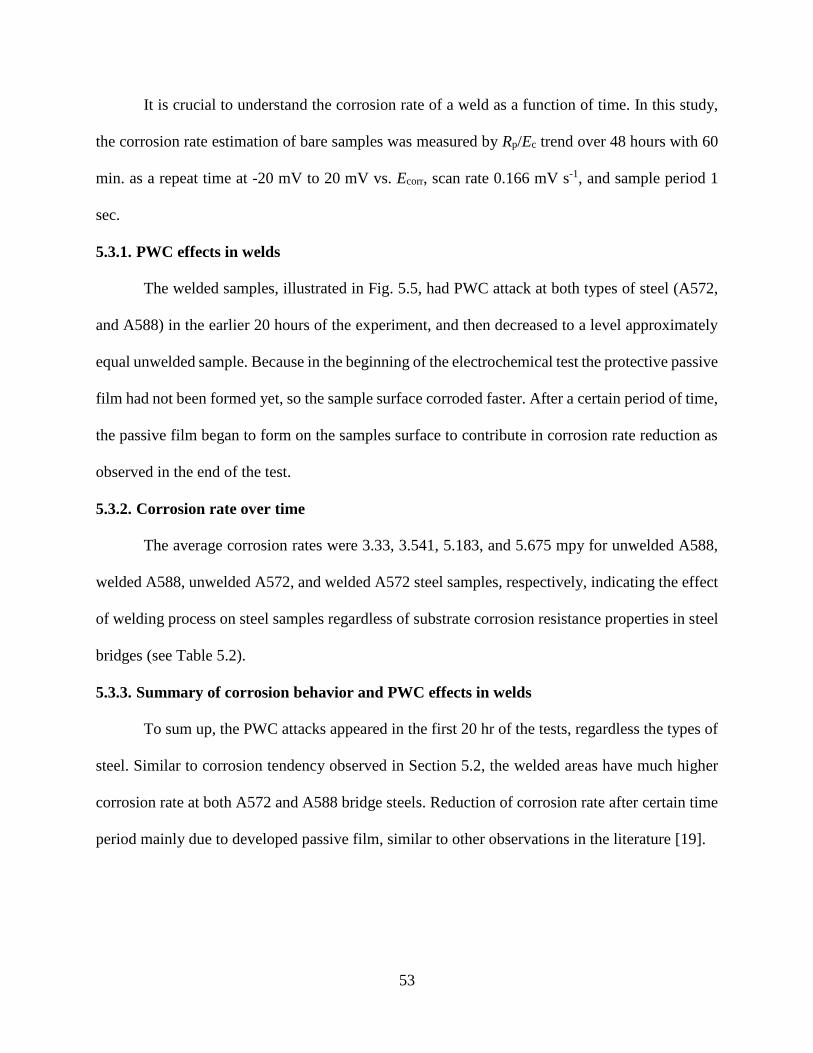
53
It is crucial to understand the corrosion rate of a weld as a function of time. In this study,
the corrosion rate estimation of bare samples was measured by Rp/Ec trend over 48 hours with 60
min. as a repeat time at -20 mV to 20 mV vs. Ecorr, scan rate 0.166 mV s-1, and sample period 1
sec.
5.3.1. PWC effects in welds
The welded samples, illustrated in Fig. 5.5, had PWC attack at both types of steel (A572,
and A588) in the earlier 20 hours of the experiment, and then decreased to a level approximately
equal unwelded sample. Because in the beginning of the electrochemical test the protective passive
film had not been formed yet, so the sample surface corroded faster. After a certain period of time,
the passive film began to form on the samples surface to contribute in corrosion rate reduction as
observed in the end of the test.
5.3.2. Corrosion rate over time
The average corrosion rates were 3.33, 3.541, 5.183, and 5.675 mpy for unwelded A588,
welded A588, unwelded A572, and welded A572 steel samples, respectively, indicating the effect
of welding process on steel samples regardless of substrate corrosion resistance properties in steel
bridges (see Table 5.2).
5.3.3. Summary of corrosion behavior and PWC effects in welds
To sum up, the PWC attacks appeared in the first 20 hr of the tests, regardless the types of
steel. Similar to corrosion tendency observed in Section 5.2, the welded areas have much higher
corrosion rate at both A572 and A588 bridge steels. Reduction of corrosion rate after certain time
period mainly due to developed passive film, similar to other observations in the literature [19].

54
5.4. Corrosion Behavior of Welds under Varying Coating Systems
EIS curves were collected using single sinusoidal excitation of 10mV magnitude, where
the frequency domain varied over 100 kHz to 0.005 Hz at stabilized open circuit potential (OCP)
after 60-min immersion. EIS diagrams of the bare and coated steel samples in 3.5 wt. % NaCl are
illustrated for immediately, 3-day and 7-day immersion as Nyquist and Bode plots in Figs. 5.6
through 5.8, respectively. All EIS curves were fitted using the EEC models (Fig. 3.5).
It is observed from phase angle frequency curves in Figs. 5.6 through 5.8, for bare steel
samples, it is appeared single time constant which is related to the solution/substrate steel
properties, where the corrosion process initiates representing the charger transfer resistance and
double layer capacitance parameters. Two time constants in coated samples for all types of used
coating, though just one time constant is appeared for 3-coat . For coated samples, the first time
constant at high frequency is related to dielectric properties of coatings, while the second one at
low frequency is associated with steel corrosion process [47]. It also can be seen from the Nyquist
plots that the 3-coat system show the bigger radius among all coated samples, indicating that the
3-coat system provides the better corrosion resistance compared to all coated samples.
5.4.1. Corrosion behavior in welds
Corrosion parameters are extracted from equivalent electrical circuit (EEC) models for bare
and coated steel samples are illustrated in Fig. 5.9, where Rct represents the charges transfer
resistance, and Cdl represents the double layer capacitance. Rct value is considered an appropriate
parameter to evaluate the protective coating properties as a corrosion rate of substrate, which can
be estimated from Stern-Geary equation. Rct decreases with time for coated samples [49]. Rct is
proportional inversely with the corrosion rate estimation of metal and it is parameter indicate how
much the ease of electron transfer through the surface of metals [71].

55
5.4.2. Coating performance in welds
Double layer capacitance (Cdl) is almost one order higher than the coating capacitance Cc,
and all agree that Cdl estimate the disbonded area of coating [49]. It should be noted that the
double layer capacitance reflect the same meaning of the charges transfer resistance, which
implies the higher double layer capacitance, the lower charge transfer resistance value. Solution
resistance is usually very low value and can be neglected [48].
As indicated in Fig. 5.9, the 3-coat samples show the lowest double layer capacitance
(Cdl) values and the highest charge transfer resistance (Rct) values among all samples, indicating
the best corrosion resistance of this kind of coating system, followed by CSA. Fig. 5.10 presents
the dielectric properties of two types of coatings (3-coat, and CSA) in terms of both coating
capacitance Cc and coating resistance Rc. Generally, these two parameters are related to dielectric
coating properties, thickness, microstructure of coating, and they reflect how much the degree of
coating ability to resist the penetration of electrolyte solution and diffusion of solution test into
the coating system, respectively [72]. As seen in Fig. 5.10, the 3-coat samples show the highest
coating resistance and the lowest coating capacitance among all coated samples followed by
CSA coating, which indicates the best corrosion resistance for the 3-coat samples. The main
difference is maybe due to microstructure of coating surface and thickness.
Potentiodynamic polarization experiment was carried out at a scan rate of 0.166 mV s-1
over the potential ranging from -300 mV to 1500 mV (SCE) for the bare and three types of
coated samples in 3.5 wt. % NaCl electrolyte solution after 7 days from immersion time for the
same samples being tested, and the results are illustrated in Fig. 5.11. Corrosion potential
measurements should be run after the stable potential reached, so the tested samples were under
open-circuit potential in electrolyte solution for 60 min to get steady state corrosion potentials.

56
should be run after the stable potential reached, so the tested samples were under open-circuit
potential in electrolyte solution for 60 min to get steady state corrosion potentials.
Fig. 5.11 shows anodic and cathodic polarization linear curves for two types of carbon
steels in respective solution with and without welding for bare and various coated samples. These
curves were measured potentiodynamically with a rate of 0.166 mV s-1 to plot a current density
with potential relationship, where in welded bare and coated samples it is clearly seen that the
corrosion potentials (Ecorr) shifted towards negative value, indicating the influence of welding
process on both steel types no matter if the samples are coated or not. It should be noted the
protective coatings reduce the corrosion on steel bridges as observed from different used coatings
in this study comparing with uncoated samples.
As listed in Table 5.5, the comparison among three coated samples (3-coat system, CSA,
and hard coating) reveal that the 3-coat organic coating system is the best coating to protect the
steel bridges specially in critical zones like weldments, where it shown very low tendency to
corrode comparing with bare and coated samples which were painted with CSA and hard coating.
The corrosion potential was ranging from -138 mV to -36 mV for 3-coat system, -448 mV
to -344 mV for CSA, - 865 mV to -569 mV for hard coating, and -755 mV to -735 mV for uncoated
samples. It seen from results the best corrosion for three coat system, for that three-coat system
has a popularity over united states, and it is recommended by researchers to use for bridges
especially for existing steel bridges because it needs less care in surface preparation resulting in
reducing the cost of coating. Since the zinc primer is capable to last for total service design of steel
bridges if periodically maintenance is done for intermediate and topcoat layers effectively [60].
The CSA system performs very well, which is comparable to 3-coat system. The using this
kind of costing is still under testing. CSA is very economically cost comparing with three-coat

57
system which is common used in steel bridges currently, because CSA provides saving money and
time for state or who owns the steel bridges. Since it is not required to remove the old paints on
the substrate completely, so the owner of steel bridges may paint a lot of bridges with less cost and
time. Hard coating gave an unanticipated behavior. It is mainly because no topcoat is applied on
the hard coating.
5.4.3. Summary of coating performance in welds
All three types of coating that were used in this study can be employed to delay and slow
down the corrosion process as observed from experimental results in different levels. The 3-coat
shows the best corrosion resistance performance to protect the steel bridges form corrosion attack
form severe corrosive conditions especially in welds. Comparing with 3-coat system, the CSA
coating provides a promising coating to protect steel bridges with less cost and time. In conclusion,
all tested samples can be ranked in ascending order in terms of corrosion resistance behavior as
uncoated, Hard, CSA, 3-Coat system. All parameters were extracted from EIS diagrams are listed
in Tables 5.3 and 5.4 for A572 and A588 steel samples.
It is clearly for observation that the welded joints more susceptible to initiate corrosion
comparing unwedded parts in steel bridges. Since all potentiodynamic curves were shifted towards
the negative values, and generate high current density. Protective coatings are able to delay the
corrosion initiation and slow down the corrosion rate with different levels (see Table 5.5)
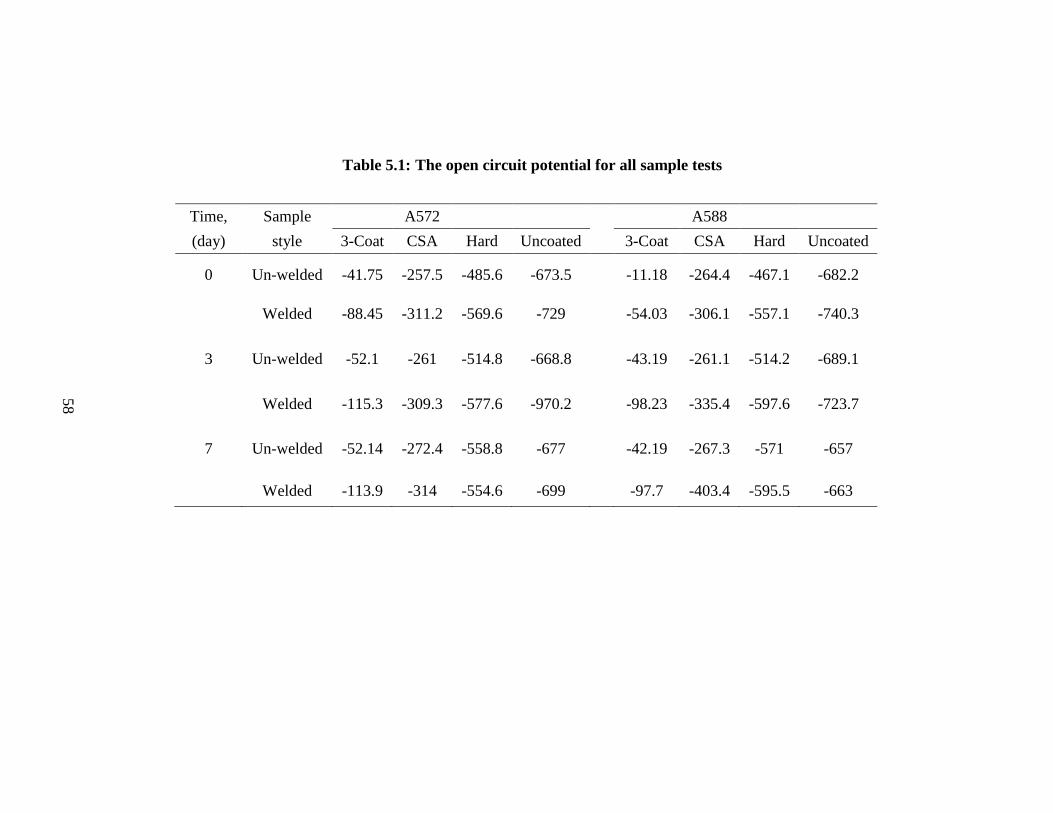
58
Table 5.1: The open circuit potential for all sample tests
Time, Sample A572 A588
(day) style 3-Coat CSA Hard Uncoated 3-Coat CSA Hard Uncoated
0 Un-welded -41.75 -257.5 -485.6 -673.5 -11.18 -264.4 -467.1 -682.2
Welded -88.45 -311.2 -569.6 -729 -54.03 -306.1 -557.1 -740.3
3 Un-welded -52.1 -261 -514.8 -668.8 -43.19 -261.1 -514.2 -689.1
Welded -115.3 -309.3 -577.6 -970.2 -98.23 -335.4 -597.6 -723.7
7 Un-welded -52.14 -272.4 -558.8 -677 -42.19 -267.3 -571 -657
Welded -113.9 -314 -554.6 -699 -97.7 -403.4 -595.5 -663
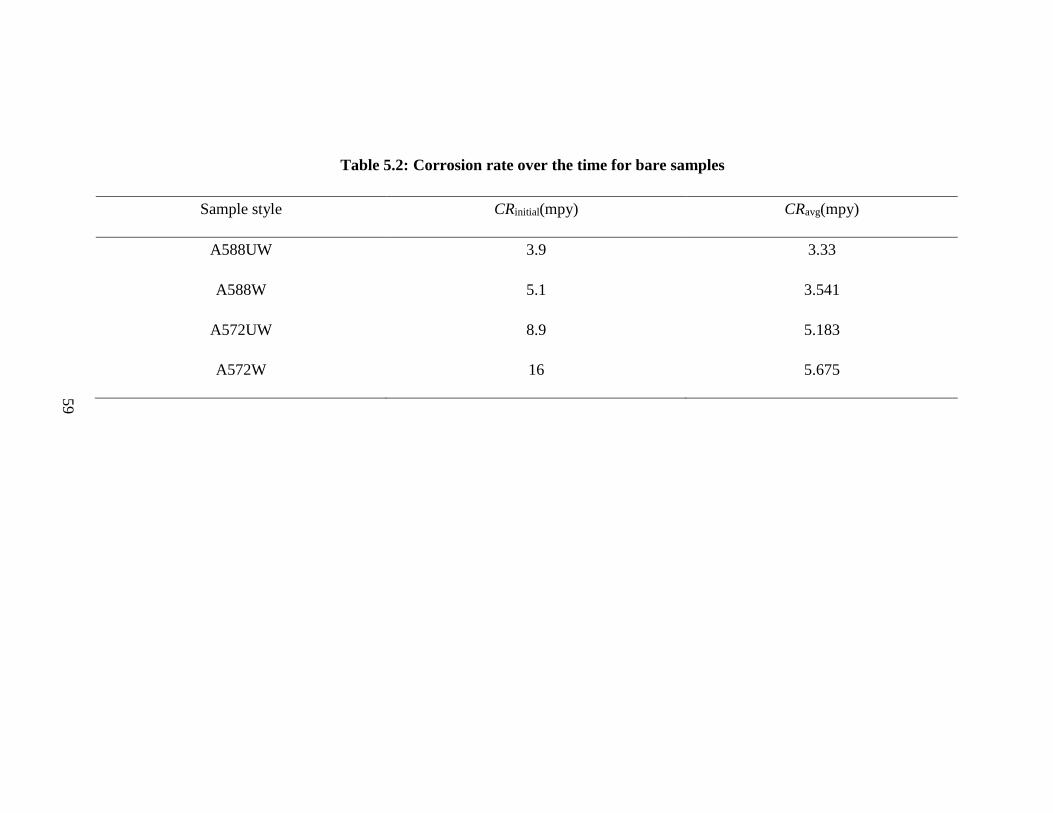
59
Table 5.2: Corrosion rate over the time for bare samples
Sample style CRinitial(mpy) CRavg(mpy)
A588UW 3.9 3.33
A588W 5.1 3.541
A572UW 8.9 5.183
A572W 16 5.675

60
Table 5.3: Electrochemical impedance and corrosion parameters of A572 steel samples in NaCl solution.
Time, Sample A572UW A572W
(day) style Rct Cdl Rc Cc Rct Cdl Rc Cc
0 3-Coat 9.74E9 8.59E-10 1.6E5 6.42E-11 5.57E9 8.73E-10 6.8E4 4.56E-11
CSA 3.67E6 5.18E-7 6.89E4 2.03E-10 1.59E6 1.19E-7 5.3E4 4.91E-10
Uncoated 1.21E3 3.35E-3 --- --- 1.16E3 7.93E-3 --- ---
3 3-Coat 7.1E9 7.92E-10 1.83E7 1.19E-10 5.81E9 8.95E-10 1.77E7 1.05E-10
CSA 2.7E6 1.36E-6 3.6E5 1.17E-10 2.98E5 6.38E-6 4.61E3 4.43E-9
Uncoated 2.89E2 1.97E-3 --- --- 1.02E2 8.26E-3 --- ---
7 3-Coat 7.25E9 9.29E-10 3.76E4 5.38E-11 2.32E9 5.62E-9 3.47E6 1.42E-9
CSA 8.67E5 1.65E-8 6.09E4 1.81E-9 1.46E5 1.46E-5 2.6E5 4.32E-9
Uncoated 3.35E2 4.84E-3 --- --- 91.14 0.106 --- ---

61
Table 5.4: Electrochemical impedance and corrosion parameters of A588 steel samples in NaCl solution.
Time, Sample A588UW A588W
(day) style Rct Cdl Rc Cc Rct Cdl Rc Cc
0 3-Coat 8.15E9 7.56E-10 2.16E7 1.23E-10 7.09E9 7.82E-10 2.18E7 1.26E-10
CSA 1.61E6 1.76E-6 4.24E5 9.42E-11 2.44E5 1.96E-5 8.21E5 4.61E-6
Uncoated 9.53E2 4.74E-3 --- --- 9.45E2 4.58E-3 --- ---
3 3-Coat 6.03E9 9.39E-10 1.73E7 1.16E-10 4.74E9 8.26E-10 8.29E4 3.9E-11
CSA 3.94E6 2.99E-6 2.03E5 7.89E-11 7.43E5 9.08E-8 1.42E4 1.71E-6
Uncoated 8.54E1 3.99E-2 --- --- 8.52E1 5.05E-2 --- ---
7 3-Coat 5.42E9 7.42E-10 1.91E7 1.08E-10 4.86E9 8.39E-10 2.24E7 1.07E-10
CSA 1.85E5 2.92E-5 1.05E4 2.76E-9 1.15E5 5.84E-5 8.23E2 4.87E-8
Uncoated 4.62E2 1.82E-3 --- --- 4.01E2 3.17E-3 --- ---
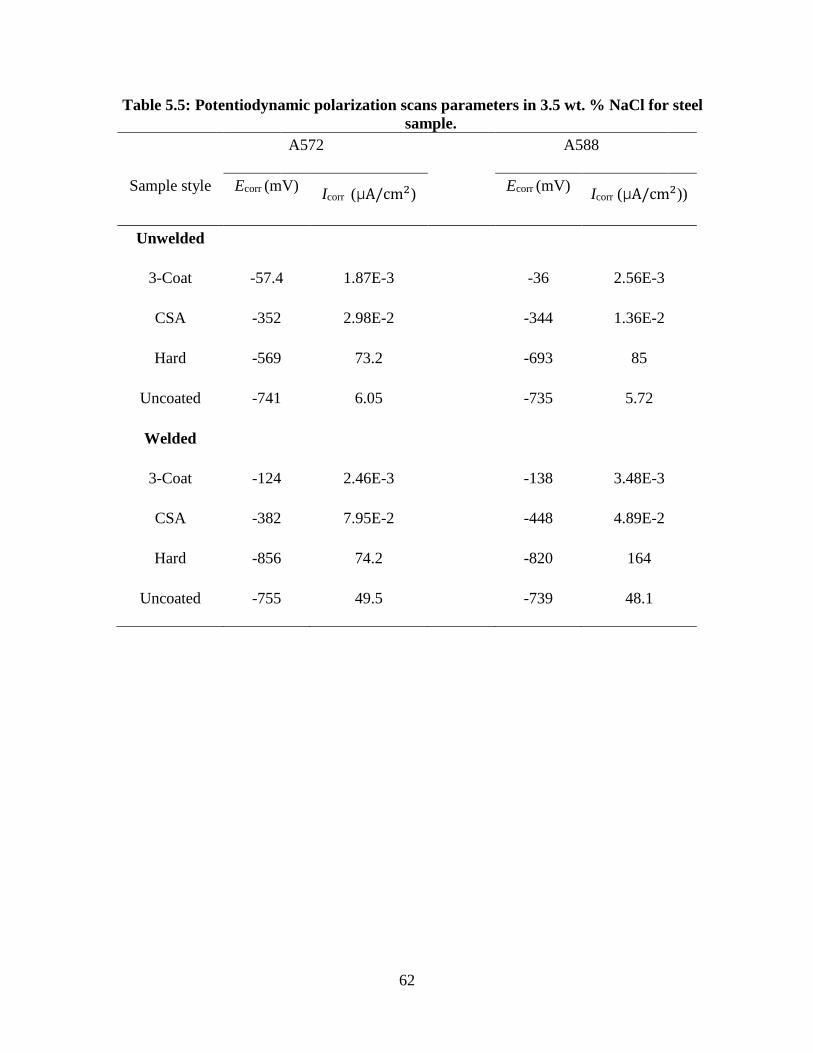
62
Table 5.5: Potentiodynamic polarization scans parameters in 3.5 wt. % NaCl for steel
sample.
A572 A588
Sample style Ecorr (mV) Icorr (μA/cm2)
Ecorr (mV) Icorr (μA/cm2))
Unwelded
3-Coat -57.4 1.87E-3 -36 2.56E-3
CSA -352 2.98E-2 -344 1.36E-2
Hard -569 73.2 -693 85
Uncoated -741 6.05 -735 5.72
Welded
3-Coat -124 2.46E-3 -138 3.48E-3
CSA -382 7.95E-2 -448 4.89E-2
Hard -856 74.2 -820 164
Uncoated -755 49.5 -739 48.1

63
Figure 5.1: Open circuit potentials immediately for: (a) 3-coat system, (b) CSA, (c) Hard
coating, and (d) uncoated samples.
0.0 500.0 1.0k 1.5k 2.0k 2.5k 3.0k 3.5k 4.0k-0.09
-0.08
-0.07
-0.06
-0.05
-0.04
-0.03
-0.02
V (
V v
s. R
ef.)
T(s)
A572UW
A572W3-Coat
0.0 500.0 1.0k 1.5k 2.0k 2.5k 3.0k 3.5k 4.0k-0.06
-0.05
-0.04
-0.03
-0.02
-0.01
0.00
0.01
V (
V v
s. R
ef.)
T(s)
A588UW
A588W3-Coat
0.0 500.0 1.0k 1.5k 2.0k 2.5k 3.0k 3.5k 4.0k
-0.31
-0.30
-0.29
-0.28
-0.27
-0.26
-0.25
-0.24
V (
V v
s. R
ef.)
T(s)
A572UW
A572WCSA
0.0 500.0 1.0k 1.5k 2.0k 2.5k 3.0k 3.5k 4.0k-0.31
-0.30
-0.29
-0.28
-0.27
-0.26
-0.25
-0.24
V (
V v
s. R
ef.)
T(s)
A588UW
A588WCSA
0.0 500.0 1.0k 1.5k 2.0k 2.5k 3.0k 3.5k 4.0k
-0.74
-0.73
-0.72
-0.71
-0.70
-0.69
-0.68
-0.67
V (
V v
s. R
ef.)
T(s)
A588UW
A588WUncoated
0.0 500.0 1.0k 1.5k 2.0k 2.5k 3.0k 3.5k 4.0k-0.74
-0.73
-0.72
-0.71
-0.70
-0.69
-0.68
-0.67
-0.66
V (
V v
s. R
ef.)
T(s)
A572UW
A572WUncoated
0.0 500.0 1.0k 1.5k 2.0k 2.5k 3.0k 3.5k 4.0k
-0.56
-0.54
-0.52
-0.50
-0.48
-0.46
-0.44
-0.42
-0.40
-0.38
V (
V v
s. R
ef.)
T(s)
A588UW
A588WHard
0.0 500.0 1.0k 1.5k 2.0k 2.5k 3.0k 3.5k 4.0k-0.58
-0.56
-0.54
-0.52
-0.50
-0.48
-0.46
V (
V v
s. R
ef.)
T(s)
A572UW
A572WHard

64
Figure 5.2: Open circuit potentials after 3 days for: (a) 3-coat system, (b) CSA, (c) Hard coating,
and (d) uncoated samples.
0.0 500.0 1.0k 1.5k 2.0k 2.5k 3.0k 3.5k 4.0k
-0.11
-0.10
-0.09
-0.08
-0.07
-0.06
-0.05
-0.04
-0.03
V (
V v
s. R
ef.)
T (s)
A572UW
A572W3-Coat
0.0 500.0 1.0k 1.5k 2.0k 2.5k 3.0k 3.5k 4.0k-0.11
-0.10
-0.09
-0.08
-0.07
-0.06
-0.05
-0.04
-0.03
-0.02
V (
V v
s. R
ef.)
T(s)
A588UW
A588W3-Coat
0.0 500.0 1.0k 1.5k 2.0k 2.5k 3.0k 3.5k 4.0k-0.32
-0.31
-0.30
-0.29
-0.28
-0.27
-0.26
-0.25
-0.24
V (
V v
s. R
ef.)
T (s)
A572UW
A572WCSA
0.0 500.0 1.0k 1.5k 2.0k 2.5k 3.0k 3.5k 4.0k-0.34
-0.33
-0.32
-0.31
-0.30
-0.29
-0.28
-0.27
-0.26
-0.25
-0.24
V (
V v
s. R
ef.)
T(s)
A588UW
A588WCSA
0.0 500.0 1.0k 1.5k 2.0k 2.5k 3.0k 3.5k 4.0k-0.60
-0.58
-0.56
-0.54
-0.52
-0.50
-0.48
V (
V v
s. R
ef.)
T (s)
A572UW
A572WHard
0.0 500.0 1.0k 1.5k 2.0k 2.5k 3.0k 3.5k 4.0k
-0.62
-0.60
-0.58
-0.56
-0.54
-0.52
-0.50
-0.48
V (
V v
s. R
ef.)
T (s)
A588UW
A588WHard
0.0 500.0 1.0k 1.5k 2.0k 2.5k 3.0k 3.5k 4.0k-1.00
-0.95
-0.90
-0.85
-0.80
-0.75
-0.70
-0.65
-0.60
V (
V v
s. R
ef.)
T (s)
A572UW
A572WUncoated
0.0 500.0 1.0k 1.5k 2.0k 2.5k 3.0k 3.5k 4.0k-0.73
-0.72
-0.71
-0.70
-0.69
-0.68
-0.67
-0.66
-0.65
-0.64
-0.63
V (
V v
s. R
ef.)
T(s)
A588UW
A588WUncoated

65
Figure 5.3: Open circuit potentials after 7 days for: (a) 3-coat system, (b) CSA, (c) Hard coating,
and (d) uncoated samples.
0.0 500.0 1.0k 1.5k 2.0k 2.5k 3.0k 3.5k 4.0k-0.12
-0.11
-0.10
-0.09
-0.08
-0.07
-0.06
-0.05
-0.04
-0.03V
(V
vs.
Ref
.)
T (s)
A572UW
A572W3-Coat
0.0 500.0 1.0k 1.5k 2.0k 2.5k 3.0k 3.5k 4.0k-0.12
-0.11
-0.10
-0.09
-0.08
-0.07
-0.06
-0.05
-0.04
-0.03
V (
V v
s. R
ef.)
T(s)
A588UW
A588W3-Coat
0.0 500.0 1.0k 1.5k 2.0k 2.5k 3.0k 3.5k 4.0k-0.32
-0.31
-0.30
-0.29
-0.28
-0.27
-0.26
-0.25
V (
V v
s. R
ef.)
T (s)
A572UW
A572WCSA
0.0 500.0 1.0k 1.5k 2.0k 2.5k 3.0k 3.5k 4.0k
-0.42
-0.40
-0.38
-0.36
-0.34
-0.32
-0.30
-0.28
-0.26
-0.24
V (
V v
s. R
ef.)
T(s)
A588UW
A588WCSA
0.0 500.0 1.0k 1.5k 2.0k 2.5k 3.0k 3.5k 4.0k-0.560
-0.555
-0.550
-0.545
-0.540
V (
V v
s. R
ef.)
T (s)
A572UW
A572WHard
0.0 500.0 1.0k 1.5k 2.0k 2.5k 3.0k 3.5k 4.0k
-0.60
-0.58
-0.56
-0.54
-0.52
-0.50
V (
V v
s. R
ef.)
T(s)
A588UW
A588WHard
0.0 20.0 40.0 60.0 80.0 100.0 120.0-0.710
-0.705
-0.700
-0.695
-0.690
-0.685
-0.680
-0.675
-0.670
-0.665
V (
V v
s. R
ef.)
T (s)
A572UW
A572WUncoated
0.0 50.0 100.0-0.665
-0.664
-0.663
-0.662
-0.661
-0.660
-0.659
-0.658
-0.657
-0.656
-0.655
-0.654
V (
V v
s. R
ef.)
T(s)
A588UW
A588WUncoated

66
Figure 5.4: OCP for all coating system over the time.
-41.75
-275.5
-485.6
-673.5
-88.45
-311.2
-569.6
-729
3-COAT CSA Hard Uncoated
-1000
-900
-800
-700
-600
-500
-400
-300
-200
-100
0
OC
P (
mV
)
A572- 3 day
Unwelded
Welded
-52.1
-261
-514.8
-668.8
-115.3
-309.3
-577.6
-970.2
3-Coat CSA Hard Uncoated
-1000
-900
-800
-700
-600
-500
-400
-300
-200
-100
0
OC
P (
mV
)
A572- 3 day
UW
W
-52.14
-272.4
-558.8
-677
-113.9
-314
-554.6
-699
3-Coat CSA Hard Uncoated
-1000
-900
-800
-700
-600
-500
-400
-300
-200
-100
0
OC
P (
mV
)
A572- 7 day
UW
W
-11.18
-264.4
-467.1
-682.2
-54.03
-306.1
-557.1
-740.1
3-Coat CSA Hard Uncoated
-1000
-900
-800
-700
-600
-500
-400
-300
-200
-100
0
OC
P (
mV
)
A588- 0 day
UW
W
-43.19
-261.1
-514.2
-689.1
-98.23
-335.4
-597.6
-723.7
3-Coat CSA Hard Uncoated
-1000
-900
-800
-700
-600
-500
-400
-300
-200
-100
0
OC
P (
mV
)
A588- 3 day
UW
W
-42.19
-267.3
-571
-657
-97.7
-403.4
-595.5
-663
3-Coat CSA Hard Uncoated
-1000
-900
-800
-700
-600
-500
-400
-300
-200
-100
0
OC
P (
mV
)
A588- 7 day
UW
W

67
Figure 5.5: Corrosion rate over time for bare samples.
0.0 50.0k 100.0k 150.0k 200.0k2.0
4.0
6.0
8.0
10.0
12.0
14.0
16.0
Cor
rate
(m
py)
Time (s)
A572W
A572UW
A588W
A588UW

68
Figure 5.6: EIS diagrams (1 and 2 Bode plots; 3 Nyquist plot) for: (a) A572UW, (b) A572W, (c)
A588UW, (d) A588W samples immediately.
1m 10m 100m 1 10 100 1k 10k 100k 1M
1
10
100
1000
10000
100000
1000000
1E7
1E8
1E9
3-Coat
CSA
Uncoated
Zm
od (
ohm
)
Freq (Hz)
1m 10m 100m 1 10 100 1k 10k 100k 1M-90
-80
-70
-60
-50
-40
-30
-20
-10
0
10
20
30
40
3-Coat
CSA
Uncoated
Ph
ase (
°)Freq (Hz)
0.0 200.0M 400.0M
0
100M
200M
3-Coat
CSA
Uncoated
Zim
ag (
ohm
)
Zreal (ohm)
1m 10m 100m 1 10 100 1k 10k 100k 1M
1
10
100
1000
10000
100000
1000000
1E7
1E8
1E9
Zm
od (
oh
m)
Freq (Hz)
Zm
od (
oh
m)
Freq (Hz)
3-Coat
CSA
Uncoated
1m 10m 100m 1 10 100 1k 10k 100k 1M-90
-80
-70
-60
-50
-40
-30
-20
-10
0
10
20
30
40
P
ha
se (
°)
Freq (Hz)
3-Coat
CSA
Uncoated
0.0 200.0M 400.0M
0
100M
200M
Zim
ag (
ohm
)Zreal (ohm)
3-Coat
CSA
Uncoated
1m 10m 100m 1 10 100 1k 10k 100k 1M
1
10
100
1000
10000
100000
1000000
1E7
1E8
1E9
Zm
od (
ohm
)
Freq (Hz)
3-Coat
CSA
Uncoated
1m 10m 100m 1 10 100 1k 10k 100k 1M-90
-80
-70
-60
-50
-40
-30
-20
-10
0
10
20
30
40
Ph
ase (
°)
Freq (Hz)
3-Coat
CSA
Uncoated
0.0 200.0M 400.0M
0
100M
200M
Z
imag
(o
hm
)
Zreal (ohm)
3-Coat
CSA
Uncoated
1m 10m 100m 1 10 100 1k 10k 100k 1M
1
10
100
1000
10000
100000
1000000
1E7
1E8
1E9
Freq (Hz)
Zm
od (
oh
m)
Zm
od (
oh
m)
Freq (Hz)
3-Coat
CSA
Uncoated
1m 10m 100m 1 10 100 1k 10k 100k 1M-90
-80
-70
-60
-50
-40
-30
-20
-10
0
10
20
30
40
Phase (
°)
Freq (Hz)
3-Coat
CSA
Uncoated
0.0 200.0M 400.0M
0
100M
200M
Zim
ag (
ohm
)
Zreal (ohm)
3-Coat
CSA
Uncoated

69
Figure 5.7: EIS diagrams (1 and 2 Bode plots; 3 Nyquist plot) for: (a) A572UW, (b) A572W, (c)
A588UW, (d) A588W samples after 3 days.
1m 10m 100m 1 10 100 1k 10k 100k 1M
1
10
100
1000
10000
100000
1000000
1E7
1E8
1E9
Zm
od (
oh
m)
Freq (Hz)
3-Coat
CSA
Uncoated
1m 10m 100m 1 10 100 1k 10k 100k 1M-90
-80
-70
-60
-50
-40
-30
-20
-10
0
10
20
30
Ph
ase (
°)
Freq (Hz)
3-Coat
CSA
Uncoated
0 100M 200M 300M 400M
0
100M
200M
Zim
ag
(o
hm
)
Zreal (ohm)
3-Coat
CSA
Uncoated
1m 10m 100m 1 10 100 1k 10k 100k 1M
1
10
100
1000
10000
100000
1000000
1E7
1E8
1E9
3-Coat
CSA
Uncoated
Zm
od (
oh
m)
Freq (Hz)
1m 10m 100m 1 10 100 1k 10k 100k 1M-90
-80
-70
-60
-50
-40
-30
-20
-10
0
10
20
30
40
50
60
70
80
Ph
ase (
°)
Freq (Hz)
3-Coat
CSA
Uncoated
1m 10m 100m 1 10 100 1k 10k 100k 1M
1
10
100
1000
10000
100000
1000000
1E7
1E8
1E9
Zm
od (
oh
m)
Freq (Hz)
3-Coat
CSA
Uncoated
1m 10m 100m 1 10 100 1k 10k 100k 1M-90
-80
-70
-60
-50
-40
-30
-20
-10
0
10
Ph
ase (
°)
Freq (Hz)
3-Coat
CSA
Uncoated
-500.0M 0.0 500.0M 1.0G 1.5G 2.0G 2.5G 3.0G 3.5G 4.0G
0.0
200.0M
400.0M
600.0M
800.0M
1.0G
1.2G
1.4G
1.6G
Zim
ag
(o
hm
)
Zreal (ohm)
3-Coat
CSA
Uncoated
0.0 200.0M 400.0M
0
100M
200M
Zim
ag
(o
hm
)
Zreal (ohm)
3-Coat
CSA
Uncoated
1m 10m 100m 1 10 100 1k 10k 100k 1M
1
10
100
1000
10000
100000
1000000
1E7
1E8
1E9
Zm
od (
oh
m)
Freq (Hz)
3-Coat
CSA
Uncoated
1m 10m 100m 1 10 100 1k 10k 100k 1M
-90
-80
-70
-60
-50
-40
-30
-20
-10
0
10
20
30
40
Ph
ase (
°)
Freq (Hz)
3-Coat
CSA
Uncoated
0 100M 200M 300M
0.0
50.0M
100.0M
150.0M
Zim
ag
(o
hm
)
Zreal (ohm)
3-Coat
CSA
Uncoated

70
Figure 5.8: EIS diagrams (1 and 2 Bode plots; 3 Nyquist plot) for: (a) A572UW, (b) A572W, (c)
A588UW, (d) A588W samples after 7 days.
1m 10m 100m 1 10 100 1k 10k 100k 1M
1
10
100
1000
10000
100000
1000000
1E7
1E8
1E9
Zm
od (
oh
m)
Freq (Hz)
3-Coat
CSA
Uncoated
1m 10m 100m 1 10 100 1k 10k 100k 1M
-80
-60
-40
-20
0
20
40
60
80
Ph
ase (
°)
Freq (Hz)
3-Coat
CSA
Uncoated
0 100M 200M 300M 400M
0.0
50.0M
100.0M
150.0M
Zim
ag
(o
hm
)
Zreal (ohm)
3-Coat
CSA
Uncoated
1m 10m 100m 1 10 100 1k 10k 100k 1M
10
100
1000
10000
100000
1000000
1E7
1E8
1E9
Zm
od (
oh
m)
Freq (Hz)
3-Coat
CSA
Uncoated
1m 10m 100m 1 10 100 1k 10k 100k 1M
-80
-60
-40
-20
0
20
40
60
80
Ph
ase (
°)
Freq (Hz)
3-Coat
CSA
Uncoated
0 100M 200M 300M 400M
0.0
50.0M
100.0M
150.0M
Zim
ag
(o
hm
)
Zreal (ohm)
3-Coat
CSA
Uncoated
1m 10m 100m 1 10 100 1k 10k 100k 1M1
10
100
1000
10000
100000
1000000
1E7
1E8
1E9
Zm
od (
oh
m)
Freq (Hz)
3-Coat
CSA
Uncoated
1m 10m 100m 1 10 100 1k 10k 100k 1M-100
-80
-60
-40
-20
0
20
Ph
ase (
°)
Freq (Hz)
3-Coat
CSA
Uncoated
0 100M 200M 300M
0.0
50.0M
100.0M
150.0M
Zim
g (
oh
m)
Zreal (ohm)
3-Coat
CSA
Uncoated
1m 10m 100m 1 10 100 1k 10k 100k 1M1
10
100
1000
10000
100000
1000000
1E7
1E8
Zm
od (
oh
m)
Freq (Hz)
3-Coat
CSA
Uncoated
1m 10m 100m 1 10 100 1k 10k 100k 1M
-80
-60
-40
-20
0
20
Ph
ase (
°)
Freq (Hz)
3-Coat
CSA
Uncoated
0 100M 200M 300M
0.0
50.0M
100.0M
Zim
ag
(o
hm
)
Zreal (ohm)
3-Coat
CSA
Uncoated

71
(a) Charge transfer resistance Rct (b) double layer capacitance Cdl.
Figure 5.9: Comparison of corrosion properties.
1E+0
1E+4
1E+8
3-Coat CSA Uncoated
log
Rct
A572UW
0 day 3 day 7 day
1E-10
1E-6
1E-2 3-Coat CSA Uncoated
log
Cd
l
A572UW
0 day 3 day 7 day
1E+0
1E+6
3-Coat CSA Uncoated
log
Rct
A572W
0 day 3 day 7 day
1E-10
1E-5
1E+03-Coat CSA Uncoatedlo
g C
dl
A572W
0 day 3 day 7 day
1E+0
1E+4
1E+8
3-Coat CSA Uncoated
log
Rct
A588UW
0 day 3 day 7 day
1E-10
1E-6
1E-2 3-Coat CSA Uncoated
log
Cd
l
A588UW
0 day 3 day 7 day
1E+0
1E+4
1E+8
3-Coat CSA Uncoated
log
Rct
A588W
0 day 3 day 7 day
1E-10
1E-6
1E-2 3-Coat CSA Uncoated
log
Cd
l
A588W
0 day 3 day 7 day

72
(a) Coating resistance Rc. (b) Coating capacitance Cc.
Figure 5.10: Comparison of dielectric properties of coating
1E+0
1E+4
1E+8
3-Coat CSA
log
Rc
A572UW
0 day 3 day 7 day
1E-10
1E-5
1E+03-Coat CSA
log
Cc
A572UW
0 day 3 day 7 day
1E+0
1E+4
1E+8
3-Coat CSA
log
Rc
A572W
0 day 3 day 7 day
1E-10
1E-5
1E+03-Coat CSA
log
Cc
A572W0 day 3 day 7 day
1E+0
1E+4
1E+8
3-Coat CSA
log
Rc
A588UW
0 day 3 day 7 day
1E-10
1E-5
1E+03-Coat CSA
log
Cc
A588UW
0 day 3 day 7 day
1E+0
1E+4
1E+8
3-Coat CSA
log
Rc
A588W
0 day 3 day 7 day
1E-10
1E-5
1E+03-Coat CSA
log
Cc
A588W
0 day 3 day 7 day

73
Figure 5.11: Potentiodynamic polarization curves for: (a) 3-coat, (b) CSA, (c) hard, and (d)
1E-12 1E-11 1E-10 1E-9-1.0
-0.8
-0.5
-0.3
0.0
0.3
0.5
0.8
1.0
1.3
1.5
1.8
2.0
A572UW
A572W
Vf (
V v
s. R
ef)
Current density (µA/cm^2)
A-1
1E-12 1E-11 1E-10 1E-9-1.0
-0.8
-0.5
-0.3
0.0
0.3
0.5
0.8
1.0
1.3
1.5
1.8
2.0
A588UW
A588W
Vf (
V v
s. R
ef)
Current density (µA/cm^2)
A-2
1E-6 1E-5 1E-4 1E-3 0.01-0.7
-0.6
-0.5
-0.4
-0.3
-0.2
-0.1
0.0
A572UW
A572W
Vf (
V v
s. R
ef)
Current density (µA/cm^2)
B-1
1E-7 1E-6 1E-5 1E-4 1E-3 0.01 0.1 1-1.0
-0.8
-0.5
-0.3
0.0
0.3
0.5
0.8
1.0
1.3
1.5
A588UW
A588W
Vf (V
vs.
Ref
)
Current density (µA/cm^2)
B-2
1E-14 1E-12 1E-10 1E-8 1E-6 1E-4 0.01-1.3
-1.0
-0.8
-0.5
-0.3
0.0
0.3
0.5
0.8
1.0
1.3
A572UW
A572W
Vf (
V v
s. R
ef)
Current density (µA/cm^2)
C-1
1E-11 1E-10 1E-9 1E-8 1E-7 1E-6 1E-5 1E-4 1E-3-1.5
-1.3
-1.0
-0.8
-0.5
-0.3
0.0
0.3
0.5
0.8
1.0
1.3
A588UW
A588W
Vf (V
vs.
Ref
)
Current density (µA/cm^2)
C-2
1E-6 1E-5 1E-4 1E-3 0.01-1.1
-1.0
-0.9
-0.8
-0.7
-0.6
-0.5
A572UW
A572W
Vf (
V v
s. R
ef)
Current density (µA/cm^2)
D-1
1E-10 1E-8 1E-6 1E-4 0.01 1-1.3
-1.0
-0.8
-0.5
-0.3
0.0
A588UW
A588W
Vf (V
vs.
Ref
)
Current density (µA/cm^2)
D-2
74
CHAPTER 6. SUMMARY, CONCLUSIONS AND FUTURE WORK
6.1. Summary
Steel bridge welds are frequently observed to have high corrosion initiation locally under
aggressive environments, such as critical locations adjacent to the girder ends, abutment or joints.
In this study, weldment corrosion in steel bridges was quantified using four electrochemical tests.
Four electrochemical tests include OCP, Rp/Ec trend, EIS, and Potentiodynamic polarization. The
laboratory tests by the immersion of the 3.5 wt.% NaCl solution were carried out to simulate an
accelerated corrosive environments. To better understand the corrosion resistance of welds, two
different bridge steels were selected in this study, while three commonly used coating systems
were selected and deposited on the welded samples. Coating performance in welds were studied
through OCP, EIS and Potentiodynamic polarization tests. For a comparison, the base metal
(without welds) is used as a control sample to determine the corrosion behavior of welds under
varying steel types and coating systems.
6.2. Conclusions
Weldment corrosion for two types of common used steel in bridges (A572 and A588)
Grade 50 fore bare and three coated samples was characterized by OCP, Rp/Ec trend, EIS,
Potentiodynamic polarization. In summary, the following conclusion can be drawn from this study.
1) All electrochemical tests were performed in this study indicated the influence of the
welding process on the corrosion behavior in the steel bridges. Bridges steel welds
exhibit higher initiation of corrosion over base metal, regardless what types of steel,
and protective coatings were selected.
2) Weathering bridge steel (A588) welds show the higher resistance to corrosion initiation,
as compared to low carbon iron steel (A572).

75
3) Two electrochemical tests allow quantifying the coating performance in welds. The
protective coating systems can delay the corrosion initiation at the welds, thus
enhancing the corrosion resistance of bridge steel welds.
4) Furthermore, it also revealed that A572 steel welds have over 44% higher in corrosion
rate, as compared to the base metal, while 23% higher corrosion rate for weathering
steel. Therefore, use of combined electrochemical tests can give a relatively more
comprehensive information to understand the corrosion behavior in bridge steel welds.
Corrosion current and corrosion rate predicted by the electrochemical tests helps bridge
engineers to understand the corrosion behavior of steel bridge welds and corrosion
resistance obtained by varying coating systems in welds.
6.3. Future Research
The further research work will be carried out, including
1) Performing a microstructural study to investigate the corrosion behavior of each
weldment zone (base metal, HAZ, weld), and identify which area is more
susceptible for corrosion and deep understanding corrosion behavior under micro-
scale level.
2) Investigating aging effects and long-term durability of welds by extending the
period of corrosion testing under different corrosive conditions.
3) Investigating combined effects by traffic fatigue/fracture with corrosion to
understand the complex behavior of welds under these conditions.
76
REFERENCES
[1] Corrosion as an electrochemical process. (2005). Retrieved July 29, 2015, from
http://hyperphysics.phy-astr.gsu.edu/hbase/chemical/corrosion.html
[2] Fessler, R. R. (2008). Pipeline corrosion. Report, US Department of Transportation Pipeline
and Hazardous Materials Safety Administration, Baker, Evanston, IL.
[3] Wang, Y., Zuo, X., & Li, J. (2015). Corrosion Resistance of the Welded Joint of Submarine
Pipeline Steel with Ferrite Plus Bainite Dual‐Phase Microstructure. Steel research
international.
[4] Bond, S (2003, April). Corrosion of welded components in marine environments. Retrieved
October 03, 2015, from http://www.twi-global.com/technical-knowledge/published-
papers/corrosion-of-welded-components-in-marine-environments-april-2003/
[5] WHB, A. 2.9 (2004) Welding Handbooks.
[6] The ABC's of Arc Welding. Retrieved October 24, 2015, from http://www.kobelco-
welding.jp/education-center/abc/ABC_1999-04.html
[7] The Sad State of Our Nation’s Bridges. Retrieved October 24, 2015, from
https://www.storagefront.com/therentersbent/the-sad-state-of-our-nations-bridges
[8] Minnesota Department of Transportation. (2008, June 4). Retrieved October 24, 2015, from
http://www.newsline.dot.state.mn.us/archive/08/jun/4.html
[9] Rhode Island Department of Transportation (RIDOT) Structural Condition Inspection and
Evaluation Report. (2009). Retrieved October 24, 2015, from
http://www.providenceviaduct.com/2009_structural_inspection.asp
[10] Delaware Department of Transportation. (2015). Retrieved October 24, 2015, from
http://www.deldot.gov/information/projects/br_1-701-703A/index.shtml

77
[11] Jenney, C. L., & O’Brien, A. (2001). Welding Handbook, Volume 1–Welding Science and
Technology. American Welding Society.
[12] Davis, J.R. (Eds). (2006). Corrosion of Weldment.ASM international, Material park, Ohio,
USA.
[13] Lecchi, M. (2011). Evaluation of predictive assessment reliability on corroded transmission
pipelines. Journal of Natural Gas Science and Engineering, 3(5), 633-641.
[14] Matthews, S., & James, B. (2010). Review of Thermal Spray Coating Applications in the
Steel Industry: Part 1—Hardware in Steel Making to the Continuous Annealing
Process. Journal of thermal spray technology, 19(6), 1267-1276.
[15] Vetters, A. (1978).Corrosion in welds, international corrosion conference. Melbourne
(1978), pp. 13–17
[16] Hunkeler, F., Frankel, G. S., & Bohni, H. (1987). Technical note: on the mechanism of
localized corrosion. Corrosion, 43(3), 189-191.
[17] Ren, C., Liu, L., Yi, F., Guo, M., Zou, T., & Xian, N. (2009). Internal Corrosion Behaviors
of API X80 Welding Pipeline. In ICPTT 2009@ advances and Experiences with Pipelines
and Trenchless Technology for Water, Sewer, Gas, and Oil Applications (pp. 1613-1623).
ASCE.
[18] Chaves, I. A., & Melchers, R. E. (2011). Pitting corrosion in pipeline steel weld
zones. Corrosion Science, 53(12), 4026-4032.
[19] Lee, C. M., & Woollin, P. (2005). Preferential weld corrosion: effects of weldment
microstructure and composition. CORROSION 2005.

78
[20] Xiong, J., Tan, M. Y., & Forsyth, M. (2013). The corrosion behaviors of stainless steel
weldments in sodium chloride solution observed using a novel electrochemical
measurement approach. Desalination, 327, 39-45.
[21] Deen, K. M., Ahmad, R., Khan, I. H., & Farahat, Z. (2010). Microstructural study and
electrochemical behavior of low alloy steel weldment. Materials & Design, 31(6), 3051-
3055.
[22] Tomlinson, W. J., & Matthews, S. J. (1988). Intergranular corrosion of welds in type 405
stainless steel. Journal of materials science, 23(6), 2064-2068
[23] Garcia, C., De Tiedra, M. P., Blanco, Y., Martin, O., & Martin, F. (2008). Intergranular
corrosion of welded joints of austenitic stainless steels studied by using an electrochemical
minicell. Corrosion science, 50(8), 2390-2397.
[24] Hodgkiess, T., Hanbury, W. T., Arndt, M., & Eid, N. (1979). The corrosion of welded
samples in seawater. Desalination, 31(1), 399-410.
[25] Yunovich, M., & Thompson, N. G. (2003). Corrosion of highway bridges: Economic
impact and control methodologies. Concrete International, 25(1), 52-57.
[26] Milella, P. P. (2012). Fatigue and corrosion in metals. Springer Science & Business Media
[27] Roberge, P. R. (2008). Corrosion engineering: principles and practice (pp. 370-375). New
York: McGraw-Hill.
[28] Roberge, P. R. (2006). Corrosion Basics: An Introduction. NACE International.
[29] Gamry Instruments Support. (2015). Framework - Help Documentation. Vers. 6.30.
Warminster: Gamry Instruments. Program documentation
[30] McGrath, J. T. (1976). Literature review on fracture toughness testing of the heat-affected-
zone, CANMET report No. 77-59

79
[31] McHenry, H. I. and Potter, J. M. (1990) Fracture Toughness Testing of Weld Heat-
Affected Zones in Structural Steel," Fatigue and Fracture Testing of Weldments, ASTM
STP 1058, Eds., American Society for Testing and Materials, Philadelphia
[32] Jeffus, L.F. (2004), Welding: Principles and Applications, N.Y. : Thomson/Delmar
Learning, 2004
[33] Fisher, J. W. (1984). Fatigue and Fracture in Steel Bridges: Case Studies. John Wiley. New
York, NY.
[34] Radaj, D. (1990). Design and Analysis of Fatigue Resistant Welded Structures. Halsted
Press. New York, NY.
[35] BS 7910. (1999). Guide on Methods for Assessing the Acceptability of Flaws in Metallic
Structures. British Standards Institute. London, UK.
[36] Ault, J. P., & Farschon, C. L. (2009). 20-year Performance of Bridge Maintenance
Systems. Journal of Protective Coatings and Linings, 26(1).
[37] Bierwagen, G., Allahar, K., Hinderliter, B., Simões, A. M., Tallman, D., & Croll, S. (2008).
Ionic liquid enhanced electrochemical characterization of organic coatings. Progress in
Organic Coatings, 63(3), 250-259.
[38] Wang, Y., & Bierwagen, G. P. (2009). A new acceleration factor for the testing of corrosion
protective coatings: flow-induced coating degradation.Journal of Coatings Technology and
Research, 6(4), 429-436.
[39] Fredj, N., Cohendoz, S., Mallarino, S., Feaugas, X., & Touzain, S. (2010). Evidencing
antagonist effects of water uptake and leaching processes in marine organic coatings by
gravimetry and EIS. Progress in Organic Coatings, 67(3), 287-295.
80
[40] Zhou, Q., & Wang, Y. (2013). Comparisons of clear coating degradation in NaCl solution
and pure water. Progress in Organic Coatings, 76(11), 1674-1682.
[41] Taylor, S. R., & Moongkhamklang, P. (2005). The delineation of local water interaction
with epoxy coatings using fluorescence microscopy. Progress in organic coatings, 54(3),
205-210.
[42] Ellor, J. A., Young, W. T., & Repp, J. (2004). Thermally sprayed metal coatings to protect
steel pilings: final report and guide (Vol. 528). Transportation Research Board.
[43] Ault, J. P., & Farschon, C. L. (2009). 20-year Performance of Bridge Maintenance
Systems. Journal of Protective Coatings and Linings, 26(1).
[44] Kogler, R. (2012). Steel Bridge Design Handbook: Corrosion Protection of Steel
Bridges (No. FHWA-IF-12-052-Vol. 19).
[45] Loveday, D., Peterson, P., & Rodgers, B. (2004). Evaluation of organic coatings with
electrochemical impedance spectroscopy. JCT coatings tech, 8, 46-52.
[46] Loveday, D., Peterson, P., & Rodgers, B. (2004). Evaluation of organic oatings with
electrochemical impedance spectroscopy. Part 2: Application of EIS to coatings. JCT
coatingstech, 1(10), 88-93.
[47] Tang, F., Chen, G., Volz, J. S., Brow, R. K., & Koenigstein, M. (2012). Microstructure and
corrosion resistance of enamel coatings applied to smooth reinforcing steel. Construction
and Building Materials, 35, 376-384.
[48] Loveday, D., Peterson, P., & Rodgers, B. (2005). Evaluation of organic coatings with
electrochemical impedance spectroscopy. Part 3: Protocols for testing coatings with
EIS. JCT coatingstech, 2(13), 22-27
81
[49] Amirudin, A., & Thieny, D. (1995). Application of electrochemical impedance
spectroscopy to study the degradation of polymer-coated metals. Progress in organic
coatings, 26(1), 1-28
[50] NACE international. (1999). Techniques for monitoring corrosion and related parameters in
field applications. NACE international publication 3T199.
[51] ASTM Standards G102-89, (1999), Standard practice for calculation of corrosion rates and
related information from electrochemical measurements, ASTM International, West
Conshohocken, PA, 1999. http://www.astm.org/Standards/G102.htm
[52] Corrosion protection of steel bridges. (2005). Retrieved October 5, 2015, from
http://resource.npl.co.uk/docs/science_technology/materials/life_management_of_materials
/publications/online_guides/pdf/protection_of_steel_bridges.pdf
[53] personal communication with Mr. Brian Schroeder from Ayres Associates Inc., 2015
[54] WSDOT. (2015, April 1). Retrieved July 11, 2015, from
http://www.wsdot.wa.gov/publications/manuals/fulltext/M23-50/BDM.pdf
[55] William Wright, “steel bridge design handbook: bridge steels and their mechanical
properties”, Report No. # FHWA-IF-12-052, Federal Highway Administration,
Washington, D.C., 2012.
(https://www.fhwa.dot.gov/bridge/steel/pubs/if12052/volume01.pdf)
[56] Chen, W. F., & Duan, L. (Eds.). (2014). Bridge Engineering Handbook: Construction and
Maintenance. CRC press.
[57] Hare, C. H. (1990). Painting of steel bridges and other structures. Van Nostrand Reinhold,
115 Fifth Ave, New York, New York 10003, USA, 1990. 303.
[58] Three-Tired coating system protects bridge. “Industrial finishing.Jan.1985. pp. 14-15.

82
[59] SSPC-SP-12.00. (1994). The Society for Protective Coatings Paint system guide No.12.00
Guide to zinc-rich coating systems, The Society for Protective Coatings, Pittsburgh, PA.
[60] Helsel, J. L., Melampy, M. F., & Wissmar, K. (2008). Expected Service Life and Cost
Considerations for Maintenance and New Construction Protective Coating
Work. CORROSION/2006, paper, 6318.
[61] Keane, J.D., (1993).Good Painting Practice: Steel Structures Painting Manual, Volume 1.
Steel Structure Painting Council.3rd ed., 1993, p.118-135.
[62] Myers, J. J., Washer, G., & Zheng, W. (2010). Structural Steel coatings for corrosion
mitigation (No. NUTC R233 & R238).
[63] Bridge Coatings by Watson Coatings. Retrieved August 27, 2015, from
http://watsoncoatings.com/bridge-coatings/
[64] Yao, Y., Kodumuri, P., & Lee, S. K. (2011). Performance evaluation of one-coat systems
for new steel bridges (No. FHWA-HRT-11-046).
[65] Benefits of hard coating. (2015). Retrieved October 25, 2015, from
http://www.edmundoptics.com/technical-resources-center/optics/benefits-of-hard-coatings/.
[66] Matthews, S., & James, B. (2010). Review of Thermal Spray Coating Applications in the
Steel Industry: Part 1—Hardware in Steel Making to the Continuous Annealing
Process. Journal of thermal spray technology, 19(6), 1267-1276.
[67] Koivuluoto, H., & Vuoristo, P. (2010). Structural analysis of cold-sprayed nickel-based
metallic and metallic-ceramic coatings. Journal of thermal spray technology, 19(5), 975-
989.

83
[68] Grewal, H. S., Singh, H., & Agrawal, A. (2013). Microstructural and mechanical
characterization of thermal sprayed nickel–alumina composite coatings.Surface and
Coatings Technology, 216, 78-92.
[69] ASTM Standards A709/A709M-13a, (2015), Standard specification for structural steel for
bridges. ASTM International, West Conshohocken, PA, 2015. http://www.astm.org.
[70] Paint coatings. Retrieved March 19, 2015, from
http://www.steelconstruction.info/Paint_coatings
[71] Hassan, H. H., Abdelghani, E., & Amin, M. A. (2007). Inhibition of mild steel corrosion in
hydrochloric acid solution by triazole derivatives: Part I. Polarization and EIS
studies. Electrochimica Acta, 52(22), 6359-6366.
[72] Zhang, Y., Shao, Y., Zhang, T., Meng, G., & Wang, F. (2011). The effect of epoxy coating
containing emeraldine base and hydrofluoric acid doped polyaniline on the corrosion
protection of AZ91D magnesium alloy. Corrosion Science, 53(11), 3747-3755

84
APPENDIX. EXPERIMENTS PICTURES
Figure A1: Comparison of 3-Coat system sample before and after the test
1.5 in

85
Figure A2: Comparison of CSA coated sample before and after the test.
1.5 in
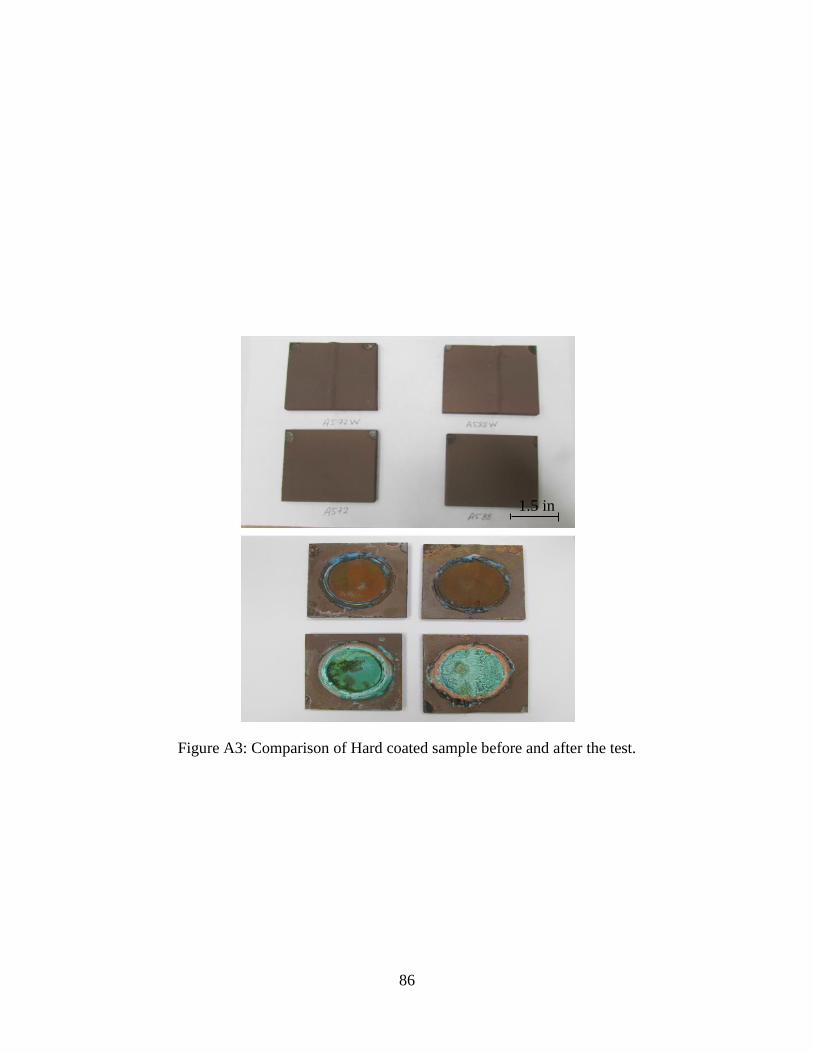
86
Figure A3: Comparison of Hard coated sample before and after the test.
1.5 in

87
Figure A4: Comparison of bare sample before and after the test.
1.5 in
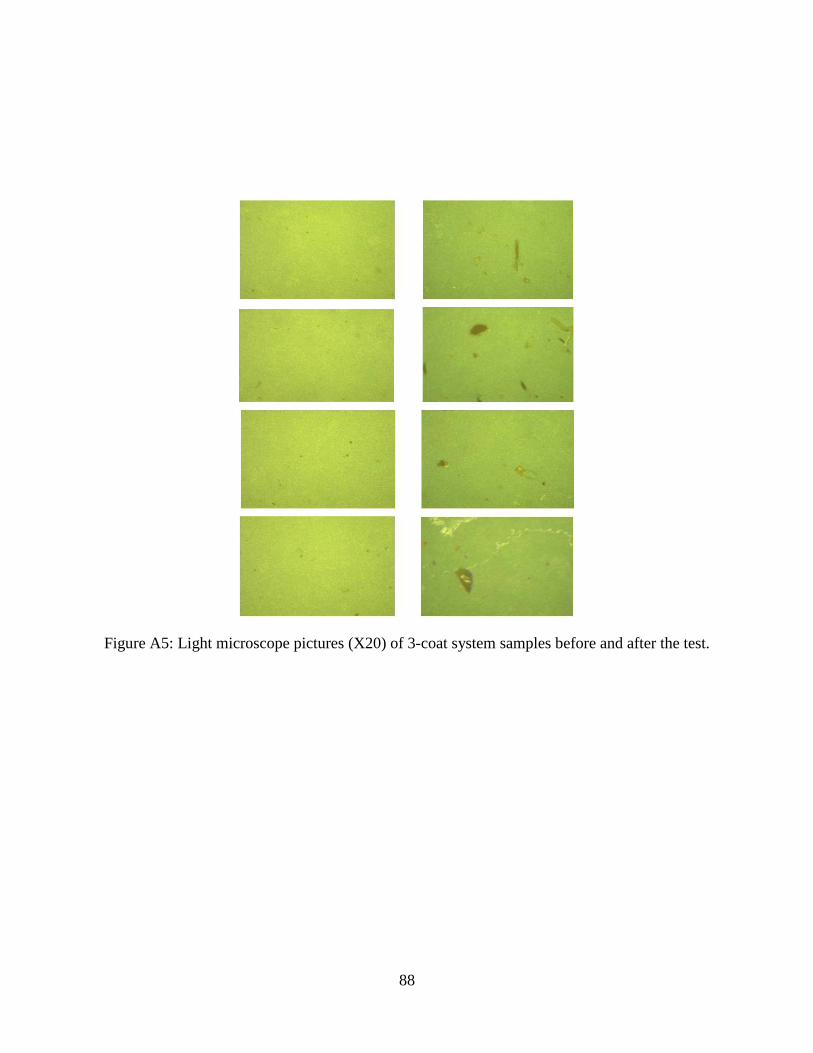
88
Figure A5: Light microscope pictures (X20) of 3-coat system samples before and after the test.

89
Figure A6: Light microscope pictures (X20) of CSA samples before and after the test.

90
Figure A7: Light microscope pictures (X20) of hard coating samples before and after the test.

91
Figure A8: Light microscope pictures (X20) of bare samples before and after the test.