inventory of sources and methods - hagstofa Íslands
TRANSCRIPT

Inventory of Sources and Methods
Price and Volume Measures in the Icelandic National Accounts
Statistics Iceland June 2008

2

3
Table of Contents
Chapter 1. General procedure ............................................................................................ 5 1.1 Introduction .................................................................................................................. 5 1.2 The expenditure approach ............................................................................................ 6 1.3 The production approach .............................................................................................. 6 1.4 Annual and quarterly chaining...................................................................................... 7 1.5 Publishing of the Icelandic national accounts at constant prices .................................. 7
Chapter 2. General information on main sources used .................................................. 8 2.1 Introduction .................................................................................................................. 8 2.2 The Consumer Price Index (CPI) ................................................................................. 8
2.2.1 Concepts and definitions .................................................................................. 8 2.2.2 Scope ............................................................................................................... 8 2.2.3 Basis for recording ........................................................................................... 9 2.2.4 Sources ............................................................................................................. 9 2.2.5 Missing prices, new products and quality changes ........................................ 10 2.2.6 Statistical concepts ......................................................................................... 10
2.3 The building cost index .............................................................................................. 11 2.3.1 Concepts and definitions ................................................................................ 11 2.3.2 Sources ........................................................................................................... 11
2.4 The unit value indices of exported and imported goods ............................................. 11 2.5 The Producer Price Index (PPI) .................................................................................. 12 2.6 The wage index ........................................................................................................... 13
Chapter 3. Methodologies by activity and final expenditure ......................................... 15 3.1 Introduction ................................................................................................................ 15 3.2 The production approach ............................................................................................ 16
3.2.1 General description ........................................................................................ 16 3.2.2 Agriculture, hunting and forestry (NACE Rev.1; A) .................................... 18 3.2.3 Fishing (NACE Rev.1; B) ............................................................................. 19 3.2.4 Mining and quarrying (NACE Rev.1; C) ...................................................... 20 3.2.5 Manufacturing (NACE Rev.1; D) ................................................................. 21 3.2.6 Electricity, gas and water supply (NACE Rev.1; E) ..................................... 24 3.2.7 Construction (NACE Rev.1; F) .................................................................... 25 3.2.8 Wholesale and retail trade; repair of motor vehicles, motor cycles and
personal household goods (NACE Rev.1; G) .............................................. 25 3.2.9 Hotels and restaurants (NACE Rev.1; H) ..................................................... 27 3.2.10 Transport, storage and communication (NACE Rev.1; I) ............................ 28 3.2.11 Financial intermediation (NACE Rev.1; J) ................................................... 29 3.2.12 Real estate, renting and business activities (NACE Rev.1; K) .................... 30 3.2.13 Public administration and defence; compulsory social security
(NACE Rev.1; L); Education (NACE Rev.1 M); Health and social work
(NACE Rev.1 N) ........................................................................................... 33 3.2.14 Other community, social and personal services (NACE Rev.1; O) ............. 34
3.3 The expenditure approach .......................................................................................... 35 3.3.1 Household final consumption expenditure .................................................... 35 3.3.2 Government final consumption expenditure .................................................. 38 3.3.3 Gross fixed capital formation ........................................................................ 38 3.3.4 Acquisition less disposal of valuables ........................................................... 39 3.3.5 Changes in inventories ................................................................................... 39 3.3.6 Exports and imports of goods and services ................................................... 40

4
Chapter 4. Methods for other parts of the system .......................................................... 42 4.1 Value added ................................................................................................................ 42 4.2 Taxes and subsidies on products ................................................................................ 42 4.3 Real national income .................................................................................................. 42
Appendix 1 English translation of some concepts and names of institutions
mentioned in the Inventory. ..................................................................... 43

5
Chapter 1. General procedure
1.1 Introduction This report describes how the final Icelandic national accounts are calculated at constant
prices. At current prices, national accounts can be estimated by using three methods, the
expenditure approach, the production approach and the income approach. In Iceland’s
national accounts, GDP is not independently estimated using the income approach. From
these reasons it is already impossible to use that method to measure GDP at constant prices.
From a theoretical point of view the income approach is also excluded whereas one of the
income components, the operating surplus, can not be split up between price and volume
components so no volume estimate is possible.
Both of the other two methods, the production approach and the expenditure approach, can be
used for calculating GDP at constant prices. In Iceland, both methods are used but the
expenditure approach is the dominant one in determining the volume growth of GDP although
the production approach is calculated in full detail. Both methods should give the same result
but for the time being that is not the case in Iceland. So far the two methods are not balanced
and already at this state of the description it is worth emphasising that a considerable
difference occurs. For recent years the differences are as follows.
Table 1.1 The GDP growth rate in Iceland, a comparison between the two methods
1999 2000 2001 2002 2003 2004 2005
Growth rate, the expenditure approach 4.1 4.3 3.9 0.1 2.4 7.7 7.1
Growth rate, the production approach 5.2 5.9 4.6 -0.7 3.5 6.9 7.4
In some of the years this difference is of a great concern and due to that a special
development work was undertaken by Statistics Iceland in order to eliminate this difference
by constructing supply and use table at constant prices for the years 2002 and 2003. The first
result of that work was completed in September 2007 and sent to Eurostat which supported
the work financially. The result of that supply and use table showed a growth rate in the
range between the expenditure and the production approach. This result is still considered as
preliminary and it has not yet been incorporated into the regular published data.
In both the expenditure and production approaches annual chain linking has been applied
since September 2005 and all time series have been revised back to 1990 according to the
chain linking methods.
The description given in this report is preliminary in the sense that it refers to the present
methods before any amendments have been incorporated from the forthcoming balanced
supply and use table of 2002 and 2003.
The structure of this report follows recommendations from Eurostat B1/CN 496e. The
methods used are classified into A, B or C method. This classification follows the criteria
given in the Handbook on price and volume measure in national accounts, published by
Eurostat. A quick look at the methods applied, indicates that the C methods are still used in
far too many cases. However, it is worth mentioning that although the C method is used in
many activities, these are often small. In order to emphasize the importance of the C method,

6
its share is shown explicitly for each activity section. One of the conclusions which can be
drawn from this report is that in some important cases the share of the C methods can be
diminished merely by a more careful selection of price indices. So far this has not yet been
done so the methods described here are the methods which are followed now. Some
improvement will be introduced soon.
1.2 The expenditure approach In section 3.3 below a more detailed description will be given on how the individual
components of the expenditure approach are calculated at constant prices. A summary
description of the calculation procedure is given here.
The household final consumption expenditure at current prices is available in a COICOP
breakdown down to 3 digit level. The total number of items individually estimated is
approximately 142 items. The calculation at constant prices is carried out at the same level of
disaggregating covering 142 items. The various sub-indices of the consumer price index are
widely used for the constant price estimates and this is the main method used. For some
products such as agricultural products, electricity and hot water, the constant price estimates
are based on direct estimates of quantities multiplied by the unit prices of same products at
the base year prices. The latter method is only considered acceptable when the quantities are
detailed, well defined and easily recognized. In some cases the base year values are
extrapolated with volume indices. An example of this is the gross rentals of dwellings.
The government final consumption expenditure at current prices is available in COFOG
breakdown down to 4 digit level for central and local governments. The constant price
estimates are made on an aggregated level and entirely from the cost side where the
compensation of employees, the consumption of fixed capital and intermediate consumption
are each deflated on an aggregated level by the most appropriated price index. So far, no
direct estimate of output has been calculated for government final consumption.
The gross fixed capital formation at current prices is available for most of the activities in a
cross classification by 10 type of assets and by industry down to 4 digit level of activity in
NACE rev.1 classification. The constant price estimates are made on a 2 digit activity
breakdown where each activity is broken down to the same 10 types of assets. Each time the
most appropriate price indices are used like building cost index, unit value indices for
specified imported goods, wage indices in the private sector, market price indices for
dwellings and price indices for personal computers as a sub-item in consumer price index.
Exports and imports of goods at current prices follow the Icelandic Customs Tariff, which is
an eight digit classification that complies with the six digit HS classification, with the addition
of two digits that are used in some instances for more detailed breakdown according to
Icelandic requirements. From this detailed classification, unit value indices are calculated and
used for constant price estimates of exports and imports.
Exports and imports of services are available at a much less disaggregated level than goods.
The main items are transportation, travel and other services and these items are deflated by
some general price indices like current exchange rate and the inflation rate in OECD
countries.
1.3 The production approach In Icelandic National Accounts the production approach plays a secondary role to the
expenditure approach. However, in recent years there exists a detailed disaggregation of
production accounts by activity whereas the number of production accounts at current prices
7
is now around 420. So far, production accounts do not exist at constant prices, only gross
factor incomes. For all market activities the gross factor incomes at constant prices are
derived from the volume indices of output value of each activity. By doing that it is assumed
implicitly that constant input/output ratio prevails. Double deflation of production accounts,
i.e. deflation of both output and intermediate consumption, is never used in these calculations.
Several years ago, double deflation methods were developed and used in agriculture and
fishing with bad results, due to inaccurate information of products used as intermediate
consumption and of price developments of these products.
For non-market activity gross factor incomes are entirely derived from the cost side, that is
by deflating separately compensation of employees, consumption of fixed capital and
intermediate consumption by the most appropriate price indices. So far no direct volume
indicators have been developed for non-market activities.
1.4 Annual and quarterly chaining In September 2005 annual chain linking was introduced, replacing constant prices with a
fixed base year of 1990. The new methods were applied back to 1990. The new methods were
applied both for the output and expenditure approaches. Prior to that point of time the annual
chain linking already had been used for several years for the output approach and volume
changes by activity were chain linked from 1990 onwards.
The constant price estimates are undertaken in such a way that the current price values are
deflated with price indices having the previous year as base year. Thus the base year changes
annually. Subsequently the individual year-to-year growth rates are chained and thereby a
combined chain index has been compiled. This is done on the most detailed level as described
in section 3.2 below.
Quarterly growth rates of GDP were also chain linked in September 2005 and all time series
recalculated back to 1997, 1st quarter which is the first period of quarterly national accounts in
Iceland. The method used is the annual overlap method where each quarter of the current year
is estimated at the annual average prices of the previous year.
1.5 Publishing of the Icelandic national accounts at constant prices
At constant prices the Icelandic national accounts are published both as volume indices and
values where the year 2000 is the reference year. Annual chain linking has the property that
the volumes of sub-aggregates “line by line” do not add up to the volume of the aggregate,
also calculated “line by line”. This causes the non-additive problem in all time series except
for the reference year and the year t+1, where t is the reference year.
When publishing chain indices in the Icelandic national accounts the non-additive indices are
published directly and no attempt is done in trying to eliminate discrepancy of this kind.
8
Chapter 2. General information on
main sources used
2.1 Introduction In this chapter a description is given of the price data sources from which deflators are taken.
Due to intensive use of consumer price index and its various sub-indices a rather detailed
description is given of that price index below. A less detailed description is given on building
cost index, the unit value indices of exported and imported goods and producer price indices.
2.2 The Consumer Price Index (CPI)
2.2.1 Concepts and definitions The concepts and definitions used in the CPI for Iceland follow the CPI Manual and are also
in line with the recommendations of the 1995 ESA. There is one exception: illegal goods and
services are excluded from the CPI. However, this exclusion is standard practice in price
indices and is in agreement with specific EU regulations for HICP.
The weights for the CPI are largely based on the yearly Household Expenditure Survey
(HES). The concepts and definitions for the HES follow international standards and closely
apply with those of the CPI.
Expenditure estimates from the HES are compiled at a sufficient level of detail for
commodities and services to allow compilation and detailed analysis of price movement.
2.2.2 Scope The Consumer Price Index Act, 12/1995 provides that the index must reflect prices
throughout the country as far as practicable. Accordingly, Statistics Iceland collects prices in
Reykjavik and three other major centres. However, no regional weights are used in
calculating the national CPI, nor are any regional or city indices produced. There is no
significant user demand for such indices.
The CPI covers the expenditures of all resident non-institutional households (both urban and
rural), where at least one member of the household is aged between 18 and 74 years. All
income groups are covered. Also included are households whose major activity involves an
unincorporated business activity with separate records for business and consumption
purchases. Similarly, households whose primary activity is farming or fishing are included.
The CPI reflects purchases of all goods and services offered to households in Iceland,
including the shelter services of owner-occupied dwellings. The CPI weights include
own-account production of vegetables, meat, and fish for own final consumption. As noted
above, the CPI excludes illegally sold goods and services.
The Icelandic CPI includes owner-occupied dwellings on the basis of simple user cost.
9
The structure of the CPI, based on COICOP, involves 12 major groups (2-digit COICOP),
39 classes (three-digit), 98 subclasses (four-digit), 654 basic headings (seven-digit), and
approximately 4,000 items.
2.2.3 Basis for recording The weights for the goods and services in the consumer basket are valued at purchasers’
prices including trade and transport margins and value added tax. Own-produced
consumption of vegetables, meat, and fish is valued at market purchasers’ prices.
The product specifications included in the CPI are usually very detailed and include price
determining characteristics relating to the terms of transactions. For example, prices include
the effects of unconditional discounts and rebates where applicable.
Up to January 2008 prices were obtained in respect of the first two working days of each
month. As of January 2008, the timing of the data collection for the compilation of CPI and
the calculation of the CPI changed, cf. Act no. 27/2007. This is in accordance with HICP
regulation. From January 2008 the CPI is based on prices prevailing around the middle of
each month. Prices are collected monthly for most items. Prices for public tariffs, such as
garbage, sewerage and water supply usually change annually but other public tariffs such as
kindergarten fees, and medical services can change more frequently. In such case price
checks are made regularly and when a price change is detected it is incorporated in the CPI in
that month.
The recording of prices for packaged holidays occurs in the month in which consumption at
the observed price commences, not the month in which the actual price is paid. For example,
summer packaged holidays are consumed in August but may be paid for several months
earlier. Such prices are recorded in the CPI when the services are actually consumed, i.e.,
August.
2.2.4 Sources The basis of the consumer price index is Household Expenditure Surveys (HES), which
Statistics Iceland carries out regularly. A survey was carried out in 1995 and the index from
1997-2001 was largely based on its results. From the year 2000 household expenditure
surveys are carried out continuously and from March 2002 the results are used for annual
rebasing.
The survey cycle is three years and SI selects as a single-stage random sample for the HES for
approximately 1,200 household units each year from the national population register. The
actual number of responding households over the three-year period is in the interval 1,700-
1,800 each year; the response rate being 45-49 percent due to non-response and other factors.
Statistics Iceland corrects for the bias attributable to the non-respondents, using data obtained
from the HES and from other sources on family size and type and other major household
characteristics. Statistics Iceland also compares the data with geographical distribution data
from the population register.
The samples of households for each year are spread evenly over the year in 26 two-week sub
samples. Respondents submit information of day-to-day expenses and also report
expenditures for a three-month period for less frequently occurring expenses. Extensive use is
made of the receipt approach by collecting cash register receipts in place of purchases
itemized in diaries provided to respondents. By 2002, 77 percent of all entries were taken
from cash register receipts. In the case of food and beverages, 89 percent of entries were

10
taken from cash register receipts. In the remaining cases, Statistics Iceland used itemized data
reported by respondents in diaries.
Household expenditure data are compiled on a three-year moving average basis. For example,
data have been compiled for the years 2004 to 2006. The data for 2004 and 2005 were
recalculated at 2006 prices for the purposes of deriving CPI weights. Standard errors are
calculated for the main aggregates arising from the HES data. Standard errors for total
expenditures are less than 2 percent and for groceries less than 1 percent. Where standard
errors are greater than 20 percent, those particular data cells show an asterisk accompanying
the figure indicating that the figure should be used with caution.
2.2.5 Missing prices, new products and quality changes For missing prices in groceries, the price change is calculated in respect of items available in
two consecutive periods. For other goods and services, a missing price can be carried forward
for a maximum of three months before a replacement is selected which is in accordance with
Eurostat’s rules for the HICP. A replacement item is selected by choosing a close substitute
for the replaced item. Products that become permanently unavailable are replaced in the
sample.
New products are mainly introduced when the index is rebased in March each year.
Occasional exceptions are made when items become significant items. For example, a new
road with a toll charge was introduced immediately, replacing a ferry service. A certain
amount of overpricing goes on in which items are priced for several months before being
actually incorporated in the CPI compilation. This allows the possibility of deferring
introduction of a new item until it is being sold in reasonable quantities and avoids the effects
of introducing a new item at a relatively high price, which may subsequently fall significantly
when the item is sold in larger quantities.
Some clothing, recreational, and food items are regarded as seasonal items with different
ranges of goods being priced in the summer and winter seasons. The prices of the summer
goods are repeated in the index at the close of summer, and the same treatment is applied to
winter goods. The method is consistent with international guidelines.
Prices are adjusted to remove the effects of quality changes. The procedures used vary
according to the nature of the changes. In many cases attempts are made to obtain a “bridge”
between the former and new product so that the difference in price implicitly reflects the
difference in quality. Car prices are obtained, together with prices for various options. The
option prices are used to identify and eliminate the effects of quality change. On occasions,
when there are significant changes in quality, it is necessary to evaluate the effects of quality
directly through an examination of car specifications.
2.2.6 Statistical concepts Theoretically speaking, there are two leading types of index calculations:
fixed base indices
cost of living indices.
In a fixed base price index, consumption patterns are kept constant and usually the index is of
Lowe type. Special cases of a Lowe index are Laspeyres with an older base or Paasche index
with a new base. Superlative indices are symmetric and reflect theoretically a true cost of
living index by taking into consideration both old as well as new base.

11
Five methods of calculation are used in the compilation of the Icelandic consumer price
index:
Relative of geometric mean prices (Jevon) for calculating approximately 56% of the
expenditures in the base.
The weighted relative of geometric mean prices on groceries, extending to
approximately 18% of the expenditures.
A Lowe, or relative of average prices (Duot), covering approximately 21% of the
expenditure.
A superlative index (Fisher), figuring in approximately 1% of the expenditures.
Indices comprising approximately 4% of the expenditure.
2.3 The building cost index
2.3.1 Concepts and definitions The building cost index shows changes to the cost of building a certain type of house
(residential block of flats) in the capital area. The building cost index has been calculated
from the year 1939 but its base has been changed four times, in years 1955, 1975, 1983 and
last in 1987. The base of the index is decided on in collaboration with the Icelandic Building
Research Institute, which is also consulted regarding revisions to the index. In addition to the
index on apartment buildings an index for non-residential buildings is calculated.
The building cost index is an input price index based on the pricing of both labour and
material needed to construct a residential building. The index is a Laspeyres fixed base index
and average prices are calculated as a relative of average prices (Duot). The index is
categorised according to type of activity and building stages.
2.3.2 Sources The basis of the index is the building cost of a certain "index house", which is a block of flats
in Reykjavik.
Every month prices in about 90 companies and stores are surveyed. However, some prices are
collected less frequently. Prices are collected through faxes, email, telephone interviews with
outlets as well as over the internet.
The index is based on pricing in the middle of every month. The index is based on accurate
accounting of costs at the building of the index house and is therefore fundamentally accurate
and reliable. However, like fixed base indices it does not measure changes in substituion or
productivity in construction.
2.4 The unit value indices of exported and imported goods
For exported and imported goods, unit value indices are calculated using Fischer formula for
accumulated monthly and annual figures. Unit value and volume indices are based on data
from the external trade database of Statistics Iceland. Imports are classified by main economic
categories and exports by mode of processing. Classification used to define commodity
groups for which index numbers are calculated is the 8 digit Icelandic Custom Tariffs which
follows the Harmonized System (HS) to the level of 6 digits. The data is also classified by
countries.

12
Preliminary quarterly indices are calculated by using Laspeyres formula but final quarterly
figures are based on Fisher formula. Volume index numbers are the quotient of the value and
unit value index numbers. Price index numbers are calculated using Laspeyres formula.
The use of value indices as an approximation for price indices has several drawbacks.
The main problems that arise are connected to composition changes and the attempt to
eliminate quality changes from price changes. This can be explained as follows:
Although the Custom Tariff classification in its most disaggregated form is rather
detailed the possibility cannot be ruled out that one number contains more than one
commodity or commodities that are of different quality, and therefore at different
prices. By using stratification by countries, within each tariff number an attempt is
made to minimize these problems.
Frequently changes are made to the definition of the tariff numbers, i.e. new numbers
are added (one number is split into many) or numbers are deleted and they included
with others. By paring old and new numbers together problems of this type can be
eliminated to some extent.
Another problem is how to exclude from the calculations extreme price changes, which are
considered to reflect changes in composition rather than in prices. This is done by using upper
and lower limits for price changes. In general these boundaries are set as 50% increase and
33% decrease in the unit prices in foreign currency plus the inflation rate in Icelandic main
trading countries plus change in exchange rate. It is possible to change the boundaries for
individual commodities if direct information indicates that price changes are exceeding these
limits.
2.5 The Producer Price Index (PPI) The 1995 ESA is followed regarding determination of index output weights for the PPI.
Concepts and definitions given in the Producer Price Index Manual (PPI Manual) are
followed regarding the specification of individual goods and services and the price
measurement.
The weighting concept is the market output of finished goods and services (as defined in 1995
ESA) or value of production (as defined in the PPI Manual).
Basic prices are obtained and used in the PPI. Only actual transaction prices are used. The
export prices obtained for both manufacturing products and fish products are f.o.b. prices and
are calculated from quantities and values obtained monthly from the selected respondents.
Prices and quantities for industrial products are collected electronically directly from the
firms.
The index is compiled using superlative formulas (Fisher) at the elementary level as well as
the aggregate level. Elementary weights are calculated from the values of sales reported by
each respondent. The aggregate weights are estimated annually using the PRODCOM survey
on total value of sales of manufacturing products. The weights are then updated monthly
using submitted data on production value in the previous month.
Average prices for each respective month are used in the index calculation. Monthly prices
for manufacturing products are compiled from quantities and values of sales for the month as
reported by respondents.
13
Apart from fish products, the regular dissemination of PPI started in May 2004 with the 4th
quarter of 2003 as the reference period. The producer price index was initially compiled with
the 4th quarter of 2003 as a reference period. The 4th quarter of 2005 was established as a
reference point alongside an increase in the number of published PPI sub-indices in 2006. As
of January 2007 the index is compiled as a monthly index with the 4th quarter of 2005 as a
reference point. The total is also disaggregated between products exported and sold
domestically.
Until 2006 two sub-indices of the producer price index were compiled and published
quarterly, one for fish products and the other for manufacturing products excluding fish. As of
the first quarter of 2006 sub-indices for products sold domestically, exported products and
exported products excluding fish were introduced. As of 2007 the index is published monthly
and sub-indices for food production, power intensive industry products and finally exports
excluding marine products and power intensive industry products are available, compiled
back to the 4th quarter of 2005.
The PPI is still in the development process and the use of it in national accounting so far is
limited to fish products only. So far, this index looks promising and in 2008 it is on the work
programme to disaggregate the index on 2 digit NACE level within manufacturing for internal
use in Statistics Iceland.
Statistics Iceland intends further to develop the PPI. The next steps will be PPI for electricity
production but the development of PPI for services is not yet on the agenda.
2.6 The wage index The wage index is a quarterly price index and shows the changes of regular hourly wages in
the private sector by occupational group and economic activity. The index also shows
changes of wages in the public sector. The wage index by activity is available from the 1st
quarter of 2005.
The index is based on a sample survey conducted by Statistics Iceland. The data are collected
elctronically on a monthly basis directly from the company’s payroll systems and contain
information on all labour cost. A sample is drawn out of following activities of the private
sector:
Section D, Manufacturing
Section F, Construction
Section G, Wholesale and retail trade; repair of motor vehicles, motorcycles and
personal and household goods
Section I, Transport, storage and communication
Section J, Financial intermediation
For the public sector the data is collected directly from the payroll systems of local
governments and from the Financial Management Authority. The sample covers around 24
thousand employees in the private sector and 14 thousand employees in municipalities,
including the capital city of Reykjavik. Statistics Iceland collects monthly data on salaries of
all state employees from the Financial Management Authority (around 20 thousand
employees). In order to detect changes in wages caused by structural changes, which have
occurred occasionally in the public sector, partly through collective agreements, a separate
random sample of 600 state employees is used for control purposes to approach more “pure”
price changes.

14
The use of the wage index for estimation of volume changes in national accounts is limited.
The most important use of it concerns non-market activities which are deflated from the cost
side. Other examples are deflation of output where labour services are the main component.
Until March 2007 the wage index was only disaggregated into two activities, the private
sector and the government sector including banking. At that time Statistics Iceland published
the present index, disaggregated as described above, with a backwards calculation until the 1st
quarter of 2005. That is a big step forward and it will enable more intensive use of the wage
index in national accounting in future.

15
Chapter 3. Methodologies by activity and
final expenditure
3.1 Introduction The first sections of this chapter contain a description of the methods used for constant price
estimation by activity according to the Icelandic version of NACE Rev.1. In the final sections
of the chapter, a similar account is given of the main categories of final expenditure, i.e.
household final consumption expenditure, government final consumption, gross fixed capital
formation, changes in inventories and exports and imports of goods and services.
A description is given of how the actual deflation is performed and the methods applied are
assessed against the background of the recommendations for deflating in the EU “Handbook
on price and volume measures in national accounts”, Eurostat 2001.
In accordance with the Commission Decision of 30 November 1998, the Handbook divides
the deflation methods into three groups as follows:
A methods: most appropriate methods
B methods: those methods which can be used in case an A method cannot be applied
C methods: those methods which shall not be used
A-methods require that a price index which is used relates to the products for which the
constant-price calculations are to be made. The index is supposed to show values at basic
prices for output and purchasers´ prices for final demand and take notice of changes in
quality.
B-methods make use of producer price indices (or purchasers´ prices when relevant) that do
not exactly relate to the items for which constant price calculations are to be made or take
account of changes in quality.
Alternatively, a volume index that takes changes in quality into account or a CPI that relates
to most of the current product or product group, meets the requirements of an A-method. For
example, the output of hairdressing can be deflated by means of CPI for hairdressing,
adjusted for any changes in taxes, subsidies or margins.
C-methods are based on input methods or price indices that are not relevant to products in
question, e.g. wage index, total CPI or PPI relating to input in the product group to be
defined.
The distinction between A, B and C methods in the production approach is a little more
complicated. The key element is the value added which is the difference between output and
intermediate consumption. Value added is therefore a balancing item where there is no price
or volume component. Value added at constant prices has to be defined by convention.
ESA95 states that the theoretically correct method to calculate value added at constant prices
is by double deflation, i.e. deflating separately the two flows of the production account output
and intermediate consumption and calculating the balance of these two deflated flows. The

16
only A method for value added is the double deflation method or the “double indicator
method” as it is termed in the manual.
When evaluating the methods described below it should be kept in mind, as described in
section 1.1 above, that the growth rates varies between expenditure and production
approaches and they are still not balanced in a supply and use table at constant prices. The
expenditure approach is the dominant one and the one used in global aggregates.
3.2 The production approach
3.2.1 General description In absence of any supply and use tables at constant prices, another and more inaccurate
methods have to be used with the consequences that discrepancy in growth rates occur
between production and expenditure approaches. At current prices approximately 420
production accounts are constructed following the NACE activity classification at 5 digit
level. For every single of these activities, a separate volume index is calculated. That index is
calculated by first constructing a comparison table for every single activity containing
following characteristics:
Output at current prices (basic prices)
Intermediate consumption at current prices
Value added at current prices
Gross factor income at current prices
Consumption of fixed capital at current prices
Net factor income at current price
Compensation of employees
Operating surplus
Calculated ratio: Intermediate consumption/Output
Calculated ratio: Compensation of employees/Output
Wages and salaries paid according to the Pay-as-you-earn Register
Volume indicators, one or more, for that specific activity if available
VAT turnover in that specific activity
Number of persons employed in that activity
CPI total
Building cost total
Sub-items of CPI or building cost index when applicable
Wage index in either the private sector or in the public sector and banks
After compiling the above items for each activity, a quality check is carried out on the size
and cost structure of the production account at current prices by comparing time series of the
ratios of intermediate consumption and output and compensation of employees and output.
Compensation of employees is also compared with wages and salaries paid according to the
PAYE register, taking into account employers´ social contributions which are included in
compensation of employees but excluded from the PAYE register. This is a further quality
check of the check already performed when the production accounts at current prices were

17
constructed. Amendments of the production accounts at current prices are made if they do not
pass the quality check.
After passing the quality check the next step is the deflation of the output and VAT turnover
according to the most appropriate price index. When applicable sub-items of CPI or building
cost index are available they are used, otherwise CPI total or building cost total.
Compensation of employees and wages and salaries are also deflated using either the wage
index for the private sector or the public sector and banks. Value added is deflated by the
same price index as output, mostly used for information. From these calculations the
following volume indices and indicators of growth rates are derived:
Output growth rate
VAT growth rate
Direct volume growth rate when available
Growth in the number of persons employed
Growth of compensation of employees in excess of wage index
Growth of wages and salaries paid in excess of wage index
Growth of value added
Each one of these indicators is carefully investigated and a comparison is made. Provided that
there is not a big difference between the 3 first items, i.e. output growth, VAT growth and
direct volume growth, the last one, the volume growth, is chosen as the volume growth rate
for that activity. Frequently, discrepancy occurs and then some investigation is made to try to
understand it. In many cases the final decision is an average of two or more of the above
indices, provided that the long term developments do not differ considerably. In general, it
can be stated that the three first indicators are more frequently used than the other.
From these evaluations one ends up with a volume index for each activity. This volume index
is used as a volume index of value added. This is apparently an approximation. Following the
ESA 95 manual “the theoretical correct method to calculate value added at constant prices is
by double deflation, i.e. deflating separately the two flows of the production account (output
and intermediate consumption) and calculate the balance of these two revalued flows”.
Following the price and volume manual the term “double deflation” might be better expressed
as “double indicator method”, since it also encompasses methods that are based on volume
extrapolation.
In the price and volume manual it is stated that the double indicator method is the only
accepted A method. Double indicator method is never used for estimating growth rates for
any of the activities in Iceland. Several years ago this method was used in agriculture and
fishing but with doubtful results, due to extreme fluctuations in growth rates. From this it can
already be concluded that no volume indices for activities in Iceland are calculated by
methods which are acceptable as A methods. In all cases single indicator methods are used.
According to the price and volume manual such methods can be used as B methods if
intermediate consumption is a large share of output and the data required applying double
indicator methods are not reliable enough. It can be stated that in the case of Iceland, data on
intermediate consumption is not reliable enough to be used for double deflation. This is also
confirmed by the past experience of using double deflation in agriculture and fishing.
From this the final remark to be made is that the volume growth rate by industry in Iceland is
mainly based on price deflation of output or volume extrapolation of output. Such methods
can never be A methods but the question is: Are the output measures applied sophisticated

18
enough to be called B methods? The answer to this varies by activities as can be seen in the
following sections.
Based on the comparison table as described above, various growth rates are conducted and
the most appropriate indicator is selected for each activity group down to 5-digit level. In
some cases an average of two or more indicators is taken.
In the following an overview is given of the indicators used for estimating the growth rates
within each activity. The indicators of the growth rates used are classified in the following
categories I to VIII. In sections 3.2.2 to 3.2.14 below a reference is given to these categories
and the methods used are ranked into A, B or C methods.
Indicators used for estimating growth rates of activities, classified into categories I to VIII
I Output deflated by the most appropriated price index, most often a sub-item of CPI
II VAT turnover deflated by the most appropriated price index, most often a sub-item of CPI
III The average of I and II
IV Volume growth rate derived from production statistics by activity
V The average of I and IV
VI Output deflated by a general price index like CPI or building cost index
VII The two main components of value added, the compensation of employees and consumption of
fixed capital, deflated by the most appropriate labour cost index and the building cost index,
respectively
VIII Compensation of employees deflated by the wage index in the private sector
3.2.2 Agriculture, hunting and forestry (NACE Rev.1; A) The institution mainly responsible for compiling statistics on production in volume, sale and
unit prices of agricultural products is the Farmers Association of Iceland (FAI). The product
specifications in these statistics are very detailed giving homogenous products. Statistics
Iceland utilizes this information for constant price calculations for farming of animals (NACE
01.2) accounting for over 95% of the output value. In growing of crops, market gardening and
horticulture, the most appropriate sub-items of CPI are used for deflating the output value.
Until recently the year 1990 was used as a base year for estimating volume changes of
products in agriculture. At the time of writing the methods are under revision and annual
chain linking methods will be developed using the prices of previous year.
In the early stages of developing the methods of the production approach at constant prices in
the 1980s, an attempt was made to deflate intermediate consumption in agriculture separately
and thereby to construct a double indicator method. The reason behind this was the common
knowledge of a fluctuation of the input/output ratio in agriculture due to different weather
conditions. After several years of double deflation, this method was discontinued in 1993
because it brought results which were not credible. Since then, single indicator method has
been applied. Table 3.1 shows the methods used by activities in agriculture. Approximately
10% of gross factor income in agriculture is still deflated by C method. The remaining part is
considered to qualify as a B method and then it is assumed that the unit value prices are
detailed enough to take into account changes in quality.

19
Table 3.1 Indicators used for estimating the growth rates in agriculture, section A
Gross factor
Classific.
Income 2004 Indicators used into
Mill. % of all for estimating A, B and C
ISK activities growth rates methods
Agriculture, Section A 11.289 1,45% ... ...
01 Agriculture, hunting and related service activities 11234 1,44% ... ...
01.1 Growing of corps; market gardening; horticulture 1406 0,18% I B
01.11 Growing of cereals and other crops n.e.c. 274 0,04% I B
01.12 Growing of vegetables, horticultural specialties and
nursery prod. 1132 0,14% I B
01.2 Farming of animals 8654 1,11% IV B
01.23 Farming of swine 612 0,08% IV B
01.24 Farming of poultry 412 0,05% IV B
01.25 Other farming of animals 7629 0,98% IV B
01.25.1 Farming of mixed livestock 7364 0,94% IV B
01.25.2 Farming of fur animals 264 0,03% IV B
01.4 Agric. and animal husbandry service, ex. Veterinary 1161 0,15% Aver. of
VI and VIII C
01.5 Hunting and related service activities 14 0,00% Aver. of
VI and VIII C
02 Forestry, logging and related service activities 55 0,01% VI C
C methods, share of the section 10,4%
In view of that the measurement of output qualify as an A method as soon as the annual chain
linking methods have been introduced. However that is not good enough because the final
aim is not to measure the output but the value added. In estimating value added at constant
prices, single indicator method cannot be an A method. It only qualifies as a B method. Due
to former experience of the double deflation method it turned out to be not reliable enough in
agriculture.
3.2.3 Fishing (NACE Rev.1; B) The production accounts in fishing are constructed from the aggregated operating accounts of
enterprises in this activity, derived from the Enterprise Accounts Register.
The fish catch in tons and value is compiled by the Directorate of Fisheries. Figures are
compiled on quantity and value of the total fish catch and individual species for all Icelandic
fishing vessels independently of whether the catch is landed domestically or abroad. This
enables calculations of unit prices by the same disaggregating. From these data Statistics
Iceland calculates annual volume changes based on the prices of next to previous year, year
T-2.
In the case of fish farming such detailed information is not available. Fish farming accounts
for less than 2% of the output value in fishing. The output value of fish farming at current
prices is derived from the Enterprise Accounts Register and the output is deflated by the
average changes of output deflated by the most characteristic items of CPI and compensation
of employees deflated by the wage index in the private sector.
As for agriculture, an attempt was made to develop double deflation method in fishing,
excluding fish farming. The result was bad and single indicator method was introduced again
but a few years later than in agriculture.
Table 3.2 shows the methods used by activities in agriculture. The methods used for
calculating the volume changes of the output of fishing industry are sophisticated enough to

20
qualify as A methods with the exception of fish farming which is a C method. A considerable
improvement is foreseeable in estimating volume changes in fish farming where it is planned
to make use of already available direct volume measure of slaughtered trout, salmon and other
species cultivated in fish farming.
Although the volume changes of output qualify as an A method, the volume changes of value
added do not satisfy the requirements of an A method as single indicator methods are applied.
Therefore the method used in fishing is a B method with the exception of fish farming where
the C method is still applied due to more inferior information of volume changes where the
value is deflated by a general price index.
Less than 1% of the gross factor income in fishing is still deflated by C method. This refers to
fish farming only. The unit value indices in fishing are considered to be detailed enough to
take into account changes in quality.
Table 3.2 Indicators used for estimating the growth rates in fishing, section B
Gross factor
Classific.
Income 2004 Indicators used into
Mill. % of all for estimating A, B and C
ISK activities growth rates methods
05 Fishing, op. of fish hatcheries and fish farms. 39.368 5,04% ... ...
05.0 Fishing, fish farming and related services 39.368 5,04% IV B
05.01 Fishing 39.144 5,01% IV B
05.01.1 Operation of trawlers 5.410 0,69% IV B
05.01.2 Operation fish-processing vessels 13.205 1,69% IV B
05.01.3 Operation of fishing vessels over 10 GRT. 17.654 2,26% IV B
05.01.4 Operation of fishing boats 2.875 0,37% IV B
05.02 Operation of fish hatcheries and fish farms. -251 -0,03%
Aver. of
VI and VIII C
05.03 Service activities incidental to fishing 475 0,06%
Aver. of
VI and VIII C
C methods, share of the section 0,6%
3.2.4 Mining and quarrying (NACE Rev.1; C) Activity C is of a tiny importance in Iceland and consists mainly of quarrying of sand. The
output value of the activity at current prices is derived from the Enterprise Accounts Register.
In recent years this activity is now covered by the manufacturing production statistics and that
enables improved output statistics and quantity statistics. This new source will be
implemented soon. So far the output has been deflated by using the building cost index which
is definitely a C method. As soon as the production statistics has been implemented the B
method will replace the C method in this activity.
Table 3.3 Indicators used for estimating the growth rates in mining and quarrying, section C
Gross factor
Classific.
Income 2004 Indicators used into
Mill. % of all for estimating A, B and C
ISK activities growth rates methods
14 Other mining and quarrying 979 0,13% VI C
14.2 Quarrying of sand and clay 814 0,10% VI C
14.3 Mining of chemical and fertilizer minerals 17 0,00% VI C
14.4 Production of salt 0 0,00% VI C
C methods, share of the section 100,0%

21
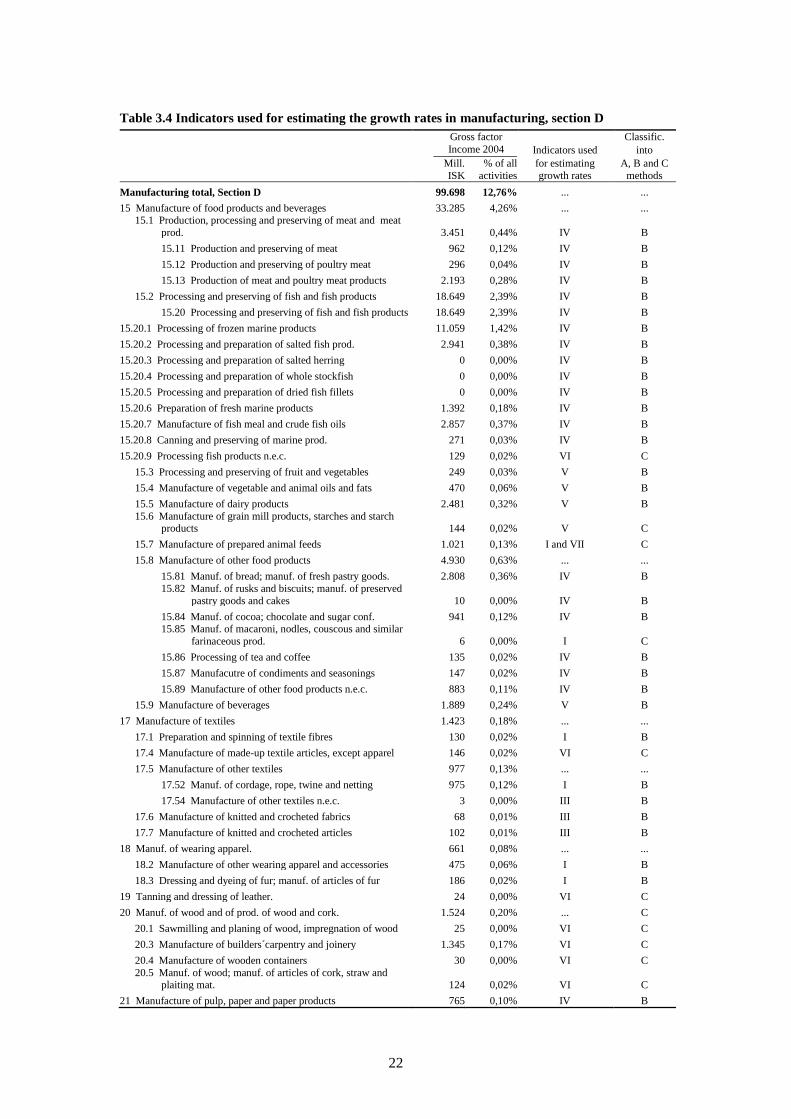
3.2.5 Manufacturing (NACE Rev.1; D) Methods applied for estimating volume changes in manufacturing are described in two parts.
In the first part a description of processing and preserving of fish and fish products is given.
The second part describes the remaining part of manufacturing. The reasons are that due to
the importance of fish and fish processing in Iceland much more data are available and of
higher quality for that industry than other activities of manufacturing.
Processing and preserving of fish and fish products (NACE Rev.1; 15.2)
Both in the case of fish processing and other manufacturing, the Enterprise Accounts Register
is the main source for constructing the production accounts. The fish processing differs from
other manufacturing in having production statistics which is a far more detailed than for other
activities. That enables to construct more sophisticated volume indices.
At current prices the activity 15.2 Fish processing is further broken down into 9 sub groups
and a separate volume index is constructed for each one. The volume indices are derived from
the value of exported fish products and the unit value indices which are calculated from the
most detailed breakdown of the custom tariff followed in the external trade statistics as
described in section 2.4 above.
No attempt has been made to estimate volume changes for intermediate consumption. The
changes in volume calculated for output also applies for value added.
The methods used for calculating the volume changes of the output of fish processing
industry qualify easily as an A method. For value added, double deflation is not used and
therefore this does not qualify as an A method, but the method used is considered to be B
method.
Manufacturing excluding processing and preserving of fish and fish products (NACE Rev.1; D except 15.2)
The activities within this section are very diverse and different methods are used to estimate
the size of each activity at current prices. The main data source is the Enterprise Accounts
Register but with some modifications.
For constant price estimates one of the indicators constructed is the annual volume index of
manufacturing production. That index might be the one most straight forward to use, at least
for measuring volume changes of output. That index has been available since 1996 and has
been gradually incorporated. However, this index has some serious drawbacks. One is that it
expresses sales, not production. Another is that the sample varies and is often of uncertain
coverage. Therefore, that source must be used with a care and other indicators utilized.
In manufacturing a comparison table as described in section 3.2.1 is also necessary. Such a
table is constructed for every single activity down to the 5-digit level.
Table 3.1 shows which one of the indicators I to VIII described in section 3.2.1 above are
used in each activity. Aggregation of the results shows that method B is used in
approximately 80% of manufacturing, using the gross factor income as a share of measuring.
This means that the C method is used in the remaining 20% of manufacturing.
In the case of large equipment, special purpose machinery and computers no special methods
are applied. Of these activities the most important one is the building and repairing of ships
and boats etc. In that case the method VI is used and thus the output is deflated by a general
price index, here the building cost index, classified as C method.
22
Table 3.4 Indicators used for estimating the growth rates in manufacturing, section D
Gross factor
Classific.
Income 2004 Indicators used into
Mill. % of all for estimating A, B and C
ISK activities growth rates methods
Manufacturing total, Section D 99.698 12,76% ... ...
15 Manufacture of food products and beverages 33.285 4,26% ... ... 15.1 Production, processing and preserving of meat and meat
prod. 3.451 0,44% IV B
15.11 Production and preserving of meat 962 0,12% IV B
15.12 Production and preserving of poultry meat 296 0,04% IV B
15.13 Production of meat and poultry meat products 2.193 0,28% IV B
15.2 Processing and preserving of fish and fish products 18.649 2,39% IV B
15.20 Processing and preserving of fish and fish products 18.649 2,39% IV B
15.20.1 Processing of frozen marine products 11.059 1,42% IV B
15.20.2 Processing and preparation of salted fish prod. 2.941 0,38% IV B
15.20.3 Processing and preparation of salted herring 0 0,00% IV B
15.20.4 Processing and preparation of whole stockfish 0 0,00% IV B
15.20.5 Processing and preparation of dried fish fillets 0 0,00% IV B
15.20.6 Preparation of fresh marine products 1.392 0,18% IV B
15.20.7 Manufacture of fish meal and crude fish oils 2.857 0,37% IV B
15.20.8 Canning and preserving of marine prod. 271 0,03% IV B
15.20.9 Processing fish products n.e.c. 129 0,02% VI C
15.3 Processing and preserving of fruit and vegetables 249 0,03% V B
15.4 Manufacture of vegetable and animal oils and fats 470 0,06% V B
15.5 Manufacture of dairy products 2.481 0,32% V B
15.6 Manufacture of grain mill products, starches and starch products 144 0,02% V C
15.7 Manufacture of prepared animal feeds 1.021 0,13% I and VII C
15.8 Manufacture of other food products 4.930 0,63% ... ...
15.81 Manuf. of bread; manuf. of fresh pastry goods. 2.808 0,36% IV B
15.82 Manuf. of rusks and biscuits; manuf. of preserved
pastry goods and cakes 10 0,00% IV B
15.84 Manuf. of cocoa; chocolate and sugar conf. 941 0,12% IV B
15.85 Manuf. of macaroni, nodles, couscous and similar
farinaceous prod. 6 0,00% I C
15.86 Processing of tea and coffee 135 0,02% IV B
15.87 Manufacutre of condiments and seasonings 147 0,02% IV B
15.89 Manufacture of other food products n.e.c. 883 0,11% IV B
15.9 Manufacture of beverages 1.889 0,24% V B
17 Manufacture of textiles 1.423 0,18% ... ...
17.1 Preparation and spinning of textile fibres 130 0,02% I B
17.4 Manufacture of made-up textile articles, except apparel 146 0,02% VI C
17.5 Manufacture of other textiles 977 0,13% ... ...
17.52 Manuf. of cordage, rope, twine and netting 975 0,12% I B
17.54 Manufacture of other textiles n.e.c. 3 0,00% III B
17.6 Manufacture of knitted and crocheted fabrics 68 0,01% III B
17.7 Manufacture of knitted and crocheted articles 102 0,01% III B
18 Manuf. of wearing apparel. 661 0,08% ... ...
18.2 Manufacture of other wearing apparel and accessories 475 0,06% I B
18.3 Dressing and dyeing of fur; manuf. of articles of fur 186 0,02% I B
19 Tanning and dressing of leather. 24 0,00% VI C
20 Manuf. of wood and of prod. of wood and cork. 1.524 0,20% ... C
20.1 Sawmilling and planing of wood, impregnation of wood 25 0,00% VI C
20.3 Manufacture of builders´carpentry and joinery 1.345 0,17% VI C
20.4 Manufacture of wooden containers 30 0,00% VI C
20.5 Manuf. of wood; manuf. of articles of cork, straw and plaiting mat. 124 0,02% VI C
21 Manufacture of pulp, paper and paper products 765 0,10% IV B

23
22 Publishing, printing and reproduction of recorded media 9.231 1,18% ... ...
22.1 Publishing 4.999 0,64% ... ...
22.11 Publishing of books 868 0,11% I B
22.12 Publishing of newspapers 2.450 0,31% VI C
22.13 Publishing of journals and periodicals 481 0,06% VI C
22.14 Publishing of sound recordings 879 0,11% VI C
22.15 Other publishing 322 0,04% VI C
22.2 Printing and service activities related to printing 4.232 0,54% VI C
22.21 Printing of newspapers 0 0,00% VI C
22.22 Printing n.e.c. 3.553 0,45% VI C
22.23 Bookbinding and finishing 75 0,01% VI C
22.24 Composition and plate-making 543 0,07% VI C
22.25 Other activities related to printing 60 0,01% VI C
24 Manufacture of chemicals and chemical products 8.798 1,13% ... ...
24.1 Manufacture of basic chemicals 740 0,09% IV C
24.3 Manuf. of paints, varnishes and sim. coatings 530 0,07% VI C
24.4 Manuf. of pharmaceuticals products 6.998 0,90% I B
24.5 Manuf. of soap and detergents etc, perfumes and toilet
prep. 370 0,05% IV B
24.6 Manufacture of other chemical products 160 0,02% VI C
25 Manufacture of rubber and plastic products 2.590 0,33% ... ...
25.1 Manufacture of rubber products 500 0,06% III B
25.2 Manufacture of plastic products 2.090 0,27% III C
25.21 Manuf. of plastic plates, sheets, etc. 255 0,03% III C
25.22 Manufacture of plastic packing goods 633 0,08% IV B
25.23 Manufacture of builders' ware of plastic 67 0,01% III C
25.24 Manufacture of other plastic products 1.135 0,15% III C
26 Manuf. of other non-metallic mineral products 4.725 0,60% ... ...
26.1 Manufacture of glass and glass products 424 0,05% IV B
26.2 Manuf. of non-refractory and refractory ceramic products 18 0,00% III C
26.5 Manufacture of cement, lime and plaster 235 0,03% IV B
26.6 Manufacture of articles of concrete, plaster and cement 2.497 0,32% I B
26.7 Cutting, shaping and finishing of stone 221 0,03% I and VIII C
26.8 Manufacture of other non-metallic mineral products 1.330 0,17% IV B
27 Manufacture of basic metals 15.870 2,03% ... ...
27.3 Other first proc. of iron & steel and prod. of non-ESCE ferro-alloys 1.629 0,21% IV B
27.4 Manufacture of basic precious and non-ferrous metals 14.107 1,81% I B
27.42 Aluminium production 14.107 1,81% I B
27.5 Casting of metals 133 0,02% III C
28 Manuf. of fabricated metal prod., except mach. and equipm. 6.012 0,77% ... C
28.1 Manufacture of structural metal products 388 0,05% IV C
28.2 Manuf. of metal tanks and containers of radiatiors and
boilers 336 0,04% II C
28.4 Forging, pressing, stamping and roll forming of metal 21 0,00% II C
28.5 Coating of metals; general mechanical engineering 4.931 0,63% II C
28.6 Manufacture of cutlery, tools and general hardware 26 0,00% III C
28.7 Manufacture of other fabricated metal products 310 0,04% III C
29 Manufacture of machinery and equipment n.e.c. 4.682 0,60% III C
30 Manufacture of office machinery and computers -1 0,00% III C
31 Manuf. of el. machinery and apparatus n.e.c. 825 0,11% ... ... 31.1 Manufacture of electric motors, generators and
transformers 128 0,02% III C
31.2 Manufacture of electricity distribution and control apparatus 240 0,03% III C
31.4 Manuf. of accumulators, primary cells and primary
batteries 42 0,01% IV B
31.5 Manufacture of lighting equipment and electric lamps 39 0,00% III C
31.6 Manufacture of electrical equipment n.e.c. 376 0,05% III C
32 Manuf. of radio, TV and communication equipm. and apparatus 43 0,01% III C

24
33 Manuf. of med., prec. and opt. instrm. 2.667 0,34% VI C
33.1 Manuf. of med. and surg. eq. and orth. appl. 2.399 0,31% VI C 33.2 Manuf. of instruments and appliances for measuring,
checking etc. 236 0,03% VI C
33.3 Manufacture of industrial process control equipment 32 0,00% VI C
34 Manuf. of motor veh., trailers and semi-trailers 262 0,03% III C
35 Manufacture of other transport equipment 3.482 0,45% VI C
35.1 Building and repairing of ships and boats 1.998 0,26% VI C
35.3 Manufacture of aircraft and spacecraft 1.428 0,18% VI C
35.5 Manufacture of other transport equipment n.e.c. 56 0,01% VI C
36 Manufacture of furniture; manufacturing n.e.c. 2.218 0,28% ... ...
36.1 Manufacture of furniture 1.524 0,20% VI C
36.2 Manufacture of jewellery and related articles 212 0,03% III B
36.3 Manufacture of musical instruments 18 0,00% III B
36.4 Manufacture of sports goods 0 0,00% . .
36.5 Manufacture of games and toys 38 0,00% III C
36.6 Miscellaneous manufacturing n.e.c. 426 0,05% III C
37 Recycling 612 0,08% VI C
C methods, share of the section 35,3%
3.2.6 Electricity, gas and water supply (NACE Rev.1; E) Production accounts for these industries at current prices are derived from the company
accounts. The structure in these industries is characterized by few big companies owned by
the central government and the biggest municipalities on the one hand and a few small
companies owned by small municipalities on the other. The National Energy Authority
compiles production statistics from all suppliers and average unit prices by main categories of
usage. That refers both to electricity and hot water but the product specification of electricity
is hardly sufficient. However, these statistics enable construction of chain-linked volume
indices of output of A type but the value added volume index will be of B type as no
estimates are available on volume changes of intermediate consumption. Statistics Iceland
intends to collect more detailed breakdown of the output data in order to improve the quality
of the volume change calculations.
The quality of output statistics in division 41, Distribution of cold water is much lower. Here
the output value is deflated by using the building cost index as a proxy for price changes. That
is a C method. A summary of the methods used for estimating volume changes in section E is
given in table 3.5. Aggregation of the results shows that method B is used in approximately
95% of section E but C method is still used in 5% of the section. The gross factor income is
used as a measurement.
Table 3.5 Indicators used for estimating the growth rates in electricity, gas and water supply,
section E
Gross factor
Classific.
Income 2004 Indicators used into
Mill. % of all for estimating A, B and C
ISK activities growth rates methods
Electricity, gas and water supply Section E 28.557 3,66% ... ...
40 Electricity, gas steam and hot water supply 26.893 3,44% IV B
40.1 Production and distribution of electricity 21.654 2,77% IV B
40.3 Steam and hot water supply 5.240 0,67% IV B
41 Collection, purification and distribution of water 1.664 0,21% VI C
C methods, share of the section 5,8%
25
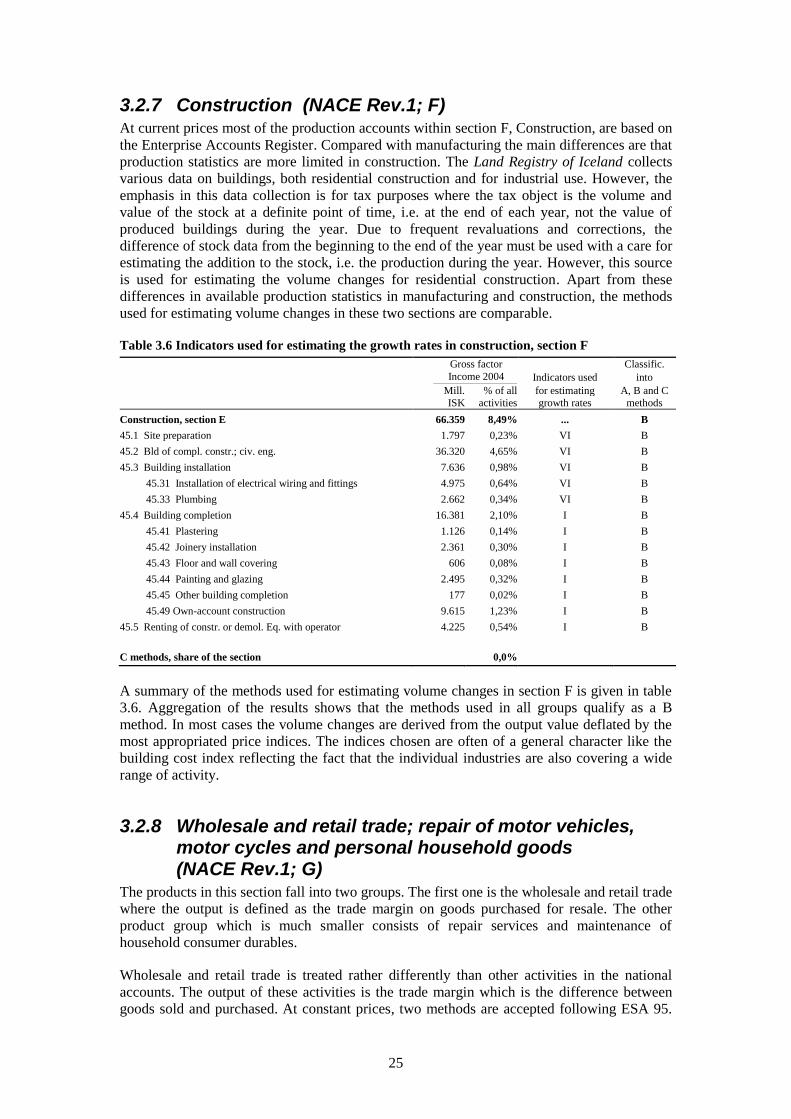
3.2.7 Construction (NACE Rev.1; F) At current prices most of the production accounts within section F, Construction, are based on
the Enterprise Accounts Register. Compared with manufacturing the main differences are that
production statistics are more limited in construction. The Land Registry of Iceland collects
various data on buildings, both residential construction and for industrial use. However, the
emphasis in this data collection is for tax purposes where the tax object is the volume and
value of the stock at a definite point of time, i.e. at the end of each year, not the value of
produced buildings during the year. Due to frequent revaluations and corrections, the
difference of stock data from the beginning to the end of the year must be used with a care for
estimating the addition to the stock, i.e. the production during the year. However, this source
is used for estimating the volume changes for residential construction. Apart from these
differences in available production statistics in manufacturing and construction, the methods
used for estimating volume changes in these two sections are comparable.
Table 3.6 Indicators used for estimating the growth rates in construction, section F
Gross factor
Classific.
Income 2004 Indicators used into
Mill. % of all for estimating A, B and C
ISK activities growth rates methods
Construction, section E 66.359 8,49% ... B
45.1 Site preparation 1.797 0,23% VI B
45.2 Bld of compl. constr.; civ. eng. 36.320 4,65% VI B
45.3 Building installation 7.636 0,98% VI B
45.31 Installation of electrical wiring and fittings 4.975 0,64% VI B
45.33 Plumbing 2.662 0,34% VI B
45.4 Building completion 16.381 2,10% I B
45.41 Plastering 1.126 0,14% I B
45.42 Joinery installation 2.361 0,30% I B
45.43 Floor and wall covering 606 0,08% I B
45.44 Painting and glazing 2.495 0,32% I B
45.45 Other building completion 177 0,02% I B
45.49 Own-account construction 9.615 1,23% I B
45.5 Renting of constr. or demol. Eq. with operator 4.225 0,54% I B
C methods, share of the section 0,0%
A summary of the methods used for estimating volume changes in section F is given in table
3.6. Aggregation of the results shows that the methods used in all groups qualify as a B
method. In most cases the volume changes are derived from the output value deflated by the
most appropriated price indices. The indices chosen are often of a general character like the
building cost index reflecting the fact that the individual industries are also covering a wide
range of activity.
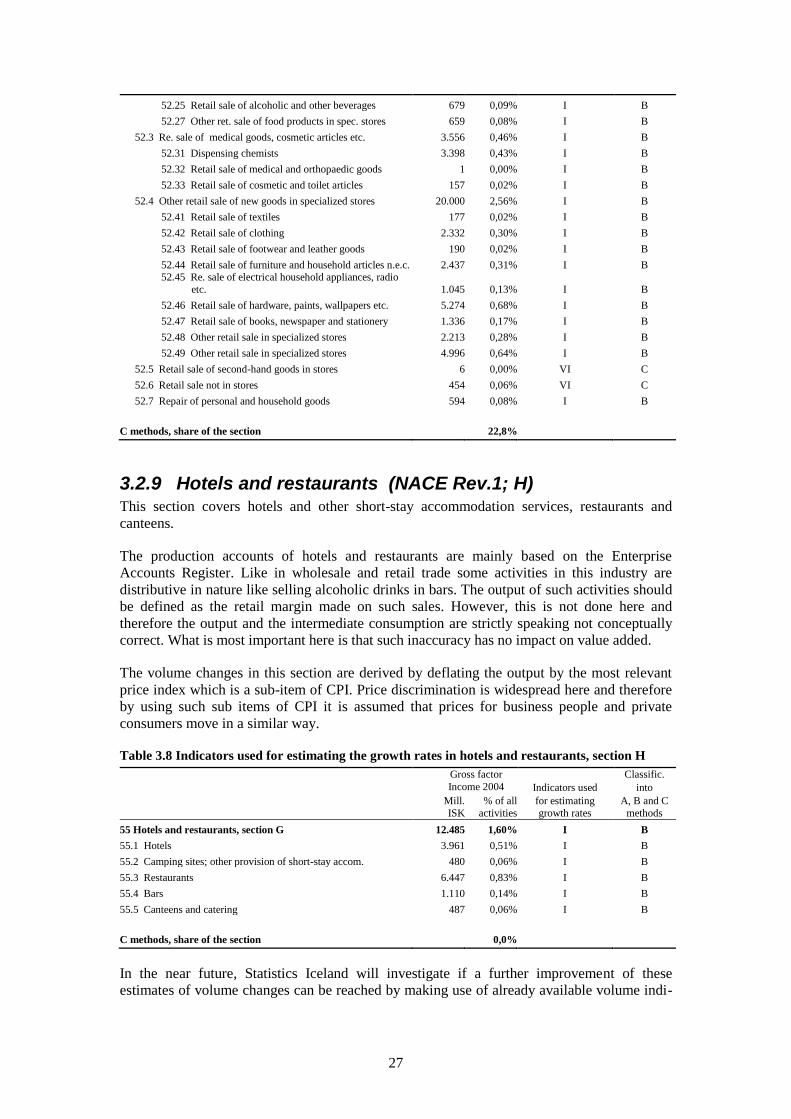
3.2.8 Wholesale and retail trade; repair of motor vehicles, motor cycles and personal household goods (NACE Rev.1; G)
The products in this section fall into two groups. The first one is the wholesale and retail trade
where the output is defined as the trade margin on goods purchased for resale. The other
product group which is much smaller consists of repair services and maintenance of
household consumer durables.
Wholesale and retail trade is treated rather differently than other activities in the national
accounts. The output of these activities is the trade margin which is the difference between
goods sold and purchased. At constant prices, two methods are accepted following ESA 95.

26
One is to deflate the goods purchased separately and the goods sold separately and measure
the difference. The alternative method is to extrapolate the trade margin of the base year
either by the volume of sales or by the volume of purchases made by the wholesale and retail
traders. To be correct this alternative has to take into account the fact that trade margins vary
amongst different products.
In Icelandic national accounts the alternative method is the one applied where an attempt is
made to estimate the volume of the trade margin by deflating the margin by the most
appropriate price index.
A summary of the methods used for estimating volume changes in section G is given in table
3.7. Aggregation of the results shows that method B is used in roughly 80% of section G but
C method is still used in more than 20% of the section. The gross factor income is used as a
measurement.
Table 3.7 Indicators used for estimating the growth rates in wholesale and retail trade, section G
Gross factor
Classific.
Income 2004 Indicators used into
Mill. % of all for estimating A, B and C
ISK activities growth rates methods
50 + 51+ 52 Wholesale and retail trade, section G 82.872 10,61% ... B
50 Sale, maint. rep. of motor veh; ret. sale of fuel 12.544 1,61% 50.1 Sale of motor vehicles 6.572 0,84% V B
50.2 Maintenance and repair of motor vehicles 4.104 0,53% I B
50.3 Sale of motor vehicle parts and accessories 1.434 0,18% I B
50.4 Sale and repair of motorcycles and related parts 55 0,01% I B
50.5 Retail sale of automotive fuel 379 0,05% III B
51 Wholes. and commission trade, ex. of motor vehicles 29.887 3,83% ... ...
51.1 Wholesale on a fee or contract basis 3.554 0,45% ... ... 51.11 Sale of agricultural raw materials, live animals
through agents 41 0,01% VI C
51.12 Sale of fuels, ores, metals and industrial chemicals through agents 163 0,02% VI C
51.13 Sale of timber and building materials through
agents 285 0,04% I B 51.14 Sale of machinery, industrial equipment, ships and
aircraft through agents 131 0,02% VI C
51.15 Sale of furniture, household goods, hardware etc. through agents 23 0,00% VI C
51.16 Sale of textiles, clothing, footwear and leather
goods through agents 29 0,00% I B
51.17 Sale of food, beverages and tobacco through agents 2.449 0,31% ... B
51.17.1 Sale of marine products through agents 1.494 0,19% I B
51.17.2 Fish markets 554 0,07% I B 51.17.9 Sale of food etc., excl. marine products
through agents 401 0,05% VI C
51.18 Sale of particular products or ranges of products n.e.c. through agents 288 0,04% VI C
51.19 Sale of a variety of goods through agents 146 0,02% VI C
51.2 Wholesale of agr. raw mat. and live animals 108 0,01% I B
51.3 Wholesale of food, beverages and tobacco 3.640 0,47% I B
51.4 Wholesale of household goods 5.333 0,68% I B
51.5 Wholesale of non-agricultural intermediate products 9.198 1,18% VI C
51.6 Wholesale of mach., eq. and sup. 5.382 0,69% VI C
51.7 Other wholesale 2.674 0,34% VI C
52 Retail trade,rep. of pers. and household goods 40.441 5,18%
52.1 Retail sale in non-specialized stores 14.270 1,83% I B
52.11 Ret. sale in non-spec. stores with food predomin. 13.331 1,71% I B
52.12 Other retail sale in non-specialized stores 938 0,12% I B
52.2 Retail sale of food products in specialized stores 1.561 0,20% I B
52.23 Retail sale of fish, crustaceans and molluscs 223 0,03% I B
27
52.25 Retail sale of alcoholic and other beverages 679 0,09% I B
52.27 Other ret. sale of food products in spec. stores 659 0,08% I B
52.3 Re. sale of medical goods, cosmetic articles etc. 3.556 0,46% I B
52.31 Dispensing chemists 3.398 0,43% I B
52.32 Retail sale of medical and orthopaedic goods 1 0,00% I B
52.33 Retail sale of cosmetic and toilet articles 157 0,02% I B
52.4 Other retail sale of new goods in specialized stores 20.000 2,56% I B
52.41 Retail sale of textiles 177 0,02% I B
52.42 Retail sale of clothing 2.332 0,30% I B
52.43 Retail sale of footwear and leather goods 190 0,02% I B
52.44 Retail sale of furniture and household articles n.e.c. 2.437 0,31% I B 52.45 Re. sale of electrical household appliances, radio
etc. 1.045 0,13% I B
52.46 Retail sale of hardware, paints, wallpapers etc. 5.274 0,68% I B
52.47 Retail sale of books, newspaper and stationery 1.336 0,17% I B
52.48 Other retail sale in specialized stores 2.213 0,28% I B
52.49 Other retail sale in specialized stores 4.996 0,64% I B
52.5 Retail sale of second-hand goods in stores 6 0,00% VI C
52.6 Retail sale not in stores 454 0,06% VI C
52.7 Repair of personal and household goods 594 0,08% I B
C methods, share of the section 22,8%
3.2.9 Hotels and restaurants (NACE Rev.1; H) This section covers hotels and other short-stay accommodation services, restaurants and
canteens.
The production accounts of hotels and restaurants are mainly based on the Enterprise
Accounts Register. Like in wholesale and retail trade some activities in this industry are
distributive in nature like selling alcoholic drinks in bars. The output of such activities should
be defined as the retail margin made on such sales. However, this is not done here and
therefore the output and the intermediate consumption are strictly speaking not conceptually
correct. What is most important here is that such inaccuracy has no impact on value added.
The volume changes in this section are derived by deflating the output by the most relevant
price index which is a sub-item of CPI. Price discrimination is widespread here and therefore
by using such sub items of CPI it is assumed that prices for business people and private
consumers move in a similar way.
Table 3.8 Indicators used for estimating the growth rates in hotels and restaurants, section H
Gross factor
Classific.
Income 2004 Indicators used into
Mill. % of all for estimating A, B and C
ISK activities growth rates methods
55 Hotels and restaurants, section G 12.485 1,60% I B
55.1 Hotels 3.961 0,51% I B
55.2 Camping sites; other provision of short-stay accom. 480 0,06% I B
55.3 Restaurants 6.447 0,83% I B
55.4 Bars 1.110 0,14% I B
55.5 Canteens and catering 487 0,06% I B
C methods, share of the section 0,0%
In the near future, Statistics Iceland will investigate if a further improvement of these
estimates of volume changes can be reached by making use of already available volume indi-

28
cators like the number of overnight stays of tourists and total number of tourists arriving from
abroad.
A summary of the methods presently used for estimating volume changes in section H is
given in table 3.8. Aggregation of the results shows that methods used qualify as a B method
in all cases provided that the price indices used are considered as relevant.
3.2.10 Transport, storage and communication (NACE Rev.1; I) At current prices most of the production accounts within section I is based on the Enterprise
Accounts Register. Some of the industries in this section are characterized by small units
which were registered as unincorporated companies until recently, like taxi operation and
freight transport by road.
From 2001 unincorporated companies are now also included in the Enterprise Accounts
Register as well as private limited companies. These changes have considerably increased the
importance of the Enterprise Accounts Register as a source, especially in activities
characterized by small units.
The volume changes in this section are derived mostly by deflating the output by the most
relevant price index. The most relevant sub-items of CPI and building cost index are used for
activities like taxi operation, freight transport and partly for scheduled air transport. Other
specific price indices are used in export of transport services where the output is deflated by a
special price index reflecting changes in the exchange rate of the Icelandic currency and the
average price changes in the OECD countries. Such indicators are considered to be of a more
general character and do not qualify as B method, only as a C method.
Table 3.9 Indicators used for estimating the growth rates in transport, storage and
communication, section I
Gross factor
Classific.
Income 2004 Indicators used into
Mill. % of all for estimating A, B and C
ISK activities growth rates methods
Transport, storage and communication, section I 59.433 7,61% ... ...
60 Land transport; transport via pipelines 7.935 1,02% ... ...
60.2 Other land transport 7.935 1,02% ... ...
60.21 Other scheduled passenger land transport 1.481 0,19% I B
60.22 Taxi operation 891 0,11% I B
60.23 Other land passenger transport 1.401 0,18% VI C
60.24 Freight transport by road 4.162 0,53% VI C
61 Water transport 6.999 0,90% VI C
62 Air transport 13.274 1,70% VI C
62.1 Scheduled air transport 10.039 1,29% VI C
62.2 Non-scheduled air transport 3.234 0,41% VI C
63 Supporting transport activities; travel agencies 13.174 1,69% ... ...
63.1 Cargo handling and storage 725 0,09% VI C
63.2 Other supporting transport activities 8.262 1,06% VI C
63.3 Travel agencies; tourist assistance activities n.e.c. 2.453 0,31% I B
63.4 Other transport 1.733 0,22% VI C
64 Post and telecommunications 18.051 2,31% I B
64.1 Post and courier activities 3.149 0,40% I B
64.2 Telecommunications 14.902 1,91% I B
C methods, share of the section 61,5%

29
At present, Statistics Iceland is examining the possibility to use more intensively some
volume indicators already available in this section, like the number of tonne-kilometres for
freight transport and by air.
A summary of the methods presently used for estimating volume changes in section I is given
in table 3.8. Aggregation of the results shows that method B is used in only 40% of section I
but C method is still used in over 60% of the section. The gross factor income is used as a
measurement.
3.2.11 Financial intermediation (NACE Rev.1; J) Most of the companies in this industry are subject to government supervision and therefore
the company accounts are compiled and processed by the Financial Supervisory Authority.
This supervision covers financial intermediation, insurance and pension funds. The accounts
are of almost total coverage so hardly any grossing up is needed. However, other amendments
have to be made for national accounts purposes. That refers both to division 65, Financial
intermediation and division 66, Insurance and pension funding. Different methods are needed
for these two divisions. Therefore they are described separately.
Division 65 Financial intermediation, except insurance and pension funding
In the case of banks special methods are needed owing to the fact that most of the services
produced by banks are not paid directly. Instead these services are financed by banks via the
interest margin which is the difference between interests received by banks from the
borrowers and interest paid by the banks to the depositors. Earnings from the interest margin
are called “Financial intermediation services indirectly measured”, FISIM.
FISIM is one of the two groups of products generated by banks. The other one is financial
services outside FISIM which are services paid directly, like fees, commissions etc. These
two groups require widely different deflation methods.
The first one of the two groups of products, FISIM, should be calculated at constant prices by
estimating the change in the constant price value of stocks of loans and deposits. The price
concept applied is the interest margin on loans and deposits.
The second one, the financial services outside FISIM, should be calculated at constant prices
either by use of volume indicators like total number of transactions, which is a B method or
by deflating the charged services by using the most appropriate price index. The use of a price
index without a quality adjustment would be a B method. The Handbook on price and volume
measure recommends the use of quality adjusted output price indices for a representative set
of those services. Such index qualify as an A method.
The present methods applied in the Icelandic national accounts are quite different from the
above description following the handbook. The division 65, Financial intermediation, except
insurance and pension funding, at constant prices is calculated from the cost side by deflating
compensation of employees using the wage index for the public sector and bank employees
and deflating consumption of fixed capital by using the building cost index. This method is
definitely a C method but Statistics Iceland intends to revise these methods very shortly in
line with the recommendations in the handbook.
Division 66 Insurance and pension funding, except compulsory social security
With some simplifications it can be said that the output of insurance services (service charge)
is measured as the total premiums earned plus premium supplements less total claims due.
Holding gains and losses are to be ignored in the measurement of output of insurance
following the general principles of national accounting. From this definition it can be seen

30
that a direct measure of the output price of the service provided is impossible because of the
nature of the components of the output. For same reasons, deflating the service output on
basis of output price statistics is impossible. An A method is therefore considered not
possible. Volume indicators have to be used, like acquisition and administration of policies
and the administration of claims. Such methods require indicators at a very detailed level that
take into account changes in the product mix.
Similarly to financial intermediation the present methods applied in the Icelandic national
accounts are quite different from the recommendations in the handbook. The Insurance and
pension funding at constant prices is calculated from the cost side by deflating compensation
of employees using the wage index for the public sector and bank employees and deflating
consumption of fixed capital by using the building cost index. This method is definitely a C
method but Statistics Iceland intends to revise these methods very shortly in line with the
recommendations in the handbook.
Division 67 Activities auxiliary to financial intermediation
This division is of minor importance. The methods applied for constant price estimates are the
same as in insurance and pension funding. Calculations are made from the cost side by
deflating the compensation of employees and the consumption of fixed capital by using the
most appropriate price indices.
Table 3.10 Indicators used for estimating the growth rates in transport, financial intermediation,
section J
Gross factor
Classific.
Income 2004 Indicators used into
Mill. % of all for estimating A, B and C
ISK activities growth rates methods
Financial intermediation, section J 63.622 8,14% VIII C
65 Financial intermediation 54.502 6,98% VIII C
65.1 Monetary intermediation 54.502 6,98% VIII C
65.2 Other financial intermediation 0 0,00% ... ...
66 Insurance and pension funding 7.232 0,93% VIII C
67 Activities auxiliary to financial intermediation 1.888 0,24% VIII C
C methods, share of the section 100,0%
3.2.12 Real estate, renting and business activities (NACE Rev.1; K)
This section covers a wide range of heterogeneous services that are mainly provided to
industries. A large part of the services within the section is a “knowledge” service, like the
service of accountants, lawyers etc. Such services are frequently tailor-made or subject to a
contract. Therefore it is not straightforward to compile ordinary price indices whereas quality
adjustments are nearly always necessary.
Within section K there are five divisions, i.e. division, 70, 71, 72, 73 and 74. Each one of
these sections will be discussed individually. Table 3.11 shows how each one of the activities
in this section is classified in A, B and C categories. The conclusion is that no one of the
methods used for these activities qualify as an A method but the share of the B method,
measured as gross factor income, just exceeds 50% for the activities in section K. Compared
with other sections, the share of the C method is exceptionally high in this section and in
many cases it might be difficult to abolish that method owing to conceptual difficulties and in
other cases owing to lack of usable data.

31
Division 70 Real estate activity
Division 70.2 Letting of own property includes letting of dwellings of owner-occupiers. That
activity accounts for around a half of the section K. At current prices, the output of dwelling
services is based on a special survey on rented dwellings undertaken by Statistics Iceland in
1999. The residential housing market in Iceland is characterized by a very high percentage of
owner occupied dwellings. In 1995 that percentage was 81% and according to the most recent
household budget survey covering the period 2003-2005 the percentage was a little higher or
83%. The survey was stratified in 5 strata and the actual rent from the survey of 1999 was
linked to the most similar properties of owner occupied dwellings. This allowed the
imputation of a nominal rent for the services owner-occupiers receive from their property.
Before that some modifications were needed on the observed rent from the rent survey like
taking into account rent compensation to low income families and zero rent families.
From the benchmark year of 1999 the volume changes are based on extrapolation of the
housing stock. That extrapolation is based on the annual changes of market value of the
housing stock deflated by the changes in market prices. For comparison data on quantity
changes of the stock in square metres is also collected. The applied method for letting of
dwellings is considered to be B method.
For letting of non-residential buildings the output at current prices is deflated by the building
cost index as an indicator of a more general character. That is a C method and this activity
accounts for around 1/5 of the division 70.2.
Division 71 Renting of machinery and equipments without operator
At current prices the production accounts in division 71 are based on the Enterprise Accounts
Register. The output of group 71.1, renting of automobiles is deflated by using the sub-group
of CPI referring to those specific services. This qualifies as an A method for output and a B
method for value added. Other groups in division 71 are deflated by more general price
indices, most frequently the CPI, witch downgrade the methods to C methods.
Division 72 Computer and related activities
The single biggest activity within this division is 72.2, software consultancy and supply,
which amounts to around 70% of the total value added in the division. The output is deflated
by the overall CPI less housing cost. The use of such a general price index qualifies as a C
method. The output of this division can be divided into two types, i.e.
packaged software
software consultancy
The relative share of each one is not available but provided that software consultancy is the
major part it is worth considering if the use of a relevant sub item of the labour cost index
would be more appropriate. That will be investigated further but whatever the result will be
the method will remain a C method.
Division 73 Research and development
One company, DeCode genetics which is listed on NASDAQ,, accounts for around 2/3 of the
activity in this division. That company is privately owned research company in bio-
technology. It was established ten years ago. During that period the operation has been
financed partly by research sponsorship and partly by own equity. The expected income will
only be realised when or if the research activity turns out to be successful. Until this happens
the operation of this activity continues to be substantially negative except it is allowed to
record as income the expensed researches. Eurostat was consulted on that issue and based on
that result it was decided to record as income only the sponsorship and realised income each

32
year. That has resulted in a huge negative operating surplus for that company and the division
as a whole. In view of this it might be very troublesome to define the volume changes of the
output in this section. Volume indicators of important cost components, like number of
persons employed etc. are misleading because the use of these components reflects both
recognized and unrecognized output at each time. The method chosen was to deflate the
output and compensation of employees by the labour cost index and take the average of these
two. This is definitely a C method and could hardly be otherwise except if the output could be
better defined.
Division 74 Other business activities
Like the name of this division indicates most of these services are in fact provided to
companies, like the services of consulting engineers, business consultants, advertising
agencies etc. In some cases the customers can be both companies and households. Rather
poor price statistics is available for this division. Because of that more general price indices
are used like CPI. These are C methods. Statistics Iceland intends to eliminate such methods
and will evaluate the possibilities of collecting data on hourly fees or some charge-out rates.
Such improvement would already upgrade the methods to B methods in some cases. These
would not qualify as A methods since they would miss out some of the expected productivity
changes.
Table 3.11 Indicators used for estimating the growth rates in real estate, renting and business
services, section K
Gross factor
Classific.
Income 2004 Indicators used into
Mill. % of all for estimating A, B and C
ISK activities growth rates methods
Real estate, renting and business services, section K 123.163 15,77%
70 Real estate activities 66.337 8,49% 70.1 Real estate activities with own property 283 0,04% VIII C
70.2 Letting of own property 63.490 8,13% IV B
70.3 Real estate activities on a fee or contract basis 2.563 0,33%
Average
VI and VIII C
71 Renting of machinery and equipment 2.411 0,31% ... ...
71.1 Renting of automobiles 640 0,08% I B
71.2 Renting of other transport equipment 69 0,01% VI C
71.3 Renting of other machinery and equipment 1.509 0,19% VI C
71.4 Renting of personal and household goods n.e.c. 192 0,02% VI C
72 Computer and related activities 11.930 1,53% VI C
73 Research and development 4.118 0,53% VIII C
74 Other business activities 38.367 4,91%
74.1 Legal, accounting and auditing activities; consultancy 17.587 2,25%
74.11 Legal activities 4.152 0,53% VI C
74.12 Acc., auditing activities; tax consultancy 5.035 0,64% VI C
74.13 Market research and public opinion polling 660 0,08% VI C
74.14 Business and management consultancy activities 2.575 0,33% VI C
74.15 Management activities of holding companies 5.164 0,66% Average
VI and VIII C
74.2 Architectural and engineering activities. 10.705 1,37%
Average
VI and VIII C
74.3 Technical testing and analysis 821 0,11% VI C
74.4 Advertising 1.882 0,24%
Average
VI and VIII C
74.5 Labour recruitment and prov. of personnel 155 0,02%
Average
VI and VIII C
74.6 Investigation and security activities 1.554 0,20% I B
74.7 Industrial cleaning 2.592 0,33% I B
74.8 Miscellaneous business activities n.e.c. 3.072 0,39% VI C
74.81 Photographic activities 384 0,05% VI C
74.82 Packaging activities -2 0,00% VI C

33
74.83 Secretarial and translation activities 510 0,07% VI C
74.84 Other business activities n.e.c. 2.179 0,28% VI C
C methods, share of the section 44,6%
3.2.13 Public administration and defence; compulsory social security (NACE Rev.1; L); Education (NACE Rev.1 M); Health and social work (NACE Rev.1 N)
Below the sections L, M and N will be discussed individually although the present methods of
calculating the volume changes are the same.
Section L Public administration and defence; compulsory social security
Section L consists entirely of non-market services. The production accounts are deflated from
the input side. The calculation has been based on separate deflation of two components:
Compensation of employees which is deflated by the wage index for the public sector
Consumption of fixed capital which is deflated by the building cost index
The sum of these two components at constant prices is used as an indicator of volume
changes in value added, as well as intermediate consumption and output, provided that the
constant input/output ratio prevails. The wage index is not adjusted for changes in the level of
skill over time. For that reason it can be concluded that the labour cost index includes some
quality increases in the labour force and therefore it exaggerates the price increases.
Consequently the volume change might be underestimated by the same degree. However,
adjustments are made for changes in the composition of the labour force concerning
occupation and education.
The building cost index used for deflating the consumption of fixed capital is not quality
adjusted and therefore it might include some quality changes as well and underestimate the
volume changes. The size of this degree of inaccuracy is unknown.
In view of all this and deflating the input side by such price indices of a general character the
method only qualifies as a C method.
The C method should be avoided following the manual but for collective services, input
methods can be B methods provided that the volume of each input is estimated separately and
quality changes of inputs are taken into account.
Section M Education
Section M consists of both market and non-market services. The share of market services is
less than 20% of the output in this section but increasing. At current prices the production
accounts for non-market services are based on general government and local government
accounts of a total coverage but the non-market services are based on a small sample of
enterprises from the Enterprise Accounts Register which is grossed up on the basis of the Pay-
As-You-Earn Register. Both market and non-market services in this section are deflated from
the input side following the same method as described for section L above.
Education services are primarily provided on an individual basis and in principle this enables
the collection of volume indicators for output as recommended by the manual. Statistics
Iceland intends to develop methods in this direction but for the time being the methods used
are definitely C methods.
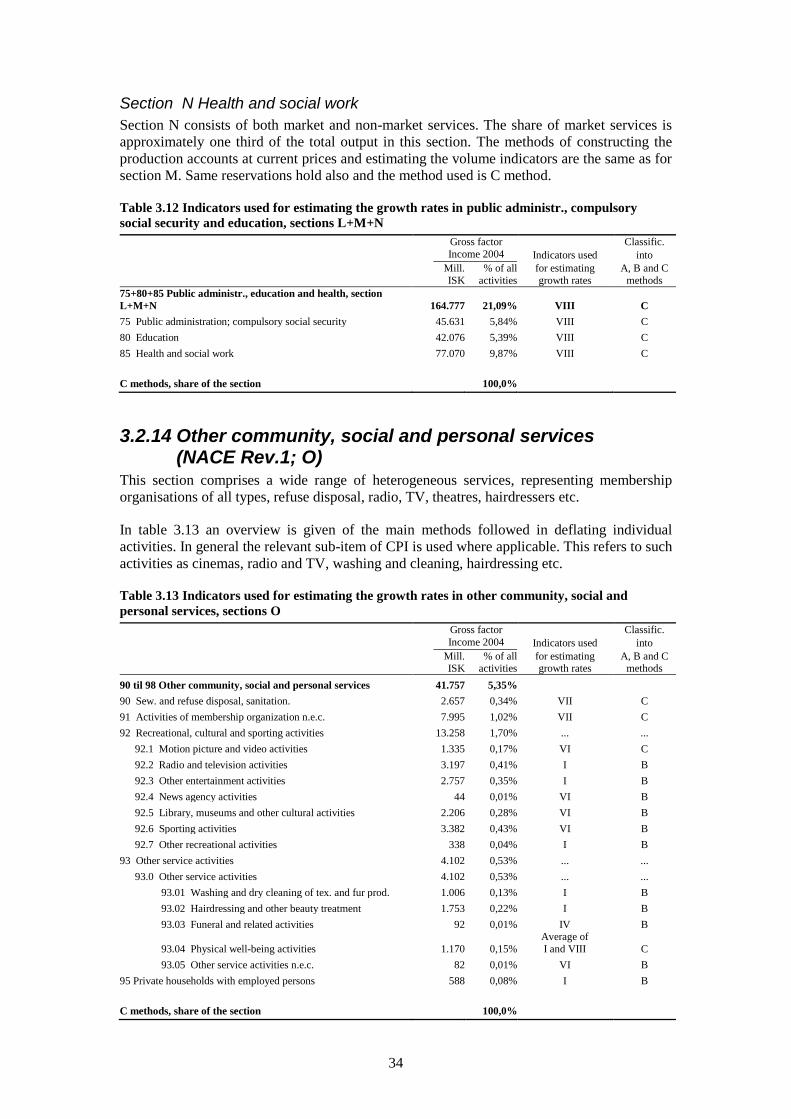
34
Section N Health and social work
Section N consists of both market and non-market services. The share of market services is
approximately one third of the total output in this section. The methods of constructing the
production accounts at current prices and estimating the volume indicators are the same as for
section M. Same reservations hold also and the method used is C method.
Table 3.12 Indicators used for estimating the growth rates in public administr., compulsory
social security and education, sections L+M+N
Gross factor
Classific.
Income 2004 Indicators used into
Mill. % of all for estimating A, B and C
ISK activities growth rates methods
75+80+85 Public administr., education and health, section
L+M+N 164.777 21,09% VIII C
75 Public administration; compulsory social security 45.631 5,84% VIII C
80 Education 42.076 5,39% VIII C
85 Health and social work 77.070 9,87% VIII C
C methods, share of the section 100,0%
3.2.14 Other community, social and personal services (NACE Rev.1; O)
This section comprises a wide range of heterogeneous services, representing membership
organisations of all types, refuse disposal, radio, TV, theatres, hairdressers etc.
In table 3.13 an overview is given of the main methods followed in deflating individual
activities. In general the relevant sub-item of CPI is used where applicable. This refers to such
activities as cinemas, radio and TV, washing and cleaning, hairdressing etc.
Table 3.13 Indicators used for estimating the growth rates in other community, social and
personal services, sections O
Gross factor
Classific.
Income 2004 Indicators used into
Mill. % of all for estimating A, B and C
ISK activities growth rates methods
90 til 98 Other community, social and personal services 41.757 5,35%
90 Sew. and refuse disposal, sanitation. 2.657 0,34% VII C
91 Activities of membership organization n.e.c. 7.995 1,02% VII C
92 Recreational, cultural and sporting activities 13.258 1,70% ... ...
92.1 Motion picture and video activities 1.335 0,17% VI C
92.2 Radio and television activities 3.197 0,41% I B
92.3 Other entertainment activities 2.757 0,35% I B
92.4 News agency activities 44 0,01% VI B
92.5 Library, museums and other cultural activities 2.206 0,28% VI B
92.6 Sporting activities 3.382 0,43% VI B
92.7 Other recreational activities 338 0,04% I B
93 Other service activities 4.102 0,53% ... ...
93.0 Other service activities 4.102 0,53% ... ...
93.01 Washing and dry cleaning of tex. and fur prod. 1.006 0,13% I B
93.02 Hairdressing and other beauty treatment 1.753 0,22% I B
93.03 Funeral and related activities 92 0,01% IV B
93.04 Physical well-being activities 1.170 0,15%
Average of
I and VIII C
93.05 Other service activities n.e.c. 82 0,01% VI B
95 Private households with employed persons 588 0,08% I B
C methods, share of the section 100,0%
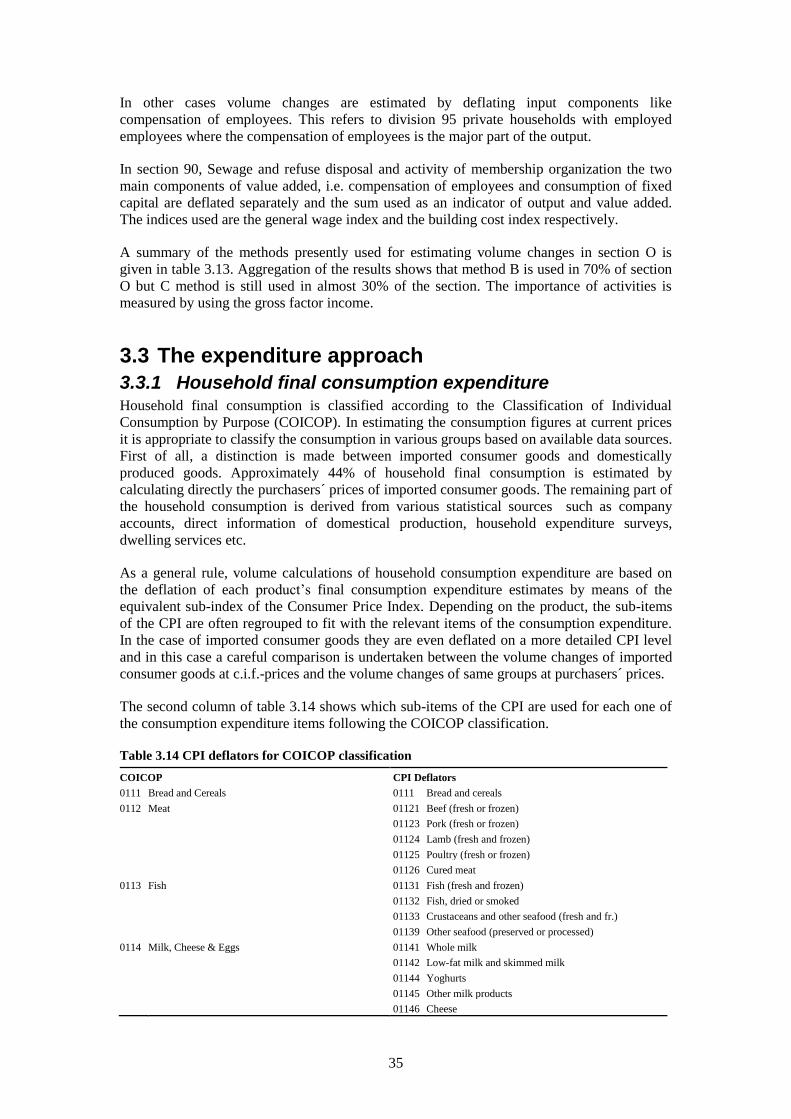
35
In other cases volume changes are estimated by deflating input components like
compensation of employees. This refers to division 95 private households with employed
employees where the compensation of employees is the major part of the output.
In section 90, Sewage and refuse disposal and activity of membership organization the two
main components of value added, i.e. compensation of employees and consumption of fixed
capital are deflated separately and the sum used as an indicator of output and value added.
The indices used are the general wage index and the building cost index respectively.
A summary of the methods presently used for estimating volume changes in section O is
given in table 3.13. Aggregation of the results shows that method B is used in 70% of section
O but C method is still used in almost 30% of the section. The importance of activities is
measured by using the gross factor income.
3.3 The expenditure approach
3.3.1 Household final consumption expenditure Household final consumption is classified according to the Classification of Individual
Consumption by Purpose (COICOP). In estimating the consumption figures at current prices
it is appropriate to classify the consumption in various groups based on available data sources.
First of all, a distinction is made between imported consumer goods and domestically
produced goods. Approximately 44% of household final consumption is estimated by
calculating directly the purchasers´ prices of imported consumer goods. The remaining part of
the household consumption is derived from various statistical sources such as company
accounts, direct information of domestical production, household expenditure surveys,
dwelling services etc.
As a general rule, volume calculations of household consumption expenditure are based on
the deflation of each product’s final consumption expenditure estimates by means of the
equivalent sub-index of the Consumer Price Index. Depending on the product, the sub-items
of the CPI are often regrouped to fit with the relevant items of the consumption expenditure.
In the case of imported consumer goods they are even deflated on a more detailed CPI level
and in this case a careful comparison is undertaken between the volume changes of imported
consumer goods at c.i.f.-prices and the volume changes of same groups at purchasers´ prices.
The second column of table 3.14 shows which sub-items of the CPI are used for each one of
the consumption expenditure items following the COICOP classification.
Table 3.14 CPI deflators for COICOP classification
COICOP CPI Deflators
0111 Bread and Cereals 0111 Bread and cereals
0112 Meat 01121 Beef (fresh or frozen)
01123 Pork (fresh or frozen)
01124 Lamb (fresh and frozen)
01125 Poultry (fresh or frozen)
01126 Cured meat
0113 Fish 01131 Fish (fresh and frozen)
01132 Fish, dried or smoked
01133 Crustaceans and other seafood (fresh and fr.)
01139 Other seafood (preserved or processed)
0114 Milk, Cheese & Eggs 01141 Whole milk
01142 Low-fat milk and skimmed milk
01144 Yoghurts
01145 Other milk products
01146 Cheese

36
01147 Eggs
0115 Oils and Fats 01151 Butter
01152 Margarine and other vegetable fat
0116 Fruit 01161 Citrus fruit and other fresh fruit
01169 Frozen and preserved fruit
0117 Vegetables 0117 Vegetables including potatoes and other tubers
0118 Sugar, Jam, Honey, Chocolate & Confectionery 01184 Confectioneries
0121 Coffee, Tea & Cocoa 0121 Coffee, tea and cocoa
0122 Mineral Waters, Soft Drinks & Fruit Juices 0122 Mineral waters, soft drinks and juices
for Soft Drinks
021 Alcoholic beverages 0211 Spirits
0212 Wine
0213 Beer
022 Tobacco 022 Tobacco
031 Clothing & Repairs 031 Clothing
0314 Repair and hire of clothing
0321 Footwear 032 Footwear
0322 Shoe repairs 0321 Shoes and other footwear
043 Maintenance & repair of dwellings 043 Regular maintenance and repair of the dwelling
044 Water supply and misc. services relat. to dwellings 0441 Refuse collection
0442 Sewerage services
0443 Water supply
051 Furniture, furnishings,carpets & other floor coverings 051 Furniture, furnishings and decorations, carpets and other floor coverings and repairs
052 Household textiles 052 Household textiles
053 Household appliances 0531 Major household appliances whether electric or not
0533 Repair of household appliances 0915
Repair of audio-visual, photographic and data
processing equipment and accessories
054 Glassware, tableware & H/H utensils 054 Glassware, tableware and household utensils
055 Tools and equipment for house and garden 055 Tools and equipment for house and garden
0561 Non durable household goods 0561 Non-durable household goods
0562 Domestic services and household services 0562 Domestic services and home-care services
061 Medical products, appliances & equipment 061 Medical products, appliances and equipment
062 Doctor & dental outpatient services 0621 Medical services
0622 Dental services
0623 Paramedical services
063 Hospital services & nursing homes 0621 Medical services
0711 Motor cars 0711 Motorcars
0712 Motor cycles 0712 Motorcycles
0713 Bicycles, caravans 0713 Bicycles
0721 Car accessories 0721 Spare parts and accessories
0722 Petrol & oil 0722 Fuels and lubricants
0723 Motoring expenses 0723 Maintenance and repairs
0724 Other services in respect of personal transport equipment 0724
Other services in respect of personal transport equipment
073 Transport services 07 Transport
0732 Passenger transport by road
0733 Passenger transport by air
0734 Passenger transport by sea and inland waterway
08 Communication 0811 Postal services
0813 Telephone, telegraph and telefax services
081311 Household telephone services
091 Audio-visual, photographic and information processing equipment 0911
Equipment for the reception, recording and reproduction of sound and pictures
09111 Television sets, videos, radios, etc.
09112 Stereo systems
0912
Photographic and cinematographic equipment, optical
instruments
0913 Data processing equipment
0914 Recording media for pictures and sound
0915 Repair of audio-visual, photographic and data

37
processing equipment and accessories
092 Major recreational durables 092 Other major durables for recreation and culture
093 Other recreational items and equipment; flowers, gardens and pets
0931
Games and toys; equipment for sport, camping and
open-air recreation
0932 Flowers and gardening
0933 Pets etc.
094 Recreational and cultural services 094 Recreational and cultural services
0942 Cultural services
09421 Cinemas and rent of video tapes
09422 Theatre, concerts and opera
09423 Licence fees for television and radio broadcasting
09429 Other cultural services
0943 Games of chance
09431 Lotteries
095 Newspapers, books and stationery 095 Newspapers, books and stationery
0951 Books
0952 Newspapers and periodicals
0954 Stationery and drawing materials
111 Catering services 1111 Restaurants and cafés
1112 Canteens
121 Personal care 12112 Beauty salons
123 Personal effects n.e.c. 122 Personal effects n.e.c.
1221 Jewellery, clocks and watches
1222 Other personal effects
124 Social protection 123 Social protection
125 Insurance 124 Insurance
1244 Insurance connected with transport
1261 FISIM
Consumer price index
1262 Other financial services n.e.c. 125 Financial services n.e.c.
1270 Other services n.e.c. 126 Other services n.e.c.
For few items there are no price indices available and alternative solutions have to be utilized.
Deflators for consumption by Icelanders abroad and by foreign visitors in Iceland, are
examples of these items. The data on subsistence costs abroad are deflated using a specially
constructed price index based on the CPI index for OECD total and the changes in the
exchange rates of the Icelandic kronur (ÍSK). Data on expenditure in Iceland by foreign
visitors are deflated using the CPI in Iceland and taking into account the structure of the
expenditure of foreign visitors based on studies performed by Statistics Iceland and the
Icelandic Tourist Board.
In some cases volume indicators are used instead of deflating values. Most important
examples of these are items like actual and imputed rental for houses, electricity, heating,
educations and accommodation services.
A vast majority of the deflated items of the household final consumption qualify as an A
method due to the fact that the CPI price indices are quality adjusted.
The combined (implicit) price index for household consumption expenditure tends to be fairly
close to the total CPI. However some discrepancy may arise and often there might be good
reasons for such differences. The main reason is the different weights used in the national
accounts from those used for the CPI. Another reason is that housing is treated differently in
the national accounts from the practices in the CPI.
Purchases of vehicles are yet another example of different treatment in national accounts and
CPI. The coverage of consumption by households also differs somewhat. Consumption by

38
Icelandic households abroad, for example, is included in the national accounts, but
consumption by foreign visitors in Iceland is not. Neither of these items is included in CPI.
3.3.2 Government final consumption expenditure Government final consumption expenditure consists of the output value of those parts of
activities L, M and N which belongs to general government minus revenue from sales. The
calculations of volume changes are derived from the cost side where the figures are split into
compensation of employees and consumption of fixed capital. The methods are similar to
those described in section 3.2.13 above where a description is given of volume estimates of
activities L, M and N. These methods qualify only as a C method.
3.3.3 Gross fixed capital formation In estimating the Gross fixed capital formation at current prices four main sources are
exploited:
The Enterprise Accounts Register
The Land Registry of Iceland
The c.i.f. value of imported capital goods
The financial accounts of central and local government
Of these sources the far most important one is the Enterprise Account Register (EAR). That
register covers all incorporated and unincorporated enterprises and contains a breakdown by
activity down to 5 digit ISAT classification which corresponds to NACE rev.1. That register
allows a rather detailed breakdown of fixed assets by type of assets. The assets are classified
by type in 10 groups depending on the rate of depreciation allowed in the tax laws. These
groups are the following:
1. Motor vehicles for industrial use
2. Ships, aircraft and pertaining equipment
3. Manufacturing machinery and equipment
4. Office machinery and computers
5. Machinery and equipment other, such as vans, coaches, taxis, bulldozers etc.
6. Constructions
7. Non-renewable subsoil assets such as non-metallic mineral reserves, sand pits etc.
8. Intangible non-produced assets, such as purchased goodwill, patented entities etc.
9. Assets, not depreciated, according to tax laws, such as land, fishing quotas, valuables
etc.
10. Other assets, not depreciated, such as production rights in agriculture, start-up costs
etc.
Each of these depreciation groups are further disaggregated by type of assets into various
assets. The quality of this data source is considered very high but these are values at current
prices only.
For estimating volume changes a use is made of various price indices. Below are the most
important ones and an attempt is also made to classify the methods used as an A, B or C
methods:
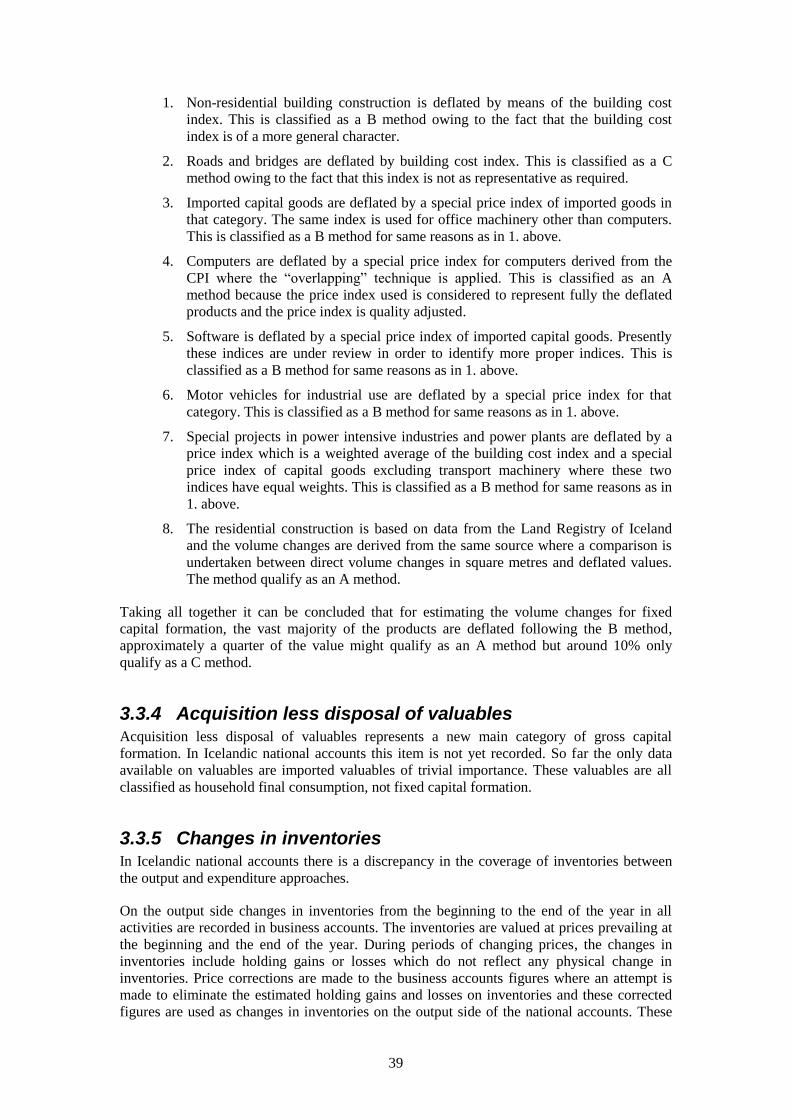
39
1. Non-residential building construction is deflated by means of the building cost
index. This is classified as a B method owing to the fact that the building cost
index is of a more general character.
2. Roads and bridges are deflated by building cost index. This is classified as a C
method owing to the fact that this index is not as representative as required.
3. Imported capital goods are deflated by a special price index of imported goods in
that category. The same index is used for office machinery other than computers.
This is classified as a B method for same reasons as in 1. above.
4. Computers are deflated by a special price index for computers derived from the
CPI where the “overlapping” technique is applied. This is classified as an A
method because the price index used is considered to represent fully the deflated
products and the price index is quality adjusted.
5. Software is deflated by a special price index of imported capital goods. Presently
these indices are under review in order to identify more proper indices. This is
classified as a B method for same reasons as in 1. above.
6. Motor vehicles for industrial use are deflated by a special price index for that
category. This is classified as a B method for same reasons as in 1. above.
7. Special projects in power intensive industries and power plants are deflated by a
price index which is a weighted average of the building cost index and a special
price index of capital goods excluding transport machinery where these two
indices have equal weights. This is classified as a B method for same reasons as in
1. above.
8. The residential construction is based on data from the Land Registry of Iceland
and the volume changes are derived from the same source where a comparison is
undertaken between direct volume changes in square metres and deflated values.
The method qualify as an A method.
Taking all together it can be concluded that for estimating the volume changes for fixed
capital formation, the vast majority of the products are deflated following the B method,
approximately a quarter of the value might qualify as an A method but around 10% only
qualify as a C method.
3.3.4 Acquisition less disposal of valuables Acquisition less disposal of valuables represents a new main category of gross capital
formation. In Icelandic national accounts this item is not yet recorded. So far the only data
available on valuables are imported valuables of trivial importance. These valuables are all
classified as household final consumption, not fixed capital formation.
3.3.5 Changes in inventories In Icelandic national accounts there is a discrepancy in the coverage of inventories between
the output and expenditure approaches.
On the output side changes in inventories from the beginning to the end of the year in all
activities are recorded in business accounts. The inventories are valued at prices prevailing at
the beginning and the end of the year. During periods of changing prices, the changes in
inventories include holding gains or losses which do not reflect any physical change in
inventories. Price corrections are made to the business accounts figures where an attempt is
made to eliminate the estimated holding gains and losses on inventories and these corrected
figures are used as changes in inventories on the output side of the national accounts. These

40
price corrected figures are available for all activities and they are incorporated in the output
side of national accounts.
On the expenditure side changes in inventories are only calculated for following industries:
Marine products
Aluminium products
Ferrosilicon products
Oil products
The changes in inventories of these industries are valued at the average current prices of the
year and then deflated to the prices of previous year by means of the unit value indices of
export prices in each of these main groups.
The changes in inventories actually published in Icelandic national accounts are those from
the expenditure side. The methods used, qualify as the B method taking into account that the
price indices used are unit value indices. However, consideration is now given of using the
PPI which is more appropriate for this purpose.
3.3.6 Exports and imports of goods and services
Exports and imports of goods
Exports and imports of goods in the Icelandic national accounts are deflated by products by
means of unit value indices. These indices are calculated by using Fischer formula for
accumulated monthly and annual figures. Unit value indices and implicit volume indices are
based on data from the external trade database of Statistics Iceland. Imports are classified by
main economic categories and exports by mode of processing. Classification used to define
commodity groups for which index numbers are calculated is the 8 digit Icelandic Custom
Tariff which follows the Harmonized System (HS) to the level of 6-digits.
Preliminary quarterly indices are calculated by using Laspeyres formula but final quarterly
figures are based on Fisher formula. Volume index numbers are the quotient of the value and
unit value index numbers. Price index numbers are calculated using Laspeyres formula.
The use of value indices as an approximation for price indices has several drawbacks.
The main problems that arise are connected to composition changes and the attempt to
eliminate quality changes from price changes. This can be explained as follows:
Although the Custom Tariff classification in its most disaggregated form is rather
detailed the possibility cannot be ruled out that one number contains more than one
commodity or commodities that are of different quality, and therefore at different
prices. By using stratification by countries, within each tariff number an attempt is
made to minimize these problems.
Frequently changes are made to the definition of the tariff numbers, i.e. new numbers
are added (one number is split into many) or numbers are deleted and they included
with others. By paring old and new numbers together problems of this type can be
eliminated to some extent.
Another problem is how to exclude from the calculations extreme price changes, which are
considered to be more of the character of composition changes. This is done by using upper
and lower limits for price changes. In general these boundaries are set as 50% increase and

41
33% decrease in the unit prices in foreign currency plus the inflation rate in Icelandic main
trading countries plus change in exchange rate. It is possible to change on an individual basis
the boundaries for individual commodities if direct information indicates that price changes
are exceeding these limits. There are several examples of price fluctuations exceeding such
limits during the last few decades.
The methods used for estimating volume changes of exports and imports of goods and
services do not qualify as an A method as the unit value index is not a proper price index. The
methods must be considered as B methods. The PPI for relevant export products is probably
more proper index to use and Statistics Iceland is now considering to adopt it in these
calculations.
Exports and imports of services
Both exports and imports of services are deflated on a far more aggregated basis than exports
and imports of services. A use is made of the following breakdown of both exports and
imports:
Transportation
Travel
Other
These values are deflated by using two price indices only. Exports of travel, i.e. expenditure
of foreign tourists in Iceland are deflated by the overall CPI. All other items are deflated by a
special price index composed of changes in the overall CPI in OECD countries, excluding
high inflation countries, and the price index of foreign currency expressed in Icelandic
currency.
These methods hardly qualify as B methods and must be considered as C methods due to the
fact that the price indices are of a general character and are hardly as related to the deflated
items as required.
42
Chapter 4. Methods for other parts of the system
4.1 Value added According to the Handbook on price and volume measures in national accounts the A method
for value added is use of double deflation where the output and intermediate consumption is
separately estimated at constant prices and the difference of these two items is taken. In
section 3.2 above a description is given of the methods used in estimating volume changes in
individual activities. From that description it becomes apparent that the double deflation
method is never used in Icelandic national accounts. Instead various indicators are used to
estimate volume changes in activities. These volume changes indicate both changes in output
and value added.
4.2 Taxes and subsidies on products Volume changes of taxes less subsidies on products are not directly published in Icelandic
national accounts. However, an attempt is made to follow the main principles of the handbook
by using the tax rates of previous year when values are re-valued at the prices of previous
year. Taxes and subsidies are not directly deflated but values including the taxes and subsidies
are deflated. In every case it is carefully checked that the price indices used for deflating
reflect changes in taxes and subsidies.
4.3 Real national income Real national income is calculated by adding the so-called real impact of terms of trade on
GDP at constant prices, and taking into account primary income and current transfers to and
from abroad together with consumption of fixed capital.
Real value of changes in terms of trade is supposed to reflect changes in purchasing power of
external trade of goods and services from the reference year or more precisely the previous
year in case of annual chain linking. The formula can be written as follows:
T= X/Pm – X/Px
where T is changes in terms of trade
X is exports of goods and services
Pm is import prices
Px is export prices
Primary income to and from abroad and current transfers to and from abroad are deflated by
using the price index of gross domestic final expenditure.
Consumption of fixed capital at constant prices is to be found in the capital stock model. The
capital stocks are derived from the accumulated gross fixed capital formation by using the
perpetual inventory method. These stocks exist both at current and constant prices.
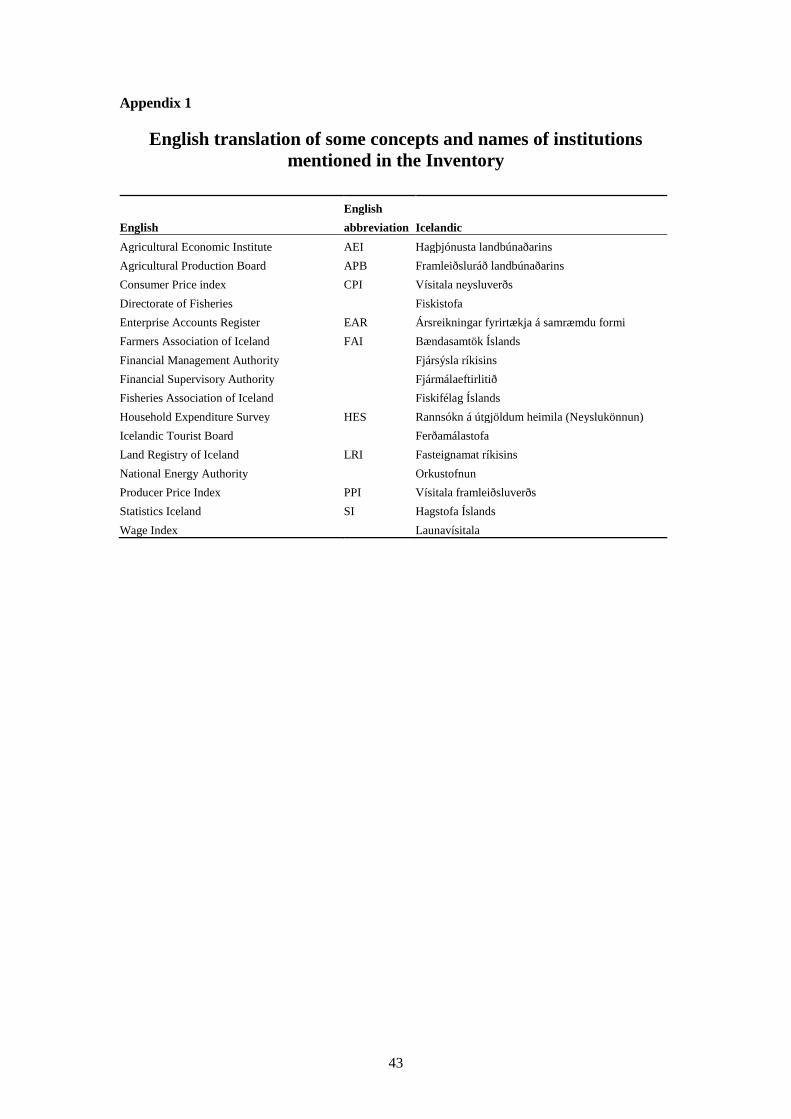
43
Appendix 1
English translation of some concepts and names of institutions
mentioned in the Inventory
English
English abbreviation Icelandic
Agricultural Economic Institute AEI Hagþjónusta landbúnaðarins
Agricultural Production Board APB Framleiðsluráð landbúnaðarins
Consumer Price index CPI Vísitala neysluverðs
Directorate of Fisheries Fiskistofa
Enterprise Accounts Register EAR Ársreikningar fyrirtækja á samræmdu formi
Farmers Association of Iceland FAI Bændasamtök Íslands
Financial Management Authority Fjársýsla ríkisins
Financial Supervisory Authority Fjármálaeftirlitið
Fisheries Association of Iceland Fiskifélag Íslands
Household Expenditure Survey HES Rannsókn á útgjöldum heimila (Neyslukönnun)
Icelandic Tourist Board Ferðamálastofa
Land Registry of Iceland LRI Fasteignamat ríkisins
National Energy Authority Orkustofnun
Producer Price Index PPI Vísitala framleiðsluverðs
Statistics Iceland SI Hagstofa Íslands
Wage Index Launavísitala