introduction to gridsim - nyiso
TRANSCRIPT

Copyright © 2020 The Brattle Group, Inc.
Introduction to GridSIMMODELING TO INFORM THE GRID IN TRANSITION
PRESENTED TONYISO ICAP/MIWG/PRLWG STAKEHOLDERS
PRESENTED BYRoger LuekenSamuel A. NewellJurgen WeissJill Moraski
March 6, 2020

brattle.com | 2
Disclaimer
This repo rt w as prepared by The B rattle Group for NYIS O’s exclusive use; i t does not representinvestment advi ce, and t here are no third pa rty benef iciaries. The Br attle Group does not acceptany l iabi l i ty for any los ses s uffered, whether direct or con sequential , in respect of the contents ofthis report or any a ctions t aken o r decisions made as a con sequence thereof. If you are not N YISO,or a re cipient au thorized by N YISO and The Br attle Gr oup to a ccess this repor t, your review sh al l beon a non-re l iance basis only.
The analyses and m arket ove rview presented herein are necess ari ly b ased on assu mptions withrespect to conditions which may exist o r events which m ay occur in the future. Please app reciatethat actual futu re resul ts may di ffer, perhaps m aterial ly, from those indicated. It i s also import antto a cknowledge tha t the meth odologies used t o devise The B rattle Group’s an alyses and marketoverview simpl i fy and may not accur ate ly ref lect the relations hip between assu mptions andoutcomes. The Brattle Group does not m ake, no r intends t o make, n or should N YISO or any o therparty in receipt of this report infer, any representation with respe ct t o the l ike l ihood of any futureoutcome. The analyses and m arket overview are v al id only for the expl ici t purp ose for which theywere prepared and as of the d ate of this repor t. Any decisions m ade in conne ction with this repo rtor the subje ct m atter hereof, o r use of any inform ation contained in this rep ort, are the soleresponsibi l i ty of the reader.

brattle.com | 3See Disclaimer on Slide 2.
Introduction Agenda
– Introduction
– Introduction to GridSIM and Capacity Expansion Modeling
– Illustrative Analysis
– Overview of Modeling Assumptions
– Feedback and Next Steps

brattle.com | 4See Disclaimer on Slide 2.
IntroductionProject purpose and scope
– New York has established aggressive clean energy and decarbonization goals, codified in the Climate Leadership and Community Protection Act (CLCPA).
– NYISO’s Grid in Transition effort seeks to understand the reliability and market implications of the State’s plans to transition to clean energy sources.
– NYISO has retained Brattle to simulate NYISO market operations and investment through 2040 to inform NYISO staff and stakeholders on market evolution.
Key Questions to Address– How many and what types of renewable resources and storage will be needed to
achieve the 70% renewable standard?
– What is the future of current New York generation (e.g. nuclear and gas)?– How might electrification affect market operations and investments?
– What is the role of a flexible and market-engaged demand side?
NYISO has retained Brattle to develop simulations of NYISO markets through 2040 to inform the Grid in Transition effort.
We are requesting stakeholder feedback on Key Questions

brattle.com | 5See Disclaimer on Slide 2.
IntroductionHigh-level approach
1. Model SetupEnd of March
Develop model inputs and vet assumptions with stakeholders
2. BenchmarkingApril
Calibrate and validate model by comparing to recent history (2018)
3. Base CaseApril & May
Develop Base Case simulations of NYISO markets through 2040
4.Alternative
CasesMay & June
Develop Alternative Cases through 2040, varying assumptions such as resource costs, load growth, and demand-side flexibility.
With stakeholders, over coming weeks Brattle and NYISO will develop simulations of the future New York power system.

brattle.com | 6See Disclaimer on Slide 2.
Introduction to GridSIM and Capacity Expansion Modeling

brattle.com | 7See Disclaimer on Slide 2.
Introduction to GridSIMWhat are “capacity expansion models”?
– In traditionally regulated areas, commonly used by utilities for IRP
– In organized markets with merchant investment, simulate how investment and market conditions may evolve over time
– Especially valuable for exploring alternative futures in times of uncertainty and major change in market fundamentals, policies, and market design, as in New York
– Example models include PLEXOS, Aurora, Strategist, and Resource Planning Model (NREL)
Capacity expansion models simulate optimal generation investment and operations over a multi-year horizon.

brattle.com | 8See Disclaimer on Slide 2.
Introduction to GridSIMGridSIM: Brattle’s next-gen capacity expansion model
GridSIM Features– Designed to simulate highly-decarbonized
systems
– Implemented with detailed representation of NY power system and NYISO markets
– Co-optimized treatment of energy, ancillary service, and capacity markets
– Chronological commitment and dispatch to robustly model storage.
Example Insights– How to balance a 100% carbon-free grid?
– How are nuclear revenues affected by 70% renewable energy?
– How does the cost of offshore wind influence the future NY resource mix?

brattle.com | 9See Disclaimer on Slide 2.
Introduction to GridSIMPrevious uses of GridSIM
– NYISO Grid in Transition. For NYISO, supported Grid in Transition effort to understand potential market revenue shifts for the NYISO’s recommended market enhancements.
– Ontario Clean Energy Study. For IESO, evaluated the costs and benefits of alternative clean energy procurement mechanisms.
– Clean Energy Attribute Product Design & Procurement. For NEPOOL, evaluated benefits of a dynamic clean energy market in ISO-NE.
– Evaluation of Future Flexibility Needs. For an investor, evaluating the future value of flexible resources within ERCOT.
– Market Design Enhancement Study. For an RTO, evaluated the benefits and costs of enhancements to energy and capacity markets.
– DR and EE Assessment. For EPRI and DOE, evaluated the potential benefits of enhanced DR and EE treatment within resource planning models.
– Nuclear Valuation. For a Southeast utility, evaluated the value of a nuclear plant within a resource planning context.

brattle.com | 10See Disclaimer on Slide 2.
Introduction to GridSIMGridSIM model framework
SupplyExisting resources
Fuel pricesInvestment/fixed costs
Variable costs
DemandRepresentative day hourly
demandCapacity needs
TransmissionZonal limits
Intertie limits
Regulations, Policies, Market Design
Capacity marketCarbon pricing
Procurement mandates
Inputs GridSIMOptimization
Engine
Objective FunctionMinimize NPV of Investment &
Operational Costs
Constraints Market Design and Co-Optimized
Operations• Capacity• Energy• Ancillary Services
Regulatory & Policy Constraints Resource Operational Constraints Transmission Constraints
Outputs
Annual Investmentsand Retirements
Hourly Operations
System and Customer Costs
Supplier Revenues
Market Prices
Emissions and Clean Energy Additions

brattle.com | 11See Disclaimer on Slide 2.
GridSIM minimizes the present value of total system costs across a multi-year horizon, subject to constraints.
Components of Total System Cost:
– Operating costs: Objective to dispatch its system in a least-cost manner across E&AS markets to minimize production costs, including fuel, variable operations and maintenance, startup, and emission costs
– Investment costs: A new resource built only when its total revenues exceed its total costs, such that investment and fixed costs are minimized
Introduction to GridSIMObjective function

brattle.com | 12See Disclaimer on Slide 2.
Introduction to GridSIMConstraints considered
GridSIM simulates system operations subject to technical, market design, and policy constraints.
Market Design & Operations– Must retain sufficient supply to meet resource adequacy requirements, per ICAP market– Each hour, generation must equal load
Regulatory and Policy Constraints– Emission caps and carbon pricing– Technology mandates, e.g. Renewable Portfolio Standards or storage mandates
Resource Operational Constraints– Supply resources subject to technical constraints that vary by resource type, e.g. ramp rates, unit
commitment, min/max gen, hydropower flow limits, lifetime– Availability of import supply & exports can be treated in a variety of ways
Transmission Constraints– Internal and external flows limited by pre-specified transmission limits (pipe and bubble model)

brattle.com | 13See Disclaimer on Slide 2.
Illustrative Analysis
brattle.com | 14See Disclaimer on Slide 2.
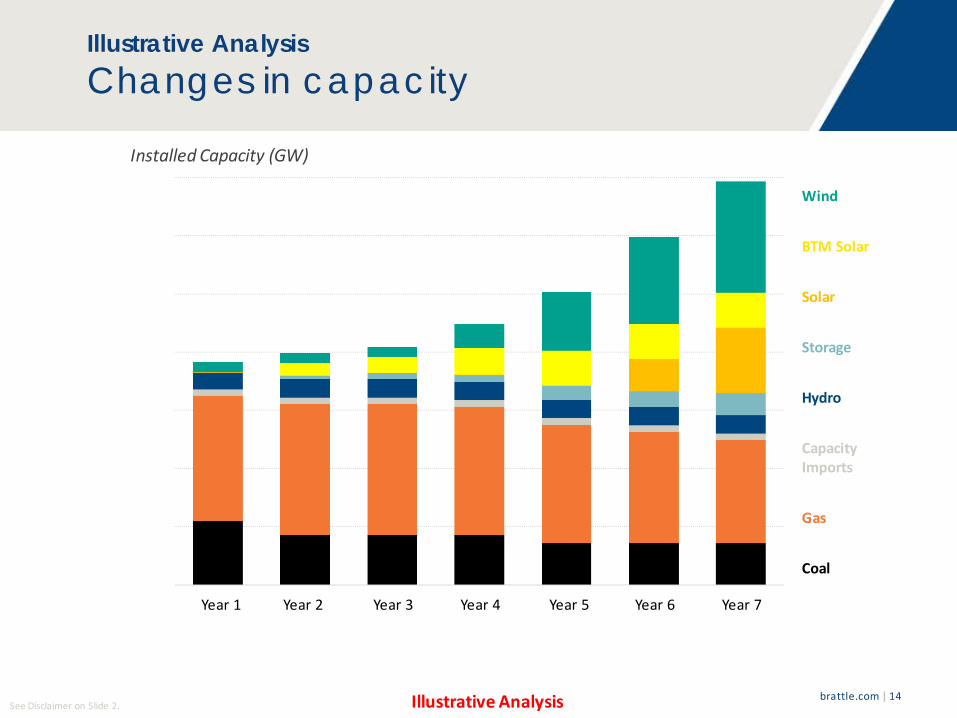
Illustrative AnalysisChanges in capacity
Installed Capacity (GW)
Wind
Solar
Storage
Hydro
BTM Solar
Gas
Coal
Capacity Imports
Illustrative Analysis
Year 1 Year 2 Year 3 Year 4 Year 5 Year 6 Year 7

brattle.com | 15See Disclaimer on Slide 2.
Illustrative AnalysisChanges in generation
Wind
Solar
Coal
Hydro
BTM Solar
Gas
Net Imports
Wind CurtailmentSolar Curtailment
Load + Exports
Annual Generation (TWh)
Illustrative Analysis
Year 1 Year 2 Year 3 Year 4 Year 5 Year 6 Year 7

brattle.com | 16See Disclaimer on Slide 2.
Illustrative AnalysisHourly dispatch in 2030
Wind
Solar
Storage
BTM Solar
Gas
Coal
Wind Curtailment
Jan 3 Feb 15 Apr 14 May 30 Aug 1 Aug 22 Sep 5 Oct 14 Oct 23 Nov 28Modeled Day:
Net Imports
Summer peak
Winter peak
Lowest load day
High gas generation on high load days
Curtailments
Storage charging
2030 Hourly Generation (MW)
Illustrative Analysis

brattle.com | 17See Disclaimer on Slide 2.
Wind 2-hour Storage
4-hour Storage
Solar Gas CT Existing
Gas ST Existing
Gas CC Existing
Site A Site B Site C Site A Site B
Illustrative AnalysisSources of supplier revenues
Clean Attribute
CapacityNet
Energy
A/S
Fixed + Investment
Costs
Unit Revenues ($/kW-yr)
Illustrative Analysis

brattle.com | 18See Disclaimer on Slide 2.
Overview of Modeling Assumptions

brattle.com | 19See Disclaimer on Slide 2.
Modeling AssumptionsKey assumptions
Key Input Assumption
1 System Model • Internal and external transmission constraints (pipe/bubble model)
2 Supply Resources
• All existing supply resources and planned builds/retirements• New supply resource costs and technical constraints• Available supply from neighbors (can be modeled in several ways)
3 Demand • Hourly load shapes• Future load forecast, including electrification and climate impacts• Flexibility of demand side
4 Temporal Representation
• 10 representative days modeled at hourly granularity, selected and weighted to reflect average annual system conditions
• 2020 – 2040 time horizon
5 Market Design • NYISO ICAP market design• Ancillary service requirements & shortage pricing
6 FinancialAssumptions
• Cost of capital

brattle.com | 20See Disclaimer on Slide 2.
CLCPA
• Renewable generation: 70% of NY annual electricitysupplied from renewables (solar, wind, hydro) by 2030
• 100% carbon-free electricity by 2040• Solar: 6,000 MW distributed solar by 2025• Offshore wind: 9,000 MW by 2035• Storage: 3,000 MW by 2030• Economy-wide emissions: 85% reduction by 2050 and 40%
reduction by 2030 from 1990 levels
RGGI • Northeast regional cap-and-trade program• Avg. 2019 price: $5.4/ton; expected to reach $12.6 by 2030
ZEC Program • Zero emission credit payments to New York nuclear plants• Program expires March 2029
DEC NOX rule• DEC rule to reduce NOX emissions from peakers• Peakers built pre-1986 may retire instead of retrofitting to
meet emissions requirements
Modeling AssumptionsModeled clean energy policies
Policy Timeline
Sources and Notes:RGGI Auction Allowance Price and Volumes ResultsNew York Public Service Commission Order Adopting a Clean Energy Standard. August 1, 2016New York DEC Adopted Subpart 227-3New York Senate Bill S6599
Description of Key Policies
RGGI: First control period2009
ZEC: Program in effect2016
Solar: 6,000 MW mandateNOX Rule: In full effect2025
ZEC: Program expires2029
2030 CLCPA: 70% renewable electricityStorage: 3,000 MW mandate
OSW: 9,000 MW mandate2035
2040 CLCPA: 100% carbon-free electricity
2050 CLCPA: 85% NY economy-wide decarbonization

brattle.com | 21See Disclaimer on Slide 2.
Modeling AssumptionsRepresentation of New York grid
In conjunction with NYISO, Brattle developed a 5-zone “pipe-and-bubble” representation of the New York grid.
A-E GHI
J
K
F
PJM
ON
HQ
ISO-NE
1900 1900
4600
4600
3600
3600 5500
5500 Group 1
Central East
M arcy South
3900
2000Sprain Brook-Dunw oode South
30
1200
Y49/Y50
0
300Jamaica Ties (J-K)
Capital-HUDV
0
900
6500
Interface
Interface Group
Limits
Group 2
300/300
Group 3
Off Shore Wind
CSC & 1385 Northport
54% PJM -NY
50% NE-NY
HTP & VFT
Neptune
50% NE-NY
46% PJM -NY

brattle.com | 22See Disclaimer on Slide 2.
Modeling AssumptionsExisting supply resources
– 2018 Gold Book primary source of generator data
– Most generators aggregated by zone and type (e.g., gas CC & CT, nuclear, OSW)
– Subset of generators modeled independently due to unique characteristics
– Generator characteristics (e.g., heat rate, VOM) developed w/ NYISO input
– UCAP value of renewables modeled dynamically
WindSolar
Storage
Nuclear
Bio
Hydro
2018 Installed Capacity
GasOil
Coal
Capacity Imports
We model all existing generators in New York, consistent with the 2018 Gold Book and other sources of data.

brattle.com | 23See Disclaimer on Slide 2.
Modeling AssumptionsNew supply resources
Bio
Select Resource Costs (2018$)To be Refined
Future generator investment costs based on review of multiple sources, including NREL, EIA, and NYISO DCR study.
Additional technologies to be considered
• Carbon capture• Power-to-gas• Small modular nuclear• Seasonal storage
Resource Cost (2018$/kW)
Wind – Offshore
Gas CC
Solar – Wholesale
Solar – Behind the MeterWind – Onshore
Gas CT
Storage ($/kW-hour)

brattle.com | 24See Disclaimer on Slide 2.
Modeling AssumptionsLoad Shapes
We select and weight representative days to reflect NYISO’s 2018 hourly load duration curves. – Day selection and weighting considers seasonality, gas price, and renewable generation
– Will evaluate how representative load shapes may evolve with electrification
Day Weight
1/3/2018 142/15/2018 764/14/2018 285/30/2018 398/1/2018 278/22/2018 239/5/2018 12
10/14/2018 610/23/2018 7611/28/2018 64
Representative Days
Summer Peak
Winter Peak
Low Load Day
2018 NYISO Load Historical vs. Simulated
2018 Historical
Simulated
Hours in year
Load (MW)

brattle.com | 25See Disclaimer on Slide 2.
Modeling AssumptionsLoad Forecasts
We will utilize load forecasts consistent with current NYISO outlooks.
– Initial modeling utilized load forecasts from 2018 Gold Book
– Will update forecasts to be consistent with most recent NYISO outlook and leverage Climate Change Phase 1 forecast
– Will consider impacts of electrification and climate change
NYISO Forecasted LoadTotal Annual Energy (TWh)
NYISO Gold Book
Climate Impact Study - CLCPA Case
Climate Impact Study – Policy Case

brattle.com | 26See Disclaimer on Slide 2.
Neptune
Modeling AssumptionsImports and exports
A-EGHI
J K
F
PJM
ON
HQ
ISO-NE
CSC & 1385 Northport
54% PJM-NY
50% NE-NY
HTP & VFT
50% NE-NY
46% PJM-NY
Off Shore Wind
– Hydro Quebec modeled as fully flexible• Reflects HQ’s hydro storage potential• In all hours, allow flows up to line limit
(1500 MW import, 1000 MW export)
– All other interties modeled as less flexible• Reflects similar balancing challenges in
neighboring systems• Lock hourly exports at 2018 levels• Hourly imports allowed to flex between
zero and 2018 levels (e.g. model can reduce imports if uneconomic)
Treatment of New York Interties
We model New York interties consistent with historical flows, but reflect some ability of neighboring systems to help balance NY renewable generation.

brattle.com | 27See Disclaimer on Slide 2.
Feedback and Next Steps

brattle.com | 28See Disclaimer on Slide 2.
Feedback & Next StepsStudy timeline and workplan
MIWG: Introduction to GridSIM, stakeholder feedback
March 6 (today)
MIWG: Discuss modeling & assumptions, stakeholder feedback
March 30
MIWG: Initial results, finalize alternative cases
Mid-May
MIWG: Alternative case resultsEarly June
Brattle & NYISO: Develop initial assumptions
Brattle & NYISO: Finalize assumptions, develop base case
Brattle & NYISO: Develop alternative cases

brattle.com | 29See Disclaimer on Slide 2.
Feedback & Next Steps Alternative cases
Potentialcases:
– High load growth due to electrification
– Increased demand-side flexibilityand market participation
– Rapid technology improvement for wind, solar, other clean resources
– Increased transmission capacity
– Continued nuclear support after expiration of ZEC program in 2029
Brattle and NYISO will develop two alternative cases that vary key assumptions.
What alternative cases would stakeholders find most valuable?

brattle.com | 30See Disclaimer on Slide 2.
Feedback & Next StepsRequest for stakeholder input
Detailed inputs and assumptions to be presented March 30.
What questions would be most helpful for this study to answer?
What feedback do you have on inputs and assumptions?

brattle.com | 31See Disclaimer on Slide 2.
Sam NewellPrincipal, Boston
Roger LuekenSenior Associate, Washington, D.C.
Presented By
The views expressed in this presentation are strictly those of the presenter(s) and do not necessarily state or reflect the views of The Brattle Group, Inc. or its clients.

brattle.com | 32See Disclaimer on Slide 2.
The Brattle Group provides consulting and expert testimonyin economics, finance, and regulation to corporations, lawfirms, and governments around the world. We aim for thehighest level of client service and quality in our industry.
About Brattle
OUR SERVICES
Research and Consulting
Litigation Support
Expert Testimony
OUR PEOPLE
Renowned Experts
Global Teams
Intellectual Rigor
OUR INSIGHTS
Thoughtful Analysis
Exceptional Quality
Clear Communication

brattle.com | 33See Disclaimer on Slide 2.
Our Offices
BOSTON CHICAGO
NEW YORK ROME SAN FRANCISCO
SYDNEY TORONTO WASHINGTON
BRUSSELS LONDON
MADRID

brattle.com | 34See Disclaimer on Slide 2.
Our Practices and Industries
ENERGY & UTILITIESCompetition & Market
Manipulation Distributed Energy
Resources Electric Transmission Electricity Market Modeling
& Resource Planning Electrification & Growth
OpportunitiesEnergy LitigationEnergy StorageEnvironmental Policy, Planning
and ComplianceFinance and Ratemaking Gas/Electric Coordination Market Design Natural Gas & Petroleum Nuclear Renewable & Alternative
Energy
LITIGATIONAccounting Analysis of Market
ManipulationAntitrust/Competition Bankruptcy & Restructuring Big Data & Document Analytics Commercial Damages Environmental Litigation
& RegulationIntellectual Property International Arbitration International Trade Labor & Employment Mergers & Acquisitions
Litigation Product Liability Securities & FinanceTax Controversy
& Transfer Pricing Valuation White Collar Investigations
& Litigation
INDUSTRIESElectric Power Financial Institutions InfrastructureNatural Gas & Petroleum Pharmaceuticals
& Medical Devices Telecommunications,
Internet, and Media Transportation Water