state energy planning board study: nyiso input and ... · state energy planning board study: nyiso...
TRANSCRIPT

State Energy Planning Board Study NYISO Input and Reliability Analysis
Aug 11 2009
Contents
I Background 3
II Integrated Planning Model Analysis 3
III Reliability Assessment 4
IV Summary 6
Appendix A IPM Model Input Assumption Matrix 7
Appendix B Transmission Topology
11
Appendix C NYISO Reliability
Assessment 14
I MARS Base Case Models 15
II MARS Results 17
III Summary 23
Exhibit C-1 Base Case Capacity
Modifications 24
Exhibit C-2 Scenario 1 Capacity
Modifications 28
Exhibit C-3 Scenario 2 Capacity
Modifications 31
wwwnyisocom | State Energy Planning Board Study NYISO Input and Reliability Analysis |August 11 2009 | 2
I Background
By Executive Order Governor David A Paterson created the State Energy Planning Board (SEPB) in April 2008 The Governor charged the Board with analyzing a broad range of matters related to the Statersquos energy systems including but not limited to the reliability of delivery networks for electricity natural gas and petroleum products and the interrelated effects of New Yorkrsquos production and use of energy on the Statersquos economy environment and transportation systems The Governorrsquos 2009 Energy Plan (Plan) will contain policies programs and strategies that will address these matters over the 2009 through 2018 planning horizon
As part of the Energy Plan an extensive multi-part computer modeling effort was undertaken to assess the effects of policies and programs recommended for adoption on a range of factors relevant to decision-makers Among them are the cost of electricity and capacity forecasted changes in the electricity and natural gas systems including the transfer capabilities of the transmission grid and emission levels of greenhouse gases and other pollutants
The NYISO supported the Statersquos development of the computer modeling effort by providing several technical white papers and reviewing the model assumptions and results
Based on the results of the Energy Plan assessment assumptions regarding the retirement or repowering of existing generating units and the installation of new units were made by the SEPB Working Group to meet the future capacity needs of the state and the environmental objectives The NYISO performed a reliability study using the GE Multi-Area Reliability Simulation (MARS) program version 292 The Reliability Study was conducted to verify that the SEPBrsquos assumed capacity modifications would not result in the violation of the Loss of Load Expectation (LOLE) criterion of once in 10 years (or 01 per year) as established by the Northeast Power Coordinating Council (NPCC) and the New York State Reliability Council (NYSRC) That criterion establishes that the resources available on the electric system in New York should be sufficient such that the probability of an unplanned outage on the bulk power grid is never greater than once in ten years
II Integrated Planning Model Analysis To support the Statersquos Integrated Planning Model (IPM) analysis the NYISO performed the following tasks
1 Provided to the State technical white papers in October and November 2008
2 Provided forecasting and other modeling assumptions used in the development of the 2009 Reliability Needs Assessment and 2009
wwwnyisocom | State Energy Planning Board Study NYISO Input and Reliability Analysis |August 11 2009 | 3
Installed Reserve Margin
3 Reviewed and provided comments to the SEPB Working Grouprsquos Assumption Matrix attached in Appendix A
4 Reviewed and provided comments on the SEPB Working Grouprsquos transmission topology included in Appendix B
5 Reviewed the SEPB Working Grouprsquos results from the IPM model and raised concerns regarding the fuel pricing imports and exports capacity levels environmental allowances and emission levels
6 Reviewed and provided comments on the first draft of the State Energy Planning Board preliminary assessment
III Reliability Assessment A Process
In order to assess the reliability of the capacity retirementsadditions resulting from the IPM study the NYISO modeled the SEPB Working Grouprsquos capacity recommendations in MARS and calculated the LOLE The SEPB Working Group developed two IPM base case models (Reference Cases) The first utilized the load forecast that was used in NYISO RNA study This load forecast is based on achieving 30 of the Energy Efficiency Portfolio Standard (EEPS) and is referred to as the ldquoSEPB RNA Caserdquo The second reference case modelrsquos load forecast assumes that the full EEPS is achieved and is referred to as the ldquoSEPB 15 x 15 Caserdquo Since this case assumes a lower load forecast than the ldquoSEPB RNA Caserdquo it also assumes approximately 1500 MW less capacity The recommended capacity modifications for these two base (reference) cases are included as Exhibit C-1 in Appendix C
Four study years (2009 2012 2015 and 2018) were evaluated in MARS to determine the NYCA and Zonal LOLEs for each base case model
The following two scenarios were also evaluated for each of the two base cases
1 Addition of Nuclear Capacity Upstate 2 30 Renewable Portfolio Standard
More details regarding the development of the models for the Reliability Assessment are included in Appendix C
B Results 1 Base Models (Reference Cases)
No LOLE violations of 01 or greater occurred for all study years for both base cases provided that the assumed load forecast is
wwwnyisocom State Energy Planning Board Study NYISO Input and Reliability Analysis | August 11 2009 | 4
achieved However if the full 15 x 15 load forecast is not achieved an LOLE violation may occur for the ldquoSEPB 15 x 15 Caserdquo It was found that utilizing the higher load forecast from the ldquoSEPB RNA Caserdquo in the ldquoSEPB 15 x 15 Caserdquo an LOLE violation of 0102 would occur in NYCA in 2012 and would increase to 0627 by 2018
2 Scenarios i Upstate Nuclear Addition
a A scenario of adding 1600 MW of generic nuclear power upstate in 2018 was evaluated for each of the base cases This capacity addition was modeled by prorating the increase among the existing upstate nuclear facilities
b ldquoSEPB RNA Caserdquo i In addition to the 1600 MW upstate nuclear
addition this scenario also included the following capacity modifications as compared to the base ldquoSEPB RNA Caserdquo
1 Retiring of SA Carlson 27 MW in 2012
2 Retiring of Roseton 1 and 2 1144 MW in 2018
3 Shifted 20 MW of Wind Addition from 2012 to 2015
ii A NYCA LOLE violation of 0276 would occur in 2018 An LOLE violation in Zones I and J would also occur Two additional runs were completed to determine the impact of retiring the Roseton units If both Roseton units are kept in-service the NYCA LOLE reduces to 002 Retiring only one of the units result in a NYCA LOLE of 071 This indicates that the addition of the nuclear capacity upstate is not sufficient to offset the retirement of both Roseton 1 and 2 units
c ldquoSEPB 15 x 15 Caserdquo i In addition to the 1600 MW upstate nuclear
addition this scenario also includes the following retirements as compared to the base ldquoSEPB 15 x 15 Caserdquo
1 East River Units 6 and 7314 MW in 2015
ii No LOLE violations occur through out the study period due to the low load forecast A
wwwnyisocom State Energy Planning Board Study NYISO Input and Reliability Analysis | August 11 2009 | 5
second case was run using the load forecast used in the ldquo SEPBRNA Caserdquo which is based on achieving only 30 of EEPS For this condition an LOLE violation of 0103 occurs in 2012 and increases to 087 in 2018
ii Scenario 2- 30 Renewable Portfolio Standard This scenario is similar to Scenario 1 with the following major differences
a Only Roseton 1 unit is retired b 3543 MW of additional wind capacity located
upstate is included
This scenario was only run for the ldquoSEPB RNA Caserdquo It was found that no LOLE violations occur over the study period
IV Summary The NYISO worked closely with the SEPBrsquos Working Group to support their effort to address the future energy needs for the State NYISO shared their technical expertise provided input on the SEPB Working Grouprsquos model assumptions and commented on the results NYISO also completed a Reliability Assessment analysis in order to determine the impact of the recommended capacity modifications on the reliability of the system
Reliability Assessment Summary LOLE Results
SEPB RNA Case No violation SEPB 15 x 15 Case No violation if full 15 x 15 EEPS is
achieved A violation in 2012 may occur if only 30 of the EEPS is achieved
Scenario 1 Upstate Nuclear SEPB RNA Case A violation occurs in 2018 if both Roseton Units are retired No violation occurs if at least one Roseton unit remains in-service SEPB 15 x 15 Case No violation if full 15 x 15 EEPS is achieved A violation in 2012 may occur if only 30 of the EEPS is achieved
Scenario 2 30 Renewable Portfolio Standard
No violation
wwwnyisocom State Energy Planning Board Study NYISO Input and Reliability Analysis | August 11 2009 | 6
Appendix A IPM Model Input Assumption Matrix
wwwnyisocom State Energy Planning Board Study NYISO Input and Reliability Analysis | August 11 2009 | 7
Model Input Proposed Info Source(s)
State of Consensus Input Status
Cost amp performance of frac34 EIA Annual frac34 Consensus frac34 To ICF new generation Energy Outlook
(2008) plus regional multipliers
frac34 NETL assumptions for carbon capturesequest
frac34 Consensus 81308
frac34 To ICF 81308
Firmly planned capacity frac34 NYISO 2009 frac34 Consensus Market frac34 To ICF AdditionsRetirements RNA base case
assumptions frac34 ICFrsquos latest data
for other regions NYISO providing NERC CP-8 as reference
solutions excluded
frac34 Consensus
81308
frac34 To ICF 9208
Cost and performance frac34 EIA Annual frac34 Consensus frac34 To ICF of pollution controls Energy Outlook
(2008) plus ICF refinements
81308
Regional peak and load requirements
Initial ~10 years frac34 NYISO 2009
RNA base case assumptions
frac34 Latest PJM and ISONE projections
frac34 ICF load forecasts for remainder of the country
Later run years frac34 Extend NYISO
ISONE and PJM growth rates into later years
frac34 ICF load forecasts for remainder of the country
frac34 Consensus
frac34 Consensus
frac34 Consensus Includes partial achievement of Energy Independence and Security Act
frac34 Consensus
frac34 Consensus Includes partial achievement of Energy Independence and Security Act
frac34 To ICF 81308
frac34 To ICF 81308
frac34 Being developed
frac34 To ICF 81308
frac34 Being Developed
wwwnyisocom State Energy Planning Board Study NYISO Input and Reliability Analysis | August 11 2009 | 8
Model Input Proposed Info Source(s)
State of Consensus Input Status
Transmission frac34 NYISO updated frac34 Consensus frac34 To ICF constraints values for NY
and neighboring areas
frac34 Firmly planned changes in NYISO 2009 RNA base case assumptions
frac34 ICFrsquos latest data for other regions NYISO providing NERC CP-8 as reference
frac34 Consensus
frac34 Consensus
81908
frac34 To ICF 81908
frac34 To ICF 9208
Installed reserve frac34 NYSRC IRM frac34 Consensus frac34 To ICF margins and locational study 2008 (15 81308 requirements State 80
NYC 94 LI) frac34 Other regions
ISOs or equiv
frac34 Consensus frac34 To ICF
81308
Fuel Price Forecasts frac34 EEA Henry Hub natural gas under 3-P scenario
frac34 ICF to use transportation adders for natural gas for each modeled zone
frac34 EEA WTI (June 2008)
frac34 ICF to convert WTI to refined product prices at NY Harbor and Gulf Coast
frac34 ICF to use transportation adders for refined products at each modeled zone
frac34 Consensus
frac34 Consensus
frac34 Consensus frac34 Consensus
frac34 Consensus
frac34 Consensus
frac34 Being Developed
frac34 Loaded in IPM
frac34 To ICF 81308
frac34 Factors loaded in IPM
frac34 Loaded in IPM
frac34 Loaded in IPM
wwwnyisocom State Energy Planning Board Study NYISO Input and Reliability Analysis | August 11 2009 | 9
Model Input Proposed Info Source(s)
State of Consensus Input Status
frac34 Coal price forecasts from ICF
Renewable Portfolio Standards
frac34 Current RPSs in Northeast and Mid-Atlantic are met
frac34 Wind gets capacity payment for 20 of nameplate
frac34 Limit wind to 10 of regional capacity
frac34 Consensus
frac34 Consensus
frac34 Loaded in IPM
frac34 Loaded in IPM
RGGI frac34 10-state RGGI program in place
frac34 Consensus frac34 Loaded in IPM
Clean Air Interstate Rule
frac34 Guidance from DEC = use old CAIR policy assumptions
frac34 Consensus frac34 Loaded in IPM
Mercury frac34 NY unit-level Hg MACT program
frac34 Other state-specific Hg rules
frac34 Federal Hg MACT in model run year 2015
frac34 Consensus frac34 Loaded in IPM
frac34 Loaded in IPM
frac34 Loaded in IPM
Model run years frac34 2009 (2008-10) 2012 (2011-13) 2015 (2014-16) 2018 (2017-19) 2021 (2020-22) 2024 (2023-25)
frac34 Consensus frac34 To ICF 81908
Proxy for reliability related run times for key generators
frac34 NYISO provided typical weather-normalized data
frac34 Consensus frac34 To ICF 9308
wwwnyisocom State Energy Planning Board Study NYISO Input and Reliability Analysis | August 11 2009 | 10
Appendix B Transmission Topology
wwwnyisocom | State Energy Planning Board Study NYISO Input and Reliability Analysis |August 11 2009 | 11
NYSERDA IPMreg Reference Case Assumptions Northeast Regional Transmission Capabilities
Prepared for NYSERDA for State Energy Plan
Prepared by ICF International
September 8 2008
Transmission ndash NY (EnergyCapacity in GW)
Canada - QUE Canada - ONT
5
(PJM) JPL-E
(PJM)
30
20
16
3235 (2011-M29) 35 0
27
20
32
PSEG-N 24
06
132
NEP - WMA
05
08
NEP ndash CT 08
NEP - VT
0
175
12
35
35
053 0
10
066
066
Zones A-E
Zone F
Long Island
Zones G-I
NYC
16
15
NOTE New York also
12 26
2175
Joint Capacity Constraints
Transmission Lines
faces a joint capacity constraint from any non-NY region of 2775 GW
48
1325
West Central (PJM)
08 1512
05
10
wwwnyisocom State Energy Planning Board Study NYISO Input and Reliability Analysis | August 11 2009 | 12
Transmission ndash NEPOOL (EnergyCapacity in GW)
CAN- New Brunswick
203814
203684
2222
ME
NHVT
West MA Central amp NE MA
CT
RI
Boston
2727
27900
2121 21708
1414
2727
279
2727
145329
145725
2222
27273333
Southeast MA
145145
21708
2121
77
997997
55
22515
CAN- Quebec
55NY- ZONE F
0225
88
88
NY- LILCO
NY- GHI
530
ME-BHE
105105
1515
ME-S
115115
21491
NY- A-E 00
515
350
175175
251042
77
105105
2727
1414
2222 145145
115115
1512
Note Red numbers indicate post 2015 values
Transmission ndash PJM (EnergyCapacity in GW) NYISO-NYC
355 3535
38823
4817
3636
51
178
9
833
3512
00
33
5
64733
5
83
13
2920
5
1476
43305710
31
54
2626
2828
2828
1575155
26
18
181
8
452
452
2114
1919
2077
15815
00
AEP
South
West
West Central
JPL-W
PSEG-S
PECODOM DPL
JPL-E
AE
45
45
345345
2920
PSEG-C
5
6
00
5710
00
33
00
77
45
00
PSEG-N4743
5
1010 NYISO-Downstate 0055
NYISO-LILCO
666
660
NYISO-Upstate 132132
66 55
105
2424
37
14 2623
225
22
37
3629
3223
00
6908
6655
4743
00
4628
4628
First Energy
-- unlimited capability for energy
wwwnyisocom State Energy Planning Board Study NYISO Input and Reliability Analysis | August 11 2009 | 13
Appendix C NYISO Reliability Assessment
wwwnyisocom State Energy Planning Board Study NYISO Input and Reliability Analysis | August 11 2009 | 14
I MARS Base Case Models A Model Assumptions
1 Study Period The Reliability Study looks out over a 10 year period from 2009 to 2018 The years studied include 2009 2012 2015 and 2018
2 Base Model A base model was created by modifying the 2009 Installed Reserve Margin (IRM) model Modifications to this one year IRM model are necessary in order to include known changes that will take place over the planning period as determined in the 2009 Reliability Needs Assessment (RNA) Base Case This base model was used as the starting point for creating the two study cases being evaluated The following modifications were made based to the 2009 Reliability Needs Assessment (RNA) Base Case
i The following generation additions and uprates which were included in the Base Case of the 2009 RNA were added
a Empire Generating (Besicorp) 660 MW b Blenheim-Gilboa Unit 1 30 MW c Blenheim-Gilboa Unit 2 30 MW d Nine Mile Point Unit 2 168 MW
ii The following generator retirements which were included in the Base Case of the 2009 RNA were included
a Poletti 8907 MW
3 The transfer limits used in the Base Case of the 2009 RNA were included
4 All external area loads and capacity data were held constant through out the study period
B SEPB RNA Case
1 Load Forecast The ldquoSEPB RNA Caserdquo utilizes the load forecast used in the 2009 RNA Base Case This load forecast is based on achieving 30 of the Energy Efficiency Portfolio Standard (EEPS) as shown in Table 1
wwwnyisocom State Energy Planning Board Study NYISO Input and Reliability Analysis | August 11 2009 | 15
Table 1 2009 RNA Base Case Load Forecast (MW) (Per 2009 RNA Report Table 3-1) 2009 2012 2015 2018
2009 RNA Base Case
34059 34586 35029 35658
2 Capacity Modifications Exhibit C-1 includes the capacity modifications provided by the SEPB Working Group for inclusion in the reliability analysis The generic capacity additions shown as being located in multiple zones were entered into MARS by prorating the values across the zones based on the existing generator capacity type located in those zones The amount of generic capacity included in each zone is also shown in Exhibit C-1
Table 2 below summarizes the total capacity changes by generator type as compared to the base model for the ldquoSEPB RNA Caserdquo
Table 2 Capacity Assumptions for the SEPB RNA Case Generator Type SEPB RNA Case
Capacity Change as Compared to the Base Model (MW)
Combined Cycle 1081 Coal -55
Combustion Turbine -129 Hydro 191
Landfill Gas 122 Nuclear 106 OilGas -1115 Wind 3603
Overall Total 3804
C SEBP 15 x 15 Case Load Forecast The ldquoSEPB 15 x 15 Caserdquo utilizes the load forecast used in Scenario 2 of the 2009 RNA This load forecast is based on achieving 100 of the EEPS as shown in Table 3
Table 3 2009 RNA Scenario 2 Load Forecast (MW) (Per 2009 RNA Report Table 3-1) 2009 2012 2015 2018
2009 RNA Scenario 2
33704 32722 31227 32209
1 Capacity Modifications Exhibit C-1 includes the capacity modifications provided by
wwwnyisocom State Energy Planning Board Study NYISO Input and Reliability Analysis | August 11 2009 | 16
SEPB Working Group for inclusion in the reliability analysis The generic capacity additions shown as being located in multiple zones were entered into MARS by prorating the values across the zones based on the existing generator capacity type located in those zones The amount of generic capacity included in each zone is also shown in Exhibit C-1
Table 4 below summarizes the total capacity changes by generator type as compared to the Base Model for the ldquoSEPB 15 x 15 Caserdquo
Table 4 Capacity Assumptions for SEPB 15 x 15 Case Generator Type SEPB 15 x 15 Case
Capacity Change as Compared to the Base Model (MW)
Combined Cycle -76 Coal -55
Combustion Turbine -129 Hydro 191
Landfill Gas 122 Nuclear 106 OilGas -1573 Wind 3603
Overall Total 2189
II MARS Results A Base Model
For comparison purposes Table 5 below provides the LOLE results for the Base Model for each NY zone and for the overall NY Control Area (NYCA) for each study year This is based on the 2009 RNA Base Case load forecast (achieving 30 EEPS) and the capacity values
wwwnyisocom State Energy Planning Board Study NYISO Input and Reliability Analysis | August 11 2009 | 17
Table 5 Base Model LOLE
Zone Base Model As Found w 30 EEPS 2009 2012 2015 2018
A 00 00 00 00 B 00 00 00 0003 C 00 00 00 00 D 00 00 00 00 E 00 00 00 0001 F 00 00 00 00 G 00 00 00 0001 H 00 0001 00 0001 I 0001 0008 002 0079 J 0001 0009 0022 0091 K 0001 00 00 0001
NYCA 0001 0010 0024 0096
B SEPB RNA Case Table 6 below provides the LOLE results for the base ldquoSEPB RNA Caserdquo The resultant LOLE criterion of 01 per year is not violated for any area for any study year Therefore the SEPB assumed capacity modifications will not negatively impact the Statersquos reliability provided that 30 of the EEPS is achieved In fact the SEPB capacity modification assumptions improves the LOLE for Zones I J and NYCA
Table 6 SEPB RNA Case LOLE
Zone SEPB RNA Case
2009 2012 2015 2018 A 00 00 00 00 B 00 00 00 0004 C 00 00 00 00 D 00 00 00 00 E 00 00 00 0002 F 00 00 00 00 G 00 00 00 0001 H 00 00 00 00 I 00 0002 0007 0028 J 00 0003 0007 003 K 0001 00 00 00
NYCA 0001 0003 0008 0032
C SEPB 15 x 15 Case Table 7 below provides the LOLE results for the base ldquoSEPB 15 x 15 Caserdquo Even though there is less capacity assumed for this case the lower load forecast is sufficient enough such that the LOLE drops as compared to the base model or the base ldquoSEPB RNA Caserdquo
However if the 15 x 15 load forecast is not achieved reliability violations may occur as early as 2012 for this given capacity condition Table 8
wwwnyisocom State Energy Planning Board Study NYISO Input and Reliability Analysis | August 11 2009 | 18
shows the results based on using the capacity assumptions for the ldquoSEPB 15 x 15 Caserdquo but only achieving the 30 of the EEPS as assumed it the ldquoSEPB RNA Caserdquo This shows that the LOLE would exceed 01 by 2012 and would exceed 06 by 2018 The primary differences impacting these LOLE results is that the ldquoSEPB 15 x 15 Caserdquo retires nearly 1000MW more and installs nearly 500MW less in fossil fuel plants than the ldquoSEPB RNA Caserdquo This will result in a much lower reliable system if the loads arenrsquot sufficiently reduced to offset this lack of generation capacity
Table 7 SEPB 15 x 15 Case LOLE
Zone SEPB 15 x 15 Case
2009 2012 2015 2018 A 00 00 00 00 B 00 00 00 00 C 00 00 00 00 D 00 00 00 00 E 00 00 00 00 F 00 00 00 00 G 00 0001 00 00 H 00 00 00 00 I 00 0006 00 0001 J 00 0005 00 0001 K 00 00 00 00
NYCA 0001 0007 00 0001
Table 8 30 EEPS and SEPB 15 x15 LOLE
Zone
w 30 EEPS Load Forecast and SEPB 15 x 15 Capacity
2009 2012 2015 2018 A 0 0 0 0 B 0 0006 001 0026 C 0 0 0 0 D 0 0 0 0 E 0 0001 0003 0009 F 0 0 0 0 G 0 0033 007 0203 H 0 0001 0001 0001 I 0 0096 0213 0589 J 0 0081 0181 0523 K 0001 0001 0001 0003
NYCA 0001 0102 023 0627
D Scenario 1- Upstate Nuclear Addition A scenario of adding 1600 MW of generic nuclear power upstate in 2018 was evaluated This capacity addition was modeled by prorating the increase among the existing upstate nuclear facilities and adding the
wwwnyisocom State Energy Planning Board Study NYISO Input and Reliability Analysis | August 11 2009 | 19
capacity increase to the existing units per Table 9
Table 9 Upstate Nuclear Capacity Addition Nuclear Unit Existing Summer
Capacity Capacity Addition New Summer
Capacity Ginna 580 267 847
Nine Mile Pt Unit 1 690 318 1008 Nine Mile Pt Unit 2 1305 600 1905
Fitzpatrick 902 415 1317 Total 3477 1600 5077
1 SEPB RNA Case- Upstate Nuclear Scenario Exhibit C-2 includes the capacity modifications provided by SEPB Working Group for inclusion in the reliability analysis In addition to the 1600 MW upstate nuclear addition this scenario also includes the following changes as compared to the base ldquoSEPB RNA Caserdquo
i Retiring of SA Carlson 27MW in 2012 ii Retiring of Roseton 1 and 2 1144MW in 2018 iii Shifted 20MW of Wind Addition from 2012 to 2015
Table 10 shows the LOLE results for the SEPB RNA Case- Upstate Scenario and indicates that a NYCA LOLE violation of 0276 would occur in 2018 An LOLE violation in Zones I and J would also occur This indicates that the addition of the nuclear capacity upstate is not sufficient to offset the retirement of the Roseton 1 and 2 units located downstate due to transmission limitations
Table 10 SEPB RNA Case ndash Upstate Nuclear Scenario LOLE
Zone
SEPB RNA Case- Upstate Nuclear Scenario
2009 2012 2015 2018 A 00 0000 0000 00 B 00 0000 0000 0002 C 00 0000 0000 00 D 00 0000 0000 00 E 00 0000 0000 0001 F 00 0000 0000 00 G 00 0000 0000 0084 H 00 0000 0000 00 I 00 0002 0007 0255 J 00 0003 0007 0223 K 0001 0000 0000 00
NYCA 0001 0003 0008 0276
wwwnyisocom State Energy Planning Board Study NYISO Input and Reliability Analysis | August 11 2009 | 20
Two additional runs were completed to determine the impact of retiring the Roseton units If both Roseton units are kept in-service the NYCA LOLE reduces to 002 If only one unit is retired the resulting NYCA LOLE would be 071
2 SEPB 15 x 15 Case- Upstate Nuclear Scenario Exhibit C-2 includes the capacity modifications provided by SEPB Working Group for inclusion in the reliability analysis In addition to the 1600 MW upstate nuclear addition this scenario also includes the retirement of East River Units 6 and 7 (314MW) in 2015 as compared to the base ldquoSEPB 15 x 15 Caserdquo
Table 11 shows the LOLE results for the SEPB 15 x 15 Case-Upstate Scenario No LOLE violations would occur through out the study period due to the low load forecast
Table 11 SEPB 15 x 15 Case- Upstate Nuclear Scenario LOLE
Zone SEPB 15 x 15 Case- Upstate Nuclear Scenario
2009 2012 2015 2018 A 00 0000 0000 00 B 00 0000 0000 0 C 00 0000 0000 00 D 00 0000 0000 00 E 00 0000 0000 0 F 00 0000 0000 00 G 00 0001 0000 0001 H 00 0000 0000 00 I 00 0006 0000 0003 J 00 0005 0000 0003 K 0001 0000 0000 00
NYCA 0001 0007 0 0004
A second case was run using the load forecast used in the ldquoSEPB RNA Caserdquo which is based on achieving only 30 of EEPS Table 12 includes the results of this case which shows that a NYCA LOLE violation of 0103 would occur in 2012 and increases to 087 in 2018
wwwnyisocom State Energy Planning Board Study NYISO Input and Reliability Analysis | August 11 2009 | 21
Table 12 30 EEPS and SPEB 15 x 15 Case - Upstate Nuclear Scenario LOLE
Zone
SEPB 15 x 15 Case- Upstate Nuclear Scenario w 30 EEPS Load Forecast
2009 2012 2015 2018 A 00 0000 0000 00 B 00 0006 0014 0003 C 00 0000 0000 00 D 00 0000 0000 00 E 00 0001 0004 0001 F 00 0000 0000 00 G 00 0033 0121 0204 H 00 0001 0002 00 I 00 0096 0427 0812 J 00 0080 0385 0763 K 0001 0001 0002 00
NYCA 0001 0103 0461 087
As shown in the base ldquoSEPB 15 x 15 Caserdquo if the full EEPS load forecast is not achieved a resource adequacy violation would occur The increase in the NYCA LOLE from 627 in the base ldquoSPEB 15 x 15 Caserdquo to 087 in this scenario indicates that adding 1600 MW nuclear capacity upstate is not sufficient enough to offset the retirement of the East River units located downstate
E Scenario 2- 30 Renewable Portfolio Standard Exhibit C-3 includes the capacity modifications provided by SEPB Working Group for inclusion in the reliability analysis This scenario is similar to Scenario 1 with the following major differences
i Only Roseton 1 unit is retired ii 3543 MW of additional wind capacity located upstate is included
This scenario was only run for the ldquoSEPB RNA Caserdquo As shown in Table 13 it was found that no LOLE violations would occur No further study was completed for this scenario
wwwnyisocom State Energy Planning Board Study NYISO Input and Reliability Analysis | August 11 2009 | 22
Table 13 30 Renewable Portfolio Standard Scenario LOLE
Zone SEPB RNA Case- 30 RPS
2009 2012 2015 2018 A 00 0000 0000 00 B 00 0000 0001 0001 C 00 0000 0000 00 D 00 0000 0000 00 E 00 0000 0000 0 F 00 0000 0000 00 G 00 0000 0000 0003 H 00 0000 0000 00 I 00 0002 0007 0059 J 00 0002 0007 0061 K 0001 0000 0000 00
NYCA 0001 0003 0008 0068
III Summary A Base Cases
1 The capacity modifications as recommended by SEPB through out the study period for the two base cases would not result in an LOLE violation of once in 10 years provided that the corresponding load forecast is achieved However if the full energy portfolio standard load forecast is not achieved then a violation may occur in the ldquoSEPB 15 x 15 Caserdquo starting in year 2012
B Scenario Cases 1 The capacity modifications provided for the SEPB RNA Case- Upstate
Nuclear scenario would result in an LOLE violation in 2018 if both Roseton Units are retired This violation is eliminated if only one unit is retired No LOLE violation occurs for the SEPB 15 x 15 Case- Upstate Nuclear scenario if the full EEPS is achieved However a violation may occur in 2012 if the full load reduction is not achieved
2 The capacity modifications provided for the SEPB 15 x 15 Case- 30 RPS scenario resulted in no LOLE violations through out the study period
wwwnyisocom State Energy Planning Board Study NYISO Input and Reliability Analysis | August 11 2009 | 23
Exhibit C-1 Base Case Capacity Modifications
wwwnyisocom State Energy Planning Board Study NYISO Input and Reliability Analysis | August 11 2009 | 24
State Energy Planning Board Study Capacity Modifications Entered into MARS
Landfill Gas RNA Case and 15 x 15 Case Generic Capacities per SEPB 2009 2012 2015 2018
Zone A-E 180 530 200 00 Zone F 50 160 60 00 Zone G-I 10 00 00 00 Zone K 10 20 00 00
Existing Prorated Revised Prorated Revised Prorated Revised UNT-MXCP Zone Capacity Additions Total Additions Total Additions Total JAN A 162 44 206 130 335 49 384 JAN B 114 31 145 91 236 34 270 JAN C 291 79 370 233 603 88 690 JAN D 48 13 61 38 99 14 114 JAN E 48 13 61 38 99 14 114
Total Zone A-E 663 180 843 530 1373 200 1573
MAY A 159 41 200 120 319 45 365 MAY B 110 28 138 83 221 31 252 MAY C 339 87 426 255 681 96 777 MAY D 48 12 60 36 96 14 110 MAY E 48 12 60 36 96 14 110
Total Zone A-E 704 180 884 530 1414 200 1614
JAN F 84 50 134 160 294 60 354 MAY F 87 50 137 160 297 60 357
JAN H 00 10 10 MAY H 00 10 10
Total Zone G-I 00
JAN K 18 10 28 20 48 MAY K 18 10 28 20 48 Existing Capacities are per the 2009 RNA MARS Model
Hydro RNA Case and 15 x 15 Case Generic Capacities per SEPB 2009 2012 2015 2018
Zone A-E 250 750 590 00 Zone F 50 130 140 00
Existing Prorated Revised Prorated Revised Prorated Revised UNT-MXCP Zone Capacity Additions Total Additions Total Additions Total JAN A 02 00 02 00 02 00 02 JAN B 561 19 580 58 638 45 683 JAN C 1150 39 1189 118 1308 93 1401 JAN D 751 26 777 77 854 61 915 JAN E 4834 166 5000 497 5496 391 5887
Total Zone A-E 7298 250 7548 750 8298 590 8888
MAY A 32 01 33 04 38 03 41 MAY B 321 15 336 44 380 35 415 MAY C 720 33 753 99 852 78 930 MAY D 710 33 743 98 840 77 917 MAY E 3669 168 3837 505 4342 397 4739
Total Zone A-E 5452 250 5702 750 6452 590 7042
JAN F 4492 50 4542 130 4672 140 4812 MAY F 3922 50 3972 130 4102 140 4242 Existing Capacities are per the 2009 RNA MARS Model
wwwnyisocom | State Energy Planning Board Study NYISO Input and Reliability Analysis |August 11 2009 | 26
Wind
RNA Case Generic Capacities per SEPB 2009 2012 2015 2018 Zone A-E 13680 13890 5650 530 Zone F 340 1000 340
Existing Prorated Revised Prorated Revised Prorated Revised Prorated Revised Zone Capacity Additions Total Additions Total Additions Total Additions Total
JAN A 1214 1366 2580 1387 3968 564 4532 53 4585 JAN C 2122 2389 4511 2426 6937 987 7924 93 8016 JAN D 5133 5778 10910 5867 16777 2386 19163 224 19387 JAN E 3684 4147 7830 4210 12041 1713 13753 161 13914
Total Zone A-E 12152 13680 25832 13890 39722 5650 45372 530 45902
JAN F 00 340 340 1000 1340 340 1680
15 x 15 Case Generic Capacities per SEPB 2009 2012 2015 2018 Zone A-E 13680 9280 10270 530 Zone F 340 1000 340
Existing Prorated Revised Prorated Revised Prorated Revised Prorated Revised Zone Capacity Additions Total Additions Total Additions Total Additions Total
JAN A 1214 1366 2580 927 3507 1026 4533 53 4586 JAN C 2122 2389 4511 1621 6132 1794 7926 93 8018 JAN D 5133 5778 10910 3919 14830 4338 19167 224 19391 JAN E 3684 4147 7830 2813 10643 3113 13756 161 13917
Total Zone A-E 12152 13680 25832 9280 35112 10270 45382 530 45912
JAN F 00 340 340 1000 1340 340 1680 Existing Capacities are per the 2009 RNA MARS Model
wwwnyisocom | State Energy Planning Board Study NYISO Input and Reliability Analysis |August 11 2009 | 27
Exhibit C-2 Scenario 1 Capacity Modifications
wwwnyisocom | State Energy Planning Board Study NYISO Input and Reliability Analysis |August 11 2009 | 28
Nuclear RNA and 15 x 15 Case Generic Capacities per SEPB Upstate Firm Nuclear Scenario 2009 2012 2015 2018
Zone A-E 16000
Existing Prorated Revised Prorated Revised Prorated Revised Prorated Revised Zone Capacity Additions Total Additions Total Additions Total Additions Total
JAN A 00 JAN B- Ginna 5834 2669 8503 JAN C- Nine Mile Pt 1 6928 3170 10098 JAN C- Nine Mile Pt 2 13180 6030 19210 JAN C- Fitzpatrick 9031 4132 13163 JAN D 00 JAN E 00
Total Zone A-E 34973 00 00 00 00 00 00 16000 50973
Existing Prorated Revised Prorated Revised Prorated Revised Prorated Revised Zone Capacity Additions Total Additions Total Additions Total Additions Total
MAY A 00 MAY B- Ginna 5801 2670 8471 MAY C- Nine Mile Pt 1 6900 3175 10075 MAY C- Nine Mile Pt 2 13047 6004 19051 MAY C- Fitzpatrick 9019 4151 13170 MAY D 00 MAY E 00
Total Zone A-E 34767 00 00 00 00 00 00 16000 50767 Existing capacity values include Uprates identified in Base Cases
Wind RNA Case Generic Capacities pe r SEPB Upstate Nuclear Scenario 2009 2012 2015 2018
Zone A-E 13680 13660 5880 530 Zone F 340 1000 340
Existing Prorated Revised Prorated Revised Prorated Revised Prorated Revised Zone Capacity Additions Total Additions Total Additions Total Additions Total
JAN A 1214 1366 2580 1364 3945 587 4532 53 4585 JAN C 2122 2389 4511 2386 6897 1027 7924 93 8016 JAN D 5133 5778 10910 5769 16680 2483 19163 224 19387 JAN E 3684 4147 7830 4141 11971 1782 13753 161 13914
Total Zone A-E 12152 13680 25832 13660 39492 5880 45372 530 45902
JAN F 00 340 340 1000 1340 340 1680
Existing Capacities are p er the 2009 RNA MARS Model
wwwnyisocom | State Energy Planning Board Study NYISO Input and Reliability Analysis |August 11 2009 | 30
Exhibit C-3 Scenario 2 Capacity Modifications
wwwnyisocom | State Energy Planning Board Study NYISO Input and Reliability Analysis |August 11 2009 | 31
State Energy Planning Board Study Generic Capacity Modifications Entered into MARS
30 RPS Scenario
Landfill Gas RNA Case Generic Capacities per SEPB 30 RPS 2009 2012 2015 2018
Zone A-E 190 530 190 00 Zone F 50 160 60 00 Zone G-I 10 00 00 00 Zone K 10 20 00 00
Existing Prorated Revised Prorated Revised Prorated Revised UNT-MXCP Zone Capacity Additions Total Additions Total Additions Total JAN A 162 46 208 130 338 46 384 JAN B 114 33 147 91 238 33 270 JAN C 291 83 374 233 607 83 690 JAN D 48 14 62 38 100 14 114 JAN E 48 14 62 38 100 14 114
Total Zone A-E 663 190 853 530 1383 190 1573
MAY A 159 43 202 120 322 43 365 MAY B 110 30 140 83 223 30 252 MAY C 339 91 430 255 686 91 777 MAY D 48 13 61 36 97 13 110 MAY E 48 13 61 36 97 13 110
Total Zone A-E 704 190 894 530 1424 190 1614
JAN F 84 50 134 160 294 60 354 MAY F 87 50 137 160 297 60 357
JAN H 00 10 10 MAY H 00 10 10
Total Zone G-I 00
JAN K 18 10 28 20 48 MAY K 18 10 28 20 48 Existing Capacities are per the 2009 RNA MARS Model
Hydro RNA Case Case Generic Capacities per SEPB 30 RPS 2009 2012 2015 2018
Zone A-E 320 750 520 00 Zone F 70 130 120 00
Existing Prorated Revised Prorated Revised Prorated Revised UNT-MXCP Zone Capacity Additions Total Additions Total Additions Total JAN A 02 00 02 00 02 00 02 JAN B 561 25 586 58 643 40 683 JAN C 1150 50 1200 118 1319 82 1401 JAN D 751 33 784 77 861 54 915 JAN E 4834 212 5046 497 5543 344 5887
Total Zone A-E 7298 320 7618 750 8368 520 8888
MAY A 32 02 34 04 38 03 41 MAY B 321 19 340 44 384 31 415 MAY C 720 42 762 99 861 69 930 MAY D 710 42 752 98 849 68 917 MAY E 3669 215 3884 505 4389 350 4739
Total Zone A-E 5452 320 5772 750 6522 520 7042
JAN F 4492 70 4562 130 4692 120 4812 MAY F 3922 70 3992 130 4122 120 4242 Existing Capacities are per the 2009 RNA MARS Model
wwwnyisocom | State Energy Planning Board Study NYISO Input and Reliability Analysis |August 11 2009 | 33

Model Input Proposed Info Source(s)
State of Consensus Input Status
frac34 Coal price forecasts from ICF
Renewable Portfolio Standards
frac34 Current RPSs in Northeast and Mid-Atlantic are met
frac34 Wind gets capacity payment for 20 of nameplate
frac34 Limit wind to 10 of regional capacity
frac34 Consensus
frac34 Consensus
frac34 Loaded in IPM
frac34 Loaded in IPM
RGGI frac34 10-state RGGI program in place
frac34 Consensus frac34 Loaded in IPM
Clean Air Interstate Rule
frac34 Guidance from DEC = use old CAIR policy assumptions
frac34 Consensus frac34 Loaded in IPM
Mercury frac34 NY unit-level Hg MACT program
frac34 Other state-specific Hg rules
frac34 Federal Hg MACT in model run year 2015
frac34 Consensus frac34 Loaded in IPM
frac34 Loaded in IPM
frac34 Loaded in IPM
Model run years frac34 2009 (2008-10) 2012 (2011-13) 2015 (2014-16) 2018 (2017-19) 2021 (2020-22) 2024 (2023-25)
frac34 Consensus frac34 To ICF 81908
Proxy for reliability related run times for key generators
frac34 NYISO provided typical weather-normalized data
frac34 Consensus frac34 To ICF 9308
wwwnyisocom State Energy Planning Board Study NYISO Input and Reliability Analysis | August 11 2009 | 10
Appendix B Transmission Topology
wwwnyisocom | State Energy Planning Board Study NYISO Input and Reliability Analysis |August 11 2009 | 11
NYSERDA IPMreg Reference Case Assumptions Northeast Regional Transmission Capabilities
Prepared for NYSERDA for State Energy Plan
Prepared by ICF International
September 8 2008
Transmission ndash NY (EnergyCapacity in GW)
Canada - QUE Canada - ONT
5
(PJM) JPL-E
(PJM)
30
20
16
3235 (2011-M29) 35 0
27
20
32
PSEG-N 24
06
132
NEP - WMA
05
08
NEP ndash CT 08
NEP - VT
0
175
12
35
35
053 0
10
066
066
Zones A-E
Zone F
Long Island
Zones G-I
NYC
16
15
NOTE New York also
12 26
2175
Joint Capacity Constraints
Transmission Lines
faces a joint capacity constraint from any non-NY region of 2775 GW
48
1325
West Central (PJM)
08 1512
05
10
wwwnyisocom State Energy Planning Board Study NYISO Input and Reliability Analysis | August 11 2009 | 12
Transmission ndash NEPOOL (EnergyCapacity in GW)
CAN- New Brunswick
203814
203684
2222
ME
NHVT
West MA Central amp NE MA
CT
RI
Boston
2727
27900
2121 21708
1414
2727
279
2727
145329
145725
2222
27273333
Southeast MA
145145
21708
2121
77
997997
55
22515
CAN- Quebec
55NY- ZONE F
0225
88
88
NY- LILCO
NY- GHI
530
ME-BHE
105105
1515
ME-S
115115
21491
NY- A-E 00
515
350
175175
251042
77
105105
2727
1414
2222 145145
115115
1512
Note Red numbers indicate post 2015 values
Transmission ndash PJM (EnergyCapacity in GW) NYISO-NYC
355 3535
38823
4817
3636
51
178
9
833
3512
00
33
5
64733
5
83
13
2920
5
1476
43305710
31
54
2626
2828
2828
1575155
26
18
181
8
452
452
2114
1919
2077
15815
00
AEP
South
West
West Central
JPL-W
PSEG-S
PECODOM DPL
JPL-E
AE
45
45
345345
2920
PSEG-C
5
6
00
5710
00
33
00
77
45
00
PSEG-N4743
5
1010 NYISO-Downstate 0055
NYISO-LILCO
666
660
NYISO-Upstate 132132
66 55
105
2424
37
14 2623
225
22
37
3629
3223
00
6908
6655
4743
00
4628
4628
First Energy
-- unlimited capability for energy
wwwnyisocom State Energy Planning Board Study NYISO Input and Reliability Analysis | August 11 2009 | 13
Appendix C NYISO Reliability Assessment
wwwnyisocom State Energy Planning Board Study NYISO Input and Reliability Analysis | August 11 2009 | 14
I MARS Base Case Models A Model Assumptions
1 Study Period The Reliability Study looks out over a 10 year period from 2009 to 2018 The years studied include 2009 2012 2015 and 2018
2 Base Model A base model was created by modifying the 2009 Installed Reserve Margin (IRM) model Modifications to this one year IRM model are necessary in order to include known changes that will take place over the planning period as determined in the 2009 Reliability Needs Assessment (RNA) Base Case This base model was used as the starting point for creating the two study cases being evaluated The following modifications were made based to the 2009 Reliability Needs Assessment (RNA) Base Case
i The following generation additions and uprates which were included in the Base Case of the 2009 RNA were added
a Empire Generating (Besicorp) 660 MW b Blenheim-Gilboa Unit 1 30 MW c Blenheim-Gilboa Unit 2 30 MW d Nine Mile Point Unit 2 168 MW
ii The following generator retirements which were included in the Base Case of the 2009 RNA were included
a Poletti 8907 MW
3 The transfer limits used in the Base Case of the 2009 RNA were included
4 All external area loads and capacity data were held constant through out the study period
B SEPB RNA Case
1 Load Forecast The ldquoSEPB RNA Caserdquo utilizes the load forecast used in the 2009 RNA Base Case This load forecast is based on achieving 30 of the Energy Efficiency Portfolio Standard (EEPS) as shown in Table 1
wwwnyisocom State Energy Planning Board Study NYISO Input and Reliability Analysis | August 11 2009 | 15
Table 1 2009 RNA Base Case Load Forecast (MW) (Per 2009 RNA Report Table 3-1) 2009 2012 2015 2018
2009 RNA Base Case
34059 34586 35029 35658
2 Capacity Modifications Exhibit C-1 includes the capacity modifications provided by the SEPB Working Group for inclusion in the reliability analysis The generic capacity additions shown as being located in multiple zones were entered into MARS by prorating the values across the zones based on the existing generator capacity type located in those zones The amount of generic capacity included in each zone is also shown in Exhibit C-1
Table 2 below summarizes the total capacity changes by generator type as compared to the base model for the ldquoSEPB RNA Caserdquo
Table 2 Capacity Assumptions for the SEPB RNA Case Generator Type SEPB RNA Case
Capacity Change as Compared to the Base Model (MW)
Combined Cycle 1081 Coal -55
Combustion Turbine -129 Hydro 191
Landfill Gas 122 Nuclear 106 OilGas -1115 Wind 3603
Overall Total 3804
C SEBP 15 x 15 Case Load Forecast The ldquoSEPB 15 x 15 Caserdquo utilizes the load forecast used in Scenario 2 of the 2009 RNA This load forecast is based on achieving 100 of the EEPS as shown in Table 3
Table 3 2009 RNA Scenario 2 Load Forecast (MW) (Per 2009 RNA Report Table 3-1) 2009 2012 2015 2018
2009 RNA Scenario 2
33704 32722 31227 32209
1 Capacity Modifications Exhibit C-1 includes the capacity modifications provided by
wwwnyisocom State Energy Planning Board Study NYISO Input and Reliability Analysis | August 11 2009 | 16
SEPB Working Group for inclusion in the reliability analysis The generic capacity additions shown as being located in multiple zones were entered into MARS by prorating the values across the zones based on the existing generator capacity type located in those zones The amount of generic capacity included in each zone is also shown in Exhibit C-1
Table 4 below summarizes the total capacity changes by generator type as compared to the Base Model for the ldquoSEPB 15 x 15 Caserdquo
Table 4 Capacity Assumptions for SEPB 15 x 15 Case Generator Type SEPB 15 x 15 Case
Capacity Change as Compared to the Base Model (MW)
Combined Cycle -76 Coal -55
Combustion Turbine -129 Hydro 191
Landfill Gas 122 Nuclear 106 OilGas -1573 Wind 3603
Overall Total 2189
II MARS Results A Base Model
For comparison purposes Table 5 below provides the LOLE results for the Base Model for each NY zone and for the overall NY Control Area (NYCA) for each study year This is based on the 2009 RNA Base Case load forecast (achieving 30 EEPS) and the capacity values
wwwnyisocom State Energy Planning Board Study NYISO Input and Reliability Analysis | August 11 2009 | 17
Table 5 Base Model LOLE
Zone Base Model As Found w 30 EEPS 2009 2012 2015 2018
A 00 00 00 00 B 00 00 00 0003 C 00 00 00 00 D 00 00 00 00 E 00 00 00 0001 F 00 00 00 00 G 00 00 00 0001 H 00 0001 00 0001 I 0001 0008 002 0079 J 0001 0009 0022 0091 K 0001 00 00 0001
NYCA 0001 0010 0024 0096
B SEPB RNA Case Table 6 below provides the LOLE results for the base ldquoSEPB RNA Caserdquo The resultant LOLE criterion of 01 per year is not violated for any area for any study year Therefore the SEPB assumed capacity modifications will not negatively impact the Statersquos reliability provided that 30 of the EEPS is achieved In fact the SEPB capacity modification assumptions improves the LOLE for Zones I J and NYCA
Table 6 SEPB RNA Case LOLE
Zone SEPB RNA Case
2009 2012 2015 2018 A 00 00 00 00 B 00 00 00 0004 C 00 00 00 00 D 00 00 00 00 E 00 00 00 0002 F 00 00 00 00 G 00 00 00 0001 H 00 00 00 00 I 00 0002 0007 0028 J 00 0003 0007 003 K 0001 00 00 00
NYCA 0001 0003 0008 0032
C SEPB 15 x 15 Case Table 7 below provides the LOLE results for the base ldquoSEPB 15 x 15 Caserdquo Even though there is less capacity assumed for this case the lower load forecast is sufficient enough such that the LOLE drops as compared to the base model or the base ldquoSEPB RNA Caserdquo
However if the 15 x 15 load forecast is not achieved reliability violations may occur as early as 2012 for this given capacity condition Table 8
wwwnyisocom State Energy Planning Board Study NYISO Input and Reliability Analysis | August 11 2009 | 18
shows the results based on using the capacity assumptions for the ldquoSEPB 15 x 15 Caserdquo but only achieving the 30 of the EEPS as assumed it the ldquoSEPB RNA Caserdquo This shows that the LOLE would exceed 01 by 2012 and would exceed 06 by 2018 The primary differences impacting these LOLE results is that the ldquoSEPB 15 x 15 Caserdquo retires nearly 1000MW more and installs nearly 500MW less in fossil fuel plants than the ldquoSEPB RNA Caserdquo This will result in a much lower reliable system if the loads arenrsquot sufficiently reduced to offset this lack of generation capacity
Table 7 SEPB 15 x 15 Case LOLE
Zone SEPB 15 x 15 Case
2009 2012 2015 2018 A 00 00 00 00 B 00 00 00 00 C 00 00 00 00 D 00 00 00 00 E 00 00 00 00 F 00 00 00 00 G 00 0001 00 00 H 00 00 00 00 I 00 0006 00 0001 J 00 0005 00 0001 K 00 00 00 00
NYCA 0001 0007 00 0001
Table 8 30 EEPS and SEPB 15 x15 LOLE
Zone
w 30 EEPS Load Forecast and SEPB 15 x 15 Capacity
2009 2012 2015 2018 A 0 0 0 0 B 0 0006 001 0026 C 0 0 0 0 D 0 0 0 0 E 0 0001 0003 0009 F 0 0 0 0 G 0 0033 007 0203 H 0 0001 0001 0001 I 0 0096 0213 0589 J 0 0081 0181 0523 K 0001 0001 0001 0003
NYCA 0001 0102 023 0627
D Scenario 1- Upstate Nuclear Addition A scenario of adding 1600 MW of generic nuclear power upstate in 2018 was evaluated This capacity addition was modeled by prorating the increase among the existing upstate nuclear facilities and adding the
wwwnyisocom State Energy Planning Board Study NYISO Input and Reliability Analysis | August 11 2009 | 19
capacity increase to the existing units per Table 9
Table 9 Upstate Nuclear Capacity Addition Nuclear Unit Existing Summer
Capacity Capacity Addition New Summer
Capacity Ginna 580 267 847
Nine Mile Pt Unit 1 690 318 1008 Nine Mile Pt Unit 2 1305 600 1905
Fitzpatrick 902 415 1317 Total 3477 1600 5077
1 SEPB RNA Case- Upstate Nuclear Scenario Exhibit C-2 includes the capacity modifications provided by SEPB Working Group for inclusion in the reliability analysis In addition to the 1600 MW upstate nuclear addition this scenario also includes the following changes as compared to the base ldquoSEPB RNA Caserdquo
i Retiring of SA Carlson 27MW in 2012 ii Retiring of Roseton 1 and 2 1144MW in 2018 iii Shifted 20MW of Wind Addition from 2012 to 2015
Table 10 shows the LOLE results for the SEPB RNA Case- Upstate Scenario and indicates that a NYCA LOLE violation of 0276 would occur in 2018 An LOLE violation in Zones I and J would also occur This indicates that the addition of the nuclear capacity upstate is not sufficient to offset the retirement of the Roseton 1 and 2 units located downstate due to transmission limitations
Table 10 SEPB RNA Case ndash Upstate Nuclear Scenario LOLE
Zone
SEPB RNA Case- Upstate Nuclear Scenario
2009 2012 2015 2018 A 00 0000 0000 00 B 00 0000 0000 0002 C 00 0000 0000 00 D 00 0000 0000 00 E 00 0000 0000 0001 F 00 0000 0000 00 G 00 0000 0000 0084 H 00 0000 0000 00 I 00 0002 0007 0255 J 00 0003 0007 0223 K 0001 0000 0000 00
NYCA 0001 0003 0008 0276
wwwnyisocom State Energy Planning Board Study NYISO Input and Reliability Analysis | August 11 2009 | 20
Two additional runs were completed to determine the impact of retiring the Roseton units If both Roseton units are kept in-service the NYCA LOLE reduces to 002 If only one unit is retired the resulting NYCA LOLE would be 071
2 SEPB 15 x 15 Case- Upstate Nuclear Scenario Exhibit C-2 includes the capacity modifications provided by SEPB Working Group for inclusion in the reliability analysis In addition to the 1600 MW upstate nuclear addition this scenario also includes the retirement of East River Units 6 and 7 (314MW) in 2015 as compared to the base ldquoSEPB 15 x 15 Caserdquo
Table 11 shows the LOLE results for the SEPB 15 x 15 Case-Upstate Scenario No LOLE violations would occur through out the study period due to the low load forecast
Table 11 SEPB 15 x 15 Case- Upstate Nuclear Scenario LOLE
Zone SEPB 15 x 15 Case- Upstate Nuclear Scenario
2009 2012 2015 2018 A 00 0000 0000 00 B 00 0000 0000 0 C 00 0000 0000 00 D 00 0000 0000 00 E 00 0000 0000 0 F 00 0000 0000 00 G 00 0001 0000 0001 H 00 0000 0000 00 I 00 0006 0000 0003 J 00 0005 0000 0003 K 0001 0000 0000 00
NYCA 0001 0007 0 0004
A second case was run using the load forecast used in the ldquoSEPB RNA Caserdquo which is based on achieving only 30 of EEPS Table 12 includes the results of this case which shows that a NYCA LOLE violation of 0103 would occur in 2012 and increases to 087 in 2018
wwwnyisocom State Energy Planning Board Study NYISO Input and Reliability Analysis | August 11 2009 | 21
Table 12 30 EEPS and SPEB 15 x 15 Case - Upstate Nuclear Scenario LOLE
Zone
SEPB 15 x 15 Case- Upstate Nuclear Scenario w 30 EEPS Load Forecast
2009 2012 2015 2018 A 00 0000 0000 00 B 00 0006 0014 0003 C 00 0000 0000 00 D 00 0000 0000 00 E 00 0001 0004 0001 F 00 0000 0000 00 G 00 0033 0121 0204 H 00 0001 0002 00 I 00 0096 0427 0812 J 00 0080 0385 0763 K 0001 0001 0002 00
NYCA 0001 0103 0461 087
As shown in the base ldquoSEPB 15 x 15 Caserdquo if the full EEPS load forecast is not achieved a resource adequacy violation would occur The increase in the NYCA LOLE from 627 in the base ldquoSPEB 15 x 15 Caserdquo to 087 in this scenario indicates that adding 1600 MW nuclear capacity upstate is not sufficient enough to offset the retirement of the East River units located downstate
E Scenario 2- 30 Renewable Portfolio Standard Exhibit C-3 includes the capacity modifications provided by SEPB Working Group for inclusion in the reliability analysis This scenario is similar to Scenario 1 with the following major differences
i Only Roseton 1 unit is retired ii 3543 MW of additional wind capacity located upstate is included
This scenario was only run for the ldquoSEPB RNA Caserdquo As shown in Table 13 it was found that no LOLE violations would occur No further study was completed for this scenario
wwwnyisocom State Energy Planning Board Study NYISO Input and Reliability Analysis | August 11 2009 | 22
Table 13 30 Renewable Portfolio Standard Scenario LOLE
Zone SEPB RNA Case- 30 RPS
2009 2012 2015 2018 A 00 0000 0000 00 B 00 0000 0001 0001 C 00 0000 0000 00 D 00 0000 0000 00 E 00 0000 0000 0 F 00 0000 0000 00 G 00 0000 0000 0003 H 00 0000 0000 00 I 00 0002 0007 0059 J 00 0002 0007 0061 K 0001 0000 0000 00
NYCA 0001 0003 0008 0068
III Summary A Base Cases
1 The capacity modifications as recommended by SEPB through out the study period for the two base cases would not result in an LOLE violation of once in 10 years provided that the corresponding load forecast is achieved However if the full energy portfolio standard load forecast is not achieved then a violation may occur in the ldquoSEPB 15 x 15 Caserdquo starting in year 2012
B Scenario Cases 1 The capacity modifications provided for the SEPB RNA Case- Upstate
Nuclear scenario would result in an LOLE violation in 2018 if both Roseton Units are retired This violation is eliminated if only one unit is retired No LOLE violation occurs for the SEPB 15 x 15 Case- Upstate Nuclear scenario if the full EEPS is achieved However a violation may occur in 2012 if the full load reduction is not achieved
2 The capacity modifications provided for the SEPB 15 x 15 Case- 30 RPS scenario resulted in no LOLE violations through out the study period
wwwnyisocom State Energy Planning Board Study NYISO Input and Reliability Analysis | August 11 2009 | 23
Exhibit C-1 Base Case Capacity Modifications
wwwnyisocom State Energy Planning Board Study NYISO Input and Reliability Analysis | August 11 2009 | 24
State Energy Planning Board Study Capacity Modifications Entered into MARS
Landfill Gas RNA Case and 15 x 15 Case Generic Capacities per SEPB 2009 2012 2015 2018
Zone A-E 180 530 200 00 Zone F 50 160 60 00 Zone G-I 10 00 00 00 Zone K 10 20 00 00
Existing Prorated Revised Prorated Revised Prorated Revised UNT-MXCP Zone Capacity Additions Total Additions Total Additions Total JAN A 162 44 206 130 335 49 384 JAN B 114 31 145 91 236 34 270 JAN C 291 79 370 233 603 88 690 JAN D 48 13 61 38 99 14 114 JAN E 48 13 61 38 99 14 114
Total Zone A-E 663 180 843 530 1373 200 1573
MAY A 159 41 200 120 319 45 365 MAY B 110 28 138 83 221 31 252 MAY C 339 87 426 255 681 96 777 MAY D 48 12 60 36 96 14 110 MAY E 48 12 60 36 96 14 110
Total Zone A-E 704 180 884 530 1414 200 1614
JAN F 84 50 134 160 294 60 354 MAY F 87 50 137 160 297 60 357
JAN H 00 10 10 MAY H 00 10 10
Total Zone G-I 00
JAN K 18 10 28 20 48 MAY K 18 10 28 20 48 Existing Capacities are per the 2009 RNA MARS Model
Hydro RNA Case and 15 x 15 Case Generic Capacities per SEPB 2009 2012 2015 2018
Zone A-E 250 750 590 00 Zone F 50 130 140 00
Existing Prorated Revised Prorated Revised Prorated Revised UNT-MXCP Zone Capacity Additions Total Additions Total Additions Total JAN A 02 00 02 00 02 00 02 JAN B 561 19 580 58 638 45 683 JAN C 1150 39 1189 118 1308 93 1401 JAN D 751 26 777 77 854 61 915 JAN E 4834 166 5000 497 5496 391 5887
Total Zone A-E 7298 250 7548 750 8298 590 8888
MAY A 32 01 33 04 38 03 41 MAY B 321 15 336 44 380 35 415 MAY C 720 33 753 99 852 78 930 MAY D 710 33 743 98 840 77 917 MAY E 3669 168 3837 505 4342 397 4739
Total Zone A-E 5452 250 5702 750 6452 590 7042
JAN F 4492 50 4542 130 4672 140 4812 MAY F 3922 50 3972 130 4102 140 4242 Existing Capacities are per the 2009 RNA MARS Model
wwwnyisocom | State Energy Planning Board Study NYISO Input and Reliability Analysis |August 11 2009 | 26
Wind
RNA Case Generic Capacities per SEPB 2009 2012 2015 2018 Zone A-E 13680 13890 5650 530 Zone F 340 1000 340
Existing Prorated Revised Prorated Revised Prorated Revised Prorated Revised Zone Capacity Additions Total Additions Total Additions Total Additions Total
JAN A 1214 1366 2580 1387 3968 564 4532 53 4585 JAN C 2122 2389 4511 2426 6937 987 7924 93 8016 JAN D 5133 5778 10910 5867 16777 2386 19163 224 19387 JAN E 3684 4147 7830 4210 12041 1713 13753 161 13914
Total Zone A-E 12152 13680 25832 13890 39722 5650 45372 530 45902
JAN F 00 340 340 1000 1340 340 1680
15 x 15 Case Generic Capacities per SEPB 2009 2012 2015 2018 Zone A-E 13680 9280 10270 530 Zone F 340 1000 340
Existing Prorated Revised Prorated Revised Prorated Revised Prorated Revised Zone Capacity Additions Total Additions Total Additions Total Additions Total
JAN A 1214 1366 2580 927 3507 1026 4533 53 4586 JAN C 2122 2389 4511 1621 6132 1794 7926 93 8018 JAN D 5133 5778 10910 3919 14830 4338 19167 224 19391 JAN E 3684 4147 7830 2813 10643 3113 13756 161 13917
Total Zone A-E 12152 13680 25832 9280 35112 10270 45382 530 45912
JAN F 00 340 340 1000 1340 340 1680 Existing Capacities are per the 2009 RNA MARS Model
wwwnyisocom | State Energy Planning Board Study NYISO Input and Reliability Analysis |August 11 2009 | 27
Exhibit C-2 Scenario 1 Capacity Modifications
wwwnyisocom | State Energy Planning Board Study NYISO Input and Reliability Analysis |August 11 2009 | 28
Nuclear RNA and 15 x 15 Case Generic Capacities per SEPB Upstate Firm Nuclear Scenario 2009 2012 2015 2018
Zone A-E 16000
Existing Prorated Revised Prorated Revised Prorated Revised Prorated Revised Zone Capacity Additions Total Additions Total Additions Total Additions Total
JAN A 00 JAN B- Ginna 5834 2669 8503 JAN C- Nine Mile Pt 1 6928 3170 10098 JAN C- Nine Mile Pt 2 13180 6030 19210 JAN C- Fitzpatrick 9031 4132 13163 JAN D 00 JAN E 00
Total Zone A-E 34973 00 00 00 00 00 00 16000 50973
Existing Prorated Revised Prorated Revised Prorated Revised Prorated Revised Zone Capacity Additions Total Additions Total Additions Total Additions Total
MAY A 00 MAY B- Ginna 5801 2670 8471 MAY C- Nine Mile Pt 1 6900 3175 10075 MAY C- Nine Mile Pt 2 13047 6004 19051 MAY C- Fitzpatrick 9019 4151 13170 MAY D 00 MAY E 00
Total Zone A-E 34767 00 00 00 00 00 00 16000 50767 Existing capacity values include Uprates identified in Base Cases
Wind RNA Case Generic Capacities pe r SEPB Upstate Nuclear Scenario 2009 2012 2015 2018
Zone A-E 13680 13660 5880 530 Zone F 340 1000 340
Existing Prorated Revised Prorated Revised Prorated Revised Prorated Revised Zone Capacity Additions Total Additions Total Additions Total Additions Total
JAN A 1214 1366 2580 1364 3945 587 4532 53 4585 JAN C 2122 2389 4511 2386 6897 1027 7924 93 8016 JAN D 5133 5778 10910 5769 16680 2483 19163 224 19387 JAN E 3684 4147 7830 4141 11971 1782 13753 161 13914
Total Zone A-E 12152 13680 25832 13660 39492 5880 45372 530 45902
JAN F 00 340 340 1000 1340 340 1680
Existing Capacities are p er the 2009 RNA MARS Model
wwwnyisocom | State Energy Planning Board Study NYISO Input and Reliability Analysis |August 11 2009 | 30
Exhibit C-3 Scenario 2 Capacity Modifications
wwwnyisocom | State Energy Planning Board Study NYISO Input and Reliability Analysis |August 11 2009 | 31
State Energy Planning Board Study Generic Capacity Modifications Entered into MARS
30 RPS Scenario
Landfill Gas RNA Case Generic Capacities per SEPB 30 RPS 2009 2012 2015 2018
Zone A-E 190 530 190 00 Zone F 50 160 60 00 Zone G-I 10 00 00 00 Zone K 10 20 00 00
Existing Prorated Revised Prorated Revised Prorated Revised UNT-MXCP Zone Capacity Additions Total Additions Total Additions Total JAN A 162 46 208 130 338 46 384 JAN B 114 33 147 91 238 33 270 JAN C 291 83 374 233 607 83 690 JAN D 48 14 62 38 100 14 114 JAN E 48 14 62 38 100 14 114
Total Zone A-E 663 190 853 530 1383 190 1573
MAY A 159 43 202 120 322 43 365 MAY B 110 30 140 83 223 30 252 MAY C 339 91 430 255 686 91 777 MAY D 48 13 61 36 97 13 110 MAY E 48 13 61 36 97 13 110
Total Zone A-E 704 190 894 530 1424 190 1614
JAN F 84 50 134 160 294 60 354 MAY F 87 50 137 160 297 60 357
JAN H 00 10 10 MAY H 00 10 10
Total Zone G-I 00
JAN K 18 10 28 20 48 MAY K 18 10 28 20 48 Existing Capacities are per the 2009 RNA MARS Model
Hydro RNA Case Case Generic Capacities per SEPB 30 RPS 2009 2012 2015 2018
Zone A-E 320 750 520 00 Zone F 70 130 120 00
Existing Prorated Revised Prorated Revised Prorated Revised UNT-MXCP Zone Capacity Additions Total Additions Total Additions Total JAN A 02 00 02 00 02 00 02 JAN B 561 25 586 58 643 40 683 JAN C 1150 50 1200 118 1319 82 1401 JAN D 751 33 784 77 861 54 915 JAN E 4834 212 5046 497 5543 344 5887
Total Zone A-E 7298 320 7618 750 8368 520 8888
MAY A 32 02 34 04 38 03 41 MAY B 321 19 340 44 384 31 415 MAY C 720 42 762 99 861 69 930 MAY D 710 42 752 98 849 68 917 MAY E 3669 215 3884 505 4389 350 4739
Total Zone A-E 5452 320 5772 750 6522 520 7042
JAN F 4492 70 4562 130 4692 120 4812 MAY F 3922 70 3992 130 4122 120 4242 Existing Capacities are per the 2009 RNA MARS Model
wwwnyisocom | State Energy Planning Board Study NYISO Input and Reliability Analysis |August 11 2009 | 33
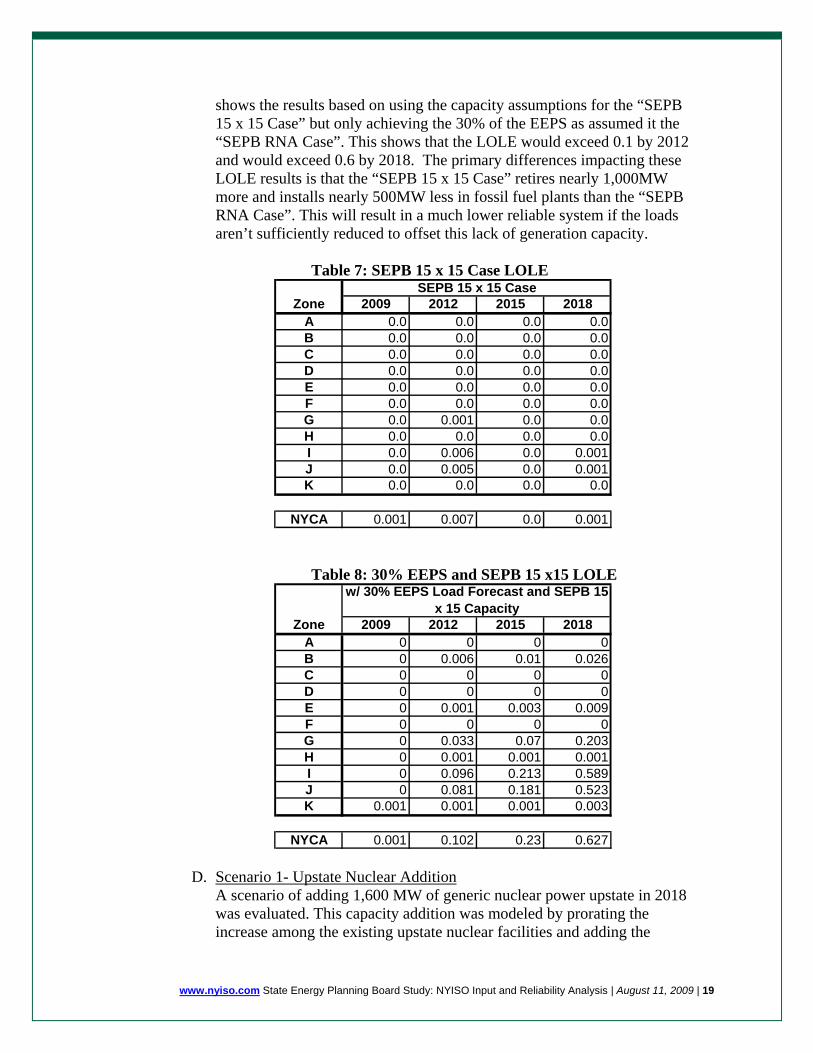
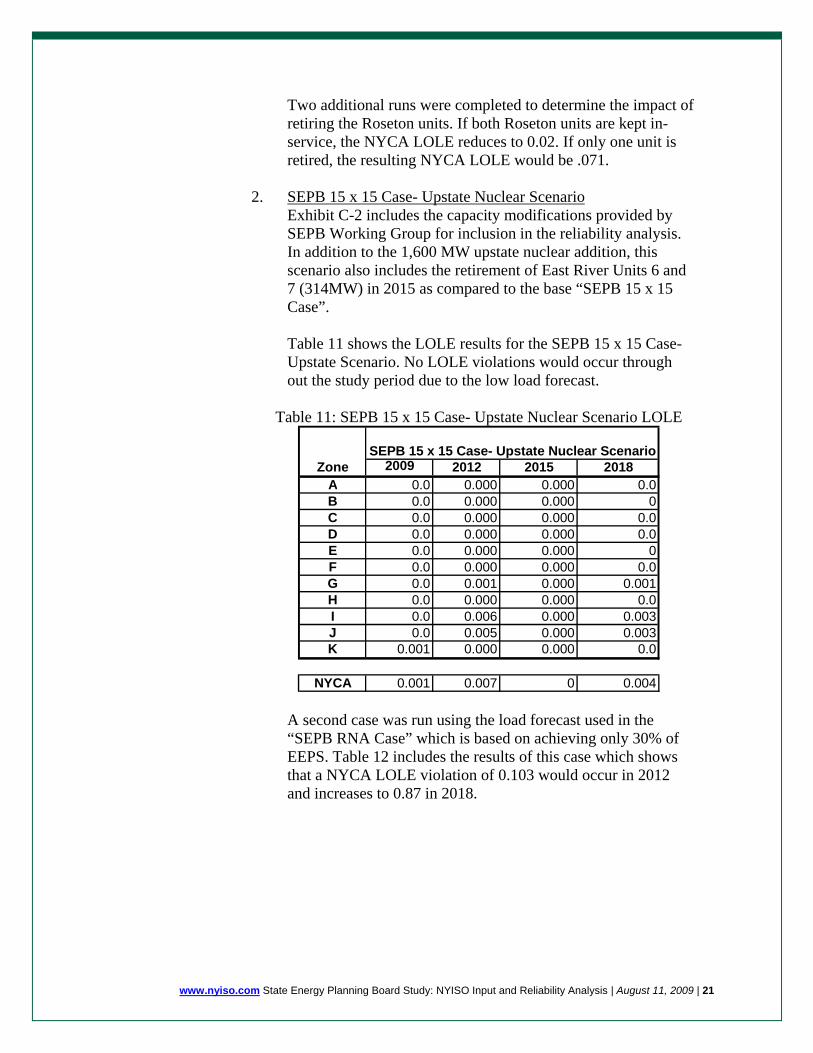