intravascular ultrasound: eight insights for the clinical ...follow-up ivus of originally imaged...
TRANSCRIPT

1
Intravascular Ultrasound:Eight Insights for the Clinical Lipidologist
Intravascular Ultrasound:Eight Insights for the Clinical Lipidologist
Steven E. Nissen MD MACCSteven E. Nissen MD MACC
Disclosure
Consulting: Many companies
Clinical Trials: Amgen, AstraZeneca, Eli Lilly, Takeda, Novartis, The Medicine Company, Cerenis, Esperion, Novo Nordisk and Pfizer.
Companies are directed to pay any honoraria directly to charity. No personal reimbursement is accepted for directing or participating in clinical trials.
Insight 1:Coronary Disease
is Not a Plumbing Problem
Insight 1:Coronary Disease
is Not a Plumbing Problem

2
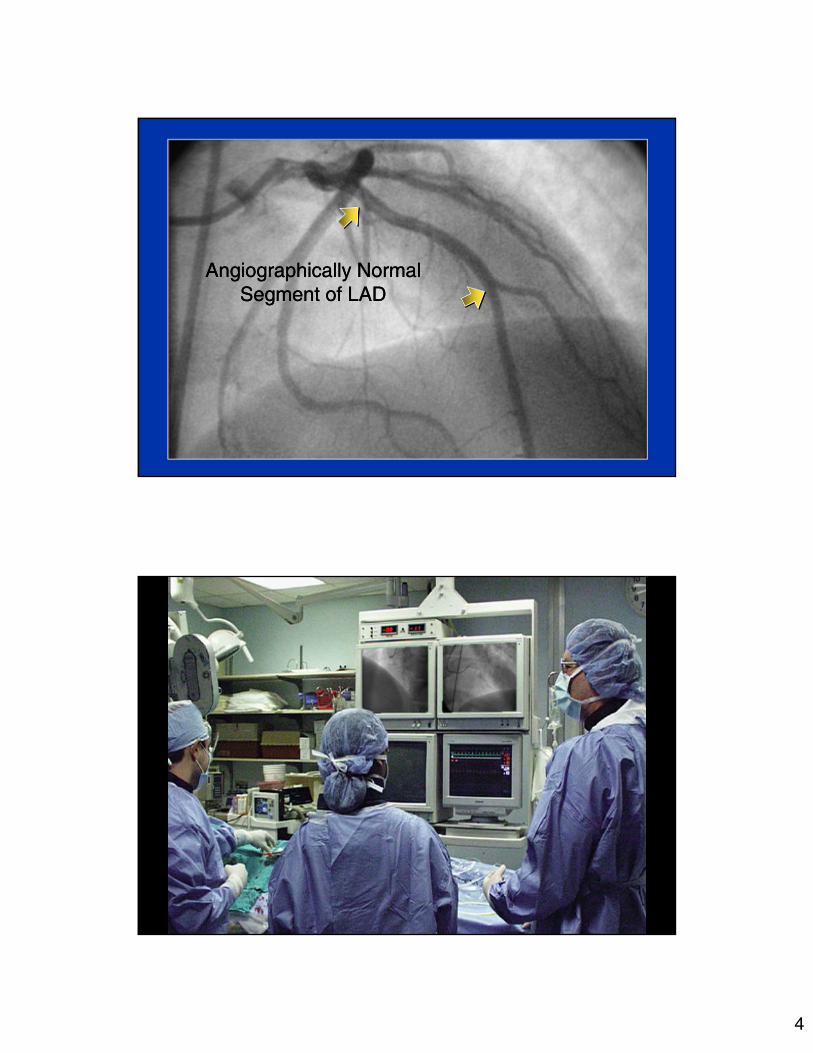
Single Vessel Left Anterior Descending DiseaseSingle Vessel Left Anterior Descending Disease

3
Intravascular Ultrasound Coronary ImagingIntravascular Ultrasound Coronary ImagingRotating Transducer Coronary Atheroma
Glagov Remodeling PhenomenonGlagov Remodeling PhenomenonEarly Atherosclerosis Advanced Disease
3.5 mm 3.5 mm
4
Angiographically NormalSegment of LAD
Angiographically NormalSegment of LAD

5
Low Grade Stenoses Cause Most InfarctionsLow Grade Stenoses Cause Most Infarctions
CAD: The Diagnosis Often Comes Too LateCAD: The Diagnosis Often Comes Too Late
6
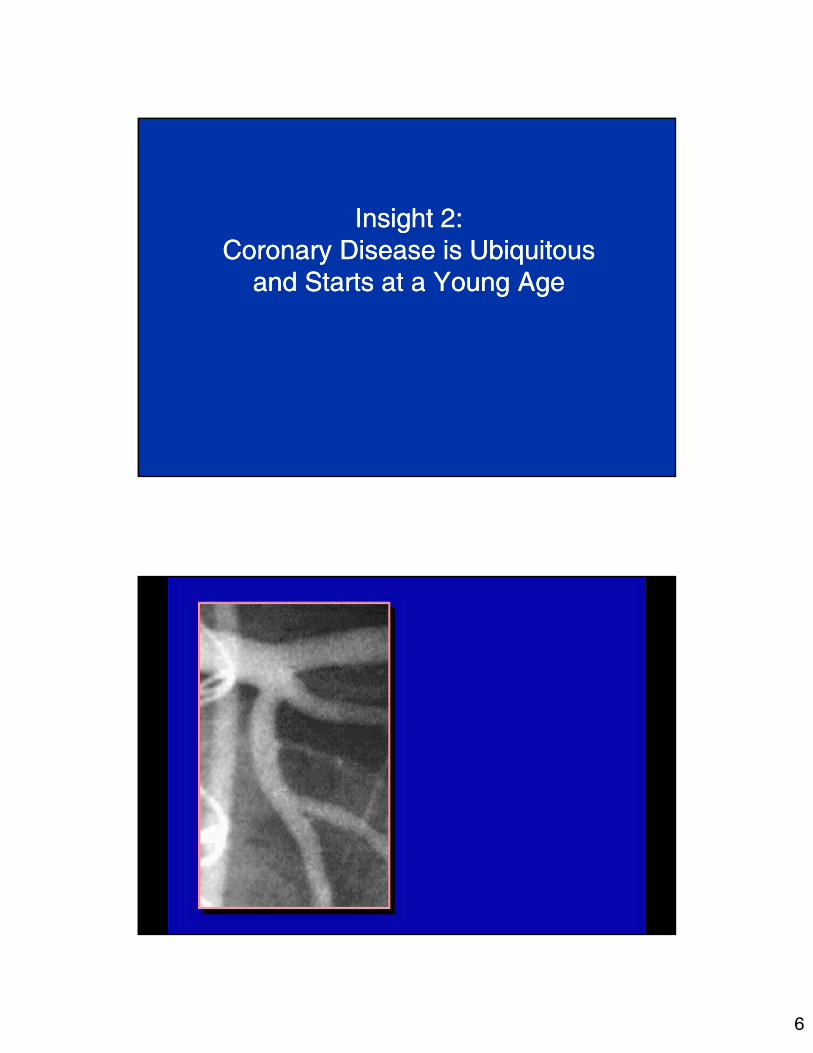
Insight 2:Coronary Disease is Ubiquitous
and Starts at a Young Age
Insight 2:Coronary Disease is Ubiquitous
and Starts at a Young Age
7
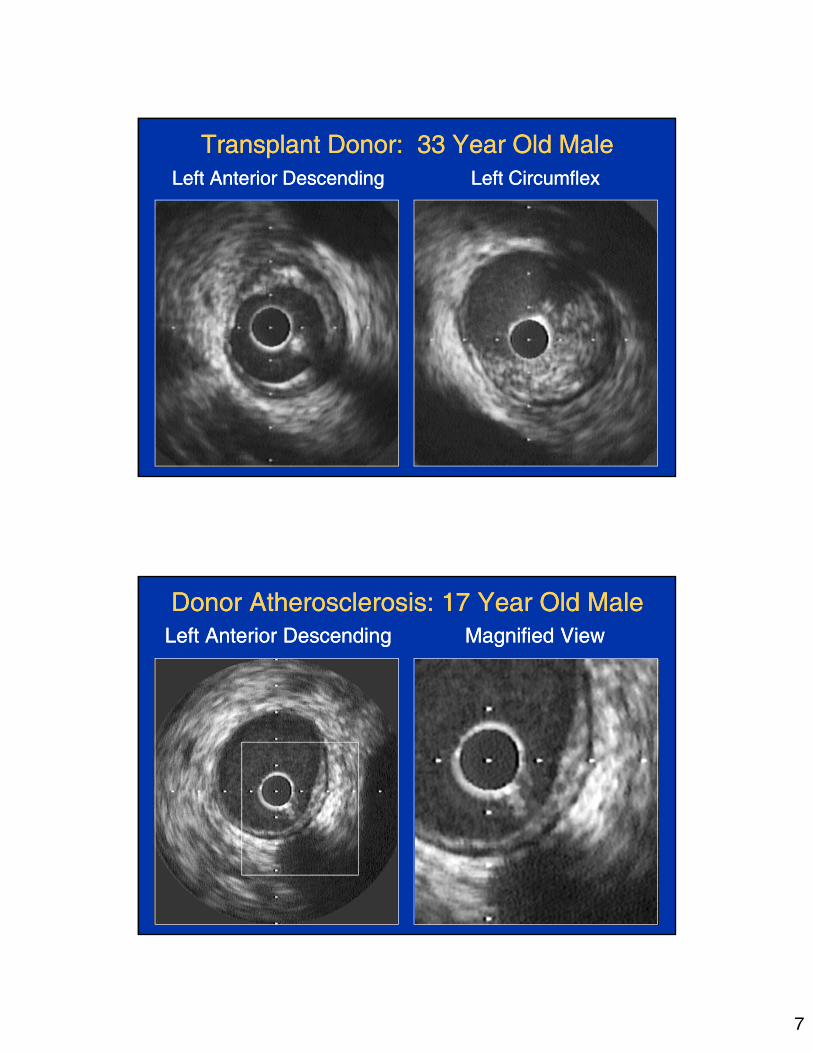
Transplant Donor: 33 Year Old MaleTransplant Donor: 33 Year Old MaleLeft Anterior DescendingLeft Anterior Descending Left Circumflex Left Circumflex
Donor Atherosclerosis: 17 Year Old MaleDonor Atherosclerosis: 17 Year Old MaleLeft Anterior DescendingLeft Anterior Descending Magnified View Magnified View
8
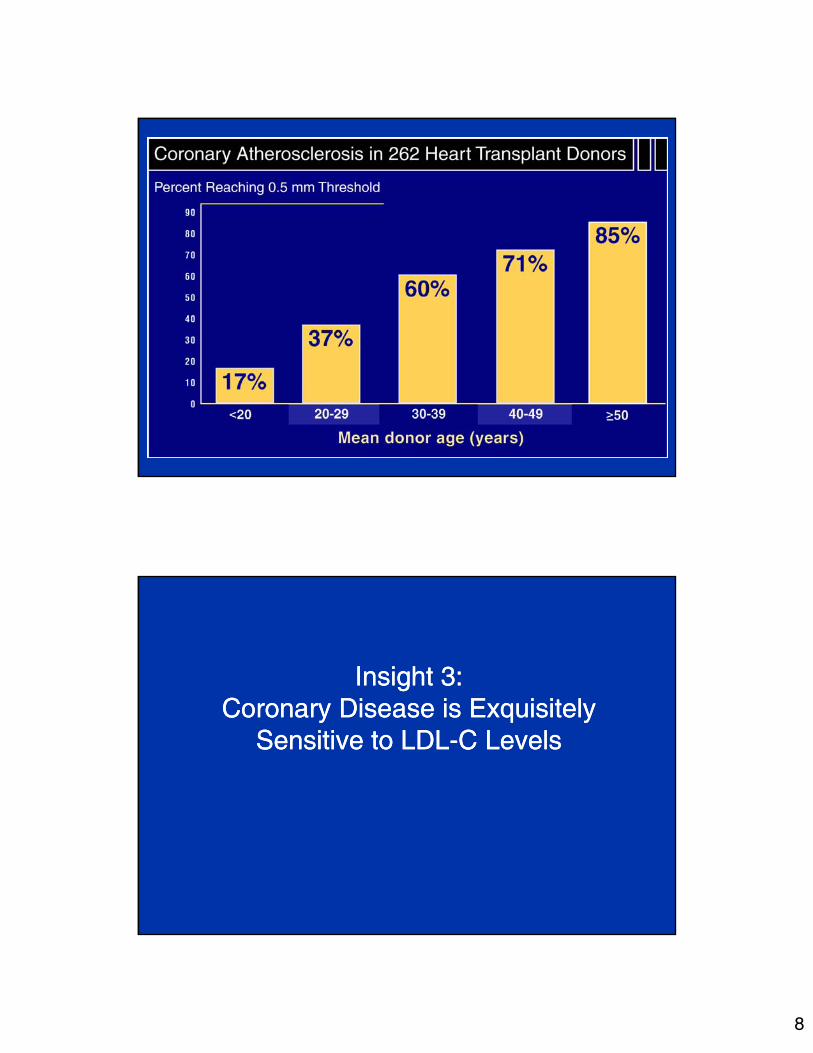
Tuzcu et al,, in press.
Insight 3:Coronary Disease is Exquisitely
Sensitive to LDL-C Levels
Insight 3:Coronary Disease is Exquisitely
Sensitive to LDL-C Levels
9
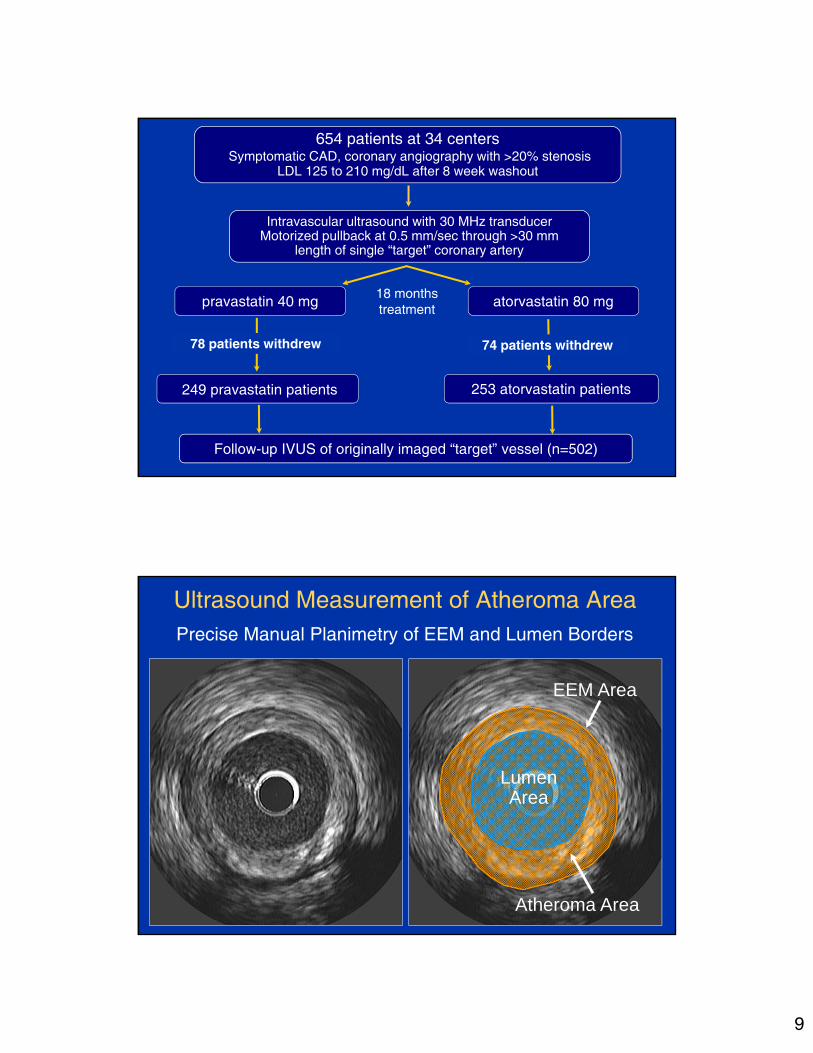
654 patients at 34 centersSymptomatic CAD, coronary angiography with >20% stenosis
LDL 125 to 210 mg/dL after 8 week washout
pravastatin 40 mg atorvastatin 80 mg18 monthstreatment
249 pravastatin patients 253 atorvastatin patients
74 patients withdrew78 patients withdrew
Follow-up IVUS of originally imaged “target” vessel (n=502)
Intravascular ultrasound with 30 MHz transducerMotorized pullback at 0.5 mm/sec through >30 mm
length of single “target” coronary artery
LumenArea
EEM Area
Atheroma Area
Ultrasound Measurement of Atheroma AreaPrecise Manual Planimetry of EEM and Lumen Borders
10
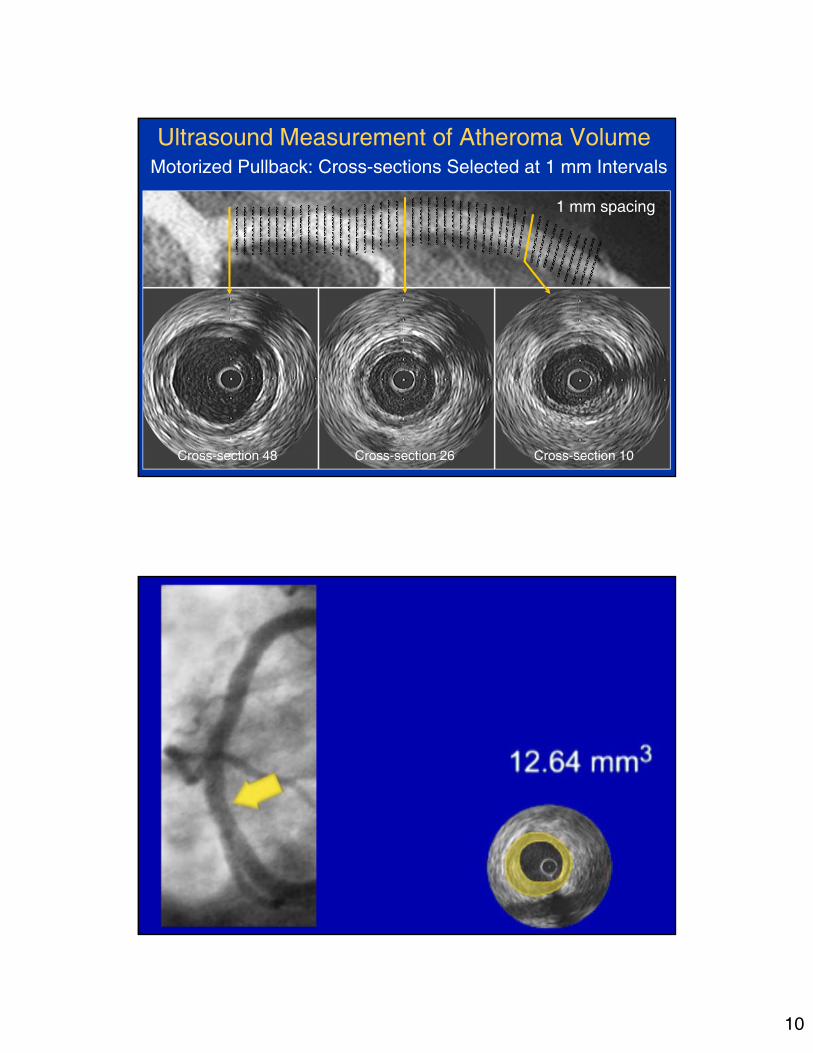
1 mm spacing
Cross-section 10Cross-section 26Cross-section 48
Ultrasound Measurement of Atheroma VolumeMotorized Pullback: Cross-sections Selected at 1 mm Intervals

11
Final Lipid Values and Percent Change Final Lipid Values and Percent Change
* ANOVA
Primary Endpoint
Percent Change in Atheroma VolumePrimary Endpoint
Percent Change in Atheroma Volume
PercentChange
InAtheromaVolume
p = 0.02†
Progression (p=0.001*)
No change (p=0.98*)
Pravastatin Atorvastatin *Wilcoxon signed rank test †ANCOVA of rank transformed results

12
Insight 4:Coronary Disease
is an Inflammatory Disorder
Insight 4:Coronary Disease
is an Inflammatory Disorder
-0.5
0
0.5
1
1.5
2
2.5
3
3.5
-120 -100 -80 -60 -40 -20 0 20
Change in LDL-C (mg/dL)
Cha
nge:
Per
cent
Ath
ero
ma
volu
me
(%)
LDL-C Change vs. Atherosclerosis ProgressionLDL-C Change vs. Atherosclerosis Progression
Combined atorvastatinand pravastatintreatment groups
Nissen et al. N Engl J Med 2005;352:29-38.
13
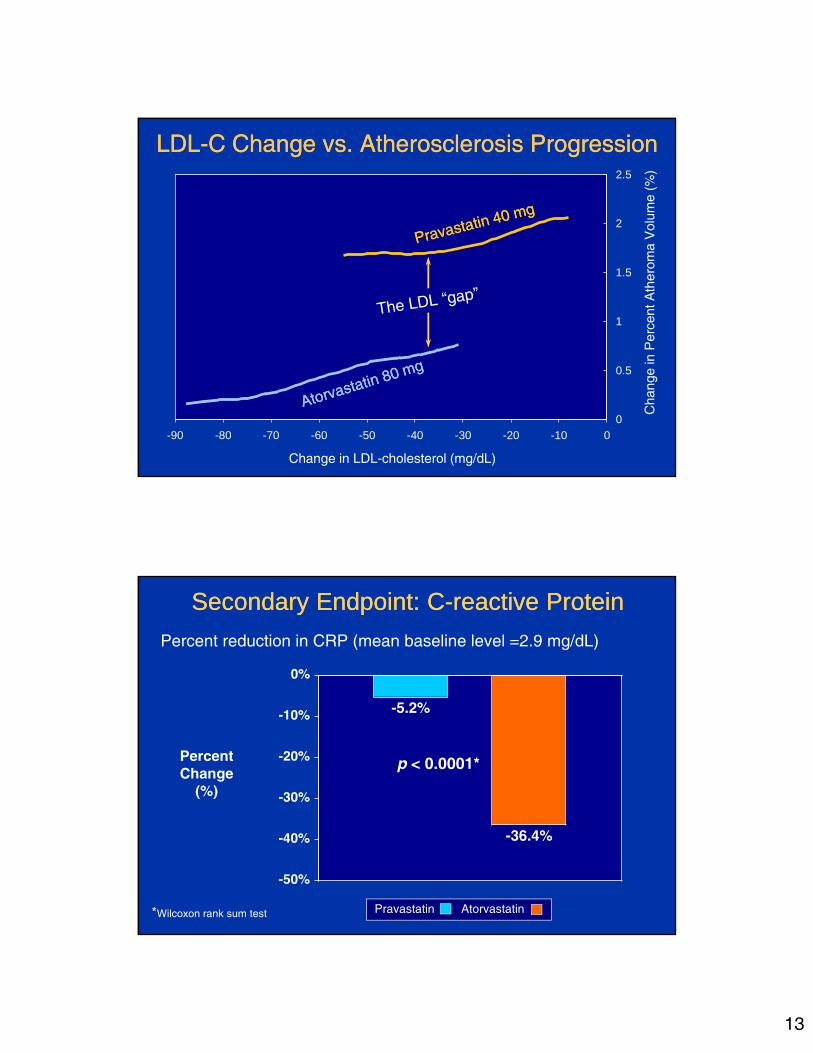
0
0.5
1
1.5
2
2.5
-90 -80 -70 -60 -50 -40 -30 -20 -10 0
Cha
nge
in P
erce
nt A
ther
oma
Vol
ume
(%)
Change in LDL-cholesterol (mg/dL)
LDL-C Change vs. Atherosclerosis ProgressionLDL-C Change vs. Atherosclerosis Progression
Percent reduction in CRP (mean baseline level =2.9 mg/dL)
Secondary Endpoint: C-reactive ProteinSecondary Endpoint: C-reactive Protein
PercentChange
(%)
Pravastatin Atorvastatin
p < 0.0001*
*Wilcoxon rank sum test
14
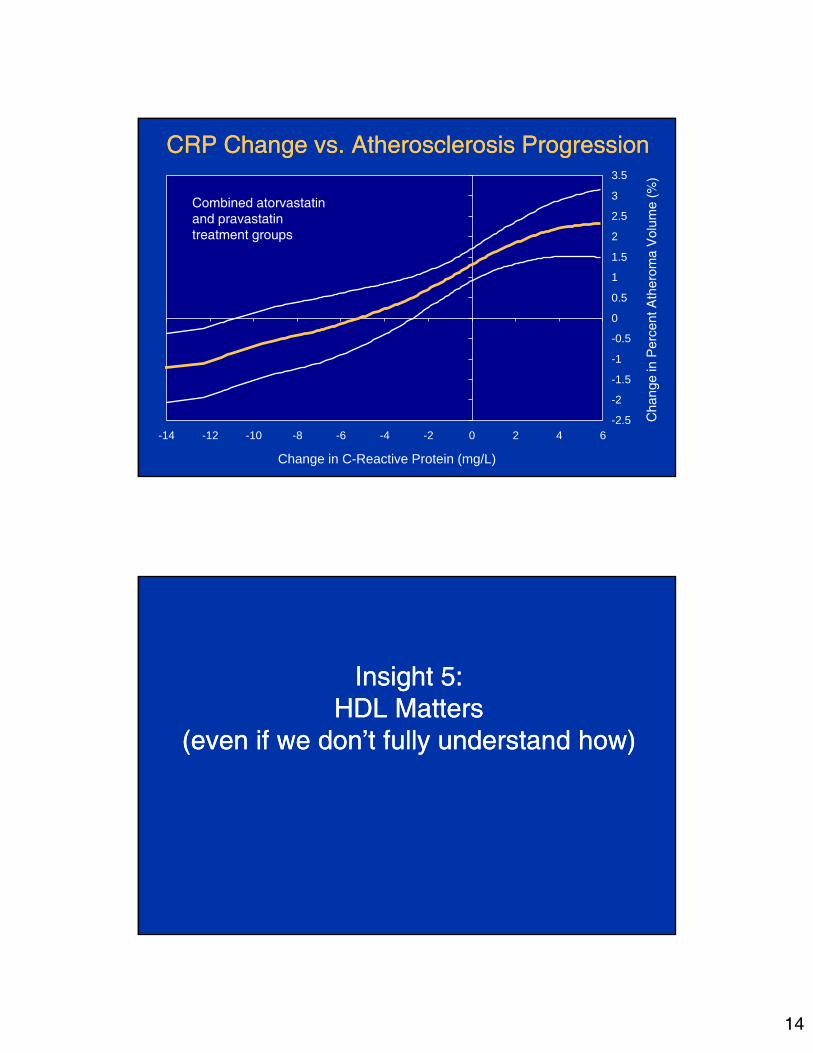
-2.5
-2
-1.5
-1
-0.5
0
0.5
1
1.5
2
2.5
3
3.5
-14 -12 -10 -8 -6 -4 -2 0 2 4 6
Change in C-Reactive Protein (mg/L)
Cha
nge
in P
erce
nt A
ther
oma
Vol
ume
(%)
CRP Change vs. Atherosclerosis ProgressionCRP Change vs. Atherosclerosis Progression
Combined atorvastatinand pravastatintreatment groups
Insight 5:HDL Matters
(even if we don’t fully understand how)
Insight 5:HDL Matters
(even if we don’t fully understand how)

15
Obsrvational and Pre-Clinical StudiesObsrvational and Pre-Clinical Studies
• Apolipoprotein A1 Milano is a variant derived from 40 subjects in the Italian village of Limone sul Garda.
• Apo A1 Milano carriers exhibit mean HDL levels of 17 mg/dL (0.44 mmol/L) with normal longevity and no atherosclerosis.A cysteine is substituted for arginine at position 173.
• Recombinant Apo A1 Milano has been complexed with phospholipid to produce nascent HDL-like particle. (Esperion)
• Infusions of Apo A1 Milano phospholipid complex in Apo E deficient mice rapidly (48 hours!!) mobilized lipid and reduced macrophage content within atherosclerotic lesions.*
*Shah PK et al. Circulation 1998;97:780-785 and Circulation 2001;103:3047-3050.
123 patients at 10 centers screenedRecent myocardial infarction or Acute coronary syndrome
>20% stenosis in a non-intervened vessel
7 patients withdrew1 patients withdrew
Follow-up IVUS of originally imaged “target” vessel (n=47)
Intravascular ultrasound with 40 MHz transducerMotorized pullback at 0.5 mm/sec through >30 mm
length of single “target” coronary artery
ETC-216 high (22 pts)
Placebo 11 pts ETC-216 high (15 pts)
2 patients withdrew
Placebo 12 pts ETC-216 low (23 pts)
5 weeks
ETC-216 low (21 pts)

16
ApoA1 Milano: Change in Total Atheroma VolumeApoA1 Milano: Change in Total Atheroma Volume
-18
-16
-14
-12
-10
-8
-6
-4
-2
0 Column1
Tota
l Ath
erom
a V
olum
e (m
m3)
-14.1mm3-14.1mm3
PlaceboPlacebo Low DoseLow Dose High DoseHigh Dose
-12.6mm3-12.6mm3
-15.1 mm3-15.1 mm3
-2.9mm3-2.9mm3
CombinedCombined
P = 0.97
P = 0.02
P = 0.007
P < 0.001
SideBranch
SideBranch
EEM area14.37 mm2
EEM area 11.58 mm2
Lumen area6.23 mm2
Lumen area6.27 mm2
Atheromaarea - 8.10 mm2
Atheromaarea - 5.35 mm2

17
Percent Atheroma Volume: LDL-C and HDL-CPercent Atheroma Volume: LDL-C and HDL-C
-0.6
-0.4
-0.2
0
0.2
0.4
0.6
0.8
1
1.2
1.4
Column1
Per
cent
Ath
erom
a V
olum
e (%
) 1.3%1.3%
0.9%0.9%
0.2%0.2%
-0.2%-0.2%
LDL-C worseHDL-C worseLDL-C worseHDL-C worse
LDL-C worseHDL-C betterLDL-C worseHDL-C better
LDL-C betterHDL-C worseLDL-C betterHDL-C worse
LDL-C betterHDL-C betterLDL-C betterHDL-C better
Median LDL-C - 87.5 mg/dLMedian HDL-C change - 7.5%
Insight 6:It’s Not Just Lipids
Blood Pressures Also Matters
Insight 6:It’s Not Just Lipids
Blood Pressures Also Matters

18
1991 patients at 100 centers, North America and EuropeSymptomatic CAD, coronary angiography with >20% stenosis
Diastolic BP ≤ 100 mm Hg
placebo
Intent-to-treat analysis of cardiovascular events (1991 patients)Repeat intravascular ultrasound examination (274 patients)
enalapril 20 mg amlodipine 10 mg
Baseline intravascular ultrasound in 428 participants
24 months treatment
Nissen et al. JAMA. 2004;292(18); 2217-2226. Dr Steven Nissen, Cleveland Clinic Foundation.
Months after randomization
Systolic Pressure: All Three Treatment GroupsSystolic Pressure: All Three Treatment Groups
Nissen et al. JAMA. 2004;292(18); 2217-2226.Dr Steven Nissen, Cleveland Clinic Foundation.
19
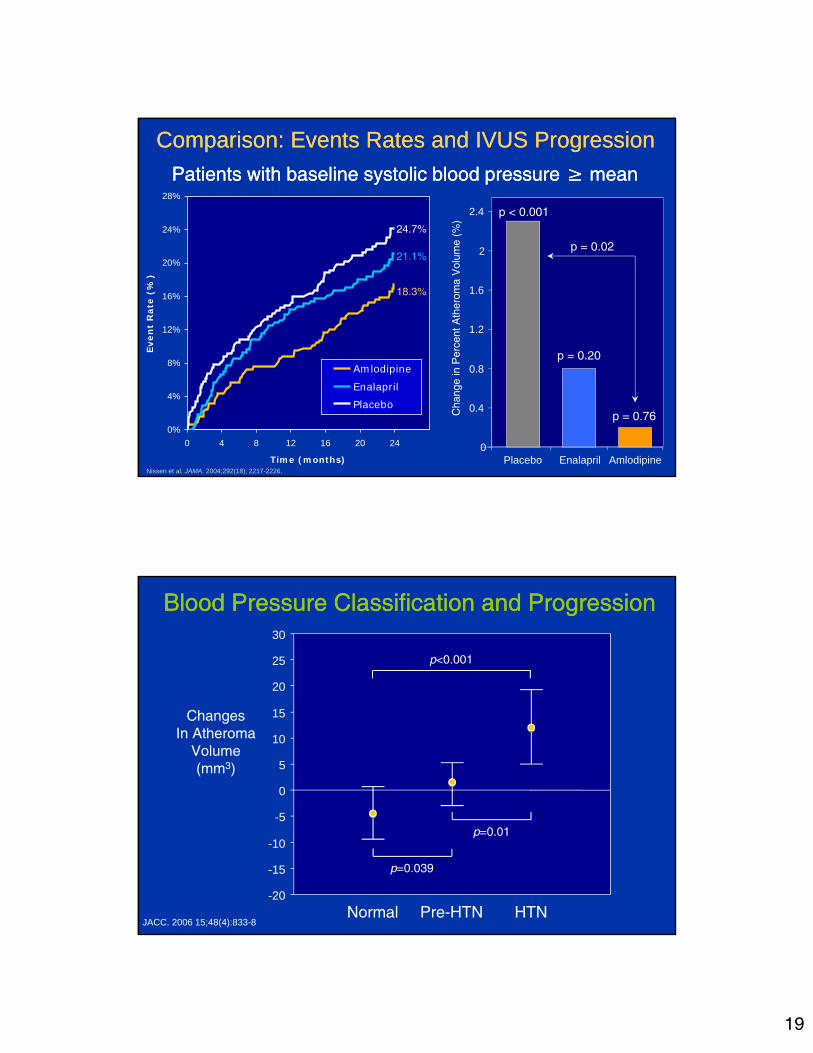
Comparison: Events Rates and IVUS ProgressionComparison: Events Rates and IVUS Progression
Patients with baseline systolic blood pressure ≥ mean Patients with baseline systolic blood pressure ≥ mean
0
0.4
0.8
1.2
1.6
2
2.4
Placebo Enalapril AmlodipineC
hang
e in
Per
cent
Ath
erom
a V
olum
e (%
)
p < 0.001
p = 0.20
p = 0.76
p = 0.02
Nissen et al. JAMA. 2004;292(18); 2217-2226.
0%
4%
8%
12%
16%
20%
24%
28%
0 4 8 12 16 20 24
Time (months)
Even
t R
ate
(%)
Amlodipine
EnalaprilPlacebo
24.7%
21.1%
18.3%
Blood Pressure Classification and ProgressionBlood Pressure Classification and Progression
-20
-15
-10
-5
0
5
10
15
20
25
30
0
ChangesIn Atheroma
Volume(mm3)
Normal Pre-HTN HTN
p<0.001
p=0.01
p=0.039
JACC. 2006 15;48(4):833-8

20
Effect of LDL and SBP on Atheroma ProgressionEffect of LDL and SBP on Atheroma Progression
0.15
0.3
0.51
0.61
0
0.1
0.2
0.3
0.4
0.5
0.6
0.7
0.8
Column1
Per
cent
Ath
erom
a V
olum
e (%
)
J Am Coll Cardiol 2009:53:1110-52009
LDL-C <70SBP <120
LDL-C <70SBP ≥120
LDL-C ≥70SBP <120
LDL-C ≥70SBP ≥120
Insight 7:A Lower LDL-C
is Almost Always Better
Insight 7:A Lower LDL-C
is Almost Always Better

21
Mean
Baseline During
treatment* Percent
Change†p
value
Total Cholesterol (mg/dL )
204 133.8 -33. 8 <0.001
LDL-C (mg/dL )
130.4 60.8 -53. 2 <0.001
HDL-C (mg/dL )
43.1 49.0 +14. 7 <0.001
Triglycerides (mg/dL )
152.2 121.2 -14. 5 <0.001
LDL-C/HDL-C ratio
3.2 1.3 -58.5 <0.001
* Time-weighted average † From least square mean
Rosuvastatin: Percent Change in Lipids (n=349)
Dual Primary IVUS Efficacy ParametersDual Primary IVUS Efficacy ParametersMedian Change in Percent
Atheroma VolumeMedian Change in
Most Diseased Subsegment
Regressionp<0.001*
*Wilcoxon signed rank test for comparison with baseline
Regressionp<0.001*
ChangeIn
AtheromaVolume(mm3)
ChangeIn
PercentAtheromaVolume
(%)

22
Distribution: Percent Atheroma VolumeDistribution: Percent Atheroma Volume
0
20
40
60
80
-7 -6 -5 -4 -3 -2 -1 0 1 2 3 4 5
Numberof
Patients
Regression63.6%
Progression36.4%
Change in Percent Atheroma Volume (%)
Coronary IVUS Regression-Progression TrialsCoronary IVUS Regression-Progression Trials
-1.2
-0.6
0
0.6
1.2
1.8
50 60 70 80 90 100 110 120
MedianChange
In PercentAtheromaVolume
(%)
Mean Low-Density Lipoprotein Cholesterol (mg/dL)
REVERSALpravastatin
REVERSALatorvastatin
CAMELOTplacebo
A-Plusplacebo
ACTIVATEplacebo
Relationship between LDL-C and Progression Rate
ASTEROIDrosuvastatin
r2= 0.95p<0.001
23
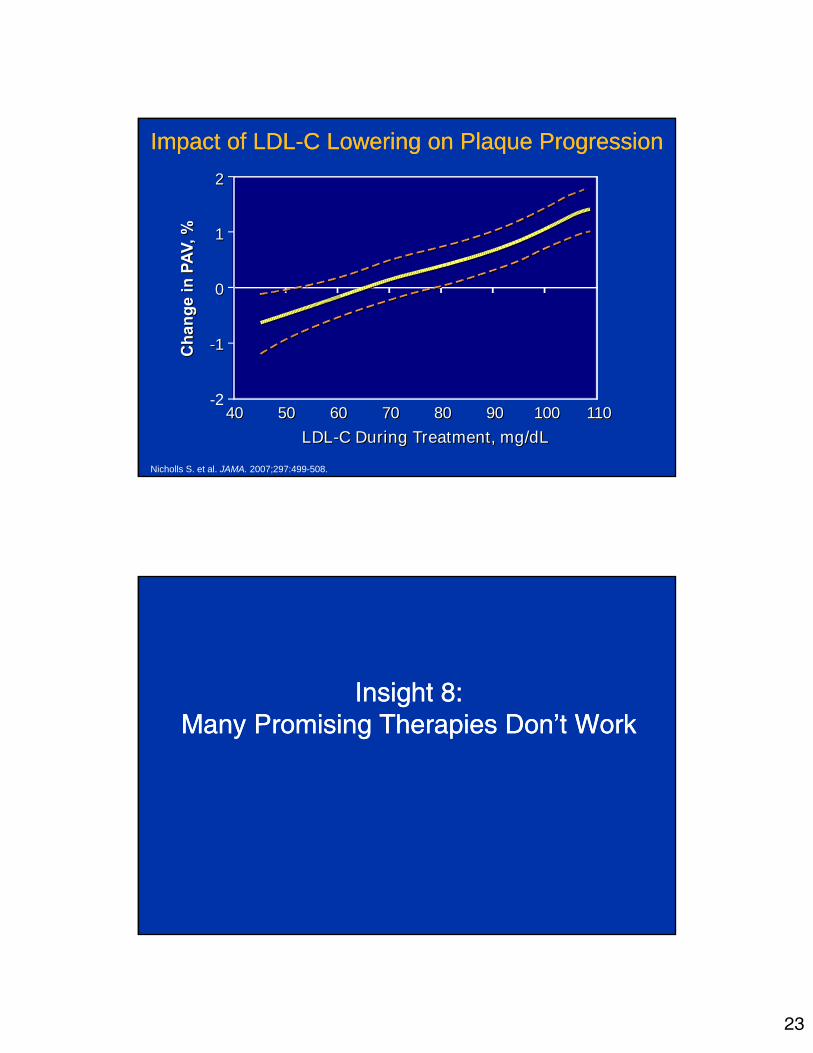
Impact of LDL-C Lowering on Plaque ProgressionImpact of LDL-C Lowering on Plaque Progression
Nicholls S. et al. JAMA. 2007;297:499-508.
40 50 60 70 80 90 100 110-2
-1-1
00
11
22
LDL-C During Treatment, mg/dLLDL-C During Treatment, mg/dL
40 50 60 70 80 90 100 110
Insight 8:Many Promising Therapies Don’t Work
Insight 8:Many Promising Therapies Don’t Work

24
446 atorvastatin patients 464 torcetrapib patients
135 patients withdrew140 patients withdrew
24 Month follow-up IVUS of originally imaged “target” vessel (n=910)
4-10 week run-in atorvastatin 10-80 mgto achieve LDL-C of 100±15 mg/dL
Intravascular ultrasound with 40 MHz transducerMotorized pullback at 0.5 mm/sec through >40 mm segment
1188 patients at 137 centers in North America and EuropeSymptomatic CAD, coronary angiography with >20% stenosis
Atorvastatinmonotherapy
Torcetrapib 60mg-atorvastatin
24 monthstreatment
40
50
60
70
80
90
100
0 1 3 6 9 12 15 18 21 24
Time (months)
LD
L c
ho
les
tero
l Le
vel (
mg
/dL
)
Time Course: Change in LDL-C Levels
Torcetrapib-Atorvastatin
Atorvastatin Monotherapy
Difference 19.9%
25
20
30
40
50
60
70
80
90
0 1 3 6 9 12 15 18 21 24
Time (months)
HD
L-c
ho
lest
ero
l Lev
el (
mg
/dL
)
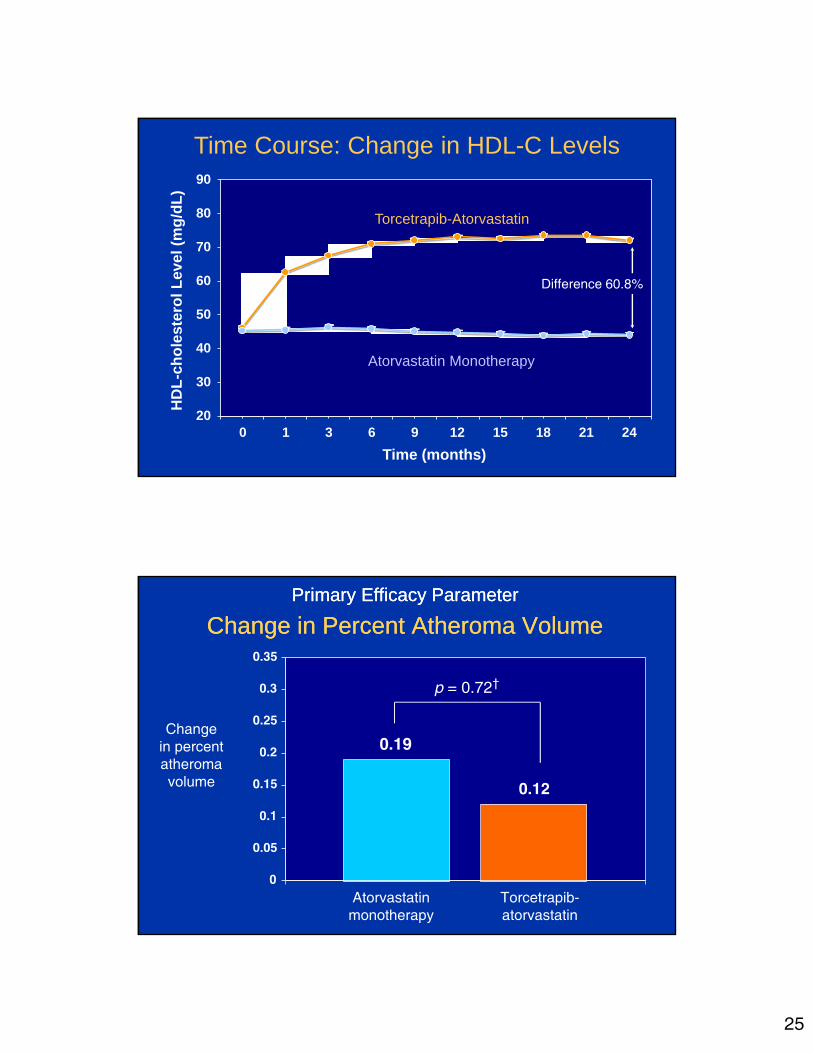
Time Course: Change in HDL-C Levels
Torcetrapib-Atorvastatin
Atorvastatin Monotherapy
Difference 60.8%
Primary Efficacy Parameter
Change in Percent Atheroma VolumePrimary Efficacy Parameter
Change in Percent Atheroma Volume
Changein percentatheromavolume
Atorvastatinmonotherapy
Torcetrapib-atorvastatin
p = 0.72†

26
ACAT Inhibition: Mechanism of ActionACAT Inhibition: Mechanism of Action
Change in Atheroma Volume(mm3)*
Change in Atheroma Volume(mm3)
p=0.04 p=0.01
placebo pactimibe
Pactimibe vs. Placebo: Atheroma VolumePactimibe vs. Placebo: Atheroma Volume
Entire Ultrasound PullbackEntire Ultrasound Pullback Most Diseased 10 mmMost Diseased 10 mm
p<.001
p=0.39
p<.001
p=0.02
†
†
† median
Nissen SE et al. N Engl J Med. 2006 Mar 23;354(12):1253-63.
27
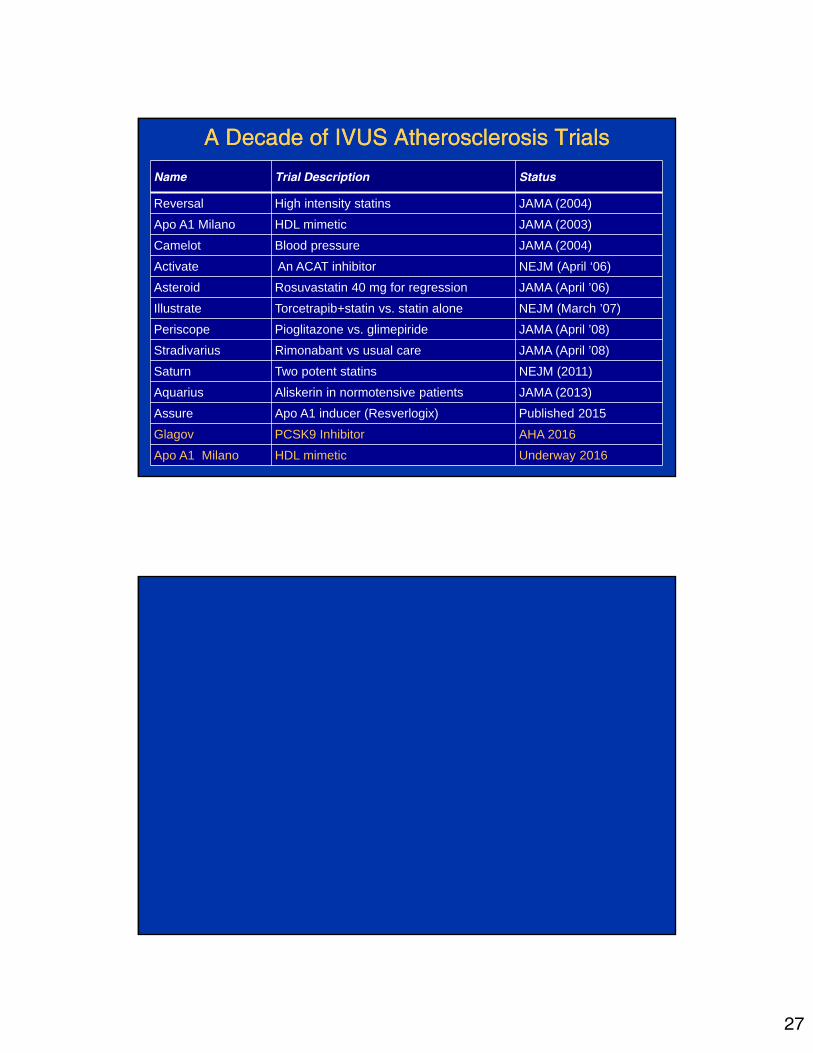
A Decade of IVUS Atherosclerosis TrialsA Decade of IVUS Atherosclerosis Trials
Name Trial Description Status
Reversal High intensity statins JAMA (2004)
Apo A1 Milano HDL mimetic JAMA (2003)
Camelot Blood pressure JAMA (2004)
Activate An ACAT inhibitor NEJM (April ‘06)
Asteroid Rosuvastatin 40 mg for regression JAMA (April ’06)
Illustrate Torcetrapib+statin vs. statin alone NEJM (March ’07)
Periscope Pioglitazone vs. glimepiride JAMA (April ’08)
Stradivarius Rimonabant vs usual care JAMA (April ’08)
Saturn Two potent statins NEJM (2011)
Aquarius Aliskerin in normotensive patients JAMA (2013)
Assure Apo A1 inducer (Resverlogix) Published 2015
Glagov PCSK9 Inhibitor AHA 2016
Apo A1 Milano HDL mimetic Underway 2016

28
0%
20%
40%
60%
80%
100%
>-20 -15 -10 -5 0 5 10 15 20 25
Change in Systolic Blood Pressure (mmHg)
Pe
rce
nta
ge
of
Su
bje
cts
(%)
Cumulative Histogram: Change in Systolic BP
TorcetrapibAtorvastatin
AtorvastatinMonotherapy
LS Mean difference4.6 mm Hg
PERISCOPE: Glycohemoglobin LevelsPERISCOPE: Glycohemoglobin Levels
HbA1c(%)
Weeks after Randomization

29
Percentage Changes: Biochemical ParametersPercentage Changes: Biochemical Parameters
P <0.001
P = 0.69
HDL-cholesterolHDL-cholesterol LDL-cholesterolLDL-cholesterol
4.1%
16.0%
-15.3%
0.6%
TriglyceridesTriglycerides
6.9% 6.6%
hs C-reactive Proteinhs C-reactive Protein
-18.0%
-44.9%
P <0.001P <0.001
Change in Percent Atheroma Volume (%)Change in Percent Atheroma Volume (%)
P < 0.001P < 0.001
P = 0.44P = 0.44
P = 0.002P = 0.002
Glimepiride Pioglitazone
Primary Efficacy ParameterPrimary Efficacy Parameter

30
Rosuvastatin 40 mg (n =694)
Atorvastatin 80 mg (n=691)
Safety Safety LipidsSafety
IVUSLipids Safety
LipidsSafety
Safety Safety
Visit:Week:
1–4
30
413
526
639
752
865
978
1091
11104
Screening Period
2–2
Rosuva 20 mg
Atorva 40 mg
IVUSLipids
Lipids
Randomization Period
LipidsSafety
Safety
1385 patients with symptomatic CAD (angiographic stenosis >20%)
LDL‐C with (>80 mg/dL) or without (>100 mg/dL) statin use last 4 weeks
SATURN: Study Design
Primary Efficacy Parameter
Change in Percent Atheroma VolumePrimary Efficacy Parameter
Change in Percent Atheroma Volume
-0.99
-1.22
-1.5
-1.25
-1
-0.75
-0.5
-0.25
0
Changein percentatheromavolume
Atorvastatin 80 mg Rosuvstatin 40mg
p = 0.17

31
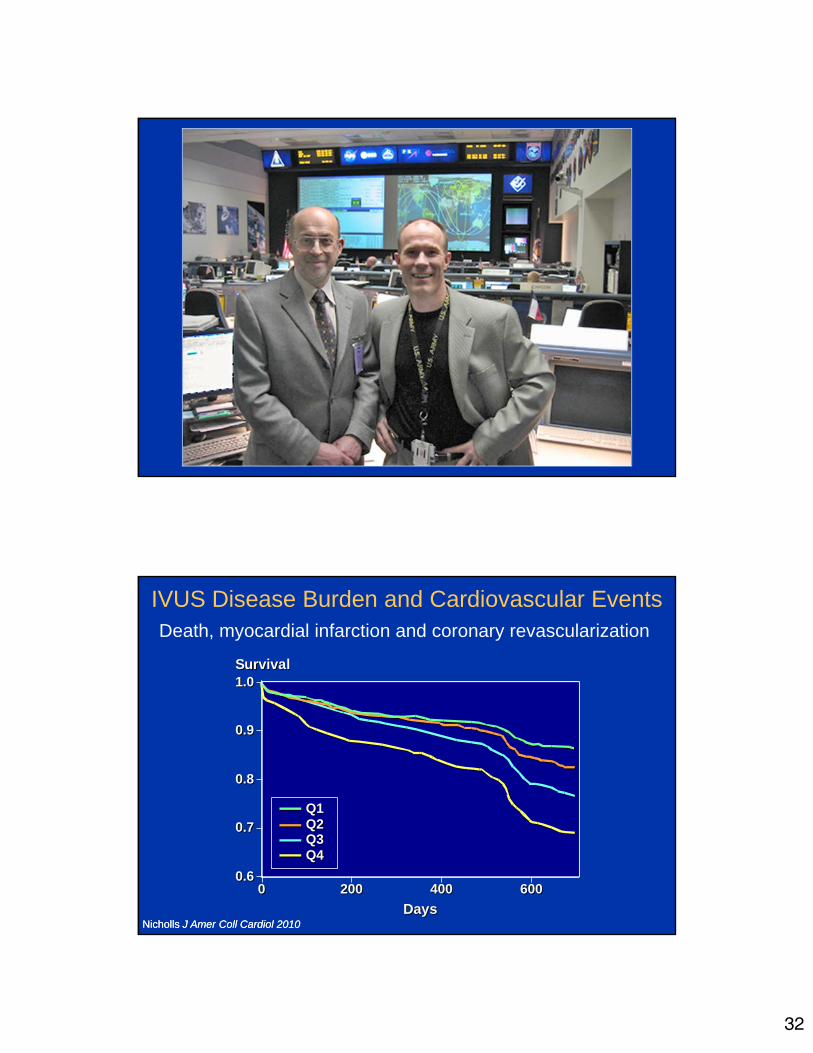
Correlation with Clinical Outcomes
Correlation with Clinical Outcomes
32
Q1Q2Q3Q4
0.6
0.7
0.8
0.9
1.0
Days
0 200 400
Survival
6000.6
0.7
0.8
0.9
1.0
Days
0 200 400
Survival
600
Q1Q2Q3Q4
IVUS Disease Burden and Cardiovascular Events
Nicholls J Amer Coll Cardiol 2010Nicholls J Amer Coll Cardiol 2010
Death, myocardial infarction and coronary revascularization

33
Cumulative Incidence of MACE (%)
Month1812963 5 21 240
12
2
6
8
10
4
0
14Cumulative Incidence of MACE (%)
Month1812963 5 21 24
12
2
6
8
10
4
0
14
0
Log Rank Test P value =0.001 for PAV quartile 4 vs.lower quartile
Baseline PAV Quartile 1 (14.78-30.73)Baseline PAV Quartile 2 (30.80-36.09)Baseline PAV Quartile 3 (36.12-41.74)Baseline PAV Quartile 4 (41.78-68.75)
Baseline PAV Quartile 1 (14.78-30.73)Baseline PAV Quartile 2 (30.80-36.09)Baseline PAV Quartile 3 (36.12-41.74)Baseline PAV Quartile 4 (41.78-68.75)
Plaque Burden Predicts MACE with High Intensity Statins
Puri Eur. Heart J 2013
CETP inhibitionwith torcetrapib
Infusion ofApoA1 Milano

34
Prior Coronary IVUS Progression TrialsPrior Coronary IVUS Progression Trials
-1.2
-0.6
0
0.6
1.2
1.8
50 60 70 80 90 100 110 120
MedianChange
In PercentAtheromaVolume
(%)
Mean LDL-C (mg/dL)
REVERSALpravastatin
REVERSALatorvastatin
CAMELOTplacebo
A-Plusplacebo
ACTIVATEplacebo
Relationship between LDL-C and Progression Rate
UnexploredRegionUnexploredRegion
Impact of HDL-C Raising on Plaque ProgressionImpact of HDL-C Raising on Plaque Progression
-2-2
-1-1
00
11
22
Nicholls S. et al. JAMA. 2007;297:499-508.
Increase in HDL (%)Increase in HDL (%)10 20 30 40
Changein PAV
(%)

35
Recent and Ongoing IVUS Atherosclerosis TrialsRecent and Ongoing IVUS Atherosclerosis Trials
Name Trial Description Status
Activate An ACAT inhibitor NEJM (April ‘06)
Asteroid Rosuvastatin 40 mg for regression JAMA (April ’06)
Illustrate Torcetrapib+statin vs. statin alone NEJM (March ’07)
Periscope Pioglitazone vs. glimepiride JAMA (April ’08)
Stradivarius Rimonabant vs usual care JAMA (April ’08)
Aquarius aliskerin in normotensive patients JAMA (2013)
Saturn Atorvastatin vs. rosuvastatin NEJM (2011)
Glagov PCSK9 Inhibitor Coming soon

36
Torcetrapib Results: Levels of HDL-C AchievedTorcetrapib Results: Levels of HDL-C Achieved
-0.8
-0.6
-0.4
-0.2
0
0.2
0.4
0.6
0.8
Column1
Per
cent
Ath
erom
a V
olum
e (%
)
Quartile 1<56 mg/dLQuartile 1<56 mg/dL
Quartile 256 to 69 mg/dL
Quartile 256 to 69 mg/dL
Quartile 369 to 86 mg/dL
Quartile 369 to 86 mg/dL
Quartile 4>86 mg/dLQuartile 4>86 mg/dL
Percent Atheroma VolumePrimary Efficacy Parameter0.70%0.70%
0.30%0.30%0.18%0.18%
-0.69%-0.69%
Serum Potassium: Effect of TorcetrapibSerum Potassium: Effect of Torcetrapib
4
4.05
4.1
4.15
4.2
4.25
4.3
4.35
BaselineBaseline Follow-upFollow-up
AtorvastatinAtorvastatin Torcetrapib-AtorvastatinTorcetrapib-Atorvastatin
4
4.05
4.1
4.15
4.2
4.25
4.3
4.35
Baseline Baseline Follow-upFollow-up
P = 0.08P < 0.001
37
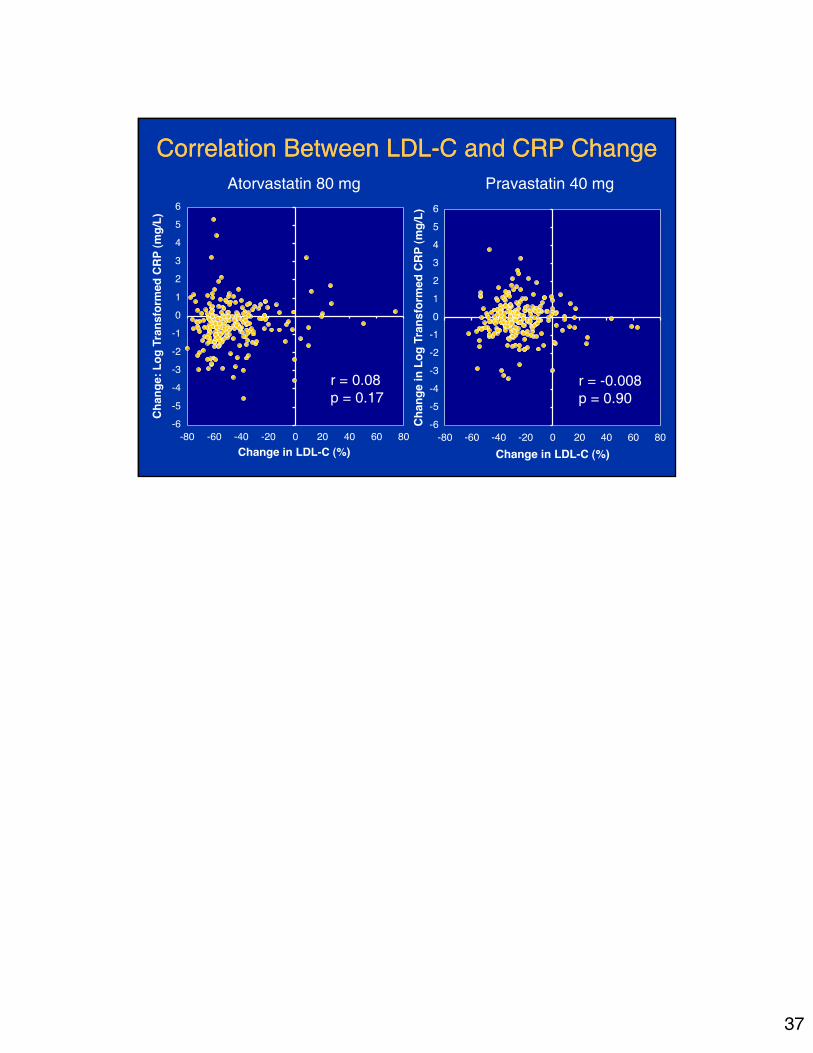
Correlation Between LDL-C and CRP ChangeCorrelation Between LDL-C and CRP ChangeAtorvastatin 80 mg Pravastatin 40 mg
r = -0.008p = 0.90
r = 0.08p = 0.17