intra-industry trade in manufactured goods: a case of india
TRANSCRIPT
Accessed at https://www.nipfp.org.in/publications/working-papers/1946/ Page 1
Working Paper No. 348 NIPFP Working Paper Series
Intra-Industry Trade in Manufactured Goods: A
Case of India
No. 348
24-August-2021
Manmohan Agarwal and Neha Betai
National Institute of Public Finance and Policy
New Delhi
Accessed at https://www.nipfp.org.in/publications/working-papers/1946/ Page 2
Working Paper No. 348
Intra-Industry Trade in Manufactured Goods: A Case of India
Manmohan Agarwal & Neha Betai1,2
Abstract
Since the second world war, it was observed that trade between two countries could
not be explained entirely by the classical and neoclassical models of trade that
emphasised inter-industry trade. It was found that trade between countries was
increasingly dominated by intra-industry trade (IIT), where countries exchanged
products that fell in the same category. In this paper, we try to determine the extent of IIT
between India and its top fifteen trading patterns. Unlike other papers, we do not simply
calculate aggregate IIT for all merchandise trade. Instead, we focus on manufactured
products and divide them into ten categories based on their technological content. Our
analysis reveals that while India's IIT has increased in recent years, it is not the dominant
form of trade between India and its most important partners. When we look at the factors
that determine IIT, we find that India's comparative advantage and trade agreements play
a positive and significant role in increasing IIT. Lastly, an analysis of the category Medium
Technology Manufactures - Process reveals that this sector has potential for higher IIT
and gains from it if India can enhance its efficiency and increase its size.
Keywords: Intra-industry trade, Technological content, Trade Partners
JEL Codes: F12, F14, F15
1 Manmohan Agarwal is a retired professor from Jawaharlal Nehru University, Delhi, and a retired Reserve Bank of India professor at Centre for Development Studies, Trivandrum and an adjunct senior fellow at RIS. Neha Betai is an academic associate at the Indian Institute of Management, Bangalore. 2 The authors would like to thank the participants of the Web Conference on Economic Theory and Policy hosted by the National Institute of Public Finance and Policy in March 2021, especially Dr. Rudrani Bhattacharya, as well as other anonymous referres for their comments on an earlier draft of this paper.
Accessed at https://www.nipfp.org.in/publications/working-papers/1946/ Page 3
Working Paper No. 348
Section 1: Introduction
For a long time, trade between any two countries was explained by the
Ricardian/Heckscher-Ohlin (HO) models, which theorised trade to be driven by
differences in technology or factor endowment. The classical and neo-classical models
emphasised inter-industry trade, where each country would specialise in the production
of a particular commodity (the assumption here was that all processes required for the
production of a commodity would be performed in the country) and would then exchange
it with its trading partner. However, in the post-war period, it was observed that trade
between economies was no longer the cheese for wine type as believed by theorists.
Instead, the exchange between commodities comprised of goods that belonged to the
same category. This pattern of exchange was termed as intra-industry trade (Balassa,
1966).
Initial research in intra-industry trade (IIT) focussed on the trading patterns of developed
economies. Economists such as Verdoorn (1960) and Balassa (1963) observed the
changes in patterns of trade in European countries after the formation of Benelux and the
European Economic Community (EEC). They found that developed countries showed an
increasing proportion of intra-industry rather than inter-industry trade. This pattern was
repeatedly observed in most developed countries.
The same pattern, however, was not observed in developing countries. Few researchers
found evidence of IIT between developing countries and between developed and
developing countries. The notion that developing countries primarily engaged in inter-
industry trade stemmed from two beliefs: the inability of developing countries to exploit
economies of scale and the significant differences in factor endowment between
countries, especially in the North and the South, constrained IIT. Despite such beliefs,
some economists showed the presence of IIT in trade in manufactures between
developing countries (Balassa 1979). IIT was found to be high between developing
countries and between developed and developing countries. This paper found that
regional integration in the form of trade blocs and bilateral agreements played an
essential role in increasing IIT. Moreover, in recent years, there have been a large number
of studies that show theoretically and empirically the existence of IIT between developing
countries and their trading partners (Manrique 1987; Globerman, 1992)
This paper explores the nature of trade between one of the largest developing countries,
India, and its 15 most significant trading partners - Bangladesh, Belgium, China, Germany,
Hong Kong, Italy, Malaysia, Nepal, Netherlands, Saudi Arabia, Singapore, United Arab
Emirates, United Kingdom, United States and Vietnam. These countries were chosen
because over half of India's trade is accounted for by them. The objective is to identify the
factors that drive IIT in India. However, unlike the other studies in the area, we do not
simply calculate IIT for all manufacturing products. Instead, we stick to merchandise
trade in chemicals and manufacturing products, and we categorise these products into
groups based on their technological content. The categorisation of these products is done
using the Lall Classification, which classifies products into ten separate groups. We
Accessed at https://www.nipfp.org.in/publications/working-papers/1946/ Page 4
Working Paper No. 348
conduct this exercise to understand better the type of goods in which India exhibits higher
IIT and the factors that influence IIT in different categories.
The paper is structured as follows. In section 2, we look at the literature on IIT, focusing
on studies done in the Indian context. In section 3, we describe the methodology adopted
for empirical analysis. Next, in section 4, we provide a background for India's trade,
specifically IIT. In sections 5 and 6, we delve into the empirical analysis and the discussion
of the results. Section 7 concludes the paper.
Section 2: Literature Review
Beginning with Verdoorn (1960), several studies found that countries increasingly
exhibited specialisation within the same category of goods being traded (Balassa, 1963;
Kojima, 1964; Grubel, 1967); this pattern of trade was termed intra-industry trade
(Balassa, 1963). These findings were contrary to traditional theories of trade, which
predicted that countries would specialise in different goods (depending on their
comparative advantage or factor endowments) and trade with each other to enjoy gains
from trade. Even before Verdoorn (1960), Leontief (1936) had indicated that the HO
theorem failed to explain the trade pattern of countries with similar factor endowments.
The advent of studies on IIT further extended support to his point. The book by Grubel
and Lloyd, "Intra-Industry trade", published in 1975, dealt with aggregation and
measurement of IIT and provided additional impetus to studies in this field.
The initial studies on IIT were largely empirical with little theoretical backing, which was
iin the beginning provided by Krugman (1979). Krugman (1979) shows that trade in
similar but different commodities between countries was induced by two factors,
economies of scale in production and consumer's love for variety, which also gave rise to
gains from trade (GFT) from IIT. Subsequent studies by him found that as countries
become similar in their endowment, IIT between them increases (Krugman, 1981). Linder
(1961) had put forth a similar hypothesis which suggested that similarity in demand
patterns would increase the volume of reciprocal trade between economies in
differentiated goods. Lancaster (1980), too, argues that countries with the same factor
endowments would exhibit pure IIT. As the extent of similarity between endowments
reduces, IIT would reduce. Helpman (1981) measured similarity as an absolute difference
in income between countries and showed the negative correlation between similarity and
bilateral IIT.
Since Krugman, theoretical and empirical work has tried to determine factors other than
similarity (in factor endowment or incomes) that influence IIT. Factors such as the size of
the economies (Helpman, 1987), regional integration (Balassa, 1979), comparative
advantage in production were also said to play an essential role, as were gravity variables
such as distance between the economies (Helpman, 1987).
Given this background of literature on IIT, we now turn to the literature on India's pattern
of trade. Several studies have repeatedly examined the presence of IIT between India and
its trading partners, the distinctiveness of the patterns and the determining factors.
Accessed at https://www.nipfp.org.in/publications/working-papers/1946/ Page 5
Working Paper No. 348
First and foremost, trade liberalisation has proved to be an essential factor in increasing
IIT. Veeramani (2002) showed that trade liberalisation in India since the 1990s has been
biased towards IIT. He argues that this increase in IIT is a manifestation of resource re-
allocation within industries. Similarly, Burange and Chaddha (2008) found that reducing
trade barriers and efficient allocation of resources gave rise to specialisation within
unique varieties of goods and hence increased IIT. A recent paper by Aggarwal and
Chakraborty (2019) finds that multilateral reforms and trade liberalisation have
enhanced India's IIT at aggregate and sectoral levels.
Coming to the impact of free trade agreements, the evidence so far unilaterally dictates
that FTAs and RTAs have enhanced IIT in India. Aggarwal and Chakraborty (2019), Das
and Dubey (2014) find that India's signing of FTAs and bilateral agreements with trade
partners have been instrumental in driving IIT. Varma and Ramakrishnan (2014) show
that South Asian Free Trade Area (SAFTA) and agreements with Association of South East
Asian Nations (ASEAN) members have not only influenced manufacturing IIT but has also
increased the extent of IIT in agri-food products. The studies argue that further
integration will help in sustaining such trade flows. Next, studies have tried to examine
whether the rising IIT results from an increase in exports or imports. Veeramani (2002)
shows that rising exports by India have contributed to the increase in IIT. In an
examination of the Indian textile industry, Bhadouria and Verma (2012) show that IIT in
textiles has gone down since the start of the 21st century due to increased net exports. On
the other hand, Bagchi (2017) found that it is the rise in imports that has been responsible
for rising IIT.
Examining the more traditional factors driving IIT, such as similarity and factor
endowment, the literature shows interesting results. According to the theory on IIT,
India's IIT should be higher with other developing countries due to similarity in income
and factor endowments. However, Veeramani (2002) and Srivastava and Medury (2011)
find that India has a higher proportion of IIT with developed economies, i.e., highly
dissimilar economies. They attribute this finding to a higher share of vertical IIT in India's
trade.
Lastly, factors such as distance, India's increasing income and economic size, efficiency,
relative comparative advantage (RCA) are also said to play a positive and significant role
(Srivastava and Medhury, 2011; Bagchi, 2017, Aggarwal and Chakraborty, 2019). An
increase in income and size of the economy increase the demand for products giving rise
to IIT, whereas RCA indicates efficiencies in production which influences the supply of
products.
Section 3: Methodology
In this paper, we aim to study the patterns of IIT between India and its top 15 trading
partners. These 15 partners are Bangladesh, Belgium, China, Germany, Hong Kong, Italy,
Malaysia, Nepal, Netherlands, Saudi Arabia, Singapore, United Arab Emirates, United
Accessed at https://www.nipfp.org.in/publications/working-papers/1946/ Page 6
Working Paper No. 348
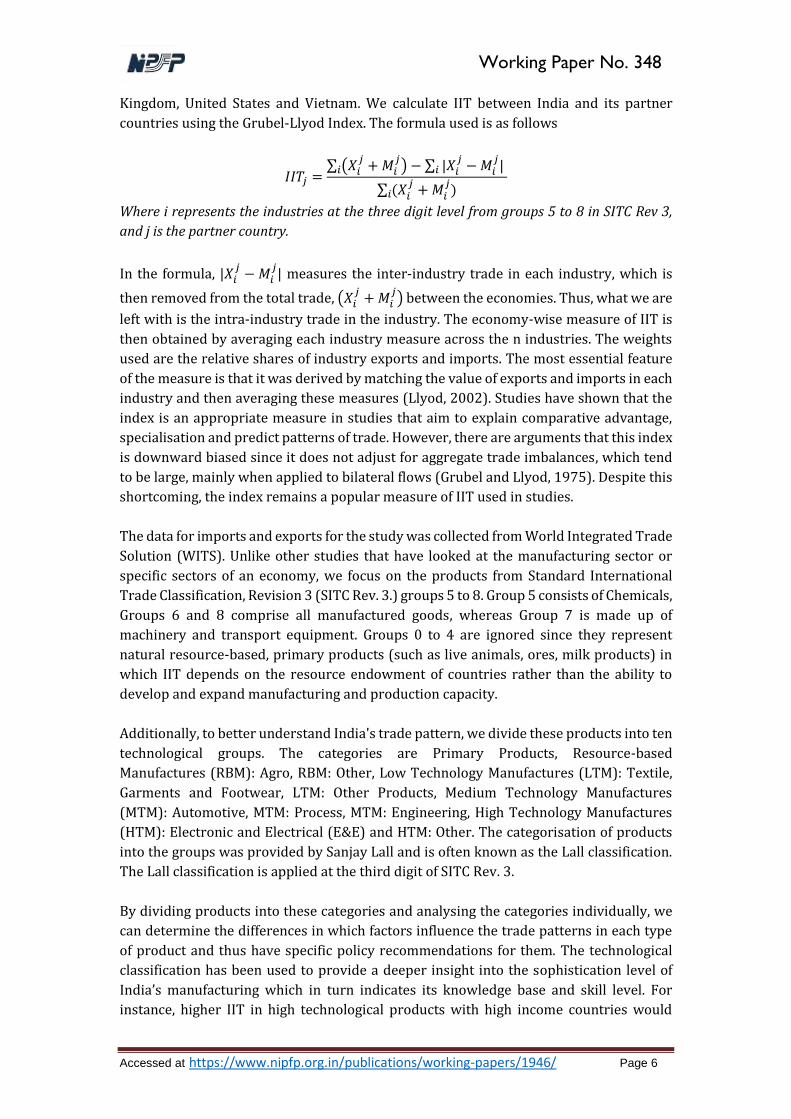
Kingdom, United States and Vietnam. We calculate IIT between India and its partner
countries using the Grubel-Llyod Index. The formula used is as follows
𝐼𝐼𝑇𝑗 =∑ (𝑋𝑖
𝑗+ 𝑀𝑖
𝑗) − ∑ |𝑋𝑖
𝑗− 𝑀𝑖
𝑗| 𝑖𝑖
∑ (𝑋𝑖𝑗
+ 𝑀𝑖𝑗)𝑖
Where i represents the industries at the three digit level from groups 5 to 8 in SITC Rev 3,
and j is the partner country.
In the formula, |𝑋𝑖𝑗
− 𝑀𝑖𝑗| measures the inter-industry trade in each industry, which is
then removed from the total trade, (𝑋𝑖𝑗
+ 𝑀𝑖𝑗) between the economies. Thus, what we are
left with is the intra-industry trade in the industry. The economy-wise measure of IIT is
then obtained by averaging each industry measure across the n industries. The weights
used are the relative shares of industry exports and imports. The most essential feature
of the measure is that it was derived by matching the value of exports and imports in each
industry and then averaging these measures (Llyod, 2002). Studies have shown that the
index is an appropriate measure in studies that aim to explain comparative advantage,
specialisation and predict patterns of trade. However, there are arguments that this index
is downward biased since it does not adjust for aggregate trade imbalances, which tend
to be large, mainly when applied to bilateral flows (Grubel and Llyod, 1975). Despite this
shortcoming, the index remains a popular measure of IIT used in studies.
The data for imports and exports for the study was collected from World Integrated Trade
Solution (WITS). Unlike other studies that have looked at the manufacturing sector or
specific sectors of an economy, we focus on the products from Standard International
Trade Classification, Revision 3 (SITC Rev. 3.) groups 5 to 8. Group 5 consists of Chemicals,
Groups 6 and 8 comprise all manufactured goods, whereas Group 7 is made up of
machinery and transport equipment. Groups 0 to 4 are ignored since they represent
natural resource-based, primary products (such as live animals, ores, milk products) in
which IIT depends on the resource endowment of countries rather than the ability to
develop and expand manufacturing and production capacity.
Additionally, to better understand India's trade pattern, we divide these products into ten
technological groups. The categories are Primary Products, Resource-based
Manufactures (RBM): Agro, RBM: Other, Low Technology Manufactures (LTM): Textile,
Garments and Footwear, LTM: Other Products, Medium Technology Manufactures
(MTM): Automotive, MTM: Process, MTM: Engineering, High Technology Manufactures
(HTM): Electronic and Electrical (E&E) and HTM: Other. The categorisation of products
into the groups was provided by Sanjay Lall and is often known as the Lall classification.
The Lall classification is applied at the third digit of SITC Rev. 3.
By dividing products into these categories and analysing the categories individually, we
can determine the differences in which factors influence the trade patterns in each type
of product and thus have specific policy recommendations for them. The technological
classification has been used to provide a deeper insight into the sophistication level of
India’s manufacturing which in turn indicates its knowledge base and skill level. For
instance, higher IIT in high technological products with high income countries would
Accessed at https://www.nipfp.org.in/publications/working-papers/1946/ Page 7
Working Paper No. 348
indicate a similarity in the production processes between India and technologically
advanced countries. This would imply that India has a deep knowledge base. On the other
hand, higher IIT in low technology products would imply that India is largely dependent
on labour-intensive, low skill products and has the potential to acquire knowledge and
move into the production of more sophisticated products.
The time period chosen for the analysis is 1988 to 2015. This time-period captures the
pre- and post-liberalisation periods, as well as the period during which India began
entering into regional trade agreements and started experiencing their repercussions .
Section 4: Background Statistics
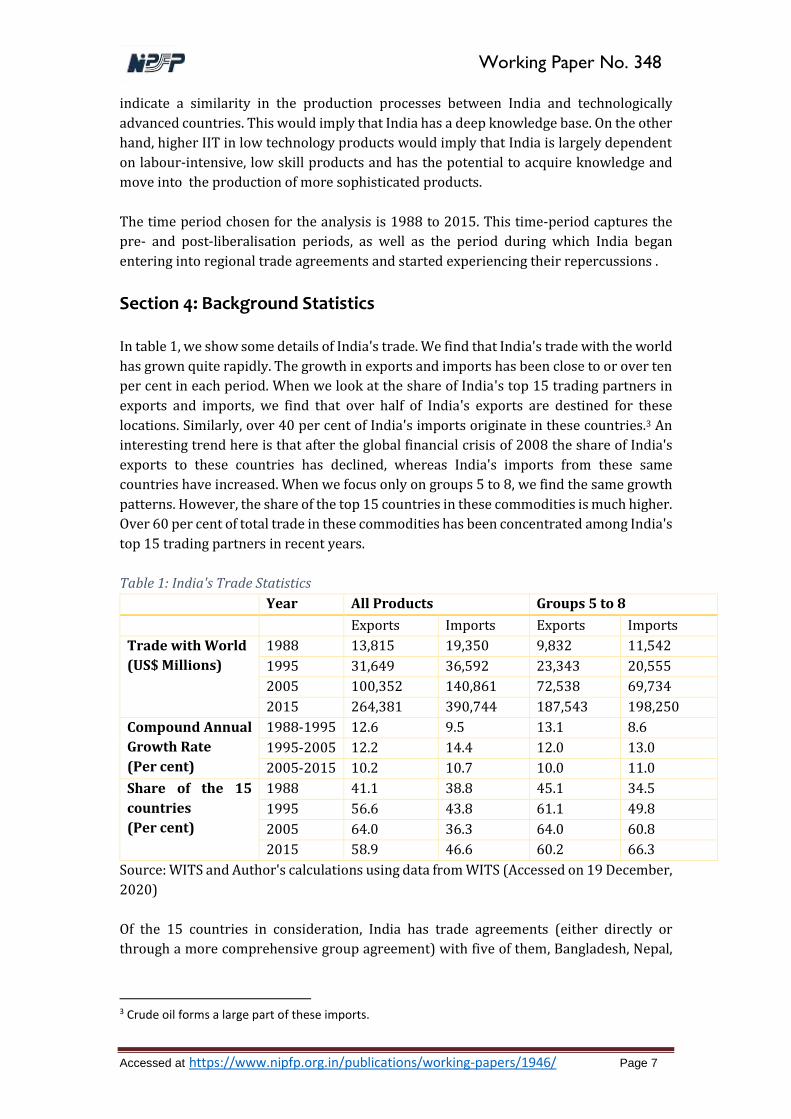
In table 1, we show some details of India's trade. We find that India's trade with the world
has grown quite rapidly. The growth in exports and imports has been close to or over ten
per cent in each period. When we look at the share of India's top 15 trading partners in
exports and imports, we find that over half of India's exports are destined for these
locations. Similarly, over 40 per cent of India's imports originate in these countries.3 An
interesting trend here is that after the global financial crisis of 2008 the share of India's
exports to these countries has declined, whereas India's imports from these same
countries have increased. When we focus only on groups 5 to 8, we find the same growth
patterns. However, the share of the top 15 countries in these commodities is much higher.
Over 60 per cent of total trade in these commodities has been concentrated among India's
top 15 trading partners in recent years.
Table 1: India's Trade Statistics Year All Products Groups 5 to 8
Exports Imports Exports Imports
Trade with World
(US$ Millions)
1988 13,815 19,350 9,832 11,542
1995 31,649 36,592 23,343 20,555
2005 100,352 140,861 72,538 69,734
2015 264,381 390,744 187,543 198,250
Compound Annual
Growth Rate
(Per cent)
1988-1995 12.6 9.5 13.1 8.6
1995-2005 12.2 14.4 12.0 13.0
2005-2015 10.2 10.7 10.0 11.0
Share of the 15
countries
(Per cent)
1988 41.1 38.8 45.1 34.5
1995 56.6 43.8 61.1 49.8
2005 64.0 36.3 64.0 60.8
2015 58.9 46.6 60.2 66.3
Source: WITS and Author's calculations using data from WITS (Accessed on 19 December,
2020)
Of the 15 countries in consideration, India has trade agreements (either directly or
through a more comprehensive group agreement) with five of them, Bangladesh, Nepal,
3 Crude oil forms a large part of these imports.
Accessed at https://www.nipfp.org.in/publications/working-papers/1946/ Page 8
Working Paper No. 348
Singapore, Vietnam and Malaysia. All agreements were either signed or came into force
after 2005.
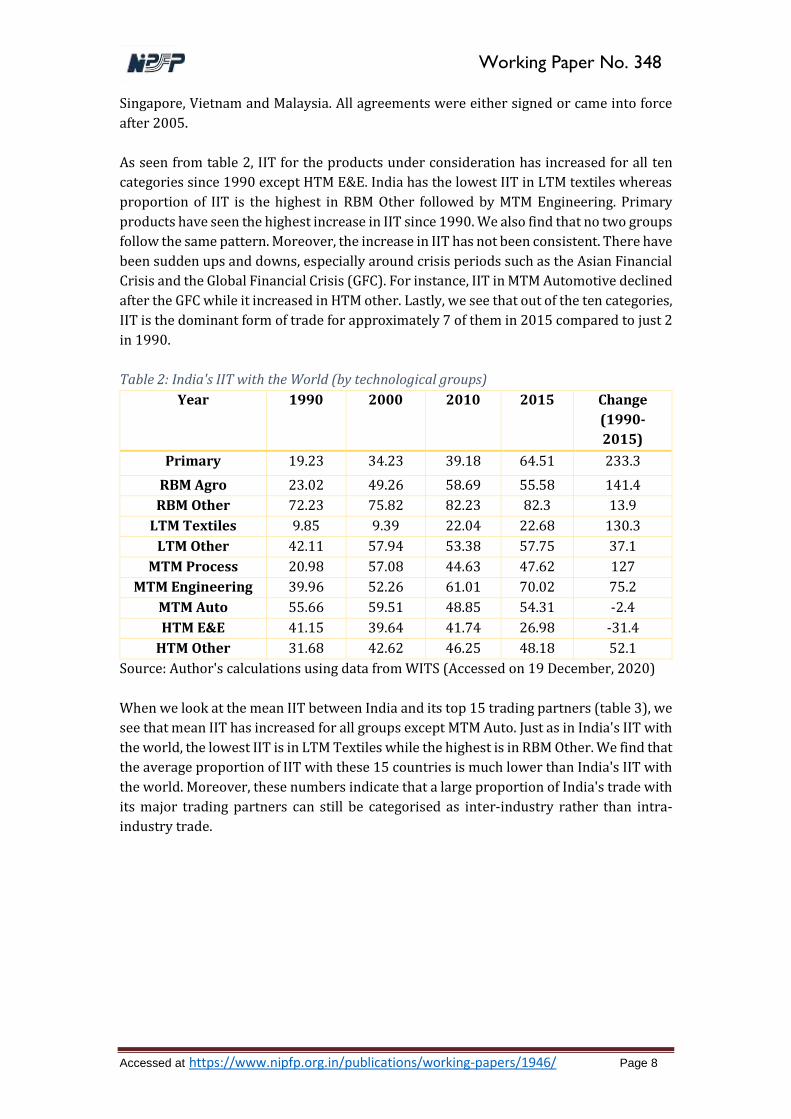
As seen from table 2, IIT for the products under consideration has increased for all ten
categories since 1990 except HTM E&E. India has the lowest IIT in LTM textiles whereas
proportion of IIT is the highest in RBM Other followed by MTM Engineering. Primary
products have seen the highest increase in IIT since 1990. We also find that no two groups
follow the same pattern. Moreover, the increase in IIT has not been consistent. There have
been sudden ups and downs, especially around crisis periods such as the Asian Financial
Crisis and the Global Financial Crisis (GFC). For instance, IIT in MTM Automotive declined
after the GFC while it increased in HTM other. Lastly, we see that out of the ten categories,
IIT is the dominant form of trade for approximately 7 of them in 2015 compared to just 2
in 1990.
Table 2: India's IIT with the World (by technological groups)
Year 1990 2000 2010 2015 Change
(1990-
2015)
Primary 19.23 34.23 39.18 64.51 233.3
RBM Agro 23.02 49.26 58.69 55.58 141.4
RBM Other 72.23 75.82 82.23 82.3 13.9
LTM Textiles 9.85 9.39 22.04 22.68 130.3
LTM Other 42.11 57.94 53.38 57.75 37.1
MTM Process 20.98 57.08 44.63 47.62 127
MTM Engineering 39.96 52.26 61.01 70.02 75.2
MTM Auto 55.66 59.51 48.85 54.31 -2.4
HTM E&E 41.15 39.64 41.74 26.98 -31.4
HTM Other 31.68 42.62 46.25 48.18 52.1
Source: Author's calculations using data from WITS (Accessed on 19 December, 2020)
When we look at the mean IIT between India and its top 15 trading partners (table 3), we
see that mean IIT has increased for all groups except MTM Auto. Just as in India's IIT with
the world, the lowest IIT is in LTM Textiles while the highest is in RBM Other. We find that
the average proportion of IIT with these 15 countries is much lower than India's IIT with
the world. Moreover, these numbers indicate that a large proportion of India's trade with
its major trading partners can still be categorised as inter-industry rather than intra-
industry trade.

Accessed at https://www.nipfp.org.in/publications/working-papers/1946/ Page 9
Working Paper No. 348
Table 3: Mean IIT between India and its top 15 trade partners
Group 1990 2000 2010 2015 Change
(1990-2015)
Primary 13.2 22.2 27.3 28.8 118.2
RBM 16.4 28.1 23.7 23.8 45.1
RBM Other 12.0 34.1 46.3 39.4 228.3
LTM Textiles 8.7 13.4 13.5 17.7 103.4
LTM Other 18.0 34.2 29.2 27.9 55
MTM Auto 32.2 28.3 18.4 29.6 -8.1
MTM Engineer 9.3 26.8 30.7 33.1 255.9
MTM Process 11.1 26.6 27.5 28.8 159.5
HTM E&E 15.8 31.2 30.7 27.2 72.2
HTM Other 16.9 29.2 28.7 27.9 65.1
Source: Author's calculations using data from WITS (Accessed on 19 December, 2020)
Section 5: Empirical Analysis
The brief literature review in section 2 gave us an overview of the factors that
theoretically and empirically affect IIT. This section uses these factors to determine their
impact on India' IIT with its partners in different product categories based on their
technology. For this purpose, we employ the gravity model wherein we model IIT as a
function of the distance between the two countries and the sizes of the two economies.
We expect the coefficient of the distance variable to be negative and the size of the two
economies to be positive. Next, we include a measure of dissimilarity, measured as the
absolute difference between per capita between the two economies. As per the theory,
dissimilarity should have a negative coefficient. However, past literature on India
indicates that dissimilarity may also be positive. We also include the variables that
measure the RCA of India and its partner country in the industry. If RCA is positive, then
IIT is trade creating and enhances efficiency. We expect it to be positive. Lastly, we include
dummy variables that indicate whether India has an FTA with the partner country. We
also allow for country fixed effects to capture country-specific factors that might be
influencing IIT.
𝐼𝐼𝑇𝑗𝑘 = 𝛼 + +𝛽1𝐷𝑖𝑠𝑠𝑖𝑚𝑖𝑙𝑎𝑟𝑖𝑡𝑦 + 𝛽2𝐿𝑜𝑔(𝐺𝐷𝑃𝑗) + 𝛽3𝐿𝑜𝑔(𝐺𝐷𝑃𝐼𝑛𝑑𝑖𝑎) + 𝛽4𝐷𝑖𝑠𝑡𝑎𝑛𝑐𝑒
+ 𝛽5𝐹𝑇𝐴 + 𝛽6𝑅𝐶𝐴𝑗𝑘 + 𝛽7𝑅𝐶𝐴𝐼𝑛𝑑𝑖𝑎
𝑘 + 𝐶𝑜𝑢𝑛𝑡𝑟𝑦 𝐹𝑖𝑥𝑒𝑑 𝐸𝑓𝑓𝑒𝑐𝑡𝑠 + 𝜀
Where j is the partner country, and k represents the technological grouping.
Accessed at https://www.nipfp.org.in/publications/working-papers/1946/ Page 10
Working Paper No. 348
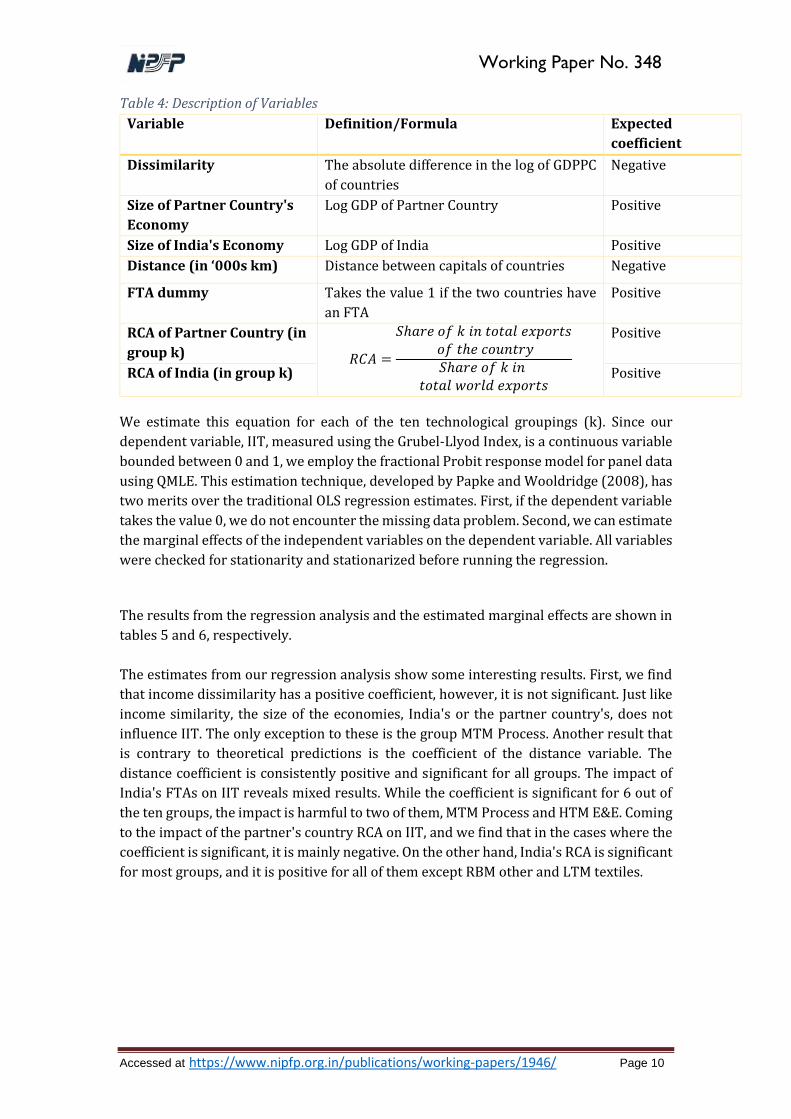
Table 4: Description of Variables
Variable Definition/Formula Expected
coefficient
Dissimilarity The absolute difference in the log of GDPPC
of countries
Negative
Size of Partner Country's
Economy
Log GDP of Partner Country Positive
Size of India's Economy Log GDP of India Positive
Distance (in ‘000s km) Distance between capitals of countries Negative
FTA dummy Takes the value 1 if the two countries have
an FTA
Positive
RCA of Partner Country (in
group k) 𝑅𝐶𝐴 =
𝑆ℎ𝑎𝑟𝑒 𝑜𝑓 𝑘 𝑖𝑛 𝑡𝑜𝑡𝑎𝑙 𝑒𝑥𝑝𝑜𝑟𝑡𝑠 𝑜𝑓 𝑡ℎ𝑒 𝑐𝑜𝑢𝑛𝑡𝑟𝑦𝑆ℎ𝑎𝑟𝑒 𝑜𝑓 𝑘 𝑖𝑛
𝑡𝑜𝑡𝑎𝑙 𝑤𝑜𝑟𝑙𝑑 𝑒𝑥𝑝𝑜𝑟𝑡𝑠
Positive
RCA of India (in group k) Positive
We estimate this equation for each of the ten technological groupings (k). Since our
dependent variable, IIT, measured using the Grubel-Llyod Index, is a continuous variable
bounded between 0 and 1, we employ the fractional Probit response model for panel data
using QMLE. This estimation technique, developed by Papke and Wooldridge (2008), has
two merits over the traditional OLS regression estimates. First, if the dependent variable
takes the value 0, we do not encounter the missing data problem. Second, we can estimate
the marginal effects of the independent variables on the dependent variable. All variables
were checked for stationarity and stationarized before running the regression.
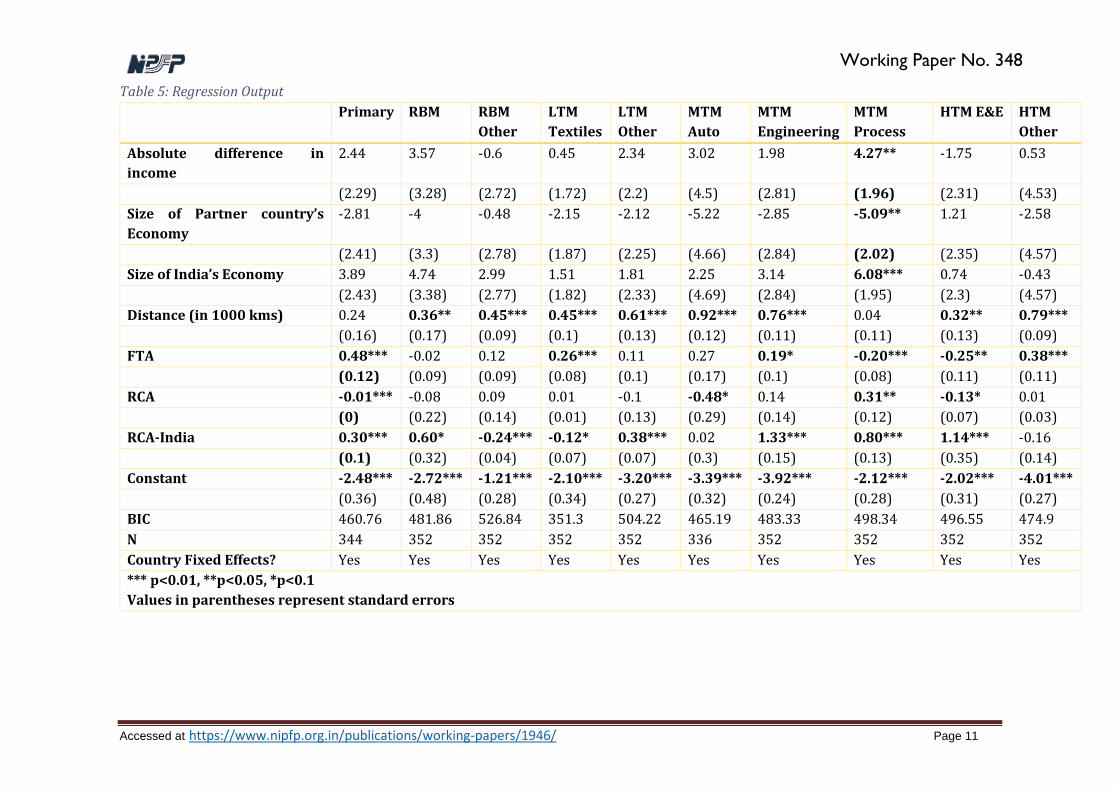
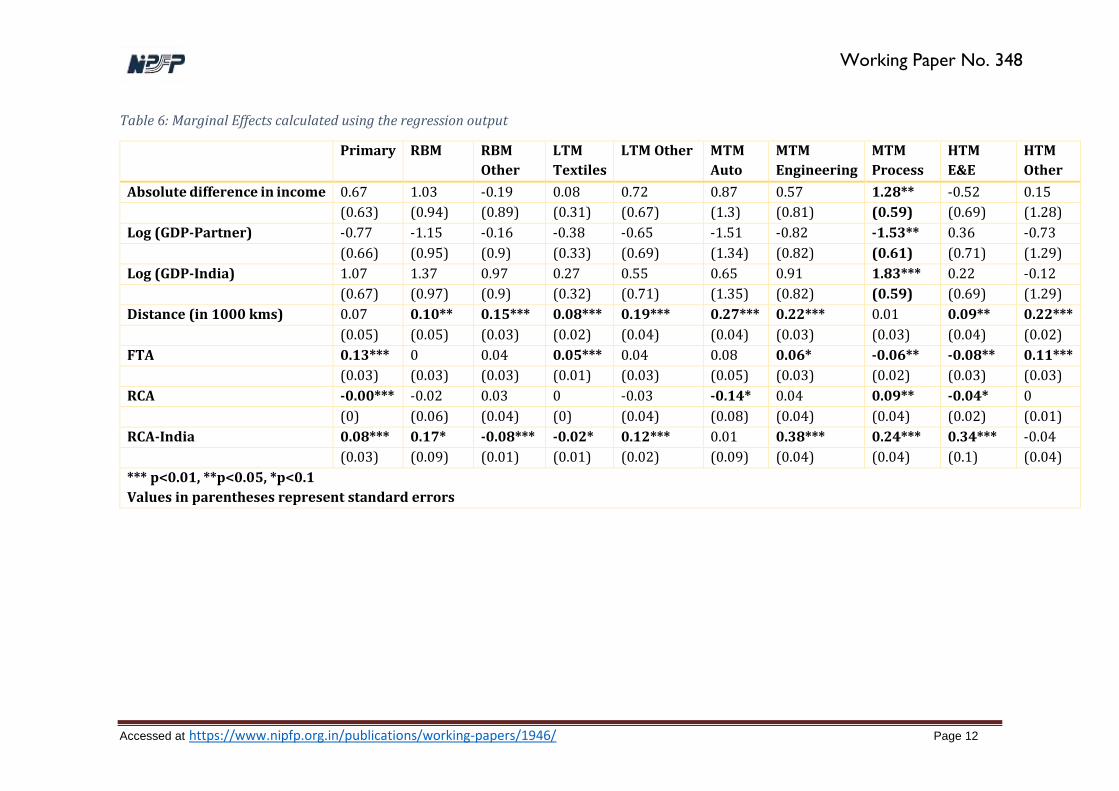
The results from the regression analysis and the estimated marginal effects are shown in
tables 5 and 6, respectively.
The estimates from our regression analysis show some interesting results. First, we find
that income dissimilarity has a positive coefficient, however, it is not significant. Just like
income similarity, the size of the economies, India's or the partner country's, does not
influence IIT. The only exception to these is the group MTM Process. Another result that
is contrary to theoretical predictions is the coefficient of the distance variable. The
distance coefficient is consistently positive and significant for all groups. The impact of
India's FTAs on IIT reveals mixed results. While the coefficient is significant for 6 out of
the ten groups, the impact is harmful to two of them, MTM Process and HTM E&E. Coming
to the impact of the partner's country RCA on IIT, and we find that in the cases where the
coefficient is significant, it is mainly negative. On the other hand, India's RCA is significant
for most groups, and it is positive for all of them except RBM other and LTM textiles.
Accessed at https://www.nipfp.org.in/publications/working-papers/1946/ Page 11
Working Paper No. 348
Table 5: Regression Output Primary RBM RBM
Other
LTM
Textiles
LTM
Other
MTM
Auto
MTM
Engineering
MTM
Process
HTM E&E HTM
Other
Absolute difference in
income
2.44 3.57 -0.6 0.45 2.34 3.02 1.98 4.27** -1.75 0.53
(2.29) (3.28) (2.72) (1.72) (2.2) (4.5) (2.81) (1.96) (2.31) (4.53)
Size of Partner country’s
Economy
-2.81 -4 -0.48 -2.15 -2.12 -5.22 -2.85 -5.09** 1.21 -2.58
(2.41) (3.3) (2.78) (1.87) (2.25) (4.66) (2.84) (2.02) (2.35) (4.57)
Size of India’s Economy 3.89 4.74 2.99 1.51 1.81 2.25 3.14 6.08*** 0.74 -0.43 (2.43) (3.38) (2.77) (1.82) (2.33) (4.69) (2.84) (1.95) (2.3) (4.57)
Distance (in 1000 kms) 0.24 0.36** 0.45*** 0.45*** 0.61*** 0.92*** 0.76*** 0.04 0.32** 0.79*** (0.16) (0.17) (0.09) (0.1) (0.13) (0.12) (0.11) (0.11) (0.13) (0.09)
FTA 0.48*** -0.02 0.12 0.26*** 0.11 0.27 0.19* -0.20*** -0.25** 0.38*** (0.12) (0.09) (0.09) (0.08) (0.1) (0.17) (0.1) (0.08) (0.11) (0.11)
RCA -0.01*** -0.08 0.09 0.01 -0.1 -0.48* 0.14 0.31** -0.13* 0.01 (0) (0.22) (0.14) (0.01) (0.13) (0.29) (0.14) (0.12) (0.07) (0.03)
RCA-India 0.30*** 0.60* -0.24*** -0.12* 0.38*** 0.02 1.33*** 0.80*** 1.14*** -0.16 (0.1) (0.32) (0.04) (0.07) (0.07) (0.3) (0.15) (0.13) (0.35) (0.14)
Constant -2.48*** -2.72*** -1.21*** -2.10*** -3.20*** -3.39*** -3.92*** -2.12*** -2.02*** -4.01*** (0.36) (0.48) (0.28) (0.34) (0.27) (0.32) (0.24) (0.28) (0.31) (0.27)
BIC 460.76 481.86 526.84 351.3 504.22 465.19 483.33 498.34 496.55 474.9
N 344 352 352 352 352 336 352 352 352 352
Country Fixed Effects? Yes Yes Yes Yes Yes Yes Yes Yes Yes Yes
*** p<0.01, **p<0.05, *p<0.1
Values in parentheses represent standard errors
Accessed at https://www.nipfp.org.in/publications/working-papers/1946/ Page 12
Working Paper No. 348
Table 6: Marginal Effects calculated using the regression output
Primary RBM RBM
Other
LTM
Textiles
LTM Other MTM
Auto
MTM
Engineering
MTM
Process
HTM
E&E
HTM
Other
Absolute difference in income 0.67 1.03 -0.19 0.08 0.72 0.87 0.57 1.28** -0.52 0.15 (0.63) (0.94) (0.89) (0.31) (0.67) (1.3) (0.81) (0.59) (0.69) (1.28)
Log (GDP-Partner) -0.77 -1.15 -0.16 -0.38 -0.65 -1.51 -0.82 -1.53** 0.36 -0.73 (0.66) (0.95) (0.9) (0.33) (0.69) (1.34) (0.82) (0.61) (0.71) (1.29)
Log (GDP-India) 1.07 1.37 0.97 0.27 0.55 0.65 0.91 1.83*** 0.22 -0.12 (0.67) (0.97) (0.9) (0.32) (0.71) (1.35) (0.82) (0.59) (0.69) (1.29)
Distance (in 1000 kms) 0.07 0.10** 0.15*** 0.08*** 0.19*** 0.27*** 0.22*** 0.01 0.09** 0.22*** (0.05) (0.05) (0.03) (0.02) (0.04) (0.04) (0.03) (0.03) (0.04) (0.02)
FTA 0.13*** 0 0.04 0.05*** 0.04 0.08 0.06* -0.06** -0.08** 0.11*** (0.03) (0.03) (0.03) (0.01) (0.03) (0.05) (0.03) (0.02) (0.03) (0.03)
RCA -0.00*** -0.02 0.03 0 -0.03 -0.14* 0.04 0.09** -0.04* 0 (0) (0.06) (0.04) (0) (0.04) (0.08) (0.04) (0.04) (0.02) (0.01)
RCA-India 0.08*** 0.17* -0.08*** -0.02* 0.12*** 0.01 0.38*** 0.24*** 0.34*** -0.04 (0.03) (0.09) (0.01) (0.01) (0.02) (0.09) (0.04) (0.04) (0.1) (0.04)
*** p<0.01, **p<0.05, *p<0.1
Values in parentheses represent standard errors
Accessed at https://www.nipfp.org.in/publications/working-papers/1946/ Page 13
Working Paper No. 348
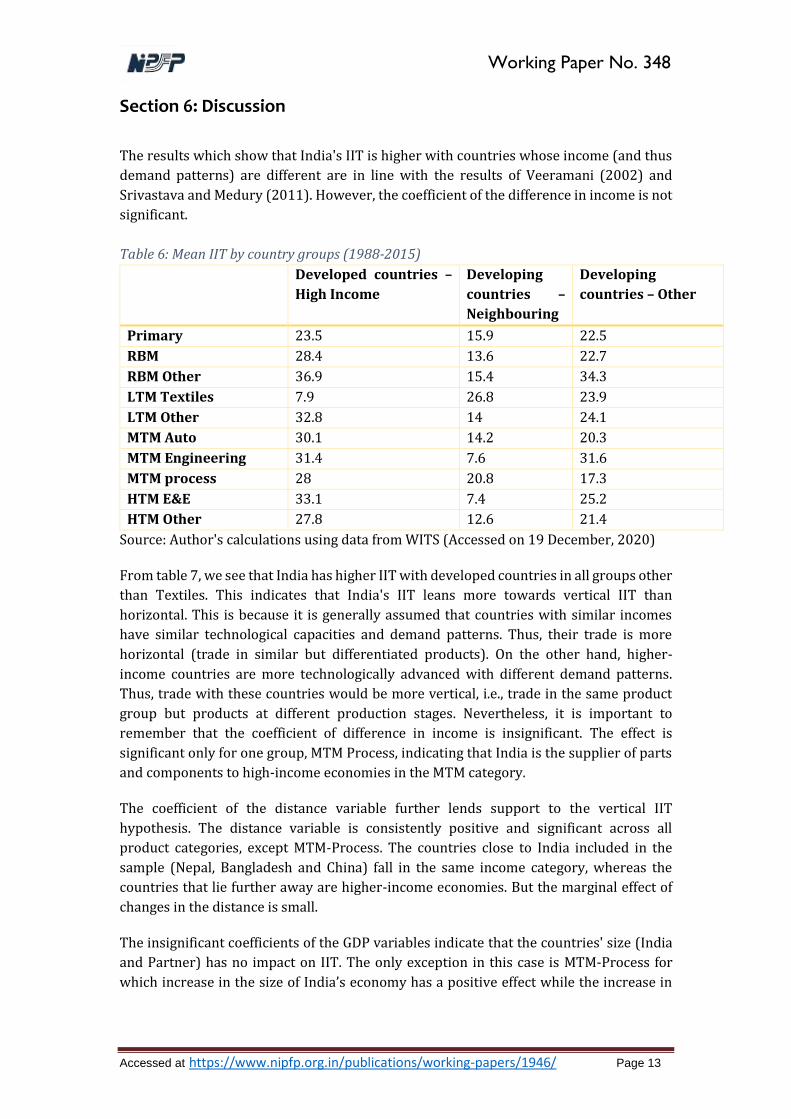
Section 6: Discussion
The results which show that India's IIT is higher with countries whose income (and thus
demand patterns) are different are in line with the results of Veeramani (2002) and
Srivastava and Medury (2011). However, the coefficient of the difference in income is not
significant.
Table 6: Mean IIT by country groups (1988-2015) Developed countries –
High Income
Developing
countries –
Neighbouring
Developing
countries – Other
Primary 23.5 15.9 22.5
RBM 28.4 13.6 22.7
RBM Other 36.9 15.4 34.3
LTM Textiles 7.9 26.8 23.9
LTM Other 32.8 14 24.1
MTM Auto 30.1 14.2 20.3
MTM Engineering 31.4 7.6 31.6
MTM process 28 20.8 17.3
HTM E&E 33.1 7.4 25.2
HTM Other 27.8 12.6 21.4
Source: Author's calculations using data from WITS (Accessed on 19 December, 2020)
From table 7, we see that India has higher IIT with developed countries in all groups other
than Textiles. This indicates that India's IIT leans more towards vertical IIT than
horizontal. This is because it is generally assumed that countries with similar incomes
have similar technological capacities and demand patterns. Thus, their trade is more
horizontal (trade in similar but differentiated products). On the other hand, higher-
income countries are more technologically advanced with different demand patterns.
Thus, trade with these countries would be more vertical, i.e., trade in the same product
group but products at different production stages. Nevertheless, it is important to
remember that the coefficient of difference in income is insignificant. The effect is
significant only for one group, MTM Process, indicating that India is the supplier of parts
and components to high-income economies in the MTM category.
The coefficient of the distance variable further lends support to the vertical IIT
hypothesis. The distance variable is consistently positive and significant across all
product categories, except MTM-Process. The countries close to India included in the
sample (Nepal, Bangladesh and China) fall in the same income category, whereas the
countries that lie further away are higher-income economies. But the marginal effect of
changes in the distance is small.
The insignificant coefficients of the GDP variables indicate that the countries' size (India
and Partner) has no impact on IIT. The only exception in this case is MTM-Process for
which increase in the size of India’s economy has a positive effect while the increase in
Accessed at https://www.nipfp.org.in/publications/working-papers/1946/ Page 14
Working Paper No. 348
partner country’s size has a negative effect. The marginal effects of these variables for
MTM-Process is also fairly large.
When we try to determine the impact that competitiveness has on IIT between India and
its partner countries, we find that the coefficient of India's RCA is significant for 8 out of
the ten categories. Moreover, of the eight categories, it is positive for all except RBM-Other
and LTM-textiles. Thus, we find that an increase in India's comparative advantage
increases its IIT. The positive coefficient of India's RCA shows that Indian trade is
efficiency-enhancing. The marginal effect of RCA is, in fact, highest in medium and high
technology manufactures, indicating that India has the potential to increase its skill and
efficiency levels in these products and benefit from added IIT. There is also potential for
developing new skills. The two products for which RCA is negative (RBM-Other and LTM-
Textiles) fall on the lower end of the skill spectrum and are largely labour-intensive.
Moreover, the marginal effect of an increase in RCA is also smaller for them. The negative
coefficient thus hints at a lack of labour in the high-income economies. Thus, these results
suggest that India should focus on increasing its RCA in higher technology commodities.
Coming to the impact of partner countries' comparative advantage on IIT, we find that it
is small and insignificant in most cases. However, out of the four groups for which it is
significant, it is negative for three out of four of them (only exception – MTM Process). The
result indicates that an increase in the comparative advantage of partner countries
reduces their IIT with India, implying that India lacks either the technological capacity or
the capacity to acquire technological know-how to compete with its partner countries.
However, the marginal effects are quite small.
Lastly, we look at the impact of India's FTA on IIT. The coefficients for FTA are significant
for 6 out of the ten income categories. However, it is negative for 2 out of the 6 categories
– MTM Process and HTM E&E. This negative coefficient implies that the agreements
signed by India have not increased IIT in these categories but have instead had a trade
diverting effect. However, for all other categories, FTA has been beneficial as IIT is welfare
increasing (exploits economies of scale and allows for increased variety in consumption).
Thus, contrary to the argument that India's FTAs have not been beneficial as they have
resulted in an increased trade deficit, we do find that the signing of FTAs has been welfare
enhancing.
What is happening with MTM process?
Having discussed all our variables, we would like to focus on one product group that has
consistently emerged as an exception in our discussion, MTM Process. This category is
primarily made up of chemicals (paints, pigments, perfumes, soaps) and plastic products
(tubes, plates, sheets). It also includes a few other products such as railway vehicles,
trailers, and steel pipes and tubes.
Our results indicate that India and its partner countries' RCAs have a positive effect on
IIT. Thus, an increase in efficiency by either country (India or partner) increases IIT in
this category. When we look at India's RCA in the MTM process, we see that India does not
Accessed at https://www.nipfp.org.in/publications/working-papers/1946/ Page 15
Working Paper No. 348
have a comparative advantage in this category. Nevertheless, the RCA values have
gradually been increasing. The value of RCA was 0.4 in 1988 and has increased to 0.8, even
reaching a value of 1 in some years. Thus, India has potential in this sector, and an
improvement in efficiency will bring about added benefits in increasing IIT.
Next, we see that an increase in the size of the partner country reduces IIT while an
increase in India's size increases IIT. The significant marginal effects of the two variables
indicate that the group is susceptible to changes in the sizes of the economies. We believe
that this trend is because the share of this sector in India is small. We study the plastics
sctor in somewhat greater detail. Processing capacity has been growing at about 11% a
year over the last 5 years, considerably faster than the growth in consumption about 7
percent a year.and production of 4% a year (Plastindia.2018) Considerable investment
has taken palce in the industry and the technology is modern as there are considerable
imports. The industry is heavily concnetrated, with the three largest firms accounting for
over 60% of the output and the largest firm over 40% of the output (Plastindia, 2018).
India’s trade in plastics is mostly in Asia. China accoumts for almost of India’s imports
whereas Asia as a whole accounts for over 40 % of exports (Plastindia, 2018). If we look
at the share of plastics and rubber in manufacturing output, we find that the share has
hovered around 15-18 per cent since 1988. However, the sector's share (only SITC 5-8)4
in exports is minimal. In 1988, it accounted for only 3 per cent of India's exports, and it
grew to approximately 7 per cent by 2015. However, the trade agreements that india has
signed with Asian countrie should give a filip to trade in plastics. Domestic demand is also
expected to grow rapidly led by automotive componenets, consumer durables and
electronic items, pushed bu government;s digital india policy, and packaging as the
pandemic is leading to increasing purchases from eplatforms which require more
packaging.
On the other hand, the share of imports was high initially, hovering between 9-11 per cent
between 1988 and 1991. Although it came down to 5 per cent in the early 2000s, it has
increased to approximately 8 per cent in recent years. Thus, as partner economies grow,
India's sector becomes even smaller relatively. On the other hand, as India and its sector
grow, the size of the sector becomes more comparable to other countries. This story is
further corroborated by the sign and the marginal effect of the similarity variable, which
is positive and large. As the economies become similar and more comparable, the IIT is
likely to increase between the economies.
The relatively small size of the sector also explains why the results indicate that the group
is susceptible to trade diversion. The production concentration suggests monopolistic
inefficiencies that should encourage trade and the trade agreements with Asian countries
might have resulted in trade diversion. But growth prospects suggest that there might be
trade creation.
Therefore, an analysis of this category reveals that this sector has potential for higher IIT
and gains from it if India can enhance its efficiency and increase its size.
4 The group has 28 products at the 3rd digit in total of which 26 are from SITC groups 5-8. The two products thus excluded from our study in this group are products 266 (Synthetic fibres suitable for spinning) and 267 (Other man-made fibres suitable for spinning).
Accessed at https://www.nipfp.org.in/publications/working-papers/1946/ Page 16
Working Paper No. 348
Section 7: Conclusion
The paper sought to examine India's IIT with its top 15 partner countries. For this
purpose, the products from SITC Rev. 3 groups 5 to 8 were divided into ten categories
based on their technological content. The analysis of India's IIT in these categories
showed that although IIT has increased in recent years and is the dominant form of trade
with the world, India's trade with its top 15 partners still largely falls under the category
of inter-industry trade. India has the highest IIT in Resource-based manufactures,
whereas IIT is the lowest in low technology-intensive textiles.
The empirical analysis conducted to determine the factors of IIT revealed that India's RCA
plays a significant role in increasing IIT for technological categories. We also find that
India's FTAs have been IIT enhancing. Thus, in contrast to the notion that India has not
benefitted from its FTAs, we find that IIT has increased with FTA partners. Thus, there are
benefits to be derived from trade agreements. Moreover, contrary to theory and previous
empirical findings in this area, we find that India's IIT increases with distance. However,
this result, we believe, indicates the dominance of India's IIT with developed countries
that located far away and lower IIT with its developing neighbours.
Lastly, a particular focus on medium technology process-based manufactures reveals that
the existence of potential to be exploited in this category. An increase in efficiency and
overall growth in the Indian economy can benefit this sector. However, the sector is
susceptible to trade diversion from FTAs due to its relatively small size.
Thus, the paper provides some insightful results about the nature of India's IIT and the
factors that play an essential role in driving it. This paper is a vital addition to the
literature on IIT in India, mainly because of its innovative way of categorising products.
However, it is essential to remember that while the classification of goods into
technological categories using the Lall classification is widely accepted and used, it is
subjective. Also, the nature of goods constantly changes due to technological changes.
Hence, several products may be wrongly categorised.
An important point to note here is that the study does not consider the role of
multinationals or FDI in IIT. In recent years, MNCs and FDI have been instrumental in
driving the extent of IIT between countries. As more and more MNCs outsource or
offshore their production processes, there is an increase in IIT due to trade in parts and
unfinished goods. This IIT is, more often than not, vertical. Despite the importance of
MNCs and FDI, these factors have been ignored since they use different indices to measure
the share of IIT that is vertical and horizontal. Such distinction between the two types
would give us more insight into the factors determining IIT and lead to better policy
recommendations.
Accessed at https://www.nipfp.org.in/publications/working-papers/1946/ Page 17
Working Paper No. 348
References
Aditya, A., & Gupta, I. (2019). Intra-industry Trade of India. Is It Horizontal or Vertical?
Economic and Political Weekly, 54(25).
Aggarwal, S., & Chakraborty, D. (2019). Which Factors Influence India's Intra-Industry
Trade? Empirical Findings for Select Sectors. Global Business Review.
https://doi.org/10.1177/0972150919868343
Bagchi, S. (2017). Is Intra-industry Trade Gainful? Evidence from Manufacturing
Industries of India. India Studies in Business and Economics Globalisation of
Technology, 229-251. doi:10.1007/978-981-10-5424-2_10
Balassa, Bela. 1963. "An Empirical Demonstration of Classical Comparative Cost Theory."
The Review of Economics and Statistics 231-238.
Balassa, Bela. 1966. "Tariff Reductions and trade in manufactures among industrial
countries." American Economic Review 466-473.
Balassa, Bela. 1979. "Intra-industry trade and the integration of the developing countries
in the world economy." In On the Economics of Intra-Industry Trade: Symposium
1978, by Herbert Giersch, 245-270. Mohr.
Bhadouria, P. S., & Verma, N. (2012). Intra-industry trade in textile industry: The case of
India. International Journal of Economics and Business Research, 4(1/2), 199.
doi:10.1504/ijebr.2012.044253
Burange, L. G., & Chaddha, S. J. (2008). India's Revealed Comparative Advantage in
Merchandise Trade. Artha Vijnana: Journal of The Gokhale Institute of Politics and
Economics, 50(4), 332. doi:10.21648/arthavij/2008/v50/i4/115413
Das, R. U., & Dubey, J. (2014). Mechanics of Intra-Industry Trade and FTA Implications for
India in RCEP. SSRN Electronic Journal. doi:10.2139/ssrn.2430185
Globerman, Steven. 1992. “Weltwirtschaftliches Archib.” Weltwirtschaftliches Archiv 487-
497.
Grubel, HG 1967. "Intra-Industry Specialisation and the Pattern of Trade." Canadian
Journal of Economics and Political Science, 374-388.
Grubel, HG, and PJ Llyod. 1975. Intra-Industry Trade. London: The Macmillian Press Ltd.
Helpman, E. 1981. "International trade in the presence of production differenciation,
economies of scale and monopolistic competition." Journal of International
Economics 305-340.
Helpman, E. 1987. “Imperfect competition and international trade: Evidence from
fourteen industrial countries.” Journal of the Japanese and International Economies
62-81.
Kojima, K. 1964. "The Pattern of International Trade Among Advanced Countries."
Hitotsubashi Journal of Economics 16-34.
Krugman, Paul. 1979. "Increasing Returns, Monopolistic Competition, and International
Trade." Journal of International Economics 469-479.
Accessed at https://www.nipfp.org.in/publications/working-papers/1946/ Page 18
Working Paper No. 348
Krugman, Paul. 1981. "Intra-Industry specialisation and the gains from trade." Journal of
Political Economy 959-973.
Helpman, E. 1987. "Imperfect competition and international trade: Evidence from
fourteen industrial countries." Journal of the Japanese and International Economies
62-81.
Lall, Sanjaya. 2000. "The Technological Structure and Performance of Developing Country
Manufactured Exports, 1985‐98." Oxford Development Studies 337-369.
Lancaster, K. 1980. "Intra-industry trade under perfect monopolistic competition."
Journal of International Economics 151-176.
Leontief, W. W. (1936). Quantitative Input and Output Relations in the Economic Systems
of the United States. The Review of Economics and Statistics, 18(3), 105.
doi:10.2307/1927837
Linder, S.B. 1961. An Essay on Trade and Transformation. New York: John Wiley.
Lloyd, P. J., & Yi, H. (2005). Frontiers of research in intra-industry trade. Basingstoke:
Palgrave Macmillan.
Manrique, G. (1987). Intra-Industry Trade between Developed and Developing Countries:
The United States and the NICs. The Journal of Developing Areas, 21(4), 481-494.
Retrieved from https://www.jstor.org/stable/4191595.
Papke, L. E., & Wooldridge, J. M. (2008). Panel data methods for fractional response
variables with an application to test pass rates. Journal of Econometrics, 145(1-2),
121-133. doi:10.1016/j.jeconom.2008.05.009
Plastindia 2018, Empowering Growth Annual Report, 2018, Plastindia Foundation,
Mumbai, India.
Srivastava, A., & Medury, Y. (2011). An Overview of India's Intra-Industry Trade. Asia-
Pacific Journal of Management Research and Innovation, 7(1), 153-160. Retrieved
from https://doi.org/10.1177/097324701100700112.
Varma, P., & Ramakrishnan, A. (2014). An Analysis of the Structure and the Determinants
of Intra-industry Trade in Agri-food Products: Case of India and Selected FTAs.
Millennial Asia, 5(2), 179-196. doi:10.1177/0976399614541193
Veeramani, C. (2002). Intra-Industry Trade of India: Trends and Country-Specific Factors.
Review of World Economics (Weltwirtschaftliches Archiv). 138. 509-533.
10.1007/BF02707952.
Veeramani, C. (2007). Industry-Specific Determinants of Intra-Industry Trade in India.
Indian Economic Review, 42(2), new series, 211-229. Retrieved March 14, 2021,
from http://www.jstor.org/stable/29793889
Verdoorn, P.J. 1960. “The Intra-Bloc Trade of Benelux.” In EAG Economic Consequences of
the Size of Nations, by J Robinson. London: Macmillan.
MORE IN THE SERIES
Mehta, D., and Mukherjee, S.,
(2021). Emerging Issues in GST Law
and Procedures: An Assessment,
W.P. No. 347 (August).
Pandey, S. G., (2021). Evolution of
cooperative networks, W.P. No.
346 (August).
Kundu, R. P., and Pandey, S. G.,
(2021). Multiple Public Goods in Networks, W.P. No. 345 (August).
Manmohan Agarwal, is retired
professor, JNU, Delhi, and a retired
Reserve Bank of India professor,
Centre for Development Studies,
Trivandrum and an adjunct senior
fellow at RIS.
Neha Betai, is an academic associate
at the Indian Institute of Management,
Bangalore.
National Institute of Public Finance and Policy,
18/2, Satsang Vihar Marg, Special Institutional Area (Near JNU), New Delhi 110067
Tel. No. 26569303, 26569780, 26569784
Fax: 91-11-26852548 www.nipfp.org.in