interrill soil erosion processes: i. effect of surface sealing on infiltration, runoff, and soil...
TRANSCRIPT

Interrill Soil Erosion Processes: I. Effect of Surface Sealingon Infiltration, Runoff, and Soil Splash Detachment1
J. M. BRADFORD, J. E. FERRIS, AND P. A. REMLEY2
ABSTRACTSoil erosion from interrill areas is a function primarily of soil
detachment by raindrop impact and transport capacity of thin sheetflow. Soil detachment normally is the rate-determining process andis controlled, to a large extent, by surface sealing and crusting. Thepurpose of this study was to measure the effect of surface sealingon infiltration, runoff, and soil loss for 20 soils ranging in texturefrom sand to clay. Wash and splash erosion were measured for near-saturated soils in 0.14-nr Al pans exposed to laboratory simulatedrainfall with an intensity of about 63 mm/h for 1 h. For most soils,wash and splash amounts decreased with time due to surface sealingwith the decrease in wash being much less than the decrease insplash. Comparing the 20 soils, surface sealing caused a reductionin infiltration rate ranging from 1.2 to 36.0 mm/h and an increasein shear strength ranging from 2.6 to 42.3 kPa, resulting in a de-crease in total soil loss ranging from 13.3 to 56.8 g/5 min. Totalsoil loss, splash, and wash were highly intercorrelated (p <0.001).
Additional Index Words: erosion mechanics, soil strength, soilerodibility, raindrop impact.
Bradford, J.M., J.E. Ferris, and P.A. Remley. 1987. Interrill soilerosion processes: I. Effect of surface sealing on infiltration, runoff,and soil splash detachment. Soil Sci. Soc. Am. J. 51:1566-1571.
ERODIBILITY OF INTERRILL AREAS is a function pri-marily of soil detachment by raindrop impact and
transport capacity of thin sheet flow (Meyer et al,1975). The detachment capacity of interrill flow is neg-ligible compared to that of raindrop splash (Youngand Wiersma, 1973) due to the low magnitude of theshear stresses caused by thin sheet flow. Hudson (1971)estimated kinetic energy of rainfall to be about 260times greater than that of surface flow. Splash trans-port to rills contributes only a small portion of thetotal soil movement in field situations since only asmall percentage of the land surface contains rills(Meyer et al., 1975). Young and Wiersma (1973) foundthat only 17.7 and 6.4% of the total soil detached fromthe interrill area for a loam and a sandy loam soil,respectively, were transported to the rill by raindropsplash, at a steady-state soil loss condition. Most ofthe material transported from the interrill area endsup in a rill through thin surface flow. For the loam,silt loam, and sandy loam soils studied by Young andWiersma (1973), 80 to 85% of the soil loss originatingin the interrill area was transported to a rill beforeleaving the plot. The energy of the impacting raindrop,however, is responsible for detaching most of the ma-terial actually transported by interrill flow.
Among the factors controlling interrill soil detach-ment are rainfall intensity (Meyer, 1981; Moldenhauerand Long, 1964), surface water depth (Moss and Green,1983), aggregate stability (Young and Onstad, 1978;Luk, 1979; Meyer and Harmon, 1984), surface water
1 Contribution from USDA-ARS, National Soil Erosion Res. Lab.,West Lafayette, IN, in cooperation with the Purdue Agric. Exp. Stn.Journal no. 11005. Received 29 Dec. 1986.
2 Soil Scientists, USDA-ARS, and Research Associate, Dep. ofAgronomy, respectively, Purdue Univ., West Lafayette, IN 47907.
content (Poesen and Savat, 1981), organic matter(Young and Onstad, 1978), and infiltration rate (Mol-denhauer and Long, 1964). Interrill detachment is atime-dependent process, influenced by changes in soilproperties with time as the surface seal and crust de-velop. The purpose of this study was to measure theeffect of surface sealing on infiltration, runoff, and soilloss for 20 soils varying in texture from sand to clay.We define surface sealing as the initial phase or wet-ting phase in crust formation and crusting as the sub-sequent drying phase (Romkens, 1979).
MATERIALS AND METHODSSoil materials used in this study were taken from Ap ho-
rizons of 19 soil series (Bradford et al., 1986). Soil series,family classification, and particle size are given in Table 1.Particle size was determined by the pipet method (Day, 1965).Each soil was air-dried, ground to an aggregate or particlediameter slightly larger than 2 mm, and sieved through a 2-mm screen. A 75-mm layer of soil was then placed over a125-mm layer of sand in a 320-mm wide by 450-mm longby 200-mm deep Al erosion pan. The pan was dropped 10times, falling about 10 mm, to pack the soil materials. Ad-ditional soil material was added until soil was level with thetop of the pan. Initial bulk density was calculated from totalsoil mass.
Soil was wetted with deionized water forced upwardthrough three drains in the bottom of the pan. Using theerosion pan as a tension table, the matric potential at thesoil surface was maintained at 0 kPa for 48 h. The waterpotential at the soil surface was then lowered to —0.5 kPa,and after 3 h, surface soil shear strength was measured usingthe Swedish fall-cone device (Al-Durrah and Bradford, 1981)and calibration tables of Hansbo (1957). Soil within the ero-sion pan was resaturated for 12 to 14 h (overnight), and thewater level was lowered to 200 mm below the surface. After1 h, the erosion pan was placed at a 9% slope directly undera laboratory simulator (Mutchler and Moldenhauer, 1963).A 540-mm high splash shield with a splash collection troughthat surrounded both sides and the upslope end of the ero-sion pan was placed over the pan (Fig. 1). Simulated rainfallwas applied for 1 h at an intensity of 62.8 ± 1.6 mm/h.Drop diameter averaged 4.6 ± 0.1 mm and drop height was4.57 m. A 1-h storm delivered 0.18 J/cm2 of rainfall energy.Throughout the run, infiltration was measured at 5-min in-tervals by collecting water from the three drainage outletswith the free water surface 200 mm below the downslopesoil surface in the box.
Runoff and splash losses were taken at 5-min intervals.Splash was collected from the lower ends of both sides ofthe splash collection trough (Fig. 1) by washing the soil ma-terial from the splash shield into the troughs and then intocollection bottles using a water spray from a plastic waterbottle. The soil material that was collected from the splashshield, oven-dried, and weighed is referred to as splash (S),and the soil collected from the runoff is referred to as wash(W). Wash cannot be equated entirely with the portion ofsoil transported by surface flow, because much of the washis raindrop detached soil splashed downslope into the runoffcollection device. Total soil loss (E) is the sum of splash andwash material.
Immediately following each simulator run, the pan wasreturned to a level position, resaturated, and the matric po-tential at the soil surface was again adjusted to —0.5 kPa
1566

BRADFORD ET AL: INTERRILL SOIL EROSION PROCESSES: I. 1567
EEO
6mm
vn
IM
1
Soil material
FTv
60
- Woterdropshield
-Plexiglossplash shield
-Splashcollectiontrough
•Aluminumerosion pan
aDrainage outlet
Fig. 1. Cross-sectional view of splash apparatus and erosion pan.
and allowed to equilibrate for 3 h. Soil shear strength wasthen determined, using the Swedish fall-cone (Bradford etal., 1986). Erosion pan runs for each soil were replicatedtwice in a randomized block design.
RESULTS AND DISCUSSIONFive soils ranging in texture from sand to clay and
having widely varying runoff and erosion character-istics were selected for detailed evaluation of the change
50
40
30
o:20
O AvonburgO Hoytville
BloomfieldA Xenia
Oceano fine sand
0 .05 .10 .15 .20CUMULATIVE RAINFALL ENERGY, J cm'2
Fig. 2. Infiltration rate curves for five soils from 63 mm of simulatedrainfall for 60 min.
in erosion behavior with time (Fig. 2-7). These areBloomfield sand, Oceano fine sand, Avonburg siltloam, Xenia silt loam, and Hoytville clay. The fivesoils represent the type of differences in runoff anderosion behavior expected within the group of soilsstudied. For the other 15 soils, soil losses and infiltra-tion rates are tabulated in Table 2. Since runoff anderosion amounts changed with time, maximum orminimum values and the difference between these val-ues during the 60-min period are presented. In thecase of runoff and infiltration amounts, these valueswere usually the initial and final sampling period val-ues; however, this was not true for the erosion param-eters.
Infiltration and Runoff RatesInfiltration rates of most soils decrease with time
during a rainstorm for a number of reasons, one ofwhich is surface sealing (Edwards and Larson, 1964;Moldenhauer and Long, 1964; Mannering, 1967). Thisdecrease is a major cause of increased surface runoffand erosion (Moldenhauer and Long, 1964). Figure 2shows the relationship between infiltration rate (I) forfive soils and cumulative rainfall kinetic energy for a
Table 1. Classification and primary particle size of the 20 soils studied.
Soil series
AlfordAvonburgBloomfieldCecilDickinsonGeorgevilleGreenvilleHobsonHoytvilleIdaIredeUMarshallMenfroMononaOceano coarse s4Oceano fine s.JPutnamTamaXeniaZipp
t According to Soil
Family classificationt
Fine-silty, mixed, mesic Typic HapludalfsFine-silty, mixed, mesic Aerie FragiaqualfsCoarse-loamy, mixed, mesic Psammentic HapludalfsClayey, kaoUnitic, thermic Typic HapludultsCoarse-loamy, mixed, mesic Typic HapludultsClayey, kaolinitic, thermic Typic HapludultsClayey, kaolinitic, thermic Rhodic PaleudultsFine-loamy, siliceous, mesic Typic FragiudalfsFine, illitic, mesic Mollic OchraqualfsFine-silty, mixed (calcareous), mesic Typic UdorthentsFine-montmorillonitic, thermic Typic HapludalfsFine-silty, mixed, mesic Typic HapludollsFine-silty, mixed, mesic Typic HapludalfsFine-silty, mixed, mesic Typic HapludollsMixed, thermic Alfic XeropsammentsMixed, thermic Alfic XeropsammentsFine, montmorillonitic, mesic Mollic AlbaqualfsFine-silty, mixed, mesic Typic ArgiudollsFine-silty, mixed, mesic Aquic HapludalfsFine, mixed, nonacid, mesic Typic Haplaquepts
Taxonomy (Soil Survey Staff, 1975).
Sand(2-0.05 mm)
333916945205259105
66485
898944
1210
Silt(0.05-0.002 mm)
—————— % —————77556
1436592934357125687967
67
74667067
Clay(< 0.002 mm)
20123
171921197
55249
28132854
22301823
Textural
silsilssi1sil1sicsilsisiclsilsiclsssilsiclsilsil
t Two soils of this series were evaluated. One soil was composed primarily of coarse sands; the other, fine sand.
1568 SOIL SCI. SOC. AM. J., VOL. 51, 1987
40
30
20u.u.o§10or
AvonburgHoytvilleBloomfieldXeniaOceano fine sand
.05CUMULATIVE
TJ20c'Ein 100o>
UJ 80
60COo
40
820
.10RAINFALL cm-2 .20.15
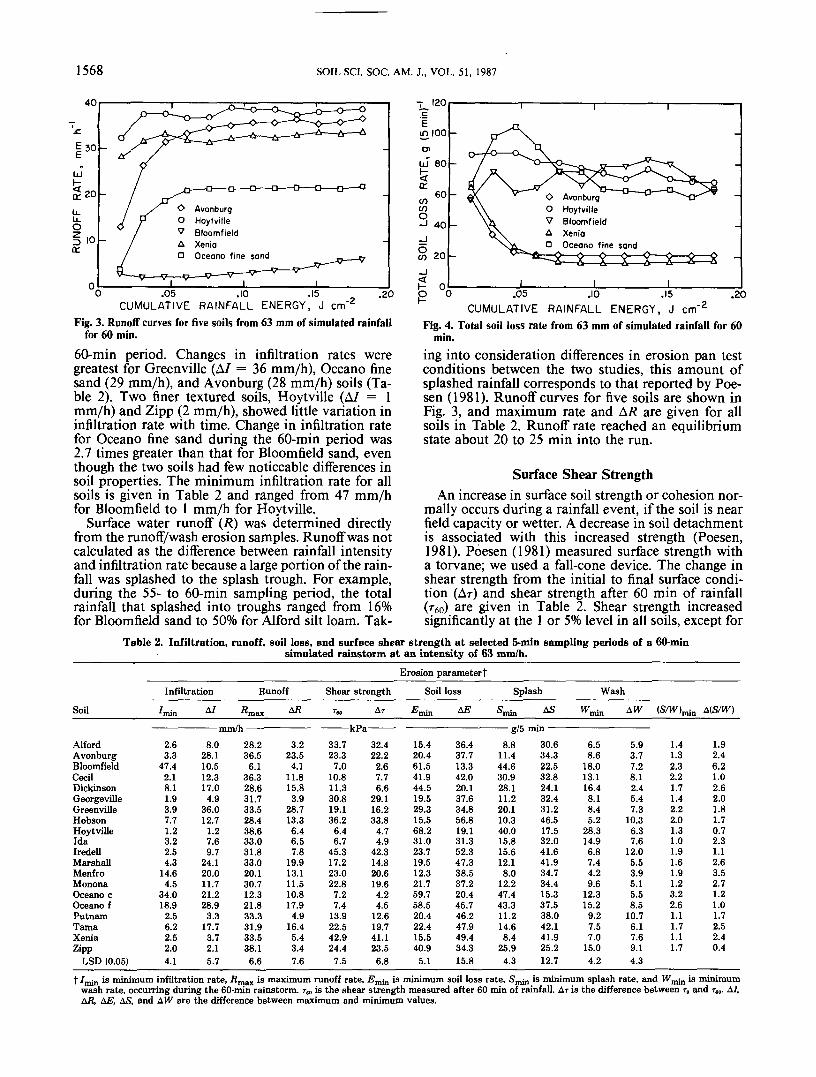
ENERGY, JFig. 3. Runoff curves for five soils from 63 mm of simulated rainfall
for 60 min.
60-min period. Changes in infiltration rates weregreatest for Greenville (A/ = 36 mm/h), Oceano finesand (29 mm/h), and Avonburg (28 mm/h) soils (Ta-ble 2). Two finer textured soils, Hoytville (A/ = 1mm/h) and Zipp (2 mm/h), showed little variation ininfiltration rate with time. Change in infiltration ratefor Oceano fine sand during the 60-min period was2.7 times greater than that for Bloomfield sand, eventhough the two soils had few noticeable differences insoil properties. The minimum infiltration rate for allsoils is given in Table 2 and ranged from 47 mm/hfor Bloomfield to 1 mm/h for Hoytville.
Surface water runoff (R) was determined directlyfrom the runoff/wash erosion samples. Runoff was notcalculated as the difference between rainfall intensityand infiltration rate because a large portion of the rain-fall was splashed to the splash trough. For example,during the 55- to 60-min sampling period, the totalrainfall that splashed into troughs ranged from 16%for Bloomfield sand to 50% for Alford silt loam. Tak-
O HoytvilleV BloomfieldA Xeniaa Oceano fine sand
I I.20
-2•> 0 .05 .10 .15
CUMULATIVE RAINFALL ENERGY, J cmFig. 4. Total soil loss rate from 63 mm of simulated rainfall for 60
ing into consideration differences in erosion pan testconditions between the two studies, this amount ofsplashed rainfall corresponds to that reported by Poe-sen (1981). Runoff curves for five soils are shown inFig. 3, and maximum rate and A/? are given for allsoils in Table 2. Runoff rate reached an equilibriumstate about 20 to 25 min into the run.
Surface Shear StrengthAn increase in surface soil strength or cohesion nor-
mally occurs during a rainfall event, if the soil is nearfield capacity or wetter. A decrease in soil detachmentis associated with this increased strength (Poesen,1981). Poesen (1981) measured surface strength witha torvane; we used a fall-cone device. The change inshear strength from the initial to final surface condi-tion (Ar) and shear strength after 60 min of rainfall(T60) are given in Table 2. Shear strength increasedsignificantly at the 1 or 5% level in all soils, except for
Table 2. Infiltration, runoff, soil loss, and surface shear strength at selected 5-min sampling periods of a 60-minsimulated rainstorm at an intensity of 63 mm/h.
Erosion parametert
Infiltration
Soil Mnin A/
Runoff
Rmax Afl
————————— mm/h —————————AlfordAvonburgBloomfieldCecilDickinsonGeorgevilleGreenvilleHobsonHoytvilleIdaIredellMarshallMenfroMononaOceano cOceano fPutnamTamaXeniaZipp
LSD (0.05)
2.63.3
47.42.18.11.93.97.71.23.22.54.3
14.64.5
34.018.9
2.56.22.52.04.1
8.028.110.512.317.04.9
36.012.7
1.27.69.7
24.120.011.721.228.93.3
17.73.72.15.7
28.236.56.1
36.328.631.733.528.438.633.031.833.020.130.712.321.833.331.933.538.16.6
3.223.54.1
11.815.83.9
28.713.36.46.57.8
19.913.111.510.817.94.9
16.45.43.47.6
Shear strength
Tto AT
Soil lossEmin AE
HA a
33.723.37.0
10.811.330.819.136.2
6.46.7
45.317.223.022.8
7.27.4
13.922.542.924.47.5
32.422.22.67.76.6
29.116.233.8
4.74.9
42.314.820.619.64.24.5
12.619.741.123.56.8
15.420.461.541.944.519.529.315.568.231.023.719.512.321.759.758.520.422.415.540.95.1
36.437.713.342.020.137.634.856.819.131.352.347.338.537.220.445.746.247.949.434.315.8
Splashsmin
——— g/58.8
11.444.630.928.111.220.110.340.015.815.612.18.0
12.247.443.311.214.68.4
25.94.3
AS
min ——30.634.322.532.824.132.431.246.517.532.041.641.934.734.415.337.538.042.141.925.212.7
WashWmin
6.58.6
18.013.116.48.18.45.2
28.314.96.87.44.29.6
12.315.29.27.57.0
15.04.2
AW
5.93.77.28.12.45.47.3
10.36.37.6
12.05.53.95.15.58.5
10.76.17.69.14.3
(S/WOmin
1.41.32.32.21.71.42.22.01.31.01.91.61.91.23.22.61.11.71.11.7
A(S/W)
1.92.46.21.02.62.01.81.70.72.31.12.63.52.71.21.01.72.52.40.4
t /„,„, is minimum infiltration rate, fimax is maximum runoff rate, is minimum soil loss rate, Smin is minimum splash rate, and 's minimumwash rate, occurring during the 60-min rainstorm. TM is the shear strength measured after 60 min of rainfall. AT is the difference between TO and rM. A/,Afl, AB, AS, and AW are the difference between maximum and minimum values.

BRADFORD ET AL.: INTERRILL SOIL EROSION PROCESSES: I. 1569
100
,0 80
C7>
UJ 60
co 40O
CLCO
O AvonburgO HoytvilleV BloomfieldA Xeniaa Oceano fine sand
0 .05 .10 .15 .20CUMULATIVE RAINFALL ENERGY, J cm'2
Fig. 5. Splash soil loss rate from 63 mm of simulated rainfall for60 min.
the two Oceano sands, Bloomfield, and Hoytville, thethree sands, and the one clay soil, respectively. Shearstrength increased the most for the Iredell (Ar = 42kPa) and Xenia (Ax = 41 kPa) soils. Absolute valuesof strength for the surface-sealed condition ranged from45 kPa for Iredell to 6 kPa for Hoytville.
Total, Splash, and Wash Soil LossThe infiltration and shear strength data suggest that
some soil properties change continuously during anerosion event. These changes in surface soil charac-teristics cause differences in the amount of erosionduring a rainstorm. The extent of change in surfaceproperties among soils is shown in total soil loss curvesin Fig. 4. Total soil loss for the Avonburg and Xeniasoils declined rapidly after rainfall application, reach-ing an equilibrium soil loss rate about 20 min into therun. Total soil loss rate for Oceano fine sand reacheda maximum at 15 min and then gradually decreasedthroughout the run. Total soil loss for the Bloomfieldand Hoytville soils decreased only slightly. Differencesbetween maximum and minimum erosion rates (AE)ranged from 13 g/5 min for Bloomfield to 57 g/5 minfor Hobson (Table 2). Minimum soil loss rate (Emin)was greatest for the clay (Hoytville, 68 g/5 min) andthe three sands (Bloomfield, 62 g/5 min; Oceano coarsesand, 60 g/5 min; and Oceano fine sand, 59 g/5 min),and least for Menfro silt loam (12 g/5 min).
Figures 5 and 6 show splash and wash loss curves,respectively, for five soils as a function of applied rain-fall energy. Since water potential at the soil surfacewas —2.0 kPa at initiation of rainfall, splash loss rateincreased with time for Bloomfield and Oceano soilsuntil the surface became near-saturated and then de-creased. For the other 17 soils, the splash loss de-creased to a minimum followed, in a few cases, by aslight increase. Differences in splash between the max-imum and minimum rates (AS) represents extent ofsurface sealing. All soils showed large differences insplash amounts with larger differences for mediumtextured soils (Hobson, 47 g/5 min; Xenia, Tama, Ire-dall, and Marshall, 42 g/5 min), and lower differencesfor the finest textured soil (Hoytville, 18 g/5 min) andthe coarsest textured soil (Oceano coarse sand, 15 g/5 min). During the period of minimum splash, splashloss (Smin) was lowest for three silt loams (Menfro,
40
Em 30
LU
<20tr
COO
10xCOI
O AvonburgO HoytvilleV Bloomfield
I I.05 .10 .15 .20
CUMULATIVE RAINFALL E N E R G Y , J cm"2
Wash soil loss rate from 63 mm of simulated rainfall for 60Fig. 6.min.
Xenia, and Alford) and greatest for Hoytville, Bloom-field, and Oceano fine and coarse sand (Table 2).
Wash erosion increased with time for the Hoytville,Oceano, and Bloomfield soils (Fig. 6) and then de-creased. For all silt loam soils, maximum wash lossoccurred during the initial sampling period. The soilloss then decreased until about one-half into the runand then gradually increased, possibly due to pro-gressive erosion of the developed seal. Minimum washlosses (f^min) ranged from 4 g/5 min for Menfro to 28g/5 min for Hoytville (Table 2). The difference be-tween the maximum and minimum wash rates (AW)was much less than AS for all soils.
Relative Rates of Splash to Wash ErosionRatio of splash to wash initially decreased for all
soils, except for Bloomfield and Oceano. The decreaseis associated with formation of a surface seal and theresulting decrease in splash rate with time. Afterreaching a minimum, a slight increase occurred. Thesplash/wash ratio for Bloomfield sand (Fig. 7) in-creased with kinetic energy to a maximum and thendecreased. The initial increase resulted from greatersplash caused by increased surface water potential, andthe decrease was caused by increased wash with timedue to increased runoff. Several soils, including Oceanofine sand (Fig. 7), had little change in splash to washratio with time. The minimum splash to wash ratio
10
XCO
xCO< 4
O.CO
O AvonburgO HoytvilleV BloomfieldA Xeniaa Oceano fine sand
.05 .10 .15CUMULATIVE RAINFALL ENERGY, J cm-2
.20
Fig. 7. Splash/wash ratio from 63 mm of simulated rainfall for 60min.

1570 SOIL SCI. SOC. AM. J., VOL. 51, 1987
Table 3. Correlation coefficients, r, among selectedsoil erosion parameters.!
Erosionparameter /.„ E,a Sco WM Rm SJWm
EM 0.49*SM 0.59** 0.98***WK 0.16 0.87*** 0.75***Rw -0.95*** -0.31 -0.43 0.03SJWM 0.65** 0.53* 0.68*** 0.06 -0.63**
*,**,*** Significant at the 0.05, 0.01, and 0.001 probability levels,respectively.
t /so = infiltration rate (mm/h), RM = runoff (mm/h), £,„ = total soilloss (g/5 min), S60 = splash (g/5 min), and Wm = wash (g/5 min),measured during the 55- to 60-min sampling period.
(S/Wmin) ranged from 1.0 for Ida to 3.2 for Oceanocoarse sand (Table 2).
Interrelations among Erosion ParametersCorrelations between erosion variables for the 0- to
5- and 55- to 60-min sampling period appear in Table3. Highly significant (p < 0.001) positive relationshipswere found between total soil loss for the 55- to 60-min sampling periods, EM, and both splash loss, S&,(r = 0.98) and wash loss, W60 (r = 0.87). The 560 washighly correlated with W60 (r = 0.75); Emin, Wmin, andSmm were also highly intercorrelated. These positiverelationships were expected (Meyer et al, 1975; Youngand Wiersma, 1973) because soil loss from erosionpans of limited surface area is mainly a function ofdetachment capacity by raindrop impact (or alterna-tively, soil resistance to raindrop impact). Surface flowserves mainly to transport soil detached by raindropimpact and not to detach soil particles from the soilsurface. A large portion of washed soil is raindrop de-tached; thus, in general, as splash rate increases, washrate also increases. Highly significant positive rela-tionships were also found among S5, W5, and E5 andamong Smax, Wmm and £max.
As the surface seal developed, infiltration rate de-creased and shear strength increased. Even though bothA/ and AT are usually indicators of the extent of seal-ing, A/ was not highly correlated with either AE, AS,or A W. Change in strength (Ar) was, however, highlycorrelated with AE and AS (p < 0.01) but not withLW. The extent of surface sealing was highly depen-dent upon soil texture. Correlations between sealingeffects and soil properties are further described byBradford et al., 1987. The decrease in surface soil po-rosity and the increased soil strength resulted in lesssoil loss. The degree of sealing was lowest for two sandsand one clay soil and greatest for the medium-texturedsoils. As the seal developed, the splash portion of thetotal soil loss decreased and the percentage of washedsoil increased. The splash percentage decreased be-cause the angle of soil splash projection decreased asthe surface became more resistant to raindrop impact(Al-Durrah and Bradford, 1982). Consequently, lesssoil was splashed into the splash collector and a greaterpercentage of the raindrop detached soil was trans-ported into the wash collector.
In this experiment (i) soil aggregates >2 mm werenot used, (ii) the soil surface was prewetted to nearsaturation before rainfall began, (iii) the soil was freeof surface or incorporated residues, (iv) the soil sur-face was a plane surface with a constant slope angle,
and (v) a constant drop size and rainfall intensity wasused. This study shows that interrill soil detachmentis a time-dependent process that varies greatly amongsoils and depends, to a large extent, on the degree ofsurface sealing. Surface sealing for 20 soils caused areduction in infiltration rate ranging from 1.2 to 36.0mm/h and an increase in shear strength ranging from2.6 to 42.3 kPa, resulting in a decrease in total soilloss ranging from 13.3 to 56.8 g/5 min.
The results of this study cannot be related directlyto interrill soil erodibility in the field because trans-port capacity was not limiting, i.e., most of the splashedsoil was collected without chance for the transportprocess to function. On the other hand, if process-based erosion models are to be developed, the processof soil detachment by raindrop impact must be betterquantified.

BRADFORD ET AL.: INTERRILL SOIL EROSION PROCESSES: II. 1571
Interrill Soil Erosion Processes: II. Relationship of Splash Detachment to Soil Properties1
J. M. BRADFORD, J. E. FERRIS, AND P. A. REMLEY2
ABSTRACTSoil erodibility is often estimated using predictive equations based
on easily measurable soil parameters. However, most predictiveequations are valid for a limited group of soils and do not accountfor temporal changes in surface conditions. The objective of thisstudy was to identify those soil properties that affect interrill splashand to develop an interrill detachment model based on both staticand dynamic soil properties. Twenty soils ranging in texture fromsand to clay were exposed to laboratory simulated rainfall with anintensity of about 63 mm/h. The development of a surface seal de-creased infiltration rate, splash, wash erosion, and increased soilstrength, as measured with a fall-cone device. The best predictor ofsoil splash for the surface sealed condition was a combined kineticenergy/fall- cone strength (KE/r) and total silt content term, and oftotal soil loss, a KE/r and coarse silt content term. Comparing re-sults from this study with previously reported studies, we concludethat for improvement of laboratory based indices, greater attentionmust be given to dynamic soil properties such as the soil's resistingforce to raindrop impact and surface flow.
Additional Index Words: erosion mechanics, soil strength, surfacesealing, soil splash.
Bradford, J.M., J.E. Ferns, and P.A. Remley. 1987. Interrill soilerosion processes: II. Relationship of splash detachment to soilproperties. Soil Sci. Soc. Am. J. 51:1571-1575.
SOIL ERODIBILITY is generally measured using nat-ural rainfall erosion plots or simulated rainfall on
field plots or predicted from equations based on easilymeasured, static soil properties. There has been littlesuccess, however, in developing a universal soil ero-dibility prediction equation. The prediction equationsare valid for a limited group of soils and do not ac-count for temporal changes in surface conditions.
Process-based soil erosion models commonly di-vide the soil erodibility term into rill and interrill er-odibility components (Meyer and Wischmeier, 1969;Foster, 1982). Numerous studies have sought an er-odibility term for the combined interrill and rill pro-cesses; however, few attempts have been made at de-termining an interrill erodibility term. Exceptions arethe studies of Meyer (1981) and Meyer and Harmon(1984). Meyer and Harmon (1984) measured interrillerosion for 18 soils in a bare, tilled condition. Theyfound correlations of interrill erosion with clay per-centage, 1500-kPa water, exchangeable Ca, sum of ex-changeable bases, cation exchange capacity (CEC), andorganic matter.
Rainfall may cause a surface seal to develop in soils,which reduces splash, infiltration rate, and, thus, in-
1 Contribution from the USDA-ARS, National Soil Erosion Res.Lab., West Lafayette, IN, in cooperation with the Purdue Agric.Exp. Stn. Journal no. 11006. Received 29 Dec. 1986.
- Soil Scientists, USDA-ARS, and Research Associate, Dep. ofAgronomy, Purdue Univ., West Lafayette, IN 47907.
terrill erodibility (Moldenhauer and Koswara, 1968).The magnitude of change in surface properties duringthe sealing process and the resulting effect on interrillerodibility is not known. In an earlier study, Bradfordet al. (1986) studied the effect of stage of surface sealdevelopment on soil splash due to the impact of asingle waterdrop. This study was designed to identifythose soil properties that affect interrill soil detach-ment, using laboratory simulated rainfall applied to0.14-m2 erosion pans, and to develop an interrill de-tachment model based on both static and dynamic soilproperties.
MATERIALS AND METHODSSoil materials used in this study were taken from Ap ho-
rizons of 19 soil series. Soil classifications are given in Table1. Soil properties considered important to splash detach-ment were determined using standard laboratory methods:particle size, by the pipet method (Day, 1965); aggregate size,by a modified Kemper and Chepil (1965) wet sieving method;organic C, by the modified Walkley-Black method (Nelsonand Sommers, 1982); cation exchange capacity and ex-changeable Ca, Mg, K, and Na, by the NH4OAc method(Thomas, 1982); specific surface area, by the ethylene glycolmonoether (EGME) technique (Heilman et al., 1965); sol-uble salts, by electrical conductivity; and liquid and plasticlimit, by the Sowers (1965) method. Aggregate size was de-termined on 25-g subsamples of air-dry soil passed througha 2-mm sieve and slowly wetted overnight on a tension tablewith the glass bead surface held at — 1-kPa water potential.Percent water stable aggregates (WSA) (and primary parti-cles) <0.002-mm diam, percent WSA <0.25 mm, and meanaggregate diameter (mm) determined on a weight basis (Z>50)were calculated.
Laboratory rainfall/erosion methods are given in detail byBradford et al. (1987). Briefly, soil sieved through a 2-mmscreen was placed in a 320-mm wide by 450 mm-long by200-mm deep erosion pan, slowly saturated over a 3-d pe-riod, and subjected to rainfall at an intensity of 62.8 ±1 .6mm/h. Runoff, erosion, and infiltration were measured at5-min intervals throughout a 60-min storm. Soil shearstrength, r0 and rm, was determined, using the Swedish fall-cone device, for soil conditions before and following rainfall,respectively.
Data were analyzed by an analysis of variance. When theF test indicated statistical significance, the protected leastsignificant difference (LSD) (Steel and Torrie, 1980) was usedto determine which differences were significant. Simple cor-relation analyses between soil property variables and soilloss and infiltration variables at different sampling periodswere run. Stepwise multiple linear regression analysis wasused to develop functional relationships between the depen-dent and independent variables.
RESULTS AND DISCUSSIONTable 2 contains a summary of the results of the
physical and chemical analyses. Dispersed particlessizes refer to particle fractions determined by Day's