interpretation of salinity and irrigation effects on
TRANSCRIPT
Full Terms & Conditions of access and use can be found athttp://www.tandfonline.com/action/journalInformation?journalCode=tres20
Download by: [147.49.252.89] Date: 10 January 2018, At: 13:07
International Journal of Remote Sensing
ISSN: 0143-1161 (Print) 1366-5901 (Online) Journal homepage: http://www.tandfonline.com/loi/tres20
Interpretation of salinity and irrigation effects onsoybean canopy reflectance in visible and near-infrared spectrum domain
D. Wang , C. Wilson & M. C. Shannon
To cite this article: D. Wang , C. Wilson & M. C. Shannon (2002) Interpretation of salinity andirrigation effects on soybean canopy reflectance in visible and near-infrared spectrum domain,International Journal of Remote Sensing, 23:5, 811-824, DOI: 10.1080/01431160110070717
To link to this article: https://doi.org/10.1080/01431160110070717
Published online: 25 Nov 2010.
Submit your article to this journal
Article views: 154
View related articles
Citing articles: 26 View citing articles
int. j. remote sensing, 2002, vol. 23, no. 5, 811–824
Interpretation of salinity and irrigation eVects on soybean canopyre� ectance in visible and near-infrared spectrum domain
D. WANG†*, C. WILSON‡ and M. C. SHANNON‡
†Department of Soil, Water, and Climate, University of Minnesota, St Paul,Minnesota 55108, USA‡USDA-ARS, George E. Brown, Jr, Salinity Laboratory, 450 West Big SpringsRoad, Riverside, California 92507, USA
(Received 22 December 1999; in � nal form 4 December 2000)
Abstract. Soil and water salinity can reduce plant growth, aVecting yield andquality of agricultural and horticultural crops. This study was designed to measurecanopy spectral re� ectance of soybean plants under diVerent salinity and irrigationtreatments (drip, sprinkler, and furrow), and to relate the re� ectance characteristicsto salinity-induced alterations in leaf chlorophyll, speci� c leaf mass, and above-ground biomass. Soybean canopy re� ectance was measured with a hand-heldCropscan multispectral radiometer in the visible (460–710 nm) and near-infrared(NIR; 810–950 nm) spectrum domain. Canopy re� ectance in the NIR was signi� c-antly and consistently reduced by the salinity treatment. The reduction wasattributed to increases in speci� c leaf mass caused by salinity, and can be delin-eated with the simple ratio vegetation index (SRVI), with 660 and 830 nm as themost sensitive waveband combination. Re� ectance in the visible domain did notshow a salinity eVect nor any correlation to leaf chlorophyll changes from salinitystress. Canopy re� ectance in NIR showed the most salinity eVect under furrowirrigation where the soybeans were subjected to the most cumulative salinity stress.
1. IntroductionLong-term mismanaged irrigation often leads to the salinization of soil and water,
and concern is mounting about the sustainability of irrigated agriculture. Becausethe ability of plants to achieve maximum yield is strongly inhibited by salinity (Maasand HoVman 1977), crop management techniques to avoid this stress are especiallyuseful in cases where crops are produced in saline areas. However, in order to employoptimized management procedures such as variable-rate application of agriculturalchemicals, highly detailed information on the spatial and temporal distribution ofsoil salinity and its eVect on plant growth is sorely needed.
Field determination of soil salinity is often conducted by in situ soil core sampling.Unfortunately, soil sampling is very costly, time-consuming, and requires interpola-tion between sampling points in order to create a spatial assessment of apparentsalinity distribution. To overcome these problems, mobilized units have beendeveloped at the US Salinity Laboratory to measure soil salinity on the go, using
*e-mail: [email protected]
International Journal of Remote SensingISSN 0143-1161 print/ISSN 1366-5901 online © 2002 Taylor & Francis Ltd
http://www.tandf.co.uk/journalsDOI: 10.1080/01431160110070717
Dow
nloa
ded
by [
] at
13:
07 1
0 Ja
nuar
y 20
18
D. Wang et al.812
either a four-probe electrical conductivity system or a non-invasive electromagneticsensor (Rhoades 1993). These units are most useful for early-season measurementswhen plant height is low. Field access with this unit can be limited during thegrowing season, especially at later stages of vegetative growth when plant heightexceeds the maximum clearance of the mobile units.
One possible alternative to the direct salinity measurement is to use plantresponses to saline environments as an index of soil salinity. It is suggested thatplant responses may provide a more comprehensive assessment of salinity becauseplant roots generally penetrate deep in the soil pro� le and measurements of growthcharacteristics at one point in time integrate the cumulative eVect of substrate salinity.Remote sensing of the plant canopy is particularly useful in this respect. For example,Penuelas et al. (1997) found that canopy re� ectance of barley was lower in the near-infrared (NIR) and higher in the visible spectrum region with increasing salinity. Tocharacterize salinity eVects on cotton, Wiegand et al. (1992) found that the yield andplant cover were correlated to vegetation indices derived from remote sensingmeasurements using either multispectral video images or re� ectance data from theSPOT satellite.
A more mechanistic approach of applying remote sensing to determine salinityeVects on plant growth or eventual salinity assessment is to relate salinity-inducedcanopy re� ectance characteristics to plant biophysical and biochemical propertiesthat are also sensitive to salinity stress. One of the primary biochemical parametersthat aVects canopy re� ectance in the visible domain is the concentration and totalamount of leaf chlorophyll. Salinity has been shown to have some eVects on leafchlorophyll content of rice (Pandey and Saxena 1987), chickpea (Datta and Sharma1990), and cowpea (Plaut et al. 1990). Remote sensing studies have also beenconducted on developing algorithms of using vegetation indices to infer plant chloro-phyll content (Chappelle et al. 1992, Gitelson and Merzlyak 1997, Blackburn 1998).However, no information can be found in the literature on interrelations betweensalinity, canopy re� ectance, and leaf chlorophyll.
In the NIR spectrum domain, diVerences in canopy re� ectance have been attrib-uted to variations in leaf anatomical structure such as the number of palisade celllayers, cell sizes and orientation (Gausman 1974). A simple and indirect way ofdescribing the leaf anatomical structure is to use the speci� c leaf mass (SLM) as ameasure which includes both leaf thickness and density (Wiebold et al. 1981). Further,it has been found that the transmissivity-related leaf absorbance at 1000 nm ispositively correlated to increases in SLM (Methy et al. 1998). One may deduce that,with increasing absorbance, the re� ectance in NIR would decrease with increasingSLM. Leaf morphology including SLM can be aVected by salinity (Meiri andPoljakoV-Mayber 1967), therefore, canopy re� ectance in NIR may be used as anindex to infer the detrimental eVects of salinity on plant growth. The ultimate goalof applying remote sensing techniques for salinity assessment is to provide an earlyestimation of the eVect of salinity on plant growth and biomass production before� nal yield reduction occurs.
The overall objective of this study was to explain eVects of soil and water salinityon soybean canopy spectral re� ectance in the visible and NIR region using plantbiophysical and biochemical parameters. Speci� cally, the study was designed to (1)relate canopy spectral re� ectance in the visible and NIR to chlorophyll content andSLM, respectively, and (2) determine a simple and commonly used vegetation indexto describe the salinity eVects on soybean canopy re� ectance. Since diVerences in
Dow
nloa
ded
by [
] at
13:
07 1
0 Ja
nuar
y 20
18
EVects of salinity and irrigation on canopy re� ectance 813
irrigation method can create diVerent processes by which salt is distributed in thesoil and accumulated in plants (Bernstein and Francois 1973), drip, sprinkler, andfurrow irrigation were used in the study. Therefore, this study was also designed to(3) compare the interactive eVects of salinity and irrigation method on soybeangrowth using remote sensing. Soybean was selected as the test plant because previousstudies have indicated that morphological features of soybean plants are highlyresponsive to changes in environmental conditions (Milton et al. 1989, 1991).Additionally, soybean has a uniform plant canopy, which would minimize thevariability in canopy re� ectance induced by factors other than salinity.
2. The � eld experimentA � eld experiment was conducted between June and October 1998 in Riverside,
California, USA (33°58ê 23 N Lat.; 117°20ê 30 W Long.). The soil at the study site isan Arlington � ne sandy loam (coarse–loamy, mixed, thermic, Haplic Durixeralf )with an Ap horizon for the surface 10 cm. In this depth, the particle size distributionconsists of 63% sand, 30% silt, and 7% clay. The initial soil salinity was lowwith an electrical conductivity of the saturated solution extract (ECe ) of1.04±0.12 dS m Õ 1 , after correction for apparent soil water content.
Soybean variety ‘Manokin’ (Glycine max (L.) Merr.) was selected for investigatingresponses to salinity under diVerent irrigation regimes. ‘Manokin’ is a late maturitygroup IV determinate variety developed for its superior yield and resistance tosoybean cyst nematode (Kenworthy et al. 1996). No information was found in theliterature on its potential salt tolerance. In the experiment, seeds were planted on11 June 1998 or day of year (DOY) 162, at a rate of 32.8 seeds per metre and atdepths between 3 and 5 cm from the soil surface. Three irrigation methods (drip,sprinkler, and furrow) were used to determine the eVect of irrigation on soybeanresponses to salinity. For each method of irrigation, an adjacent plot was used asthe control with no salt application. In drip and sprinkler treatments with salinity,the irrigation water was salinized with a NaCl and CaCl2 mixture (at 1:1 mass ratio),to an electrical conductivity of water (ECw ) value of about 4 dS m Õ 1 starting at 30days after seedling emergence or DOY 204. To insure seedling establishment, non-salinized water was used in both irrigation treatments between DOY 162 and 204.Non-salinized water was also applied for about 30 min at the end of each irrigationevent in the sprinkler–salinity treatment. This was done to wash oV potential saltdeposits on the soybean canopy that might create a biased re� ectance measurement.A total of 3.2 and 5.7 Mg ha Õ 1 mixed salts were applied in the drip– and sprinkler–salinity plot over the growing season. The cumulative amount of irrigation waterapplied was 208 and 681 mm for the drip and sprinkler plot, respectively. For thefurrow-irrigated treatment with salinity, the soil was salinized with a NaCl andCaCl2 mixture (at 1:1 mass ratio and 0.9 Mg haÕ 1 rate) prior to planting. Non-salinewater (ECw# 0.5 dS m Õ 1 ) was used for all subsequent furrow irrigations during theseason. To schedule irrigation, a weather station was installed at the � eld site tomonitor meteorological parameters such as air temperature and relative humidity.
3. Canopy spectral re� ectance and vegetation indicesSoybean canopy re� ectance was measured with a hand-held Cropscan Multi-
Spectral Radiometer (MSR). Eight wavebands (460, 560, 660, 710, 810, 830, 900, and950 nm; band width 10 nm) were selected to sample the visible and NIR region.Canopy re� ectance was computed and recorded with a data logger controller for
Dow
nloa
ded
by [
] at
13:
07 1
0 Ja
nuar
y 20
18

D. Wang et al.814
each band which consisted of a pair of sensors: a downward-facing sensor and anupward-facing sensor covered with a diVuser. To avoid the eVect of bare soilsurface, the � rst re� ectance measurement was made on 14 August or DOY 226 whenthe soybeans were near the end of vegetative growth stage and 100% canopy closurehad been reached. Remaining measurements were made on DOY 244, 257, 266, 279,and 289, respectively, to provide a temporal assessment of salinity and irrigationeVects on soybean growth. During the measurements, the MSR unit was mountedat the end of a support pole and was held 50 cm above the canopy at an angleperpendicular to the horizontal plane (Nadir). The � eld-of-view of the MSR was28°, therefore, a canopy area of about 30 cm in diameter was measured at the 50 cmheight. Because the MSR unit was 8×8×10 cm in dimension and held 50 cm abovethe canopy, a minimum solar zenith angle of 22.3° was required to prevent shadowingthe measured areas from the MSR unit itself. To avoid shadowing, solar zenith anglewas calculated from the theoretical equation found in Campbell and Norman (1998):
y=cos Õ 1{sin (w) sin(d)+cos (w) cos(d) cos[15(t to )]} (1)
where y is the solar zenith angle, w is the latitude, d is solar declination angle, t istime, and to is the time of solar noon. Based on computations from the equation,the re� ectance measurements were made between the hours of 1300 and 1400 whenthe solar zenith angle ranged from a minimum of 24.5° at 1300 h on DOY 226 to amaximum of 54.8° at 1400 h on DOY 289.
Vegetation indices have been widely used in remote sensing to describe the degreeof plant cover or biomass production. Although diVerent methods can be usedto derive the indices (Steven et al. 1990, Wiegand et al. 1991), the most commonlyused are the normalized diVerence vegetation index (NDVI) and the simpleratio vegetation index (SRVI). The two indices are de� ned as NDVI=(RNIR RRED )/(RNIR+RRED ), and SRVI=RNIR /RRED , where RRED and RNIR representthe canopy re� ectance in the red and NIR spectral domain, respectively. To determinea RRED and RNIR combination that is most sensitive to salinity and irrigation method,RNIR was sequentially selected at 810, 830, 900, and 950 nm, whereas RRED was � xedat 660 nm waveband.
4. Leaf chlorophyll, speci� c leaf mass, and biomassSoybean leaf chlorophyll levels were measured with the Minolta hand-held
SPAD-502 meter which has been found useful in estimating soybean chlorophyllcontent and its seasonal variations (Thompson et al. 1996). Calibration of the SPADmeter readings against actual leaf chlorophyll was made from replicated leaf punches(each 1.131 cm2 in area), which were ground and digested in 80% (v:v) acetonesolution saturated with MgCO3 , and analysed on a Beckman DU 7500 spectrophoto-meter. The relationship between the chlorophyll concentration (CHL ; in mg cm Õ 2 )and SPAD number (SPAD) was � tted with a three-parameter exponential equation(r2=0.661 ):
CHL = 43.68+36.65 e0.0214(SPAD) (2)
This empirical calibration function compared well with calibrations reported byMonje and Bugbee (1992) and Markwell et al. (1995 ).
To determine speci� c leaf mass or SLM, nine soybean plants were randomlyharvested on DOY 222, 243, and 264 from each treatment, right after the SPADmeter measurements, to compare with the re� ectance measurements made on DOY
Dow
nloa
ded
by [
] at
13:
07 1
0 Ja
nuar
y 20
18
EVects of salinity and irrigation on canopy re� ectance 815
226, 244, and 266. No harvesting was made to compare with the re� ectance measure-ments on DOY 279 or 289 since senescence had occurred. Total leaf area from eachplant was measured in the laboratory by passing individual lea� ets through a LICORLI-3100 leaf area meter. The leaves were then dried at about 70° C in a forced-airoven to constant weights. SLM was calculated as the ratio of the dry weight overthe total leaf area from each plant. Total above-ground biomass (AGB) was obtainedby adding the dry weight of all above ground plant parts, including the leaves, stems,and pods (no pods for harvest made on DOY 226).
5. Results and discussion5.1. Characteristics of canopy re� ectance
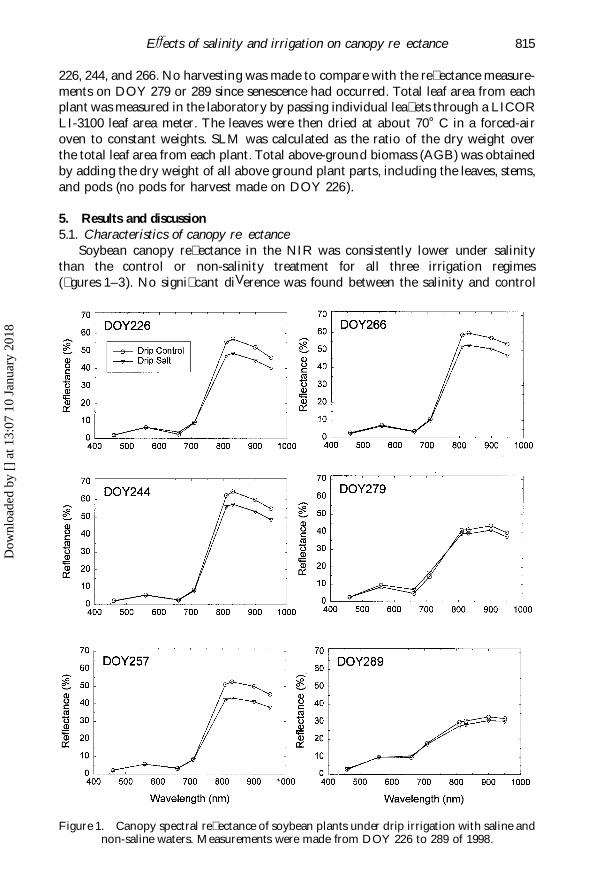
Soybean canopy re� ectance in the NIR was consistently lower under salinitythan the control or non-salinity treatment for all three irrigation regimes(� gures 1–3). No signi� cant diVerence was found between the salinity and control
Figure 1. Canopy spectral re� ectance of soybean plants under drip irrigation with saline andnon-saline waters. Measurements were made from DOY 226 to 289 of 1998.
Dow
nloa
ded
by [
] at
13:
07 1
0 Ja
nuar
y 20
18
D. Wang et al.816
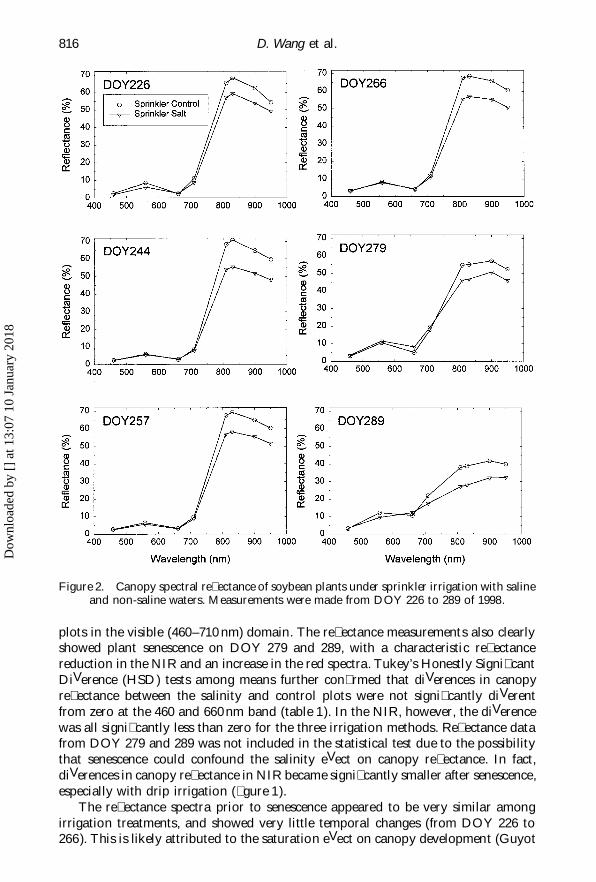
Figure 2. Canopy spectral re� ectance of soybean plants under sprinkler irrigation with salineand non-saline waters. Measurements were made from DOY 226 to 289 of 1998.
plots in the visible (460–710 nm) domain. The re� ectance measurements also clearlyshowed plant senescence on DOY 279 and 289, with a characteristic re� ectancereduction in the NIR and an increase in the red spectra. Tukey’s Honestly Signi� cantDiVerence (HSD) tests among means further con� rmed that diVerences in canopyre� ectance between the salinity and control plots were not signi� cantly diVerentfrom zero at the 460 and 660 nm band (table 1). In the NIR, however, the diVerencewas all signi� cantly less than zero for the three irrigation methods. Re� ectance datafrom DOY 279 and 289 was not included in the statistical test due to the possibilitythat senescence could confound the salinity eVect on canopy re� ectance. In fact,diVerences in canopy re� ectance in NIR became signi� cantly smaller after senescence,especially with drip irrigation (� gure 1).
The re� ectance spectra prior to senescence appeared to be very similar amongirrigation treatments, and showed very little temporal changes (from DOY 226 to266). This is likely attributed to the saturation eVect on canopy development (Guyot
Dow
nloa
ded
by [
] at
13:
07 1
0 Ja
nuar
y 20
18
EVects of salinity and irrigation on canopy re� ectance 817
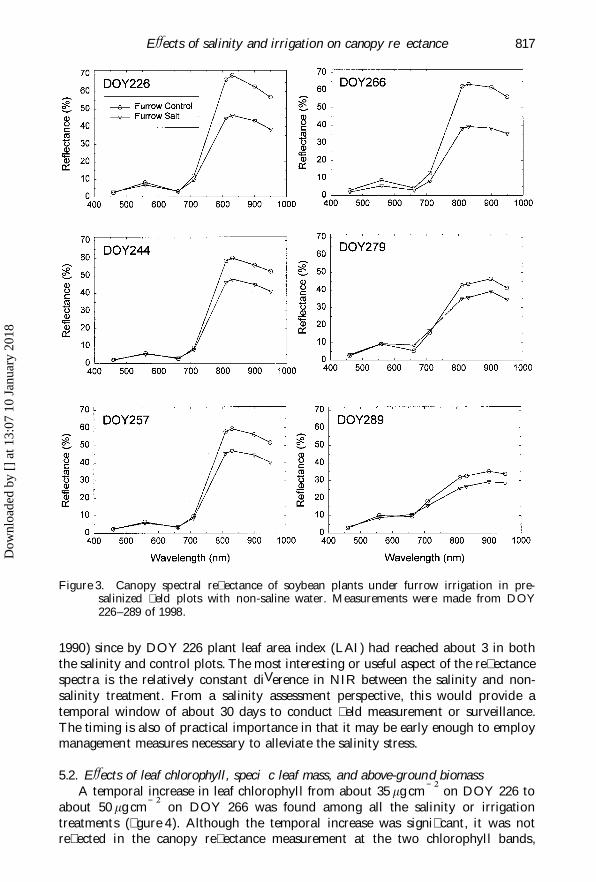
Figure 3. Canopy spectral re� ectance of soybean plants under furrow irrigation in pre-salinized � eld plots with non-saline water. Measurements were made from DOY226–289 of 1998.
1990) since by DOY 226 plant leaf area index (LAI) had reached about 3 in boththe salinity and control plots. The most interesting or useful aspect of the re� ectancespectra is the relatively constant diVerence in NIR between the salinity and non-salinity treatment. From a salinity assessment perspective, this would provide atemporal window of about 30 days to conduct � eld measurement or surveillance.The timing is also of practical importance in that it may be early enough to employmanagement measures necessary to alleviate the salinity stress.
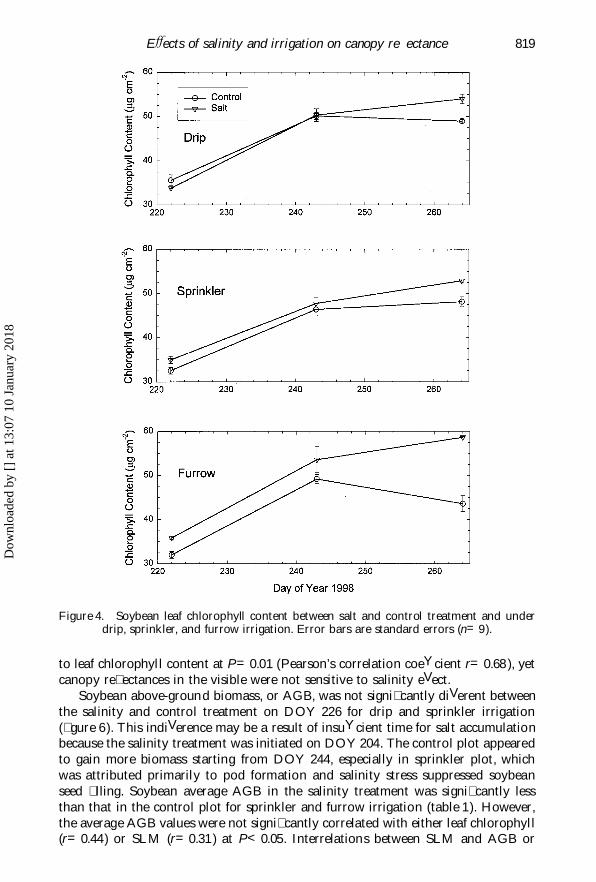
5.2. EVects of leaf chlorophyll, speci� c leaf mass, and above-ground biomassA temporal increase in leaf chlorophyll from about 35 mg cm Õ 2 on DOY 226 to
about 50 mg cm Õ 2 on DOY 266 was found among all the salinity or irrigationtreatments (� gure 4). Although the temporal increase was signi� cant, it was notre� ected in the canopy re� ectance measurement at the two chlorophyll bands,
Dow
nloa
ded
by [
] at
13:
07 1
0 Ja
nuar
y 20
18
D. Wang et al.818
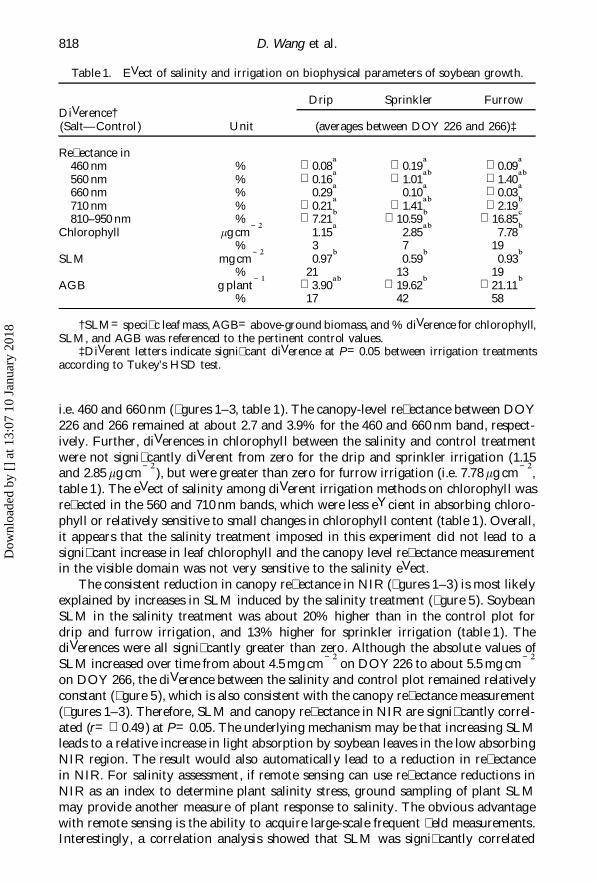
Table 1. EVect of salinity and irrigation on biophysical parameters of soybean growth.
Drip Sprinkler FurrowDiVerence†(Salt—Control ) Unit (averages between DOY 226 and 266)‡
Re� ectance in460 nm % 0.08a 0.19a 0.09a560 nm % 0.16a 1.01ab 1.40ab660 nm % 0.29a 0.10a 0.03a710 nm % 0.21a 1.41ab 2.19b810–950 nm % 7.21b 10.59b 16.85c
Chlorophyll mg cm Õ 2 1.15a 2.85ab 7.78b% 3 7 19
SLM mg cm Õ 2 0.97b 0.59b 0.93b% 21 13 19
AGB g plant Õ 1 3.90ab 19.62b 21.11b% 17 42 58
†SLM=speci� c leaf mass, AGB=above-ground biomass, and % diVerence for chlorophyll,SLM, and AGB was referenced to the pertinent control values.
‡DiVerent letters indicate signi� cant diVerence at P=0.05 between irrigation treatmentsaccording to Tukey’s HSD test.
i.e. 460 and 660 nm (� gures 1–3, table 1). The canopy-level re� ectance between DOY226 and 266 remained at about 2.7 and 3.9% for the 460 and 660 nm band, respect-ively. Further, diVerences in chlorophyll between the salinity and control treatmentwere not signi� cantly diVerent from zero for the drip and sprinkler irrigation (1.15and 2.85 mg cm Õ 2 ), but were greater than zero for furrow irrigation (i.e. 7.78 mg cm Õ 2,table 1). The eVect of salinity among diVerent irrigation methods on chlorophyll wasre� ected in the 560 and 710 nm bands, which were less eYcient in absorbing chloro-phyll or relatively sensitive to small changes in chlorophyll content (table 1). Overall,it appears that the salinity treatment imposed in this experiment did not lead to asigni� cant increase in leaf chlorophyll and the canopy level re� ectance measurementin the visible domain was not very sensitive to the salinity eVect.
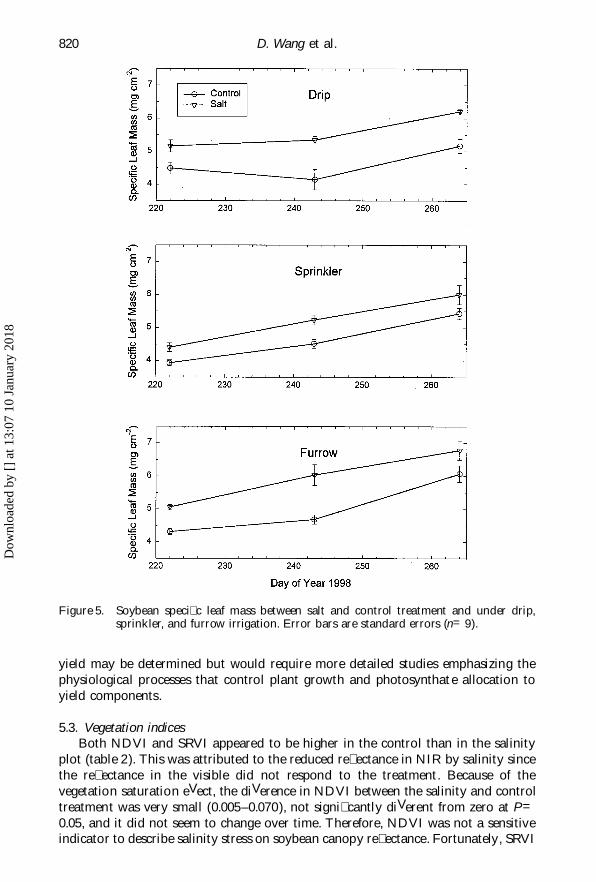
The consistent reduction in canopy re� ectance in NIR (� gures 1–3) is most likelyexplained by increases in SLM induced by the salinity treatment (� gure 5). SoybeanSLM in the salinity treatment was about 20% higher than in the control plot fordrip and furrow irrigation, and 13% higher for sprinkler irrigation (table 1). ThediVerences were all signi� cantly greater than zero. Although the absolute values ofSLM increased over time from about 4.5 mg cm Õ 2 on DOY 226 to about 5.5 mg cm Õ 2on DOY 266, the diVerence between the salinity and control plot remained relativelyconstant (� gure 5), which is also consistent with the canopy re� ectance measurement(� gures 1–3). Therefore, SLM and canopy re� ectance in NIR are signi� cantly correl-ated (r= 0.49 ) at P=0.05. The underlying mechanism may be that increasing SLMleads to a relative increase in light absorption by soybean leaves in the low absorbingNIR region. The result would also automatically lead to a reduction in re� ectancein NIR. For salinity assessment, if remote sensing can use re� ectance reductions inNIR as an index to determine plant salinity stress, ground sampling of plant SLMmay provide another measure of plant response to salinity. The obvious advantagewith remote sensing is the ability to acquire large-scale frequent � eld measurements.Interestingly, a correlation analysis showed that SLM was signi� cantly correlated
Dow
nloa
ded
by [
] at
13:
07 1
0 Ja
nuar
y 20
18
EVects of salinity and irrigation on canopy re� ectance 819
Figure 4. Soybean leaf chlorophyll content between salt and control treatment and underdrip, sprinkler, and furrow irrigation. Error bars are standard errors (n=9).
to leaf chlorophyll content at P=0.01 (Pearson’s correlation coeYcient r=0.68 ), yetcanopy re� ectances in the visible were not sensitive to salinity eVect.
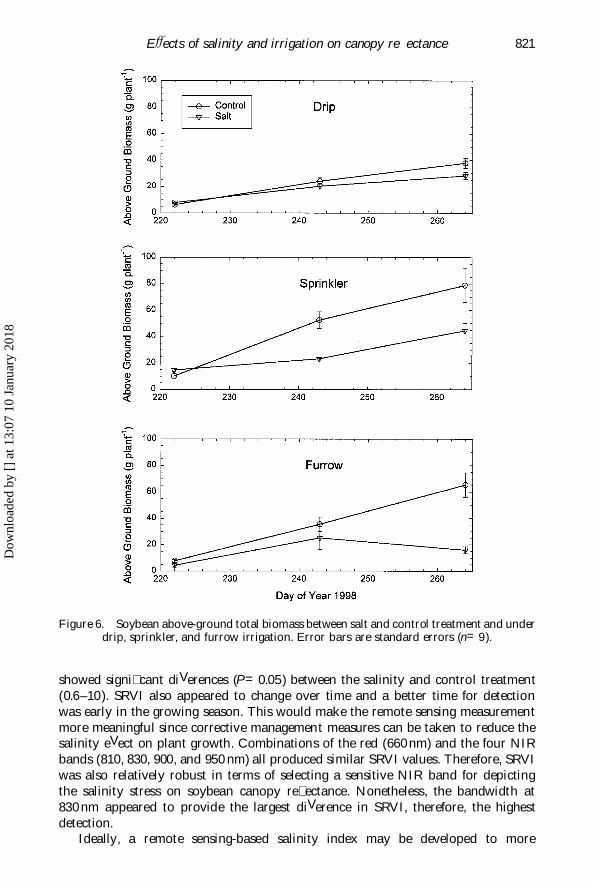
Soybean above-ground biomass, or AGB, was not signi� cantly diVerent betweenthe salinity and control treatment on DOY 226 for drip and sprinkler irrigation(� gure 6). This indiVerence may be a result of insuYcient time for salt accumulationbecause the salinity treatment was initiated on DOY 204. The control plot appearedto gain more biomass starting from DOY 244, especially in sprinkler plot, whichwas attributed primarily to pod formation and salinity stress suppressed soybeanseed � lling. Soybean average AGB in the salinity treatment was signi� cantly lessthan that in the control plot for sprinkler and furrow irrigation (table 1). However,the average AGB values were not signi� cantly correlated with either leaf chlorophyll(r=0.44) or SLM (r=0.31) at P<0.05. Interrelations between SLM and AGB or
Dow
nloa
ded
by [
] at
13:
07 1
0 Ja
nuar
y 20
18
D. Wang et al.820
Figure 5. Soybean speci� c leaf mass between salt and control treatment and under drip,sprinkler, and furrow irrigation. Error bars are standard errors (n=9).
yield may be determined but would require more detailed studies emphasizing thephysiological processes that control plant growth and photosynthate allocation toyield components.
5.3. Vegetation indicesBoth NDVI and SRVI appeared to be higher in the control than in the salinity
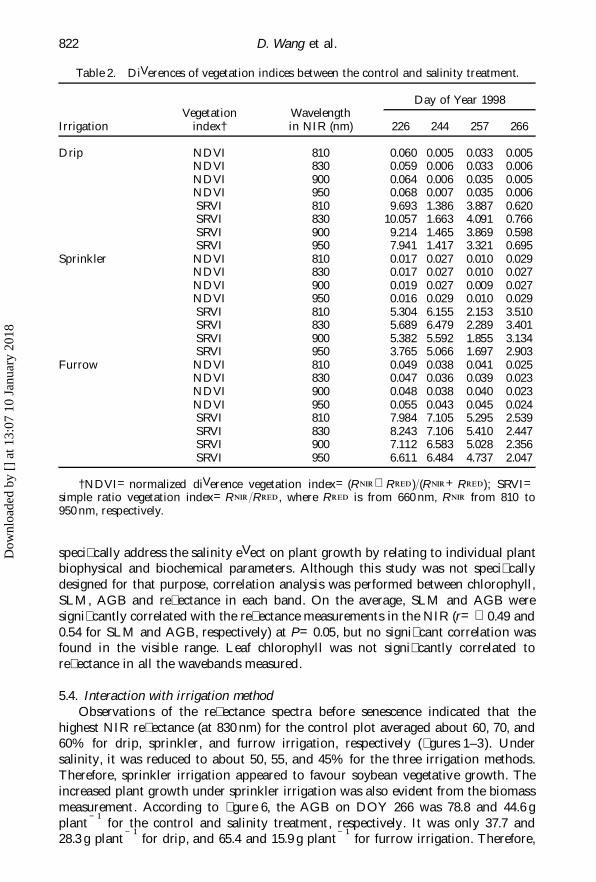
plot (table 2). This was attributed to the reduced re� ectance in NIR by salinity sincethe re� ectance in the visible did not respond to the treatment. Because of thevegetation saturation eVect, the diVerence in NDVI between the salinity and controltreatment was very small (0.005–0.070), not signi� cantly diVerent from zero at P=0.05, and it did not seem to change over time. Therefore, NDVI was not a sensitiveindicator to describe salinity stress on soybean canopy re� ectance. Fortunately, SRVI
Dow
nloa
ded
by [
] at
13:
07 1
0 Ja
nuar
y 20
18
EVects of salinity and irrigation on canopy re� ectance 821
Figure 6. Soybean above-ground total biomass between salt and control treatment and underdrip, sprinkler, and furrow irrigation. Error bars are standard errors (n=9).
showed signi� cant diVerences (P=0.05) between the salinity and control treatment(0.6–10). SRVI also appeared to change over time and a better time for detectionwas early in the growing season. This would make the remote sensing measurementmore meaningful since corrective management measures can be taken to reduce thesalinity eVect on plant growth. Combinations of the red (660 nm) and the four NIRbands (810, 830, 900, and 950 nm) all produced similar SRVI values. Therefore, SRVIwas also relatively robust in terms of selecting a sensitive NIR band for depictingthe salinity stress on soybean canopy re� ectance. Nonetheless, the bandwidth at830 nm appeared to provide the largest diVerence in SRVI, therefore, the highestdetection.
Ideally, a remote sensing-based salinity index may be developed to more
Dow
nloa
ded
by [
] at
13:
07 1
0 Ja
nuar
y 20
18
D. Wang et al.822
Table 2. DiVerences of vegetation indices between the control and salinity treatment.
Day of Year 1998Vegetation Wavelength
Irrigation index† in NIR (nm) 226 244 257 266
Drip NDVI 810 0.060 0.005 0.033 0.005NDVI 830 0.059 0.006 0.033 0.006NDVI 900 0.064 0.006 0.035 0.005NDVI 950 0.068 0.007 0.035 0.006SRVI 810 9.693 1.386 3.887 0.620SRVI 830 10.057 1.663 4.091 0.766SRVI 900 9.214 1.465 3.869 0.598SRVI 950 7.941 1.417 3.321 0.695
Sprinkler NDVI 810 0.017 0.027 0.010 0.029NDVI 830 0.017 0.027 0.010 0.027NDVI 900 0.019 0.027 0.009 0.027NDVI 950 0.016 0.029 0.010 0.029SRVI 810 5.304 6.155 2.153 3.510SRVI 830 5.689 6.479 2.289 3.401SRVI 900 5.382 5.592 1.855 3.134SRVI 950 3.765 5.066 1.697 2.903
Furrow NDVI 810 0.049 0.038 0.041 0.025NDVI 830 0.047 0.036 0.039 0.023NDVI 900 0.048 0.038 0.040 0.023NDVI 950 0.055 0.043 0.045 0.024SRVI 810 7.984 7.105 5.295 2.539SRVI 830 8.243 7.106 5.410 2.447SRVI 900 7.112 6.583 5.028 2.356SRVI 950 6.611 6.484 4.737 2.047
†NDVI=normalized diVerence vegetation index=(RNIR RRED )/(RNIR+RRED); SRVI=simple ratio vegetation index=RNIR/RRED , where RRED is from 660 nm, RNIR from 810 to950 nm, respectively.
speci� cally address the salinity eVect on plant growth by relating to individual plantbiophysical and biochemical parameters. Although this study was not speci� callydesigned for that purpose, correlation analysis was performed between chlorophyll,SLM, AGB and re� ectance in each band. On the average, SLM and AGB weresigni� cantly correlated with the re� ectance measurements in the NIR (r= 0.49 and0.54 for SLM and AGB, respectively) at P=0.05, but no signi� cant correlation wasfound in the visible range. Leaf chlorophyll was not signi� cantly correlated tore� ectance in all the wavebands measured.
5.4. Interaction with irrigation methodObservations of the re� ectance spectra before senescence indicated that the
highest NIR re� ectance (at 830 nm) for the control plot averaged about 60, 70, and60% for drip, sprinkler, and furrow irrigation, respectively (� gures 1–3). Undersalinity, it was reduced to about 50, 55, and 45% for the three irrigation methods.Therefore, sprinkler irrigation appeared to favour soybean vegetative growth. Theincreased plant growth under sprinkler irrigation was also evident from the biomassmeasurement. According to � gure 6, the AGB on DOY 266 was 78.8 and 44.6 gplant Õ 1 for the control and salinity treatment, respectively. It was only 37.7 and28.3 g plant Õ 1 for drip, and 65.4 and 15.9 g plant Õ 1 for furrow irrigation. Therefore,
Dow
nloa
ded
by [
] at
13:
07 1
0 Ja
nuar
y 20
18
EVects of salinity and irrigation on canopy re� ectance 823
canopy re� ectance measurement was able to detect variations in AGB caused byirrigation method.
The signi� cant re� ectance reduction by salinity in furrow irrigation, 16.85% ascompared to 10.59% in sprinkler and 7.21% in drip (table 1), may be attributed tothe method of salinization. Growing soybeans under natural conditions in a salinesoil would inevitably subject the plants to more cumulative salinity stress thanstarting the salinity treatment in the middle of the season. In furrow irrigation,soybean seeds were sown in the salinized soil, whereas the drip and sprinkler plotdid not receive salinity treatment until 42 days after planting. The prolonged salinitystress in furrow–salinity treatment also induced signi� cant changes in leaf chlorophyllcontent, though not detectable by the remote sensing measurement. Therefore, it isclear that measuring plants to indicate environmental stresses such as salinity canintegrate the temporal cumulative eVect. It is also more direct because in mostagricultural applications, the eventual goal for salinity assessment is to optimizeplant growth for yield or biomass production.
6. ConclusionsSoybean canopy re� ectance in the NIR (810–950 nm) was signi� cantly and con-
sistently lower under salinity than control treatment after the plant reaching 100%canopy closure but before senescence. No signi� cant diVerence was found betweenthe salinity and control treatment in the visible domain (460–710 nm). The re� ectancereduction in NIR was attributed to increases in speci� c leaf mass caused by salinity,which can be detected with SRVI, and with 660 and 830 nm as the most sensitivewaveband combination. Because of the vegetation saturation eVect, the diVerence inNDVI between the salinity and control treatment was very small, therefore, it wasnot a sensitive indicator to describe salinity stress on soybean canopy re� ectance.Sprinkler irrigation appeared to be more favourable for soybean growth, comparedto drip or furrow irrigation. Canopy re� ectance measurement can be used to detectvariations in plant biomass production caused by irrigation method. Remote sensingof plant canopy can provide a comprehensive assessment of plant salinity stressbecause measurements of growth characteristics at one point in time integrate thecumulative eVect of substrate salinity on canopy development. The timing of detectionmay also be early enough to employ management measures necessary to alleviatethe salinity stress before � nal yield reduction occurs.
AcknowledgementsWe thank Phyllis Nash of the University of California at Riverside for assistance
in statistical analyses.
ReferencesBernstein, L., and Francois, L. E., 1973, Comparisons of drip, furrow, and sprinkler irrigation.
Soil Science, 115, 73–86.Blackburn, G. A., 1998, Spectral indices for estimating photosynthetic pigment concentra-
tions: a test using senescent tree leaves. International Journal of Remote Sensing,19, 657–675.
Campbell, G. S., and Norman, J. M., 1998, An Introduction to Environmental Biophysics, 2ndedn (New York: Springer).
Chappelle, E. W., Kim, M. S., and Mcmurtry, J. Iii., 1992, Ratio analysis of re� ectancespectra (RARS): an algorithm for the remote estimation of the concentrations ofchlorophyll a, chlorophyll b, and carotenoids in soybean leaves. Remote Sensing ofEnvironment, 39, 239–247.
Dow
nloa
ded
by [
] at
13:
07 1
0 Ja
nuar
y 20
18
EVects of salinity and irrigation on canopy re� ectance824
Datta, K. S., and Sharma, K. D., 1990, EVect of chloride and sulphate types of salinity oncharacteristics of chlorophyll content photosynthesis and respiration of chickpea Cicerarietinum L. Biologia Plantarum, 32, 391–395.
Gausman, H. W., 1974, Leaf re� ectance of near infrared. Photogrammetric Engineering, 40,57–62.
Gitelson, A. A., and Merzlyak, M. N., 1997, Remote estimation of chlorophyll content inhigher plant leaves. International Journal of Remote Sensing, 18, 2691–2697.
Guyot, G., 1990, Optical properties of plant canopies. In Applications of Remote Sensing inAgriculture, edited by M. D. Steven and J. A. Clark (Butterworths: London), pp. 19–43.
Kenworthy, W. J., Kantzes, J. G., Krusberg, L. R., and Sardanelli, S., 1996, Registrationof ‘Manokin’ soybean. Crop Science, 36, 1079.
Maas, E. V., and Hoffman, G. J., 1977, Crop salt tolerance—current assessment. Journal ofIrrigation and Drainage Division, ASCE, 103, 115–134.
Markwell, J., Osterman, J C., and Mitchell, J. L., 1995, Calibration of the MinoltaSPAD-502 leaf chlorophyll meter. Photosynthetic Research, 46, 467–472.
Meiri, A., and Poljakoff-mayber, A., 1967, The eVect of chlorine salinity on growth of beanleaves in thickness and in area. Israel Journal of Botany, 16, 115–123.
Me’thy, M., Joffre, R., and Ourcival, J. M., 1998, Two ways of assessing absorbance of freshleaves from near-infrared re� ectance spectroscopy. International Journal of RemoteSensing, 19, 1741–1750.
Milton, N. M., Ager, C. M., Eisweith, B. A., and Power, M. S., 1989, Arsenic- and selenium-induced changes in spectral re� ectance and morphology of soybean plants. RemoteSensing of Environment, 30, 263–269.
Milton, N. M., Eisweith, B. A., and Ager, C. M., 1991, EVect of phosphorus de� ciency onspectral re� ectance and morphology of soybean plants. Remote Sensing of Environment,36, 121–128.
Monje, O. A., and Bugbee, B., 1992, Inherent limitations of nondestructive chlorophyll meters:a comparison of two types of meters. HortScience, 27, 69–71.
Pen~ uelas, J., Isla, R., Filella, I., and Araus, J. L., 1997, Visible and near-infrared re� ectanceassessment of salinity eVects on barley. Crop Science, 37, 198–202.
Pandey, U. K., and Saxena, H. K., 1987, EVects of soil salinity on chlorophyll, photosynthesis,respiration and ionic composition at various growth stages in paddy. Indian Journalof Agricultural Chemistry, 20, 149–156.
Plaut, Z., Grieve, C. M., and Maas, E. V., 1990, Salinity eVects on CO2 assimilation anddiVusive conductance of cowpea leaves. Physiologia Plantarum, 79, 31–38.
Rhoades, J. D., 1993, Electrical conductivity methods for measuring and mapping soil salinity.Advances in Agronomy, 49, 201–251.
Steven, M. D., Malthus, T. J., Demetriades-shah, T. H., Danson, F. M., and Clark, J. A.,1990, High-spectral resolution indices for crop stress. In Applications of Remote Sensingin Agriculture, edited by M. D. Steven and J. A. Clark (Butterworths: London),pp. 209–227.
Thompson, J. A., Schweitzer, L. E., and Nelson, R. L., 1996, Association of speci� c leafweight, an estimate of chlorophyll, and chlorophyll concentration with apparentphotosynthesis in soybean. Photosynthetic Research, 49, 1–10.
Wiebold, W. J., Shibles, R., and Green, D. E., 1981, Selection for apparent photosynthesisand related leaf traits in early generations of soybeans. Crop Science, 21, 969–973.
Wiegand, C. L., Richardson, A. J., Escobar, D. E., and Gerbermann, A. H., 1991, Vegetationindices in crop assessments. Remote Sensing of Environment, 35, 105–119.
Wiegand, C. L., Everitt, J. H., and Richardson, A. J., 1992, Comparison of multispectralvideo and SPOT-1 HRV observations for cotton aVected by soil salinity. InternationalJournal of Remote Sensing, 13, 1511–1525.
Dow
nloa
ded
by [
] at
13:
07 1
0 Ja
nuar
y 20
18