assessment of salinity hazard of the irrigation … · assessment of salinity hazard of the...
TRANSCRIPT
Volume-5, Issue-4, Oct-Dec-2015 Coden: IJPAJX-CAS-USA, Copyrights@2015 ISSN-2231-4490 Received: 2nd Aug-2015 Revised: 10th Oct-2015 Accepted: 17th Oct-2015
Research article
ASSESSMENT OF SALINITY HAZARD OF THE IRRIGATION WATER OF GOPALGONJ DISTRICT, BANGLADESH
Mashura Shammi1,2*, Rashadur Rahman1, Bikash Karmakar1, Md. Mostafizur Rahman1,3, Md. Moniruzzaman4, and M. Khabir Uddin1
1Department of Environmental Sciences, Jahangirnagar University, Dhaka, Bangladesh 2Department of Environmental Pollution and Process Control, Xinjiang Institute of Ecology Geography,
Chinese Academy of Sciences, Urumqi-830011, Xinjiang, PR China 3Faculty of Environmental Earth Science, Graduate School of Environmental Science, Hokkaido
University, Sapporo, Japan 4Senior Scientific officer, Soil, Agronomy and Environment, BCSIR
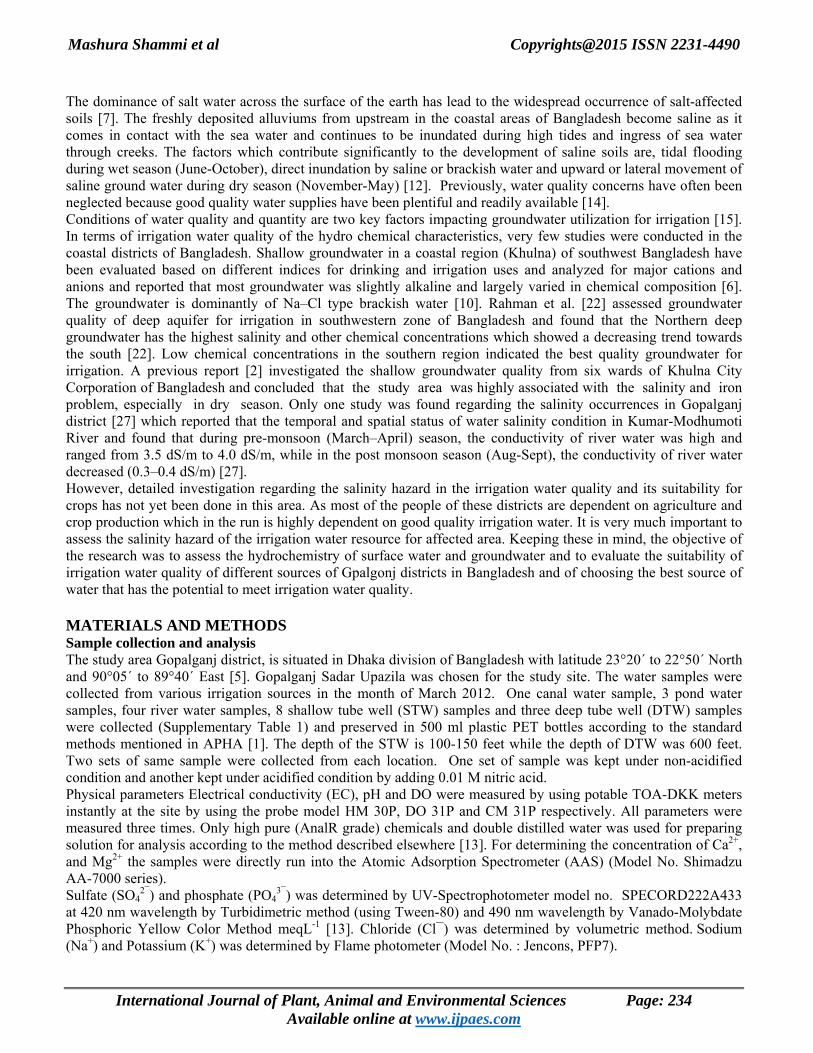
*Corresponding author. Tel. +8613716177314; Email address: [email protected] ABSTRACT: The specific objectives of the present research were to analyze the hydrochemistry of surface water and groundwater of the study area and to classify the salinity hazard of water resources from different sources of Gopalganj district in order to evaluate the suitability for irrigation purposes. A total of 21 samples were collected from surface water (canal, ponds and river), and groundwater samples from shallow tube well (STW) deep tube well (DTW). Important parameters were analysed to identify salinity hazard of irrigation water like EC, Total hardness (TH), important anions Cl¯, SO42¯ and PO43¯ were determined along with important cations Ca2+, Mg2+ , Na+ and K+ . Both surface and groundwater of the study area maintained the trend of Cl¯ > SO42¯ > PO43¯. The cation trend in both surface and groundwater of the study area were Na+ > K+ > Ca2+ > Mg2+. The elevated Electrical conductivity (EC), Cl− and high content of Na+ relative to Ca2+, Mg2+ and K+ samples suggest their saline origin. While Total hardness, and SAR, soluble sodium percentage (SSP) and other important analysis indicated that most of the surface water and DTW samples were not suitable for irrigation. Plotting from Wilcox diagram evidenced that most of the surface water especially river water and DTW of the study area had higher SSP values greater than 80 indicating a threat of salinity hazard. Among the surface water samples, 2 (25%) fell under “good” class, 2 (25%) fell under “fair” class and 4 (50%) fell under “poor” class. Among the STW water samples, 4 (40%) fell under “good” class, 4 (40%) fell under “fair” class and 2 (20%) fell under “poor” class indicating suitability. Key words: Salinity hazard, irrigation, water quality, Sodium Adsorption Ratio (SAR), Soluble Sodium Percentage (SSP), Electrical conductivity, surface water, ground water INTRODUCTION Water, the vital element in all aspects of life on Earth, plays an extremely important role for human being, socio-economic development and the existence of ecosystems [3]. The quality and quantity of any water supply planning is highly important, especially when considering for irrigation purposes. Bangladesh is an irrigated-agriculture based country and is dependent on adequate water supply of usable quality. As the crop yield is directly related to quality of water used for irrigation, an assessment of groundwater suitability for irrigation is essential for the growth of food production and poverty eradication [26]. Salinity is an ever-present threat to agriculture [7]. However, salinity becomes a major problem in Bangladesh in terms of irrigation. A large number of non saline areas are attacked by the salinity problem had increased within last few decades and the agricultural production of those affected area is also affected. Salinity causes unfavorable environment and hydrological situation that restrict normal crop production throughout the year.
International Journal of Plant, Animal and Environmental Sciences Page: 233 Available online at www.ijpaes.com
Mashura Shammi et al Copyrights@2015 ISSN 2231-4490
The dominance of salt water across the surface of the earth has lead to the widespread occurrence of salt-affected soils [7]. The freshly deposited alluviums from upstream in the coastal areas of Bangladesh become saline as it comes in contact with the sea water and continues to be inundated during high tides and ingress of sea water through creeks. The factors which contribute significantly to the development of saline soils are, tidal flooding during wet season (June-October), direct inundation by saline or brackish water and upward or lateral movement of saline ground water during dry season (November-May) [12]. Previously, water quality concerns have often been neglected because good quality water supplies have been plentiful and readily available [14]. Conditions of water quality and quantity are two key factors impacting groundwater utilization for irrigation [15]. In terms of irrigation water quality of the hydro chemical characteristics, very few studies were conducted in the coastal districts of Bangladesh. Shallow groundwater in a coastal region (Khulna) of southwest Bangladesh have been evaluated based on different indices for drinking and irrigation uses and analyzed for major cations and anions and reported that most groundwater was slightly alkaline and largely varied in chemical composition [6]. The groundwater is dominantly of Na–Cl type brackish water [10]. Rahman et al. [22] assessed groundwater quality of deep aquifer for irrigation in southwestern zone of Bangladesh and found that the Northern deep groundwater has the highest salinity and other chemical concentrations which showed a decreasing trend towards the south [22]. Low chemical concentrations in the southern region indicated the best quality groundwater for irrigation. A previous report [2] investigated the shallow groundwater quality from six wards of Khulna City Corporation of Bangladesh and concluded that the study area was highly associated with the salinity and iron problem, especially in dry season. Only one study was found regarding the salinity occurrences in Gopalganj district [27] which reported that the temporal and spatial status of water salinity condition in Kumar-Modhumoti River and found that during pre-monsoon (March–April) season, the conductivity of river water was high and ranged from 3.5 dS/m to 4.0 dS/m, while in the post monsoon season (Aug-Sept), the conductivity of river water decreased (0.3–0.4 dS/m) [27]. However, detailed investigation regarding the salinity hazard in the irrigation water quality and its suitability for crops has not yet been done in this area. As most of the people of these districts are dependent on agriculture and crop production which in the run is highly dependent on good quality irrigation water. It is very much important to assess the salinity hazard of the irrigation water resource for affected area. Keeping these in mind, the objective of the research was to assess the hydrochemistry of surface water and groundwater and to evaluate the suitability of irrigation water quality of different sources of Gpalgonj districts in Bangladesh and of choosing the best source of water that has the potential to meet irrigation water quality. MATERIALS AND METHODS Sample collection and analysis The study area Gopalganj district, is situated in Dhaka division of Bangladesh with latitude 23°20´ to 22°50´ North and 90°05´ to 89°40´ East [5]. Gopalganj Sadar Upazila was chosen for the study site. The water samples were collected from various irrigation sources in the month of March 2012. One canal water sample, 3 pond water samples, four river water samples, 8 shallow tube well (STW) samples and three deep tube well (DTW) samples were collected (Supplementary Table 1) and preserved in 500 ml plastic PET bottles according to the standard methods mentioned in APHA [1]. The depth of the STW is 100-150 feet while the depth of DTW was 600 feet. Two sets of same sample were collected from each location. One set of sample was kept under non-acidified condition and another kept under acidified condition by adding 0.01 M nitric acid. Physical parameters Electrical conductivity (EC), pH and DO were measured by using potable TOA-DKK meters instantly at the site by using the probe model HM 30P, DO 31P and CM 31P respectively. All parameters were measured three times. Only high pure (AnalR grade) chemicals and double distilled water was used for preparing solution for analysis according to the method described elsewhere [13]. For determining the concentration of Ca2+, and Mg2+ the samples were directly run into the Atomic Adsorption Spectrometer (AAS) (Model No. Shimadzu AA-7000 series). Sulfate (SO4
2¯) and phosphate (PO43¯) was determined by UV-Spectrophotometer model no. SPECORD222A433
at 420 nm wavelength by Turbidimetric method (using Tween-80) and 490 nm wavelength by Vanado-Molybdate Phosphoric Yellow Color Method meqL-1 [13]. Chloride (Cl¯) was determined by volumetric method. Sodium (Na+) and Potassium (K+) was determined by Flame photometer (Model No. : Jencons, PFP7).
International Journal of Plant, Animal and Environmental Sciences Page: 234 Available online at www.ijpaes.com
Mashura Shammi et al Copyrights@2015 ISSN 2231-4490
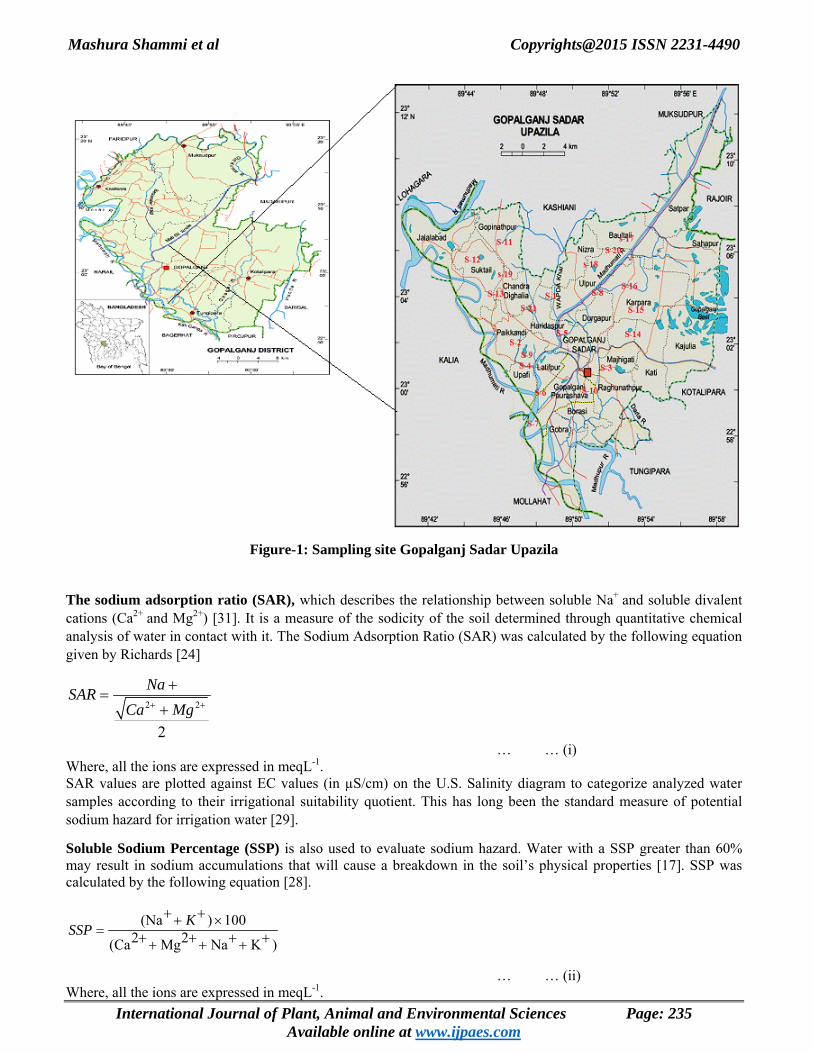
Figure-1: Sampling site Gopalganj Sadar Upazila The sodium adsorption ratio (SAR), which describes the relationship between soluble Na+ and soluble divalent cations (Ca2+ and Mg2+) [31]. It is a measure of the sodicity of the soil determined through quantitative chemical analysis of water in contact with it. The Sodium Adsorption Ratio (SAR) was calculated by the following equation given by Richards [24]
2 2
2
NaSARCa Mg+ +
+=
+
… … (i) Where, all the ions are expressed in meqL-1. SAR values are plotted against EC values (in µS/cm) on the U.S. Salinity diagram to categorize analyzed water samples according to their irrigational suitability quotient. This has long been the standard measure of potential sodium hazard for irrigation water [29].
Soluble Sodium Percentage (SSP) is also used to evaluate sodium hazard. Water with a SSP greater than 60% may result in sodium accumulations that will cause a breakdown in the soil’s physical properties [17]. SSP was calculated by the following equation [28].
(Na ) 1002 2(Ca Mg Na K )
KSSP
+ ++ ×= + + + ++ + +
… … (ii) Where, all the ions are expressed in meqL-1.
International Journal of Plant, Animal and Environmental Sciences Page: 235 Available online at www.ijpaes.com
Mashura Shammi et al Copyrights@2015 ISSN 2231-4490
The SSP values and the EC values have been plotted on the Wilcox diagram [30]. Total Hardness (TH) and Magnesium Adsorption Ratio (MAR) was calculated by the equation proposed previously by Raghunath [23].
2 2 50TH Ca Mg+ += × × … … (iii) Where, TH is expressed in meq/L (mgL-1) and the concentrations of the constituents are expressed in meqL-1.
2 1002 2
MgMAR
Mg Ca
+ ×= + ++
… … (iv) Where, all the ionic concentrations are expressed in meqL-1. Kelly’s ratio [16] is also an important parameter for irrigation water quality, which is measured considering sodium ion concentration against calcium and magnesium ion concentrations. Kelly’s ratio of more than 1 indicates an excess level of Na+ in water. Water with a value of KR < 1 is considered suitable for irrigation, while those with a ratio more than 3 is considered as unsuitable for irrigation. The Kelly’s Ratio was calculated using the equation [16] as:
Na
' 2 2Ca MgKelly sRatio
+= + ++
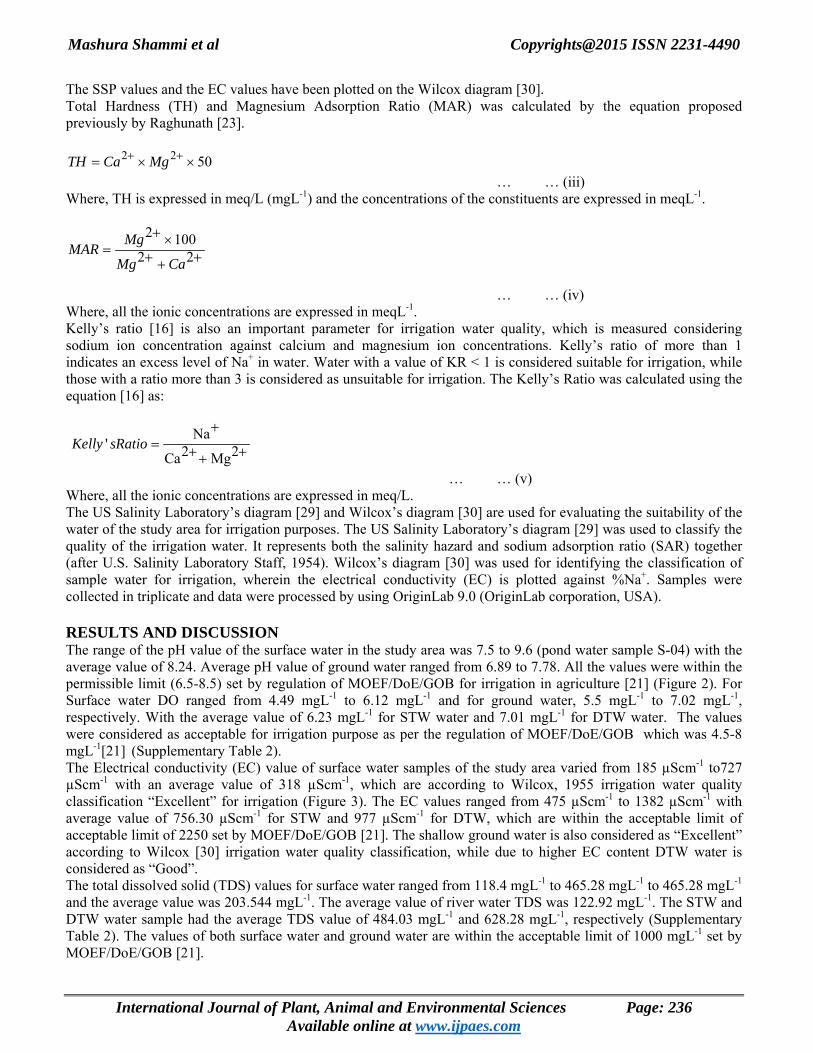
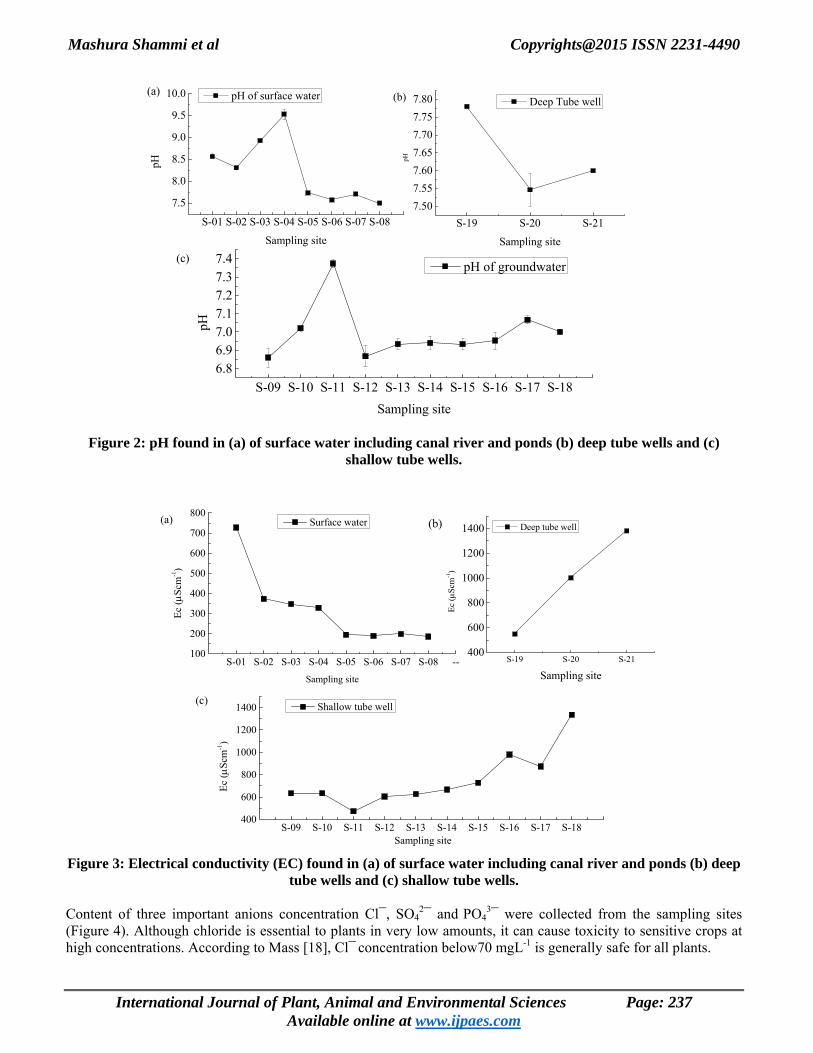
… … (v) Where, all the ionic concentrations are expressed in meq/L. The US Salinity Laboratory’s diagram [29] and Wilcox’s diagram [30] are used for evaluating the suitability of the water of the study area for irrigation purposes. The US Salinity Laboratory’s diagram [29] was used to classify the quality of the irrigation water. It represents both the salinity hazard and sodium adsorption ratio (SAR) together (after U.S. Salinity Laboratory Staff, 1954). Wilcox’s diagram [30] was used for identifying the classification of sample water for irrigation, wherein the electrical conductivity (EC) is plotted against %Na+. Samples were collected in triplicate and data were processed by using OriginLab 9.0 (OriginLab corporation, USA). RESULTS AND DISCUSSION The range of the pH value of the surface water in the study area was 7.5 to 9.6 (pond water sample S-04) with the average value of 8.24. Average pH value of ground water ranged from 6.89 to 7.78. All the values were within the permissible limit (6.5-8.5) set by regulation of MOEF/DoE/GOB for irrigation in agriculture [21] (Figure 2). For Surface water DO ranged from 4.49 mgL-1 to 6.12 mgL-1 and for ground water, 5.5 mgL-1 to 7.02 mgL-1, respectively. With the average value of 6.23 mgL-1 for STW water and 7.01 mgL-1 for DTW water. The values were considered as acceptable for irrigation purpose as per the regulation of MOEF/DoE/GOB which was 4.5-8 mgL-1[21] (Supplementary Table 2). The Electrical conductivity (EC) value of surface water samples of the study area varied from 185 µScm-1 to727 µScm-1 with an average value of 318 µScm-1, which are according to Wilcox, 1955 irrigation water quality classification “Excellent” for irrigation (Figure 3). The EC values ranged from 475 µScm-1 to 1382 µScm-1 with average value of 756.30 µScm-1 for STW and 977 µScm-1 for DTW, which are within the acceptable limit of acceptable limit of 2250 set by MOEF/DoE/GOB [21]. The shallow ground water is also considered as “Excellent” according to Wilcox [30] irrigation water quality classification, while due to higher EC content DTW water is considered as “Good”. The total dissolved solid (TDS) values for surface water ranged from 118.4 mgL-1 to 465.28 mgL-1 to 465.28 mgL-1 and the average value was 203.544 mgL-1. The average value of river water TDS was 122.92 mgL-1. The STW and DTW water sample had the average TDS value of 484.03 mgL-1 and 628.28 mgL-1, respectively (Supplementary Table 2). The values of both surface water and ground water are within the acceptable limit of 1000 mgL-1 set by MOEF/DoE/GOB [21].
International Journal of Plant, Animal and Environmental Sciences Page: 236 Available online at www.ijpaes.com
Mashura Shammi et al Copyrights@2015 ISSN 2231-4490
S-01 S-02 S-03 S-04 S-05 S-06 S-07 S-08
7.5
8.0
8.5
9.0
9.5
10.0
S-19 S-20 S-217.507.557.607.657.707.757.80
S-09 S-10 S-11 S-12 S-13 S-14 S-15 S-16 S-17 S-186.86.97.07.17.27.37.4
pH
Sampling site
pH of surface water (b)
pH
Sampling site
Deep Tube well(a)
pH
Sampling site
pH of groundwater(c)
Figure 2: pH found in (a) of surface water including canal river and ponds (b) deep tube wells and (c)
shallow tube wells.
S-01 S-02 S-03 S-04 S-05 S-06 S-07 S-08 --100
200
300
400
500
600
700
800
S-09 S-10 S-11 S-12 S-13 S-14 S-15 S-16 S-17 S-18400
600
800
1000
1200
1400
S-19 S-20 S-21400
600
800
1000
1200
1400
Ec (µ
Scm
-1)
Sampling site
Surface water (b)
(c)
Ec (µ
Scm
-1)
Sampling site
Shallow tube well
Ec (µ
Scm
-1)
Sampling site
Deep tube well(a)
Figure 3: Electrical conductivity (EC) found in (a) of surface water including canal river and ponds (b) deep
tube wells and (c) shallow tube wells. Content of three important anions concentration Cl¯, SO4
2¯ and PO43¯ were collected from the sampling sites
(Figure 4). Although chloride is essential to plants in very low amounts, it can cause toxicity to sensitive crops at high concentrations. According to Mass [18], Cl¯ concentration below70 mgL-1 is generally safe for all plants.
International Journal of Plant, Animal and Environmental Sciences Page: 237 Available online at www.ijpaes.com
Mashura Shammi et al Copyrights@2015 ISSN 2231-4490
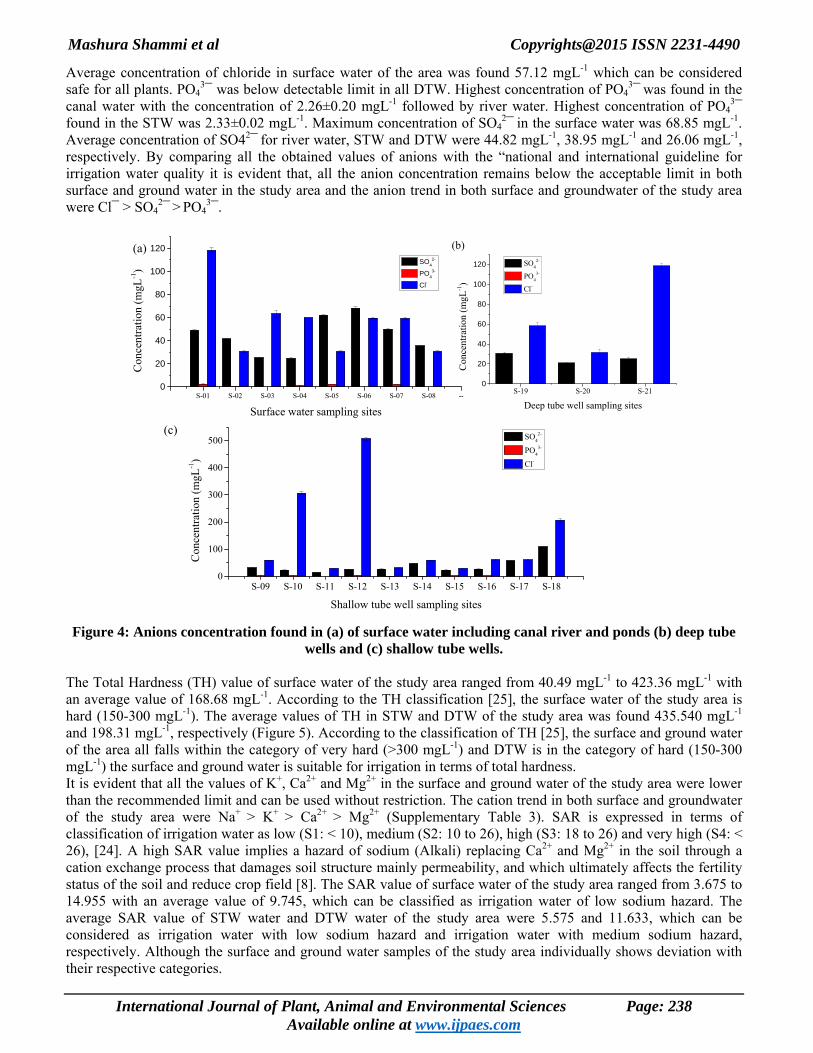
Average concentration of chloride in surface water of the area was found 57.12 mgL-1 which can be considered safe for all plants. PO4
3¯ was below detectable limit in all DTW. Highest concentration of PO43¯ was found in the
canal water with the concentration of 2.26±0.20 mgL-1 followed by river water. Highest concentration of PO43¯
found in the STW was 2.33±0.02 mgL-1. Maximum concentration of SO42¯ in the surface water was 68.85 mgL-1.
Average concentration of SO42¯ for river water, STW and DTW were 44.82 mgL-1, 38.95 mgL-1 and 26.06 mgL-1, respectively. By comparing all the obtained values of anions with the “national and international guideline for irrigation water quality it is evident that, all the anion concentration remains below the acceptable limit in both surface and ground water in the study area and the anion trend in both surface and groundwater of the study area were Cl¯ > SO4
2¯ > PO43¯.
S-01 S-02 S-03 S-04 S-05 S-06 S-07 S-08 --0
20
40
60
80
100
120
Con
cent
ratio
n (m
gL-1)
Surface water sampling sites
SO42-
PO43-
Cl-
(b)
S-09 S-10 S-11 S-12 S-13 S-14 S-15 S-16 S-17 S-180
100
200
300
400
500
Con
cent
ratio
n (m
gL-1)
Shallow tube well sampling sites
SO42-
PO43-
Cl-
(a)
(c)
S-19 S-20 S-210
20
40
60
80
100
120
Con
cent
ratio
n (m
gL-1
)
Deep tube well sampling sites
SO42-
PO43-
Cl-
Figure 4: Anions concentration found in (a) of surface water including canal river and ponds (b) deep tube
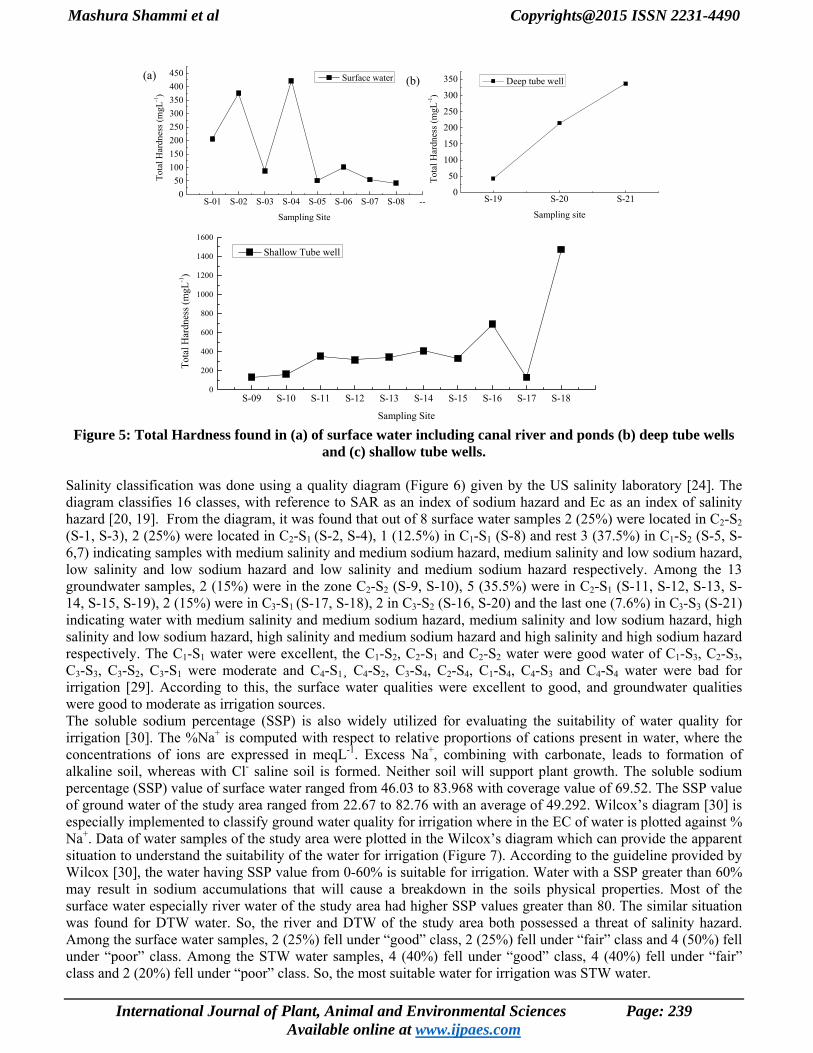
wells and (c) shallow tube wells. The Total Hardness (TH) value of surface water of the study area ranged from 40.49 mgL-1 to 423.36 mgL-1 with an average value of 168.68 mgL-1. According to the TH classification [25], the surface water of the study area is hard (150-300 mgL-1). The average values of TH in STW and DTW of the study area was found 435.540 mgL-1 and 198.31 mgL-1, respectively (Figure 5). According to the classification of TH [25], the surface and ground water of the area all falls within the category of very hard (>300 mgL-1) and DTW is in the category of hard (150-300 mgL-1) the surface and ground water is suitable for irrigation in terms of total hardness. It is evident that all the values of K+, Ca2+ and Mg2+ in the surface and ground water of the study area were lower than the recommended limit and can be used without restriction. The cation trend in both surface and groundwater of the study area were Na+ > K+ > Ca2+ > Mg2+ (Supplementary Table 3). SAR is expressed in terms of classification of irrigation water as low (S1: < 10), medium (S2: 10 to 26), high (S3: 18 to 26) and very high (S4: < 26), [24]. A high SAR value implies a hazard of sodium (Alkali) replacing Ca2+ and Mg2+ in the soil through a cation exchange process that damages soil structure mainly permeability, and which ultimately affects the fertility status of the soil and reduce crop field [8]. The SAR value of surface water of the study area ranged from 3.675 to 14.955 with an average value of 9.745, which can be classified as irrigation water of low sodium hazard. The average SAR value of STW water and DTW water of the study area were 5.575 and 11.633, which can be considered as irrigation water with low sodium hazard and irrigation water with medium sodium hazard, respectively. Although the surface and ground water samples of the study area individually shows deviation with their respective categories.
International Journal of Plant, Animal and Environmental Sciences Page: 238 Available online at www.ijpaes.com
Mashura Shammi et al Copyrights@2015 ISSN 2231-4490
S-01 S-02 S-03 S-04 S-05 S-06 S-07 S-08 --0
50100150200250300350400450
S-09 S-10 S-11 S-12 S-13 S-14 S-15 S-16 S-17 S-180
200
400
600
800
1000
1200
1400
1600
S-19 S-20 S-210
50
100
150
200
250
300
350
Tota
l Har
dnes
s (m
gL-1)
Sampling Site
Surface water (b)
Tota
l Har
dnes
s (m
gL-1
)
Sampling Site
Shallow Tube well
(a)
Tota
l Har
dnes
s (m
gL-1)
Sampling site
Deep tube well
Figure 5: Total Hardness found in (a) of surface water including canal river and ponds (b) deep tube wells
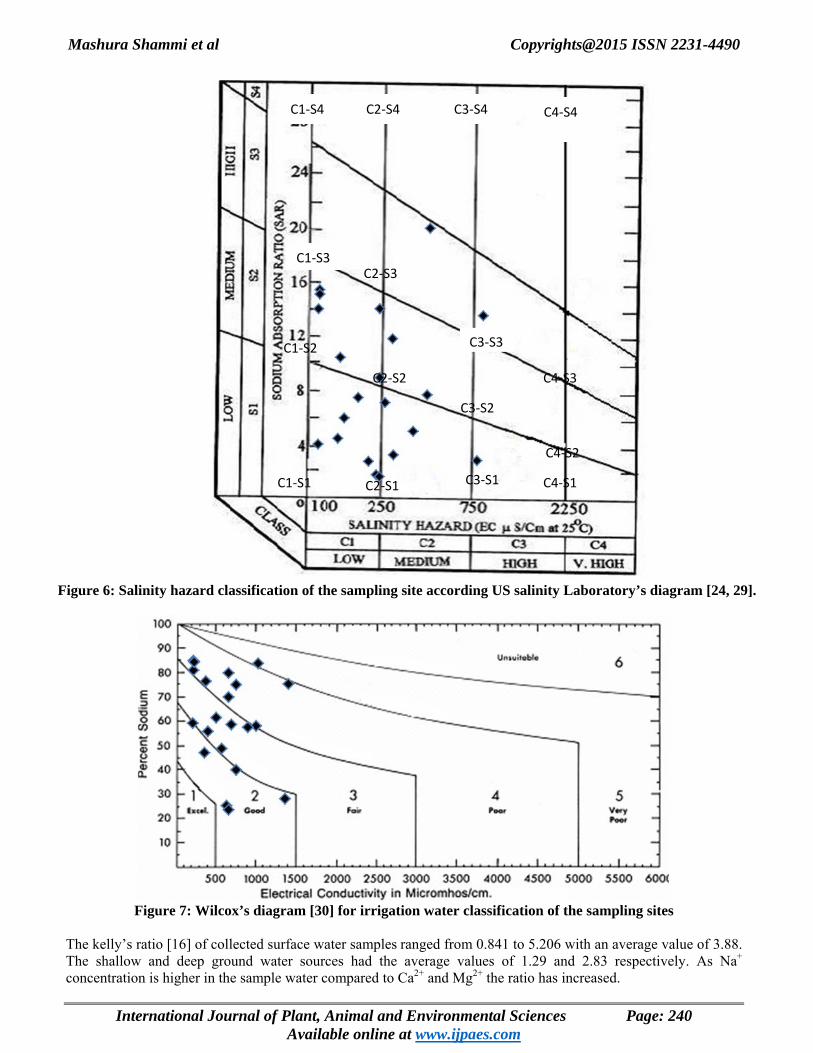
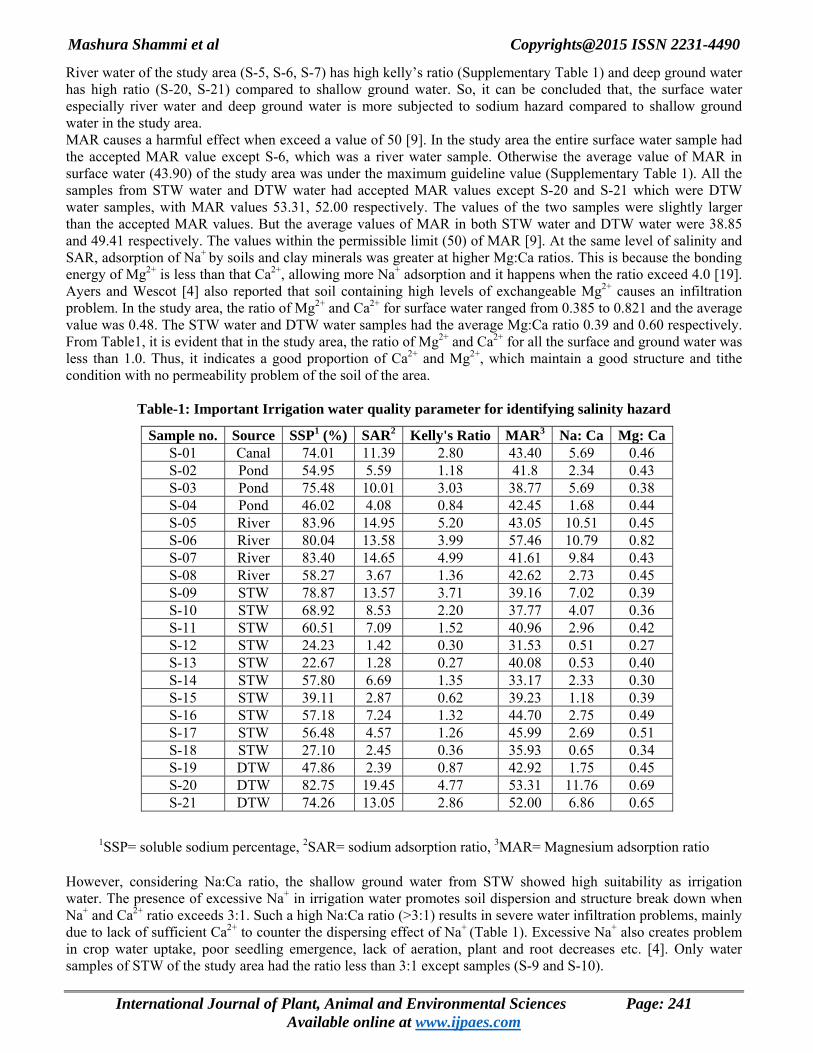
and (c) shallow tube wells. Salinity classification was done using a quality diagram (Figure 6) given by the US salinity laboratory [24]. The diagram classifies 16 classes, with reference to SAR as an index of sodium hazard and Ec as an index of salinity hazard [20, 19]. From the diagram, it was found that out of 8 surface water samples 2 (25%) were located in C2-S2 (S-1, S-3), 2 (25%) were located in C2-S1 (S-2, S-4), 1 (12.5%) in C1-S1 (S-8) and rest 3 (37.5%) in C1-S2 (S-5, S-6,7) indicating samples with medium salinity and medium sodium hazard, medium salinity and low sodium hazard, low salinity and low sodium hazard and low salinity and medium sodium hazard respectively. Among the 13 groundwater samples, 2 (15%) were in the zone C2-S2 (S-9, S-10), 5 (35.5%) were in C2-S1 (S-11, S-12, S-13, S-14, S-15, S-19), 2 (15%) were in C3-S1 (S-17, S-18), 2 in C3-S2 (S-16, S-20) and the last one (7.6%) in C3-S3 (S-21) indicating water with medium salinity and medium sodium hazard, medium salinity and low sodium hazard, high salinity and low sodium hazard, high salinity and medium sodium hazard and high salinity and high sodium hazard respectively. The C1-S1 water were excellent, the C1-S2, C2-S1 and C2-S2 water were good water of C1-S3, C2-S3, C3-S3, C3-S2, C3-S1 were moderate and C4-S1¸ C4-S2, C3-S4, C2-S4, C1-S4, C4-S3 and C4-S4 water were bad for irrigation [29]. According to this, the surface water qualities were excellent to good, and groundwater qualities were good to moderate as irrigation sources. The soluble sodium percentage (SSP) is also widely utilized for evaluating the suitability of water quality for irrigation [30]. The %Na+ is computed with respect to relative proportions of cations present in water, where the concentrations of ions are expressed in meqL-1. Excess Na+, combining with carbonate, leads to formation of alkaline soil, whereas with Cl- saline soil is formed. Neither soil will support plant growth. The soluble sodium percentage (SSP) value of surface water ranged from 46.03 to 83.968 with coverage value of 69.52. The SSP value of ground water of the study area ranged from 22.67 to 82.76 with an average of 49.292. Wilcox’s diagram [30] is especially implemented to classify ground water quality for irrigation where in the EC of water is plotted against % Na+. Data of water samples of the study area were plotted in the Wilcox’s diagram which can provide the apparent situation to understand the suitability of the water for irrigation (Figure 7). According to the guideline provided by Wilcox [30], the water having SSP value from 0-60% is suitable for irrigation. Water with a SSP greater than 60% may result in sodium accumulations that will cause a breakdown in the soils physical properties. Most of the surface water especially river water of the study area had higher SSP values greater than 80. The similar situation was found for DTW water. So, the river and DTW of the study area both possessed a threat of salinity hazard. Among the surface water samples, 2 (25%) fell under “good” class, 2 (25%) fell under “fair” class and 4 (50%) fell under “poor” class. Among the STW water samples, 4 (40%) fell under “good” class, 4 (40%) fell under “fair” class and 2 (20%) fell under “poor” class. So, the most suitable water for irrigation was STW water.
International Journal of Plant, Animal and Environmental Sciences Page: 239 Available online at www.ijpaes.com
Mashura Shammi et al Copyrights@2015 ISSN 2231-4490
Figure 6: Salinity hazard classification of the sampling site according US salinity Laboratory’s diagram [24, 29].
Figure 7: Wilcox’s diagram [30] for irrigation water classification of the sampling sites
The kelly’s ratio [16] of collected surface water samples ranged from 0.841 to 5.206 with an average value of 3.88. The shallow and deep ground water sources had the average values of 1.29 and 2.83 respectively. As Na+
concentration is higher in the sample water compared to Ca2+ and Mg2+ the ratio has increased.
International Journal of Plant, Animal and Environmental Sciences Page: 240 Available online at www.ijpaes.com
C1‐S4 C2‐S4 C3‐S4 C4‐S4
C1‐S3C2‐S3
C3‐S3
C4‐S3
C4‐S2
C3‐S2
C2‐S2
C1‐S2
C1‐S1 C2‐S1 C3‐S1 C4‐S1
Mashura Shammi et al Copyrights@2015 ISSN 2231-4490
River water of the study area (S-5, S-6, S-7) has high kelly’s ratio (Supplementary Table 1) and deep ground water has high ratio (S-20, S-21) compared to shallow ground water. So, it can be concluded that, the surface water especially river water and deep ground water is more subjected to sodium hazard compared to shallow ground water in the study area. MAR causes a harmful effect when exceed a value of 50 [9]. In the study area the entire surface water sample had the accepted MAR value except S-6, which was a river water sample. Otherwise the average value of MAR in surface water (43.90) of the study area was under the maximum guideline value (Supplementary Table 1). All the samples from STW water and DTW water had accepted MAR values except S-20 and S-21 which were DTW water samples, with MAR values 53.31, 52.00 respectively. The values of the two samples were slightly larger than the accepted MAR values. But the average values of MAR in both STW water and DTW water were 38.85 and 49.41 respectively. The values within the permissible limit (50) of MAR [9]. At the same level of salinity and SAR, adsorption of Na+ by soils and clay minerals was greater at higher Mg:Ca ratios. This is because the bonding energy of Mg2+ is less than that Ca2+, allowing more Na+ adsorption and it happens when the ratio exceed 4.0 [19]. Ayers and Wescot [4] also reported that soil containing high levels of exchangeable Mg2+ causes an infiltration problem. In the study area, the ratio of Mg2+ and Ca2+ for surface water ranged from 0.385 to 0.821 and the average value was 0.48. The STW water and DTW water samples had the average Mg:Ca ratio 0.39 and 0.60 respectively. From Table1, it is evident that in the study area, the ratio of Mg2+ and Ca2+ for all the surface and ground water was less than 1.0. Thus, it indicates a good proportion of Ca2+ and Mg2+, which maintain a good structure and tithe condition with no permeability problem of the soil of the area.
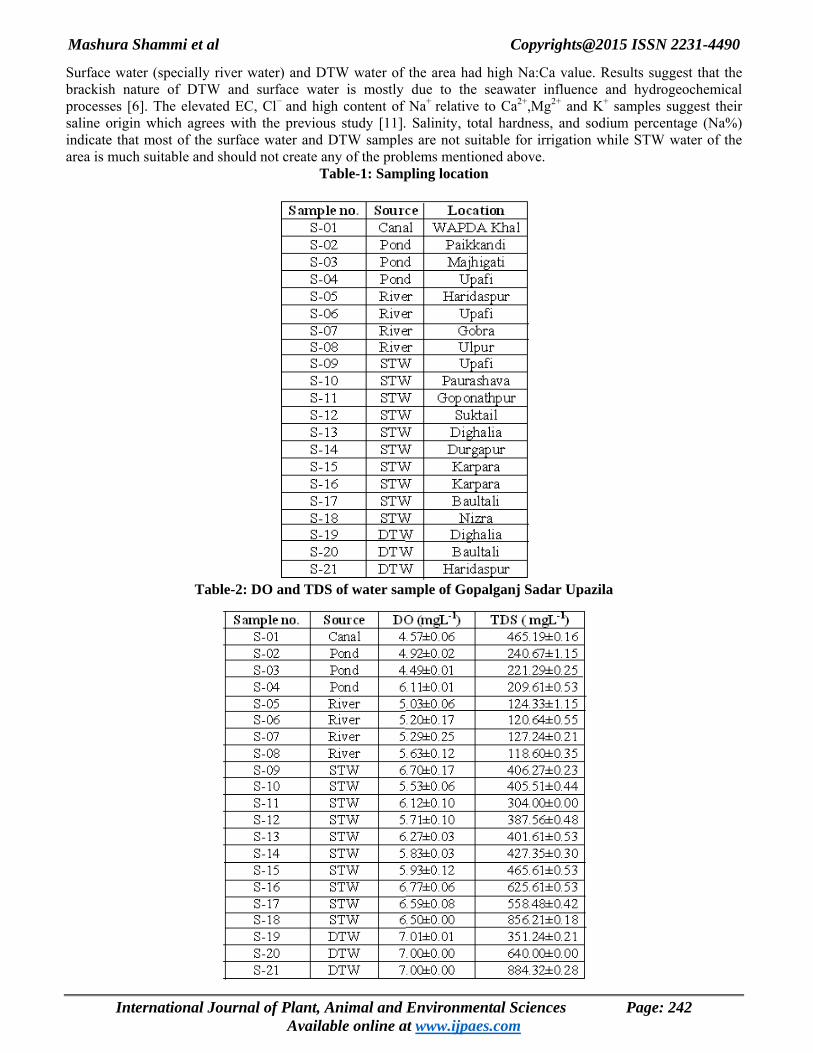
Table-1: Important Irrigation water quality parameter for identifying salinity hazard
1SSP= soluble sodium percentage, 2SAR= sodium adsorption ratio, 3MAR= Magnesium adsorption ratio
However, considering Na:Ca ratio, the shallow ground water from STW showed high suitability as irrigation water. The presence of excessive Na+ in irrigation water promotes soil dispersion and structure break down when Na+ and Ca2+ ratio exceeds 3:1. Such a high Na:Ca ratio (>3:1) results in severe water infiltration problems, mainly due to lack of sufficient Ca2+ to counter the dispersing effect of Na+ (Table 1). Excessive Na+ also creates problem in crop water uptake, poor seedling emergence, lack of aeration, plant and root decreases etc. [4]. Only water samples of STW of the study area had the ratio less than 3:1 except samples (S-9 and S-10).
International Journal of Plant, Animal and Environmental Sciences Page: 241 Available online at www.ijpaes.com
Sample no. Source SSP1 (%) SAR2 Kelly's Ratio MAR3 Na: Ca Mg: CaS-01 Canal 74.01 11.39 2.80 43.40 5.69 0.46 S-02 Pond 54.95 5.59 1.18 41.8 2.34 0.43 S-03 Pond 75.48 10.01 3.03 38.77 5.69 0.38 S-04 Pond 46.02 4.08 0.84 42.45 1.68 0.44 S-05 River 83.96 14.95 5.20 43.05 10.51 0.45 S-06 River 80.04 13.58 3.99 57.46 10.79 0.82 S-07 River 83.40 14.65 4.99 41.61 9.84 0.43 S-08 River 58.27 3.67 1.36 42.62 2.73 0.45 S-09 STW 78.87 13.57 3.71 39.16 7.02 0.39 S-10 STW 68.92 8.53 2.20 37.77 4.07 0.36 S-11 STW 60.51 7.09 1.52 40.96 2.96 0.42 S-12 STW 24.23 1.42 0.30 31.53 0.51 0.27 S-13 STW 22.67 1.28 0.27 40.08 0.53 0.40 S-14 STW 57.80 6.69 1.35 33.17 2.33 0.30 S-15 STW 39.11 2.87 0.62 39.23 1.18 0.39 S-16 STW 57.18 7.24 1.32 44.70 2.75 0.49 S-17 STW 56.48 4.57 1.26 45.99 2.69 0.51 S-18 STW 27.10 2.45 0.36 35.93 0.65 0.34 S-19 DTW 47.86 2.39 0.87 42.92 1.75 0.45 S-20 DTW 82.75 19.45 4.77 53.31 11.76 0.69 S-21 DTW 74.26 13.05 2.86 52.00 6.86 0.65
Mashura Shammi et al Copyrights@2015 ISSN 2231-4490
Surface water (specially river water) and DTW water of the area had high Na:Ca value. Results suggest that the brackish nature of DTW and surface water is mostly due to the seawater influence and hydrogeochemical processes [6]. The elevated EC, Cl− and high content of Na+ relative to Ca2+,Mg2+ and K+ samples suggest their saline origin which agrees with the previous study [11]. Salinity, total hardness, and sodium percentage (Na%) indicate that most of the surface water and DTW samples are not suitable for irrigation while STW water of the area is much suitable and should not create any of the problems mentioned above.
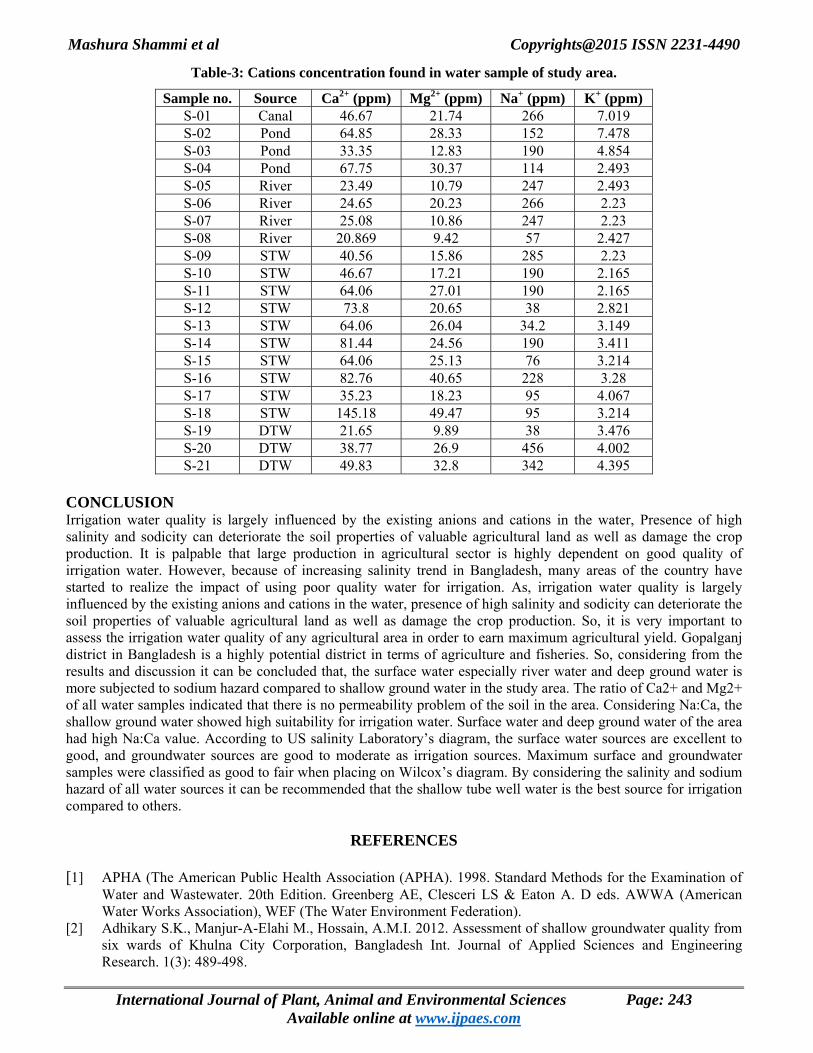
Table-1: Sampling location
Table-2: DO and TDS of water sample of Gopalganj Sadar Upazila
International Journal of Plant, Animal and Environmental Sciences Page: 242 Available online at www.ijpaes.com
Mashura Shammi et al Copyrights@2015 ISSN 2231-4490
Table-3: Cations concentration found in water sample of study area.
Sample no. Source Ca2+ (ppm) Mg2+ (ppm) Na+ (ppm) K+ (ppm) S-01 Canal 46.67 21.74 266 7.019 S-02 Pond 64.85 28.33 152 7.478 S-03 Pond 33.35 12.83 190 4.854 S-04 Pond 67.75 30.37 114 2.493 S-05 River 23.49 10.79 247 2.493 S-06 River 24.65 20.23 266 2.23 S-07 River 25.08 10.86 247 2.23 S-08 River 20.869 9.42 57 2.427 S-09 STW 40.56 15.86 285 2.23 S-10 STW 46.67 17.21 190 2.165 S-11 STW 64.06 27.01 190 2.165 S-12 STW 73.8 20.65 38 2.821 S-13 STW 64.06 26.04 34.2 3.149 S-14 STW 81.44 24.56 190 3.411 S-15 STW 64.06 25.13 76 3.214 S-16 STW 82.76 40.65 228 3.28 S-17 STW 35.23 18.23 95 4.067 S-18 STW 145.18 49.47 95 3.214 S-19 DTW 21.65 9.89 38 3.476 S-20 DTW 38.77 26.9 456 4.002 S-21 DTW 49.83 32.8 342 4.395
CONCLUSION Irrigation water quality is largely influenced by the existing anions and cations in the water, Presence of high salinity and sodicity can deteriorate the soil properties of valuable agricultural land as well as damage the crop production. It is palpable that large production in agricultural sector is highly dependent on good quality of irrigation water. However, because of increasing salinity trend in Bangladesh, many areas of the country have started to realize the impact of using poor quality water for irrigation. As, irrigation water quality is largely influenced by the existing anions and cations in the water, presence of high salinity and sodicity can deteriorate the soil properties of valuable agricultural land as well as damage the crop production. So, it is very important to assess the irrigation water quality of any agricultural area in order to earn maximum agricultural yield. Gopalganj district in Bangladesh is a highly potential district in terms of agriculture and fisheries. So, considering from the results and discussion it can be concluded that, the surface water especially river water and deep ground water is more subjected to sodium hazard compared to shallow ground water in the study area. The ratio of Ca2+ and Mg2+ of all water samples indicated that there is no permeability problem of the soil in the area. Considering Na:Ca, the shallow ground water showed high suitability for irrigation water. Surface water and deep ground water of the area had high Na:Ca value. According to US salinity Laboratory’s diagram, the surface water sources are excellent to good, and groundwater sources are good to moderate as irrigation sources. Maximum surface and groundwater samples were classified as good to fair when placing on Wilcox’s diagram. By considering the salinity and sodium hazard of all water sources it can be recommended that the shallow tube well water is the best source for irrigation compared to others.
REFERENCES
[1] APHA (The American Public Health Association (APHA). 1998. Standard Methods for the Examination of Water and Wastewater. 20th Edition. Greenberg AE, Clesceri LS & Eaton A. D eds. AWWA (American Water Works Association), WEF (The Water Environment Federation).
[2] Adhikary S.K., Manjur-A-Elahi M., Hossain, A.M.I. 2012. Assessment of shallow groundwater quality from six wards of Khulna City Corporation, Bangladesh Int. Journal of Applied Sciences and Engineering Research. 1(3): 489-498.
International Journal of Plant, Animal and Environmental Sciences Page: 243
Available online at www.ijpaes.com
Mashura Shammi et al Copyrights@2015 ISSN 2231-4490
[3] An, T.D., Tsujimura, M., Le Phu, V, Kawachi, A, Ha, D.T. 2014. Chemical Characteristics of Surface Water
and Groundwater in Coastal Watershed, Mekong Delta, Vietnam. Procedia Environmental Sciences, 20: 712-721. doi: 10.1016/j.proenv.2014.03.085
[4] Ayers, R.S., Westcot, D.W. 1985. Water quality for agriculture. Irrigation and drainage. Paper No. 29. Food and Agriculture Organization of the United Nations, Rome, Italy, pp. 1-117.
[5] Banglapedia. 2010. National Encyclopedia of Bangladesh.Asiatic Society of Bangladesh, Dhaka, Bangladesh [6] Bahar, M.M., Reza, M.S. 2010. Hydrochemical characteristics and quality assessment of shallow
groundwater in a coastal area of Southwest Bangladesh. Environmental Earth Sciences, 61(5): 1065-1073. doi: 10.1007/s12665-009-0427-4
[7] Flowers, T.J., Flowers, S.A. 2005. Why does salinity pose such a difficult problem for plant breeders? Agri. Water Manag. 78(1-2):15-24. doi: 10.1016/j.agwat.2005.04.015
[8] Gupta, P.K. 2005. Methods in Environmental Analysis: Water, Soil and Air. Agrobios, Jodhpur, India, pp. 1-127.
[9] Gupta, S.K, Gupta, I.C. 1987. Management of Saline Soils and Water. Oxford and IBH publication Co., New Delhi, India, pp. 399.
[10] Halim, M.A., Majumder, R.K, Nessa, S.A, Hiroshiro, Y, Sasaki, K, Saha, B.B, Saepuloh, A., Jinno, K. 2010. Evaluation of processes controlling the geochemical constituents in deep groundwater in Bangladesh: spatial variability on arsenic and boron enrichment. J Hazard Mater, 180(1-3), 50-62. doi: 10.1016/j.jhazmat.2010.01.008
[11] Halim, M. A, Majumder, R. K, Nessa, S. A, Hiroshiro, Y, Uddin, M. J, Shimada, J, Jinno, K. 2009. Hydrogeochemistry and arsenic contamination of groundwater in the Ganges Delta Plain, Bangladesh. J. Hazard. Mater. 164(2-3), 1335-1345. doi: 10.1016/j.jhazmat.2008.09.046
[12] Haque, S.A. 2006. Salinity Problems and Crop Production in Coastal Regions of Bangladesh. Pak. J. Bot., 38(5):1359-1365.
[13] Huq, S.M.I., Alam, M.D. 2005. A Handbook on Analyses of Soil, Plant and Water. BACER-DU, University of Dhaka, Bangladesh. ISBN: 984-32-1770-5.
[14] Islam, M.S., Shamsad, S.Z.K.M. 2009. Assessment of Irrigation Water Quality of Bogra District in Bangladesh Bangladesh J. Agril. Res., 34(4): 597-608.
[15] Jang, C.-S., Chen, S.-K., & Kuo, Y.-M. (2012). Establishing an irrigation management plan of sustainable groundwater based on spatial variability of water quality and quantity. J. Hydrol. 414-415, 201-210. doi: 10.1016/j.jhydrol.2011.10.032
[16] Kelly, W.P. 1963. Use of Saline Irrigation Water. Soil Sci. 95 (4): 355-391. [17] Khodapanah L., Sulaiman W.N.A. and Khodapanah N. (2009). Groundwater Quality Assessment for
Different Purposes in Eshtehard District, Tehran, Iran. European Journal of Scientific Research. 36(4):543-553.
[18] Mass, E.V. 1990. Crop Salt Tolerance. Agricultural Salinity Assessment and Management Manual. Tanji KK,(ed.) ASCE, New York.
[19] Michael, A.M. 1992. Irrigation theory and practices. Vikash Publishing House Pvt. Ltd., New Delhi, India. [20] Mirsa, R.D. Ahmed, M. 1987. Manual of Irrigation Agronomy, Oxford and IBH Publishing Co. Pvt. Ltd.,
New Delhi, India. pp. 248-271 [21] MOEF/DoE/GOB. 1997. The environment conservation rules 1997. Bangladesh Gazette no. DA-1, Ministry
of Environment and Forest, Dhaka, Bangladesh, pp. 1324-1327. [22] Rahman, M.A.T.M.T., Rahman, S.H., Majumder, R.K. 2012. Groundwater quality for irrigation of deep
aquifer in southwestern zone of Bangladesh. Songklanakarin J. Sci. Technol. 34(3): 345-352. [23] Raghunath, I.I.M. 1987. Groundwater. 2nd edition; Wiley Eastern Ltd., New Delhi, India. [24] Richards, L.A. 1954. Diagnosis and improvement of saline and alkali soils. U.S. Department of Agricultural
Hand-book, Washington D.C., U.S.A. 60: 160. [25] Sawyer, C.N., McCarty, P.L. 1967. Chemistry for Sanitary Engineers. McGraw-Hill, New York, U.S.A. [26] Shahid, S., Chen, X., Hazarika, M.K. 2006 Evaluation of groundwater quality for irrigation in Bangladesh
using Geographic Information System J. Hydrol. Hydromech., 54(1): 3-14. [27] Shammi, M., Bhuiya, G.M.J.A., Ibne Kamal, A.K., Rahman, M.R., Rahman, M.M., Uddin, M.K. 2012.
Investigation of Salinity Occurrences in Kumar-Madhumati River of Gopalganj District, Bangladesh. Journal of Nature Science and Sustainable Technology, 6(4): 299-313.
International Journal of Plant, Animal and Environmental Sciences Page: 244
Available online at www.ijpaes.com
Mashura Shammi et al Copyrights@2015 ISSN 2231-4490
[28] Todd, D.K. 1980. Groundwater Hydrology. Wiley International Edition, John Wiley and Sons. Inc., New York.
[29] USDA/Salinity Laboratory Staff. 1954. Diagnosis and improvement of saline and alkali soil. US Department of Agricultural Hand Book 60, Washington
[30] Wilcox, L.V. 1948. The quality of water for irrigation use. US Department of Agricultural Technical Bulletin 1962, Washington.
[31] Alrajhi, A., Beecham, S., Bolan, N. S., & Hassanli, A. 2015. Evaluation of soil chemical properties irrigated with recycled wastewater under partial root-zone drying irrigation for sustainable tomato production. Agricultural Water Management, 161, 127-135. doi: 10.1016/j.agwat.2015.07.013
International Journal of Plant, Animal and Environmental Sciences Page: 245 Available online at www.ijpaes.com