intermodal logistics centers and their impact on transportation … · 2014-11-26 · intermodal...
TRANSCRIPT

Intermodal Logistics Centers and Their Impact on
Transportation Corridor Industrial Property Value
By
Alexandra Chaustre McNally B.S., The Pennsylvania State University, State College, Pennsylvania, 2012
THESIS
Submitted as partial fulfillment of the requirements
for the degree of Master of Urban Planning and Policy
in the Graduate College of the
University of Illinois at Chicago, 2014
Chicago, Illinois
Defense Committee:
Kazuya Kawamura, Urban Planning and Policy, Chair and Advisor
Stephen Schlickman, Urban Transportation Center
Nebiyou Tilahun, Urban Planning and Policy

ii
TABLE OF CONTENTS
Chapter Page
LIST OF TABLES iv
LIST OF FIGURES v
SUMMARY 1
1. INTRODUCTION
1.1 Background 4
1.2 Case Study Profile: CenterPoint in Elwood and Joliet, IL 6
2. LITERATURE REVIEW 11
2.1 Intermodal Logistic Centers 11
2.2 Economic Impacts 14
2.2.1 Economic Impacts of Passenger-focused
Transportation 14
2.2.2 Economic Impacts of Freight Transportation 16
2.3 Summary 18
2.4 Research Questions 19
3. METHODOLOGY 20
3.1 Overview 20
3.2 Defining Study Scope 25
3.2.1 High Capacity Vehicle AADT 26
3.2.2 Waterway Commodity Data 32
3.2.3 Equalized Assessed Values of Industrial Parcels 34
3.2.4 Will County Equalized Assessed Value (EAV) of Industrial
Property 38
3.2.5 Transportation Corridor Equalized Assessed Value (EAV)
of Industrial Property 43
4. DESCRIPTIVE ANALYSIS 45
4.1 Descriptive Analysis of Transportation Corridors 45
4.2 Visualization of Change in Will County’s Industrial Property EAV
between 2002 and 2007 48
iii
4.3 Visualization of Hot Spot Analysis (Getis-Ord Gi*) 49
5. STATISTICAL ANALYSIS 53
5.1 Differences-in-Differences Analysis 53
5.2 Treatment Group of I55, I80 and S53 vs. Control Group of I57, S50
and US45 53
5.3 Surface Street Treatment Group of S53 vs. Surface Street Control
Group of S50 and US45 54
5.4 Interstate Treatment Group of I55 and I80 vs. Interstate Control
Group of I57 55
5.5 Treatment Group of Des Plaines River vs. Control Group of I57, S50
and US45 56
6. CONCLUSION 57
6.1 Industrial Property Value along Trucking Corridors 58
6.2 Industrial Property Value along Waterway Corridors 58
6.3 Study limitations 59
6.4 Future Considerations 59
7. WORKS CITED 60
APPENDIX 67
A.1 High Capacity Vehicle Annual Average Daily Traffic 67
A.2 Individual Corridor’s Equalized Assessed Value of Industrial Property 75
VITA 80

iv
LIST OF TABLES
Table Page
S1: Summary of Statistical findings 3
1: Economic Indicators in Will County, Illinois (2000 to 2010) 11
2: Data used in this study 22
3: High Capacity Vehicle Annual Average Daily Traffic on Interstate 55 28
4: Total EAV and average EAV for all industrial property in Will County, Illinois 39
5: Summary of the EAV per square foot of industrial land along treatment and control corridors 44
6: Descriptive statistics of industrial parcels along transportation corridors 46
7: Descriptive Statistics for industrial parcels along treatment and control corridors 47
8: Results of independent-samples t-test for trucking routes 54
9: Results of independent-samples t-test for surface streets 55
10: Results of independent-samples t-test for Interstates 55
11: Results of independent-samples t-test for Des Plaines River/ Chicago Sanitary Ship Canal 56
A1: High Capacity Vehicle Annual Average Daily Traffic on Interstate 80 70
A2: High Capacity Vehicle Annual Average Daily Traffic on State Route 53 71
A3: High Capacity Vehicle Annual Average Daily Traffic on Interstate 57 72
A4: High Capacity Vehicle Annual Average Daily Traffic on State Route 50 74
A5: High Capacity Vehicle Annual Average Daily Traffic on U.S. Route 45 75
A6: Cost per square foot and percentage of industrial land on Interstate 55 76
A7: Cost per square foot and percentage of industrial land on Interstate 80 76
A8: Cost per square foot and percentage of industrial land on State Route 53 77
A9: Average EAV per square foot and percentage of industrial land along Des Plaines River/Chicago Sanitary Ship Canal 78
A10: Cost per square foot and percentage of industrial land on Interstate 57 78
A11: Cost per square foot and percentage of industrial land on State Route 50 79
A12: Cost per square foot and percentage of industrial land on U.S. Route 45 79

v
LIST OF FIGURES
Figure Page
1: An Example of a Distribution Channel - Imported Retail Goods 5
2: The Des Plaines River Enterprise Zone and the Joliet Arsenal Enterprise Zone 8
3: Flow chart depicting the progression of this research 21
4: Interstate 55 and measurement points of AADT 27
5: Graph of the High Capacity Vehicle Annual Average Daily Traffic on Interstate 55 29
6: Treatment trucking groups and control trucking groups 31
7: Annual commodity tonnage on the Chicago Sanitary and Ship Canal waterway link 33
8: Histogram of the percentage of Equalized Assessed Value in 2002 by sale values between 2001 and 2003 35
9: Histogram of the percentage of Equalized Assessed Value in 2007 by sale values between 2006 and 2008 36
10: Spatial distribution of the percentage of EAV/sales value in 2002 37
11: Spatial distribution of the percentage of EAV/sales value in 2007 38
12: Visualization of the difference in EAV per square foot between 2002 and 2007 49
13: Hot Spot Analysis of change in industrial property EAV per Square Foot between 2002 and 2007 51
A1: Interstate 80, State Route 53, Interstate 57, State Route 50 and U.S. Route 45 and measurement points of AADT 68
A2: Graph depicting the High Capacity Vehicle Annual Average Daily Traffic on Interstate 80 69
A3: Graph depicting the High Capacity Vehicle Annual Average Daily Traffic on State Route 53 70
A4: Graph depicting the High Capacity Vehicle Annual Average Daily Traffic on Interstate 57 72
A5: Graph depicting the High Capacity Vehicle Annual Average Daily Traffic on State Route 50 73
A6: Graph depicting the High Capacity Vehicle Annual Average Daily Traffic on U.S. Route 45 74

1
SUMMARY
Every year, the interchange of millions of tons of intermodal freight from all regions of the United States
takes place in metropolitan Chicago and its surrounding counties. The high volumes of freight along with
projections of highly congested highway systems suggest Illinois' need for an efficient intermodal system
to accommodate the complex interchange of freight.
CenterPoint Properties in Elwood, Illinois is a major intermodal logistics center (ILC) located in a
surrounding county of metropolitan Chicago. This intermodal logistics center was built between 2000
and 2002 with tax increment financing from the Village of Elwood. The purpose of this research is to
study the economic impacts of the implementation of intermodal logistics centers (ILCs) for freight
transportation. Industrial property along transportation corridors and interstate interchanges may see
significant property value changes and spatial changes related to ILCs. With the use of publically
available tax assessment, truck volume and census data, the research analyzes patterns and property
value changes of industrial property between 2002 and 2007.
This study used the technique of “difference-in-differences” to compare a treatment group and control
group. The treatment group is comprised of three roadways on the western side of Will County, two
interstates and one state route, and a waterway, the Des Plaines River/Chicago Sanitary Ship Canal. The
control group is comprised of an interstate, state route and U.S. route on the eastern side of Will
County, Illinois. The treatment group transportation corridors are located close in proximity to
CenterPoint Properties in Elwood, Illinois, while the control group does not have an ILC in close
proximity to its transportation corridors. This study aims to capture a before and after effect of the
implementation of an intermodal logistics center by comparing the change in their industrial property’s
equalized assessed value (EAV) with an Independent-samples T-test.
2
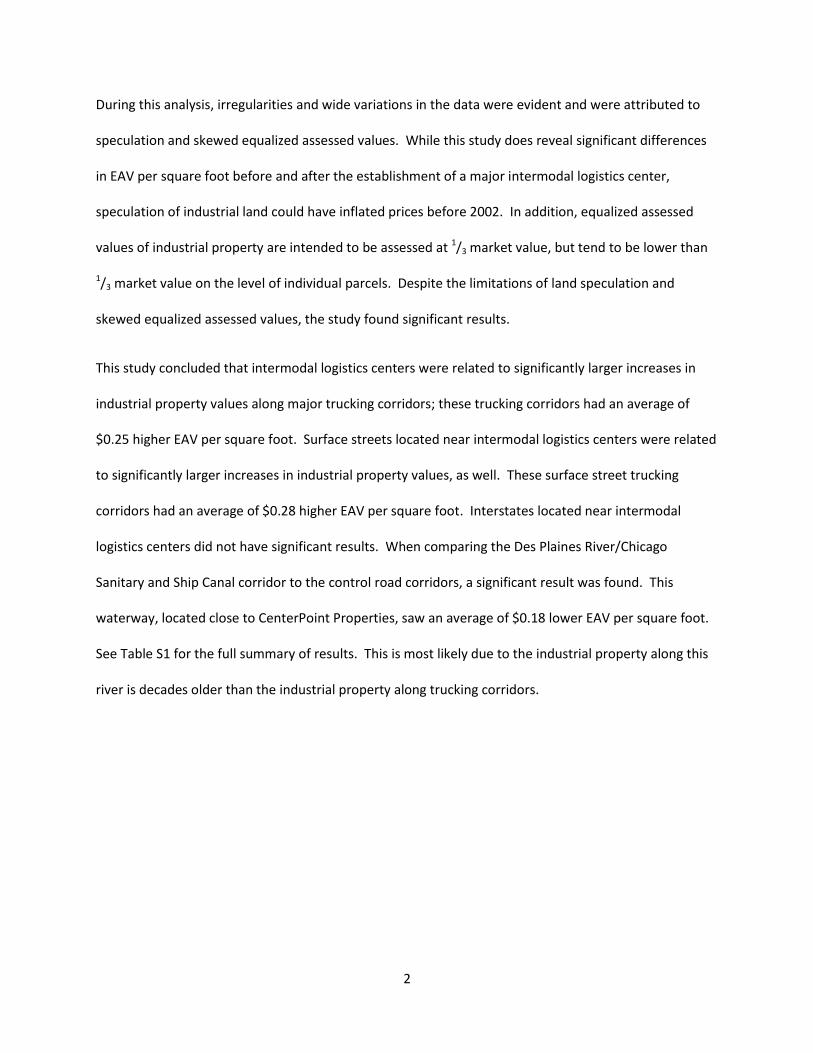
During this analysis, irregularities and wide variations in the data were evident and were attributed to
speculation and skewed equalized assessed values. While this study does reveal significant differences
in EAV per square foot before and after the establishment of a major intermodal logistics center,
speculation of industrial land could have inflated prices before 2002. In addition, equalized assessed
values of industrial property are intended to be assessed at 1/3 market value, but tend to be lower than
1/3 market value on the level of individual parcels. Despite the limitations of land speculation and
skewed equalized assessed values, the study found significant results.
This study concluded that intermodal logistics centers were related to significantly larger increases in
industrial property values along major trucking corridors; these trucking corridors had an average of
$0.25 higher EAV per square foot. Surface streets located near intermodal logistics centers were related
to significantly larger increases in industrial property values, as well. These surface street trucking
corridors had an average of $0.28 higher EAV per square foot. Interstates located near intermodal
logistics centers did not have significant results. When comparing the Des Plaines River/Chicago
Sanitary and Ship Canal corridor to the control road corridors, a significant result was found. This
waterway, located close to CenterPoint Properties, saw an average of $0.18 lower EAV per square foot.
See Table S1 for the full summary of results. This is most likely due to the industrial property along this
river is decades older than the industrial property along trucking corridors.
3
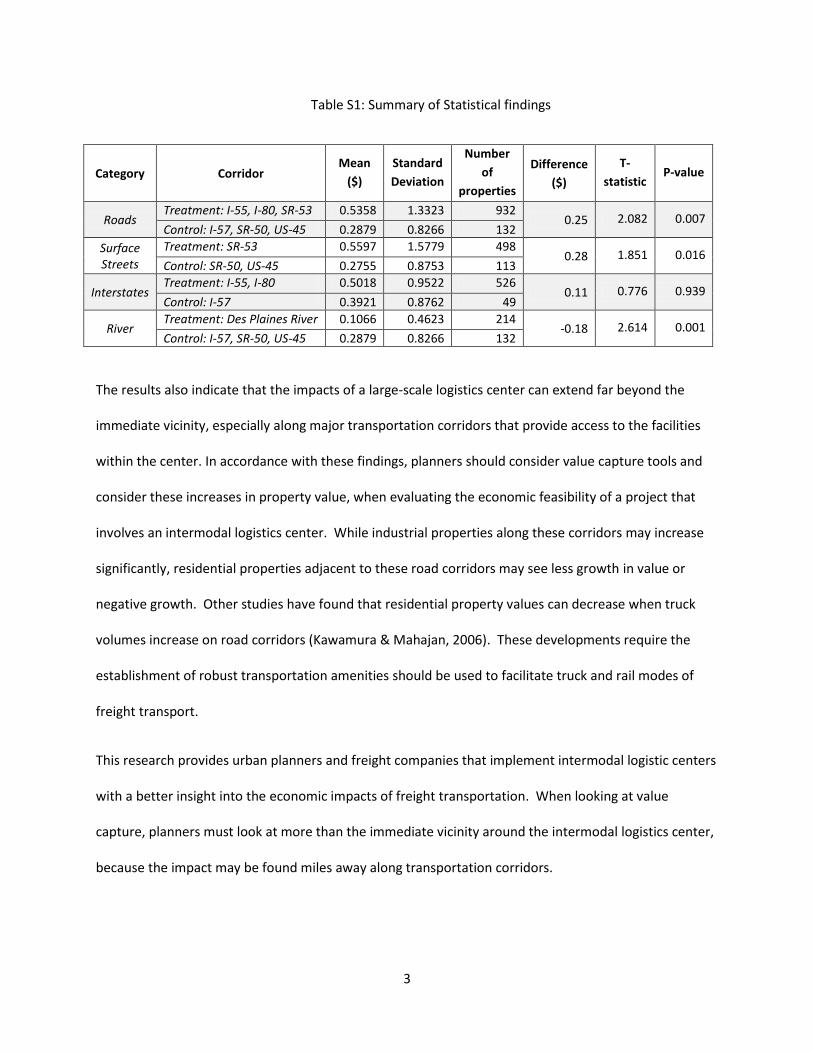
Table S1: Summary of Statistical findings
Category Corridor Mean
($)
Standard
Deviation
Number
of
properties
Difference
($)
T-
statistic P-value
Roads Treatment: I-55, I-80, SR-53 0.5358 1.3323 932
0.25 2.082 0.007 Control: I-57, SR-50, US-45 0.2879 0.8266 132
Surface Streets
Treatment: SR-53 0.5597 1.5779 498 0.28 1.851 0.016
Control: SR-50, US-45 0.2755 0.8753 113
Interstates Treatment: I-55, I-80 0.5018 0.9522 526
0.11 0.776 0.939 Control: I-57 0.3921 0.8762 49
River Treatment: Des Plaines River 0.1066 0.4623 214
-0.18 2.614 0.001 Control: I-57, SR-50, US-45 0.2879 0.8266 132
The results also indicate that the impacts of a large-scale logistics center can extend far beyond the
immediate vicinity, especially along major transportation corridors that provide access to the facilities
within the center. In accordance with these findings, planners should consider value capture tools and
consider these increases in property value, when evaluating the economic feasibility of a project that
involves an intermodal logistics center. While industrial properties along these corridors may increase
significantly, residential properties adjacent to these road corridors may see less growth in value or
negative growth. Other studies have found that residential property values can decrease when truck
volumes increase on road corridors (Kawamura & Mahajan, 2006). These developments require the
establishment of robust transportation amenities should be used to facilitate truck and rail modes of
freight transport.
This research provides urban planners and freight companies that implement intermodal logistic centers
with a better insight into the economic impacts of freight transportation. When looking at value
capture, planners must look at more than the immediate vicinity around the intermodal logistics center,
because the impact may be found miles away along transportation corridors.

4
1. INTRODUCTION
1.1 Background
Goods move across the world and few people know of the processes and hands that one object has
passed through, when this object is plucked from the shelf in the supermarket, clothing store, etc.
Trains, trucks, planes, boats are often steps in the process, but what links them together? What
happens between the 3,000 mile journey across the country and then the 20 mile journey that brings
this item to the local store that we make trips to on a weekly basis? When these millions of items
change hands and change modes of transport, a complex, efficient and large scale operation is
necessary for a functional system.
While some freight, e.g. waste, limestone and gravel for construction, are transported only a short
distance, many goods, especially retail products or bulk goods such as coal, are transported hundreds or
thousands of miles. The following figure depicts an example of part of the distribution channel for retail
goods that are imported through the Port of Long Beach and delivered to a store in Chicago.

5
Figure 1: An Example of a Distribution Channel - Imported Retail Goods (FHWA, 2012)
For this particular example, the goods go through two terminals, one near the port of entry and the
other near the final destination. It should be noted that if the same goods are transported entirely by
trucks, they may be transported directly from the port to the warehouse, bypassing one or both
terminals. However, if rail is used for the line-haul portion of the shipment, it usually requires at least
two terminals as depicted in the picture (FHWA, 2012).
The growth of both intermodal rail and containerization has created tremendous needs for intermodal
terminals. Since it is cost efficient to maximize the portion of the trip that is on rail, it is often
advantageous to locate the intermodal terminals near large urban areas. Also, it is quite common to find
intermodal terminals to become an anchor for complementary or supportive facilities such as

6
warehouses and light manufacturing factories. Also, in some cases, terminals may provide easy
connection to air or water transportation in addition to highways. Northeastern Illinois has a large
number of industrial parks and warehousing to accommodate freight transportation.
1.2 Case Study Profile: CenterPoint in Elwood and Joliet, IL
Elwood, Illinois is a village seated in Will County with a population of 2,429 (American FactFinder, 2010).
Historically considered a small farming community, it was first established in the late 1850s along
Chicago Street, but was radically changed in 1940, when it became an industrial ammunitions complex
to support the country’s industrial needs for World War II. Although it is still primarily rural, it is also
considered “strategically located,” because it is close to major interstates, such as I-80, I-55 and I-355,
has access to a Class I railroad and is located approximately fifty miles southwest of Chicago, Illinois’
downtown (Elwood, 2006). Elwood’s plan of re-development, changing its composition from a
predominantly rural town to a large freight hub, was first acknowledged as a strong possibility in 1998
(Ziemba, 1998). CenterPoint Properties is a private managerial company that invests and develops
intermodal logistics centers in the United States; Kansas City, MO, Savanna, GA, Manteca, CA, Houston,
TX, Suffolk, VA are among several cities where CenterPoint Properties have been found. In 2002, the
Village of Elwood roughly quadrupled in size after it annexed approximately 2,000 acres of the former
Joliet Arsenal, where CenterPoint built their industrial park, called Deer Run Industrial Park. After the
Joliet Arsenal was closed in 1976, over 8,000 people lost their jobs as a direct consequence; later in
1995, Elwood officials authorized the restoration and redevelopment of the arsenal. The prospect of
CenterPoint’s Intermodal Logistics Center offered an opportunity to match this lost employment with
8,000-12,500 industrial, manufacturing, commercial and retail jobs, and was expected to produce $27
million in property-tax revenue each year (O'Brien, 2000). In addition, this property changed from a

7
publically-owned ammunitions center to a privately-owned industrial park, which may have
considerable implications for the type and the amount of economic development.
In 2000, the Village of Elwood, Illinois established that Deer Run Industrial Park Economic Development
Project Area would take the place of the vacant Joliet Arsenal, as a Tax Incremental Financing District
(Village of Elwood, Illinois, 2009). Elwood’s board of trustees voted for the arsenal to become a tax
increment finance district for 23 years, which would give CenterPoint substantial tax breaks (O'Brien,
2000). Beginning in 2003, the tax incrementing financing notes included a beginning balance of $148.8
million, $14.7 million of issuances and accretion, $8.8 million of retirements, leaving a total balance of
$154.6 million. In addition to incremental property taxes of the TIF district, a 1% tax of gross receipts of
sales on specified tangible personal property was imposed by the village. This district was in accordance
with the Illinois General Assembly’s Economic Development Project Area Tax Increment Allocation Act of
1995, which was created to address the negative socioeconomic impact of the vacant buildings,
population decline and job loss associated with the closing of the Joliet Arsenal. They stated that the
economic burdens would worsen if the State and local political entities could not provide other
incentives to promote the inhabitation of this former military installation. The use of tax increment
allocation financing was justified as a tool to draw private development of that specific district by
financing a part of the cost of improvements. Incremental taxes are property taxes levied by
municipalities or municipal corporations on real property within the TIF district. In addition to the
incremental property taxes, they also levied a tax of 1% on gross receipts of sales of specified tangible
personal property under the Rule Municipal Service Occupation Tax Act. In total, the issued Tax
Increment Allocation Notes of 2003 ended with a balance of $154,644,981 (Village of Elwood, 2009).
In 2012, CenterPoint received further tax breaks through a tax rebate on building materials in a fifteen
square mile are, called “Joliet Arsenal Enterprise Zone,” which was expected to bring substantial

8
economic benefits to Will County, the county that Elwood and Joliet are seated in (Fabbre, 2012). The
“Joliet Arsenal Enterprise Zone” is not the first enterprise zone in Will County; Will County, the City of
Joliet, the Village of Rockdale and, later, the Village of Romeoville established the “Des Plaines River
Enterprise Zone” in 1983 as a part of Illinois Enterprise Zone Act (20 ILCS 655/1) (Romeoville, 2013).
Enterprise zones are meant to stimulate economic growth, using incentives, such as tax exemptions, tax
credits and contribution deductions. Illinois boasts that their enterprise zones have over 35,000
businesses investing in their enterprise zones, companies have invested over $33 Billion in these zones
and over 280,000 jobs have been created in these zones (IEZA, 2011). These enterprise zones are
outlined in red in Figure 2.
Figure 2: The Des Plaines River Enterprise Zone and the Joliet Arsenal Enterprise Zone

9
With the guarantee of tax increment financing, CenterPoint built its intermodal logistics center between
2000 and 2002 and opened in August 2002 (Ziemba2, 2002). It encompasses 2,500 acres with a total
investment of one billion dollars by CenterPoint and holds 12 million square feet of building space with a
770-acre intermodal yard. These distributional facilities serve the current customers of BNSF Railroad,
Wal-Mart Stores, Inc., DSC Logistics, Georgia Pacific, Potlatch, Sanyo Logistics, Partners Warehouse,
California Cartage and Maersk. These facilities house multiple intermodal sites that accommodate Class I
railroads and accommodate distribution, warehousing, intermodal changes and equipment
management (CenterPoint, 2006). In addition, many different levels of government, public agencies and
private interests were brought together to advance the plans for a better economic future (CenterPoint,
2006). Along with the potential benefits of increased property taxes, CenterPoint Properties built a new
water and sewer treatment plant to meet the needs of the community for 20 years in the future
(O'Brien, 2000) as a part of the agreement of this Superfund site (Lamb, 2004). According to the Chicago
Tribune, the developer, CenterPoint, would contribute $2.4 million to the Consolidated School District
203 in response to the projections of local school growth (Obrien2, 2000). Although there were many
positive projections of the many benefits that this large intermodal hub would bring, the Village of
Elwood began to doubt these benefits related to property value in September of 2012.
In February 2013, the Village of Elwood submitted a case to the circuit court of Cook County, Illinois as a
plaintiff against the defendant, CenterPoint Intermodal LLC and the Bank of New York Mellon Trust
Company. The Village of Elwood claimed that CenterPoint was not transparent in their use of TIF money
and they failed to attract the amount of employment they originally had stated. The Bank of New York
Mellon Trust Company is involved in the lawsuit because it controls the administration of the TIF notes
issued for the project’s subsidy. In regards to transparency, Elwood contacted CenterPoint several times
between September 2012 and January 2013 for the documentation of TIF note expenditures without
CenterPoint or Mellon responding with an adequate answer. In regard to employment creation, only

10
3,800 low-paying warehouse jobs were created (Orlofsky, 2013), in comparison to the 12,500 industrial
jobs with benefits that CenterPoint had initially proposed (O'Brien, 2000). Initially the Deer Run
property had plans for retail, commercial and industrial facilities, but instead only warehouses were
built at this intermodal facility, which offer minimum wage jobs. Additionally, the presence of solely
warehouses has lowered property value. In 2003, CenterPoint had projected that Deer Run would
produce incremental tax revenues between $20 and $40 million each year, but in 2012, Deer Run
produced less than $8 million in additional tax revenue (Orlofsky, 2013).
In April 2013, CenterPoint filed a document to respond to Elwood’s lawsuit that would allow the village
to end its TIF payments to CenterPoint. CenterPoint claims that the village is attempting to forgo their
responsibilities in their original bargain, because the Village of Elwood cannot pay its principal and
interest on $88 Million in bonds that were sold; these bonds would have been paid with the estimated
tax revenue, which was not delivered by CenterPoint. CenterPoint states that this default will ultimately
leave the developer at risk, therefore Elwood should not be able to back out of the agreement
(Maidenberg, 2013). In addition, CenterPoint noted that it filed a forty-four page document that
detailed every invoice for the $88 Million in TIF notes spent between 2000 and 2003 (Hemmer, 2013).
Despite the current litigation involving CenterPoint and the Village of Elwood, the area around
CenterPoint in Elwood and Will County, Illinois as a whole, has seen tremendous changes, regarding
population and the economy within the last decade, which may or may not be partially attributed to
CenterPoint.
Within the study time frame of this project, 2002-2007, many aspects of Will County and Elwood have
undergone tremendous change. Between 2000 and 2010, Will County’s population was one of the
fastest growing in the United States with 502,266 in 2000 and 677,560 in 2010, a growth rate of 35%
(Cain, 2011). According to the 2011 employment estimates of the U.S. Census Bureau, 23.5% of industry

11
in Elwood, Illinois was attributed to construction, transportation, warehousing and utilities and 20.2% of
this industry was found in Joliet, Illinois. The U.S. Census also revealed changes in the median household
income: in 2000 the median household income was $62,221, which increased to $75,734 in 2010. See
Table 1.
Table 1: Economic Indicators in Will County, Illinois (2000 to 2010)
Will County Economic Indicator
2000 2010 Percent Change
Population 502,266 677,560 35%
Median Household Income $62,221 $75,734 22%
Changes in population, industrial employment, transportation employment and median household
incomes are just a few indicators of the considerable change that Will County has undergone in the past
decade (American FactFinder, 2010).
2. LITERATURE REVIEW
A literature review was used to provide a context for the intermodal logistics centers, detailing the
purpose of intermodal logistics centers, the different types of intermodal logistics centers and the
effects of intermodal logistics center on their surrounding communities. Additionally, the economic
implications of transportation related infrastructure and facilities is explored.
2.1 Intermodal Logistic Centers
As these “logistic centers” often play very important role in the regional economies, there is a strong
interest in planning for and management of such developments. Past literature has explored the

12
development of intermodal logistics centers, the different types of intermodal logistics centers and
transportation corridors in relation to intermodal logistics centers.
A European freight village is one approach to the facilitation of intermodal freight distribution and is
described by Daniel Lamb of the Federal Department of Transportation as,
“a new form of logistics center development that combined freight transportation,
warehouses/distribution centers and services in one site. Freight Villages can encourage the
coordinated use of multiple freight modes, such as rail/truck; reduce vehicles miles traveled by
encouraging industrial development in the immediate vicinity of freight hubs; and can
encourage more use of long distance modes (such as rail, air and waterborne) by concentrating
industrial shippers in a single location.”
Developed in Europe, European freight village complexes are typically managed by governmental or
quasi-governmental entities. The U.S. has more or less encouraged similar physical developments,
called Intermodal Logistics Centers (ILC’s), which is described as “a place of intermodal freight exchange
and an area zoned/planned for the purpose of industrial development” (Lamb, 2004). In Kawamura and
Lu’s chapter on freight villages in the U.S., they identify the U.S.’s major strategies used to transfer the
European idea of freight villages to the market in the United States. Major differences between the
European “freight village” and the intermodal logistics centers of the U.S., involve the institutional and
regulatory environments. Other differences between these two concepts include historical
development patterns in the United States, such as urban sprawl and the geography of production and
movement of consumer goods. The concept of freight villages have been seen in the United States for
several years, but have significantly different components than their counterparts in Europe. For
example, Intermodal Logistics Centers found in the United States are usually larger and privately owned,
in comparison to Europe’s governmentally regulated freight villages (Kawamura & Lu, 2006).
13
According to Daniel Lamb, there are three different types of ILC’s in the United States: “Built from
scratch village,” “Second stage added village” and “Evolved village.” The “Built from scratch village” is a
new intermodal logistics center and transportation facility with industrial properties that was
constructed for the specific purpose of performing industrial and intermodal logistics activities. The
“Second stage added villages” begin as operational freight facilities and later develop industrial activity,
which then categorizes the center as an ILC. Initially, the “Evolved villages” are large industrial parks
that already contain support services and later develop more intricate modes of freight transportation.
Lamb describes new concepts of intermodal logistics centers that cover 300 acres or less, which he calls
a Compact freight village. Finally, the author requests for the use of zoning and land use ordinances to
reserve industrial land and to create unified management, while balancing community needs, which he
calls a “Virtual freight villages” (Lamb, 2004). These different types of intermodal logistics centers reveal
the varied histories of development of intermodal logistics centers in the United States, and how they
may develop in the future. Additionally, these facilities may have implications for the ways in which the
community approaches these complexes and how communities and regions grow and change in relation
to the intermodal logistics center. Intermodal Logistics Centers have become a place of interest on local,
regional and national scales in the USA. Past research has investigated freight transportation and its
effects on passenger travel, economic activity and transportation investment, property values and the
externalities of transportation and, finally, industrial and commercial land uses and optimal freight
facilities.
Intermodal Logistics Centers have the potential to affect traffic and passenger travel, due to increases in
trucks along a corridor and due to the construction of new travel corridors. Howard Man of New York’s
Department of Transportation stated that freight villages and intermodal logistics centers benefit local
and regional economies not only by bringing economic development, but by creating efficient
movement of freight. This efficient movement can accommodate larger volumes of freight, reduce

14
trucking miles and create a system that coexists with the community that surrounds the intermodal
logistics center (Man, 2012). In addition, overall heavy truck traffic on local commuter roads can be
reduced with strategic planning of intermodal logistics centers. Howard Man recommends that local
traffic impacts should not be the only consideration of transportation planners and engineers, the
infrastructure must be considered holistically, as a part of a larger region, which bears all of changing
transportation needs. In addition, he acknowledges that the size of the site and the number of
employees is a good indicator of the number of truck trips that will be generated by the site (Man,
2012). Factors of efficiency, overall truck traffic, and new travel corridors play a large role in the social
and physical impacts created by intermodal logistics centers.
The development of intermodal logistics centers, the types of intermodal logistics centers and their
transportation systems offer a baseline of the possible effects of freight centers on their surrounding
communities. The following section will explore economic impacts of transportation systems.
2.2 Economic Impacts
Economic activity of transportation infrastructure and related facilities is a field that has been
researched widely. Several studies have researched the different effects of passenger transportation
and freight transportation, which have a wide range of economic implications.
2.2.1 Economic Impacts of Passenger-focused Transportation
Passenger-focused transport and its economic impacts have been studied widely in academia. Studies
have investigated the different effects of transportation on different economic outputs, airport effects
on residential property values, railroad proximity on residential property values and freeway
construction on vehicle accessibility and residential property values. Some of the studies examined the
impacts of infrastructure investments while others studied effects of usage of transportation facilities.

15
A review of several different studies by Bhatta and Drennan attempts to consolidate and synthesize the
results found of effects of transportation on different facets of the economy. They found statistically
significant results of measured inputs (human capital, monetary capital, labor, etc.) in relation to
measured outputs (gross state product [GSP], private GSP or manufacturing output). Because several of
these studies aggregate the economic benefits, they acknowledged that assigning causality to a
relationship is difficult and controversial. These economic benefits were highly aggregated and used
subnational units of analysis, but the most disaggregated values were property values, which used
individual property/housing values. Other studies divided the economy into nine categories; by
disaggregating the economy, indirect effects made by other industries can be accounted for and the
economic benefit of highway investments. Highway improvements in one area were found to reduce
the economic activity in another geographic area. In addition, the authors found that an increase in
“highway capital stock,” was significantly related to increases in economic output. They state, “Six of the
eight studies find a positive significant relationship between the public capital and productivity.” Overall,
the paper by Bhatta and Drennan revealed the positive relationship between transportation facilities
and economic activity in an area (Bhatta & Drennan, 2003).
Using hedonic evaluation technique, Daniel McMillan evaluated the relationship between the prices of
single-family homes and their proximity to the major airport in Chicago, O’Hare Airport. McMillan’s
study found the relationship between noise and property values; he found a noise discount of 8.8% on
tax assessed values and 9.2% on property values, which also addresses the issue of tax assessment
values in the State of Illinois. The value of homes are expected to increase significantly as technology
increases to reduce the noise, which suggests that the externality of noise is a main factor in
determining the value of a property. Additionally, McMillen uses hedonic models to explain how
aggregate tax assessment values will change in the future in relationship to the spatial, noise contours of
the O’Hare airport (McMillen, 2004).

16
Strand and Vagnes in Norway compared the relationship of proximity between railroads and residential
property values, using the hedonic method, as well. A strong relationship was found when the proximity
of the properties to the railroad was within the distance of one hundred meters. They also found that
within both of their relational models, doubling the distance from the railroad increased the property
value by approximately ten percent (Strand & Vagnes, 2001).
Similarly, Jason Carey of Arizona’s Department of Transportation researched the links between highway
transportation and residential property values. Freeway construction allowed for the benefit of
increased accessibility, thus increasing aggregate residential property values. Although the central
business districts are further from residential development, travel speeds increase and travel time
decreases between the two location, making property further from the central business district more
valuable to developers. Carey also found that, in the aggregate, freeway construction did not deter
residential development and/or sales of residential properties. Negative impacts for detached
residential property were due to increased traffic levels in the corridor. Although this adverse effect
was found on detached single-family residences, a positive effect was found on multifamily residential
and commercial properties. This finding, specifically for land use, led to a recommendation of
appropriate and careful zoning in conjunction with freeway development. Through this study, highway
transportation development was found to affect accessibility, congestion and residential and
commercial land use (Carey, 2001).
2.2.2 Economic Impacts of Freight Transportation
Past research has investigated the different effects of freight transportation on residential property
values, the relationship between freight movement and industrial land use, and the optimal placement
of freight-related intermodal logistics centers.

17
Kawamura and Mahajan used the hedonic technique to evaluate the relationship between traffic
volumes and residential property values and demonstrate that these two factors have a statistically
significant relationship. They state that a 10% increase in traffic volume is associated with a 0.4%
decrease in property value; because these changes occur areas along these traffic corridors, the impact
of -0.4% on property value can be quite substantial. In addition to transportation and its direct and
indirect effects, distance to the central business district, distance to waterways, distance to passenger
rail, housing quality, housing type and housing size, school rankings, minority percentage and crime
rates also play large roles in valuation and cannot be ignored when understanding freight
transportation’s effect on residential property values (Kawamura & Mahajan, 2006).
In addition, research has investigated the relationship between freight movement, industrial and
commercial land use and the optimal location for freight facilities. A paper by Long and Grasman
explores the different criteria for evaluating inland multimodal freight hubs in terms of efficiency,
community livability and economic vitality. First level criteria were identified as infrastructure,
proximity to market land availability, government and industry support and labor supply. Infrastructure
reflects the region’s capacity to move freight with different modes of transportation, such as highways,
railroad, etc. Proximity to market was described as the market reach of a region or the travel distance in
one day. Land availability involves the capacity of a region to expand logistics development. The
support of regional economic development agencies and local industry reflects Government and
industry support, but can be measured by the presence of dedicated logistics development
organizations in the region. Industrial laborers in manufacturing, trade, transportation and utilities,
mining, logging and construction, were identified as important criteria of the demographic component
of an optimal freight facility. The authors conclude that, in reality, a typical ILC development project has
a few options that are extremely similar in development potential. Using a multi-criteria decision

18
analysis, will allow decision makers to decipher the better development location based on
transportation-reliant activities, demographics and local governments (Long & Grasman, 2012).
Cherrett, Allen and Browne explored the relationship between road freight transport activity and facility
location in the United Kingdom. Their study investigates the development of warehousing, distribution
centers and fulfillment centers in the location and their use of the logistics facility in urban areas. Urban
area commercial and industrial land uses have an impact on the types and quantities of goods produced
and, furthermore, the quantity of freight transport handled. In addition, the relation to other centers of
good production, good consumption and warehousing affect the distances goods are transported
between urban areas and the intensity of freight activity. A major freight hub in an urban area,
specifically with port access, can attract freight activity from remote places. The larger sized urban area,
geographically and demographically, has higher proportions of road freight journeys, internally, than
smaller urban areas. Potentially due to changes in urban land values and the importance of different
industries, warehousing has not grown and some warehousing has moved to suburban locations. The
authors also found that freight transportation journeys are less efficient within the urban areas than
between urban areas, in terms of vehicle carrying capacity (Cherrett et al, 2012).
2.3 Summary
Past passenger-focused research has shed light on the related topics of passenger travel, economic
activity and residential property valuation, while freight-focused transportation has highlighted freight-
related land use, the development of intermodal logistics centers and optimal freight facilities.
Passenger travel can be positively affected by more efficient freight hauling and increased road and
highway construction to accommodate freight. Increased investment in transportation corridors has
been found to increase economic activity in surrounding areas. Residential property values can be
affected both positively and negatively, depending on the transportation proximity, amenities offered

19
and the specific land use of the property. Studies have identified locations for freight facilities as
optimal, when demographics and political standings are considered along with the market sizes and land
uses. It should be noted, however, that from the many academic papers researched, there has not been
an attempt to analyze impacts of intermodal terminals on industrial property values in relation to
transportation corridors. This ranging research related to freight movement and freight facilities has
cast a wide net to understand the relationship between freight transport and other aspects of the
physical world, but it has also left many areas of this field open for further investigation.
2.4 Research Questions
As mentioned earlier, there is a gap in literature involving the effect of intermodal logistics centers on
industrial property values. This research strives to fill the gap by examining the question of how the
introduction of intermodal logistics centers can affect industrial property along transportation corridors,
spatially, temporally and monetarily. Following are specific research questions explored in this study
using a combination of descriptive and inferential statistical techniques.
Is there an economic impact of Intermodal Logistics Centers (ILC) on a county and its
transportation corridors:
o How do property values or tax assessed values change along transportation corridors
between years?
Does a significant spatial pattern of warehouses and peripheral industries to support the
trucking industry develop along specific highway road corridors?
o How do the land use patterns change along these corridors?

20
3. METHODOLOGY
3.1 Overview
Through the examination of Will County’s highway corridors and interchanges, freight volumes and tax
assessed parcels within the context of Will County’s economy, this thesis will answer the question: “How
does the introduction of intermodal logistics centers affect industrial property along transportation
corridors, spatially, temporally and monetarily?” This question will be answered using state- and
county-wide data to gain a better understanding of intermodal logistic centers, its surrounding area and
its transportation corridors. The process of developing this researched is described in Figure 3.

21
Figure 3: Flow chart depicting the progression of this research
Preliminary data and experimental data are integral part of this research’s success. The data are
gathered from the following sources:

22
Table 2: Data used for the study
Source Variables Years
Will County Assessor’s Office:
Tax Assessment Data Equalized Assessed Value (EAV) 2002 – 2010
Will County Assessor’s Office:
Parcel Data Parcel Identification Number (PIN) 2002 – 2010
Illinois Department of Transportation:
Highway Data
Annual Average Daily Traffic (AADT)
for High Capacity Vehicles (HCV) 1996 – 2012
United States Army Corps of Engineers:
Waterway Commodity Data
Annual Tons
(Upstream and Downstream) 2001 – 2012
There are various ways to study changes in land values or property values. Hedonic price models are
perhaps the most common tools. Hedonic price models aim to capture the relationship between an
observed price and the observed characteristics. They differentiate products, such as land parcels,
based on attributes that grant “utility.” This model creates a regression analysis or equation that assigns
a coefficient to each characteristic and can be predictive of a price based on the observed
characteristics. Aforementioned studies by McMillen (2004), Strand and Vagnes (2001) and Kawamura
and Mahajan (2006) used hedonic price models to identify impacts of transportation infrastructure and
their usage on the values of the surrounding properties. While this approach allows for the examination
of environmental and policy stressors based on market data, it is sensitive to functional form and to the
definition of the market (Rosen, 1974). For products such as automobiles or washing machines, hedonic
price models can be used to estimate the effects of adding extra features on the consumers’ willingness
to pay for added convenience. However, the method often encounters issues when dealing with goods
whose prices are affected by less transparent factors or exogenous conditions. Land values are affected
not only by the observable qualities of the property such as proximity to train station, crime rate,
allowed use, etc., but also more subtle factors such as perceptions that are hard to quantify. In addition,

23
the condition of the real estate market, which is arguably the strongest determinant of land values, can
vary considerably across geographical location and time.
In recent years, researchers have used fixed-effect regression to address the issue of omitted factors
described above.
For panel data measured over two time periods, 0 and 1, the set-up of a fixed effect model can be
written as
Yi,0 = µ0+ βXi,0+ ϒZi+ λi+ i,0
Yi,1 = µ1+ βXi,1+ ϒZi+ λi+ i,1
Where, Yi,t is the outcome variable of interest for subject i measured in time t, Xi,0 is a vector of time-
variant characteristics of subject i, and Zi is a vector of time-invariant characteristics of subject i. β and ϒ
are vectors that contain coefficients. In the above formulation, intercept, µt can be different for each
time period. The error is divided into two components, λi and i,t. The former, λi , varies across subjects,
and can be considered to represent unobserved characteristics and idiosyncrasies that often causes
omitted variable problems in statistical analysis including hedonic price models. The latter, i,t ,is the
component that vary across both time and subjects and can be considered to represent purely random
error.
Fixed effect regression deals with the unobservable error by subtracting the mean of Yi,t and Xi,t from
each individual observations. Alternatively1, subtracting the measurements in the time period 1 from
those in time period 0 will result in
(Yi,0 -Yi,1) = (µ0 -µ1) + β(Xi,0- Xi,1) + (ϒZi - ϒZi) + (λi - λi) + i,0 - i,1
1 For data with only two time periods, these two approaches produce the same results.
24
(Yi,0 -Yi,1) = (µ0 -µ1) + β(Xi,0- Xi,1) + i,0 - i,1
As shown, fixed effects model can remove the effects of unobserved characteristics from the regression
model.
For studying the effects of an intervention, e.g. a policy, a program, or a project, a variant of the fixed
effect model can be applied as a technique called difference-in-difference model. The differences-in-
differences (DID) estimation is a technique that allows one to observe changes due to a treatment.
In regression form, DID estimation can be written as
Yi = α + βVi + δTi + ViTi + εi
Where Yi is the outcome variable, and Vi and Ti are dummy variables with Vi=1 for the measurements of
subjects in the treatment group and Ti =1 for the measurements taken in the time period after the
intervention. When estimated, represents the estimated effect of the treatment while controlling for
the individual and unobserved factors. It can be shown that mathematically, can be found by taking
the difference of changes in the mean values of Y before and after the intervention between the
treatment and control groups (see below).
)()(ˆ)0,0()1,0()0,1()1,1( TiViTiViTiViTiVi YYYY
As this equation indicates, the DID estimate reveals the difference in the average outcome of the
treatment group before and after the treatment and subtract the average outcome in the control group
before and after the treatment’s time period.
Difference-in-differences method has been used widely to estimate the effects of policies or programs
when the data are not available to account for all the factors, observable and unobservable, that may
influence the outcome (Card & Krueger, 1994). One example of the application of the DID model is the

25
study by Funderburg, Nixon, Boarnet and Ferguson (2010), which analyzed regional growth patterns
based on new highway construction and highway capacity expansion.
The current study used the differences-in-differences in average outcome to compare groups and
patterns and combined these methods with regression analysis to control for confounding variables.
This research also uses the DID estimation to examine the effect of intermodal logistics centers on
transportation corridors’ industrial property. The variables described as “before” are from year 2002
and the variables described as “after” are from year 2007. The treatment group includes the properties
that are located within the “areas of influence” of the intermodal logistics center. In the next section the
methodology to define, in addition to the analysis time periods, the areas of influence, as well as the
control group are described.
3.2 Defining Study Scope
In order to use the DID model to examine the economic impacts of the CenterPoint Properties, both the
geographical and temporal scope of the analysis must be chosen. Defining the scope is a process that
requires the analysis and re-analysis of several datasets. The annual average daily traffic data of high
capacity vehicles revealed the crucial years of study needed to capture a before and after affect. In
addition, this data highlighted important trucking corridors that cater to the industrial and warehousing
industries. Similar to annual average daily traffic of high capacity vehicles, waterway commodity data
was also used to indicate a presence of freight along the Des Plaines River/Chicago Sanitary Ship Canal.
Equalized assessed value was another dataset used to understand the trends of freight and industrial
property value. Furthermore, this data determined the areas of analysis based on the parcels that fell
within the buffers along these transportation corridors.

26
3.2.1 High Capacity Vehicle (HCV) Annual Average Daily Traffic (AADT)
Truck volumes can be an indicator of freight activity that occurs along a transportation corridor. As
large-scale developments such as the CenterPoint Properties generate considerable amount of truck
traffic, changes in the heavy vehicle volumes on major roads that provide access to the CenterPoint
Properties can be used to estimate the geographical extent of the development’s impacts. Several
trucking corridors were evaluated based on Illinois Department of Transportation’s (IDOT) Illinois
trucking routes. Trucking routes are differentiated between different classes of routes, such as State
Maintained (SM) truck routes Classes I, II, and III, and Locally Maintained (LM) truck routes Classes I, II
and III. Classes of truck routes have specifications of the maximum dimensions and weights for trucks,
trailers and tractors (IDOT, Getting Around Illinois , 2013). The most important feature of the highway
data provided by Illinois Department of Transportation was annual average daily traffic (AADT). The
AADT of these corridors was used to choose comparative transportation corridors and they were used
to compare two years that would reflect meaningful differences in freight activity.
AADT revealed a corridor’s trucking activity; if a transportation corridor had non-existent truck AADT, it
would not be considered for this study, because warehousing and other industrial properties rely heavily
on the trucking industry’s use of these trucking corridors. Determining the years for comparison was
based on the increases and decreases in AADTs. In general, most AADTs grew between 1996 and 2007,
and began to fall in volume in accordance with the economic recession that took place in 2008. Most of
the corridors’ truck volumes began to recover around 2010. This study required a preliminary year to
capture the values surrounding these corridors before the ILC was established and also a year in the
period after the ILC was established, but before the economic recession occurred, in order to exemplify
ILC impacts without the ambiguity of the effects of the economic recession.
27
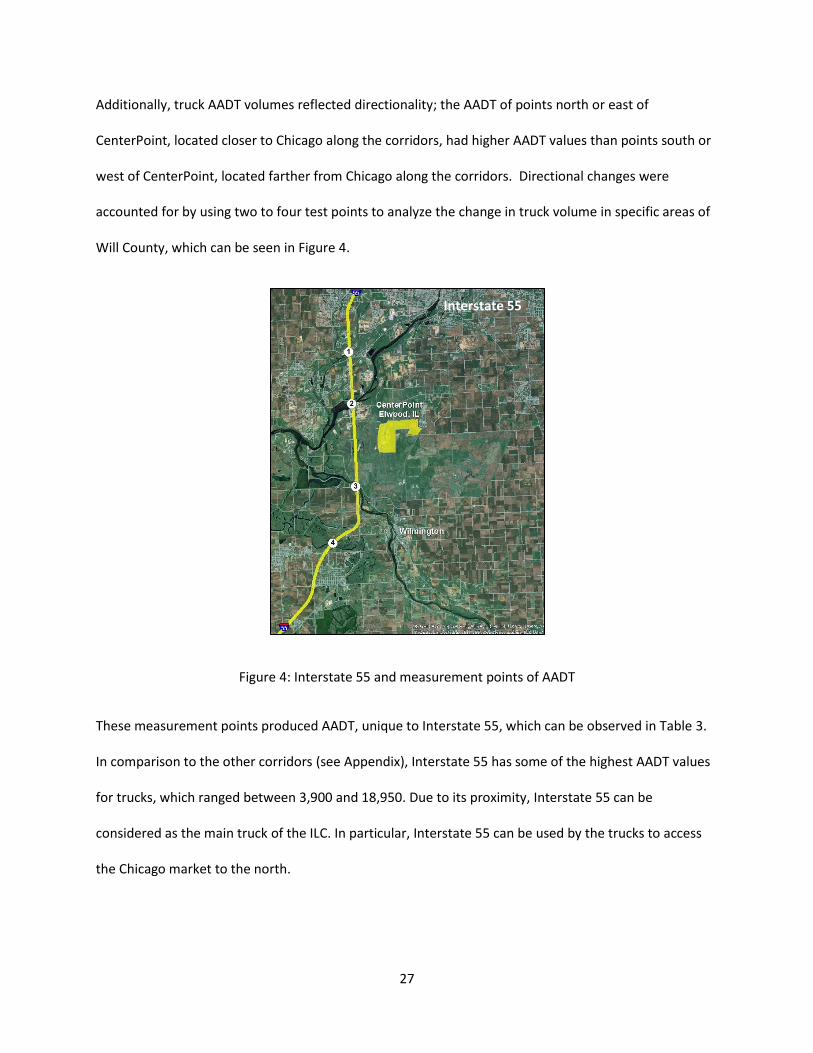
Additionally, truck AADT volumes reflected directionality; the AADT of points north or east of
CenterPoint, located closer to Chicago along the corridors, had higher AADT values than points south or
west of CenterPoint, located farther from Chicago along the corridors. Directional changes were
accounted for by using two to four test points to analyze the change in truck volume in specific areas of
Will County, which can be seen in Figure 4.
Figure 4: Interstate 55 and measurement points of AADT
These measurement points produced AADT, unique to Interstate 55, which can be observed in Table 3.
In comparison to the other corridors (see Appendix), Interstate 55 has some of the highest AADT values
for trucks, which ranged between 3,900 and 18,950. Due to its proximity, Interstate 55 can be
considered as the main truck of the ILC. In particular, Interstate 55 can be used by the trucks to access
the Chicago market to the north.
Interstate 55

28
Table 3: High Capacity Vehicle Annual Average Daily Traffic on Interstate 55
Overall, Interstate 55 saw increases in truck volume between 1996 and 2007, a dramatic decrease in
AADT in 2009 and then a slight recovery of AADT in 2011. The directionality of AADT was evident along
Interstate 55. Truck volumes north of CenterPoint had higher AADT values and had a more drastic
increase between 1996 and 2007, while truck volumes south of CenterPoint had lower AADT values and
only a slight increase between 1996 and 2007 (Schneider, 2012). See Figure 5.
Point 1 Point 2 Point 3 Point 4
1996 7,650 7,650 7,650 5,300
1999 8,500 7,500 7,050 5,500
2001 9,000 8,200 7,300 6,900
2004 16,000 14,000 7,400 7,900
2006 12,900 13,400 7,600 7,200
2007 18,950 14,250 8,400 7,500
2009 8,000 5,000 3,900 3,900
2011 11,575 11,350 5,650 5,250
Year
Observed
North of CenterPoint - Elwood, IL South of CenterPoint - Elwood, IL
Interstate 55 - High Capacity Vehicle AADT

29
Figure 5: Graph of the High Capacity Vehicle Annual Average Daily Traffic on Interstate 55
Figure 5 shows that truck volumes on Interstate 55 to the north of ILC experienced considerable
increases between 2001 and 2004.
In general, most of the corridors, such as Interstate 80, Interstate 57 and US Route 45, showed similar
patterns in AADT. Interstate 80, which is another major road access to the ILS showed nearly identical
pattern of growth as Interstate 55. However, State Route 53 showed continuous and steady rate of
growth between 1996 and 2011. State Route 50 showed varied AADTs without a clear pattern of
growth or decline. The AADT measured on these corridors revealed that trucking volumes have changed
dramatically over the past several years. In some corridors, such as Interstate 55 and 80, the changes
have been more rapid, occurring between 2001 and 2004, while AADTs on Interstate 57 and State Route
50 exhibited much more modest amount of change between 1996 and 2011. Also, the sudden decrease

30
in volumes after 2007 underscore the massive impacts of the economic recession on movement of
freight. The AADT of the other corridors can be reviewed in section, A.1, of the Appendix.
Six state maintained Class I and Class II truck routes that connect Will County to other areas of Illinois
were chosen for this research. These transportation corridors had a presence of high capacity vehicle
annual average daily traffic, which made them strong candidates for this research. Three transportation
corridors were chosen as a part of the treatment group, due to their proximity to the intermodal
logistics center in Elwood and also the trend in the traffic volume growths for those facilities generally
indicate that they have been serving as the major access routes to the ILC since its opening. Three
transportation corridors that are located farther away from the ILC were chosen as control routes:
• Treatment Corridors
o Interstate 55: State Maintained - Class I
o Interstate 80: State Maintained - Class I
o State Route 53: State Maintained - Class II
Control Corridors
o Interstate 57: State Maintained - Class I
o State Route 50: State Maintained - Class II
o U.S. Route 45: State Maintained - Class II
The treatment trucking corridors and control trucking corridors can be seen in Figure 6. This figure
reveals that each corridor has a connection to Chicago. In addition, the treatment corridors are
primarily found in the western part of Will County, while the control corridors are in the eastern part of
Will County. According to industrial property and freight specialists in Will County, the eastern part of
Will County, historically, has had lower industrial property values along its transportation corridors.
31
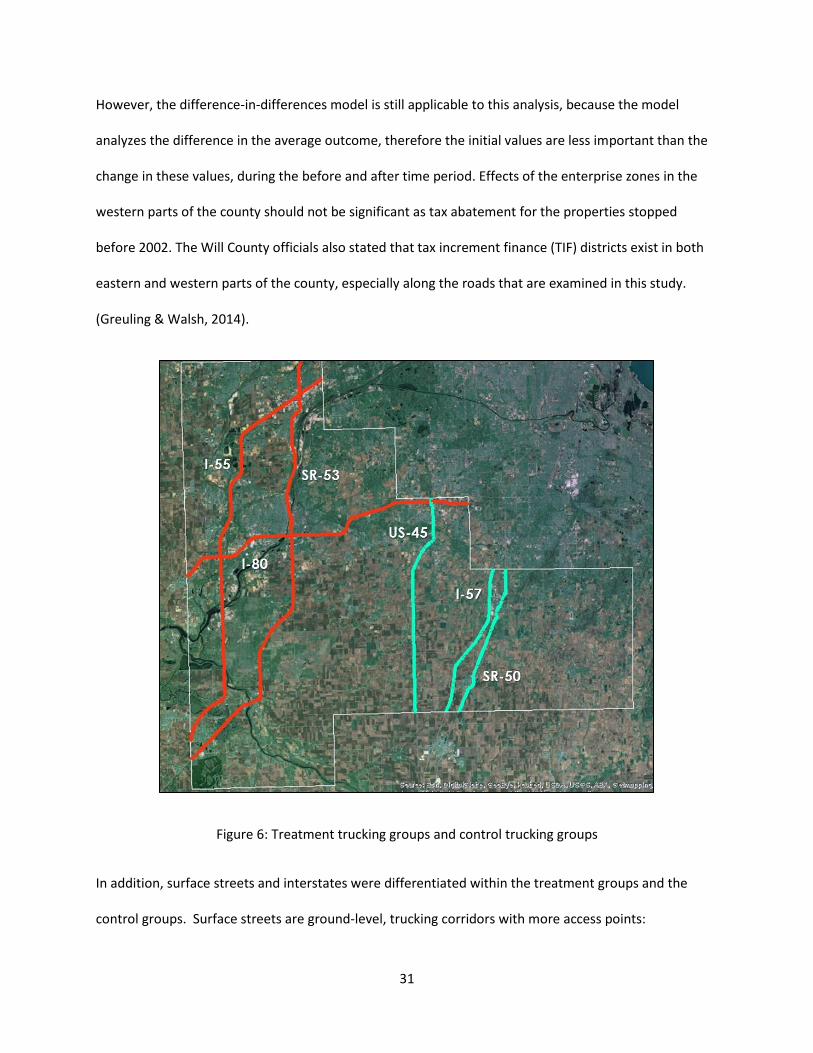
However, the difference-in-differences model is still applicable to this analysis, because the model
analyzes the difference in the average outcome, therefore the initial values are less important than the
change in these values, during the before and after time period. Effects of the enterprise zones in the
western parts of the county should not be significant as tax abatement for the properties stopped
before 2002. The Will County officials also stated that tax increment finance (TIF) districts exist in both
eastern and western parts of the county, especially along the roads that are examined in this study.
(Greuling & Walsh, 2014).
Figure 6: Treatment trucking groups and control trucking groups
In addition, surface streets and interstates were differentiated within the treatment groups and the
control groups. Surface streets are ground-level, trucking corridors with more access points:

32
commercial and residential driveways, access roads and ground-level road intersections. Interstates
control access with interchanges; often, interstates are elevated higher than ground level.
Along with trucking route transportation corridors, waterways were considered for this analysis.
3.2.2 Waterway Commodity Data
Similarly to truck volumes, waterway tonnage can be an indicator of freight activity that occurs along a
waterway corridor. The United States Army Corps of Engineer’s data provided the annual tons of freight
moved by the Chicago Sanitary and Ship Canal, which runs parallel to the Des Plaines River. This
waterway has a navigation unit name of Chicago Sanitary and Ship Canal ILL Mile 300. This information
was used similarly to AADT, showing the general movements upstream or downstream of freight within
the transportation corridors (USACE, 2013).
The waterway also plays a role in freight transport, where upstream tonnage describes freight moving
towards Chicago, IL and downstream tonnage describes freight moving away from Chicago, IL. While
this data measure freight movement in tons, this waterway’s data reflects a similar pattern that the high
capacity vehicle AADT reported. The annual commodity tonnage upstream was approximately three
times larger than the annual tonnage downstream. Additionally, the upstream freight increased
between 2001 and 2006, but decreased dramatically between 2007 and 2010. Upstream freight showed
signs of recovery in 2011 with an increase in annual tons. The downstream annual commodity tonnage
did not show a consistent rise or decline, oscillating between three million and five million tons (see
Figure 7).

33
Figure 7: Annual commodity tonnage on the Chicago Sanitary and Ship Canal waterway link
This waterway data reveals that there is a considerable amount of freight traveling along the Des Plaines
River and Chicago Sanitary and Ship Canal waterway.
With the information provided by the high capacity vehicle AADT, the years of study and the
transportation corridors were chosen for this research. The year, 2002, was chosen because this was the
earliest date available and it was also the year that CenterPoint was functional. As indicated by the
growth patterns of the freight traffic presented above, it was not until 2003 or 2004 that the ILC had
noticeable effects on the volumes of freight on major transportation facilities nearby. Based on these
evidences, it is assumed that using 2002 will capture the original industrial property values before the
economic effect of the ILC was able to take effect. The year, 2007, was chosen as the “after” condition
because this year captures property values before the economic recession one year later in 2008. Along
with the temporality of the analysis, transportation corridors were chosen based on the presence of
Total Up Total Down
2001 12,183,806 3,961,151
2002 12,350,860 4,228,072
2003 14,350,713 4,680,646
2004 15,385,190 4,883,447
2005 16,068,944 4,637,836
2006 15,761,413 3,801,587
2007 12,118,553 4,182,993
2008 11,591,478 3,950,461
2009 9,346,559 3,863,487
2010 8,834,653 4,074,798
2011 10,061,532 3,320,978
YearTons
Annual Tonnage of
Chicago Sanitary & Ship Canal Link

34
freight. While both the high capacity truck AADT and the annual tons of waterway freight indicate the
freight activity within a specific corridor, economic impacts related to property values are not captured
with these data. These impacts on industrial property values will be addressed in the following section.
3.2.3 Equalized Assessed Values of Industrial Parcels
Equalized assessed values offer the ability to observe economic impact on specific properties and can
indicate economic growth in a particular area. This section evaluates the usefulness of equalized
assessed values of industrial property as an indicator of economic impact of intermodal logistics centers’
transportation corridors.
A study by Daniel McMillian, which evaluated the relationship between the prices of residential property
and their proximity to the major airport in metropolitan Chicago, Illinois, used assessed values as an
indicator of property value. McMillian found that assessed values generally correspond to actual
property values and reflect changes in the property value well; therefore he utilized tax assessed values
for his analysis (McMillen, 2004).
This research utilizes tax assessment data acquired from 2002-2010 and assigns specific tax assessment
values to parcels or properties. According to Illinois’ Sales Ratio Study (2012), Illinois constitution allows
for the state to tax, based on a direct proportion of one-third the market value of residential property
value and permanent attachments to the land. The property tax cycle is a two year cycle, including the
steps of assessment, review, equalization, levy, extension and, finally, collection and distribution (Illinois,
2012). Unlike the residential property of Will County, industrial, manufacturing and commercial tax
assessed values are not based on the equalization factor described in the Sales Ration Study (Illinois,
2012). Industrial, manufacturing and commercial tax assessment values cannot be estimated by
property sales, because there are too few sales per year to make accurate estimates. These properties
35
are assessed by an expert, based on land value, construction costs, building ceiling heights, sales values
and building vacancy (Trowbridge, 2013).
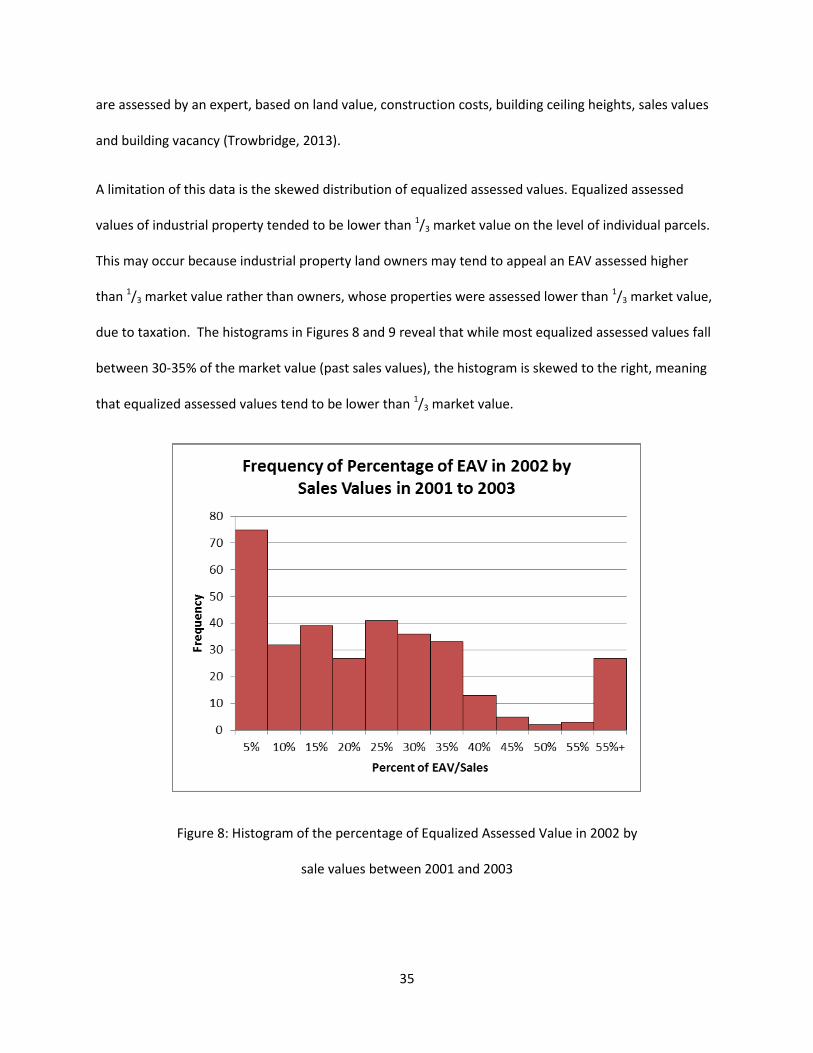
A limitation of this data is the skewed distribution of equalized assessed values. Equalized assessed
values of industrial property tended to be lower than 1/3 market value on the level of individual parcels.
This may occur because industrial property land owners may tend to appeal an EAV assessed higher
than 1/3 market value rather than owners, whose properties were assessed lower than 1/3 market value,
due to taxation. The histograms in Figures 8 and 9 reveal that while most equalized assessed values fall
between 30-35% of the market value (past sales values), the histogram is skewed to the right, meaning
that equalized assessed values tend to be lower than 1/3 market value.
Figure 8: Histogram of the percentage of Equalized Assessed Value in 2002 by
sale values between 2001 and 2003

36
Figure 9: Histogram of the percentage of Equalized Assessed Value in 2007 by
sale values between 2006 and 2008
The reasons for the observed discrepancies between the statutory ratio, 33%, and the actual ratio are
complex. In some cases, properties that have been vacant for a certain time periods can receive
discounts at the discretion of the township assessor. Also, historical precedence and agreements
between the property owners and officials may be a factor for unusually high or low EAVs.
This data limitation likely had a small effect on this study’s results, because analysis (see Figures 10 and
11) indicates that this skew in the EAVs occur in the treatment group as well as the control group. In
addition, the comparison of EAV/sales value frequency between 2002 (Figure 8) and 2007 (Figure 9)
reveals the distribution of EAV by sales value is consistent between the “before” and “after” groups.
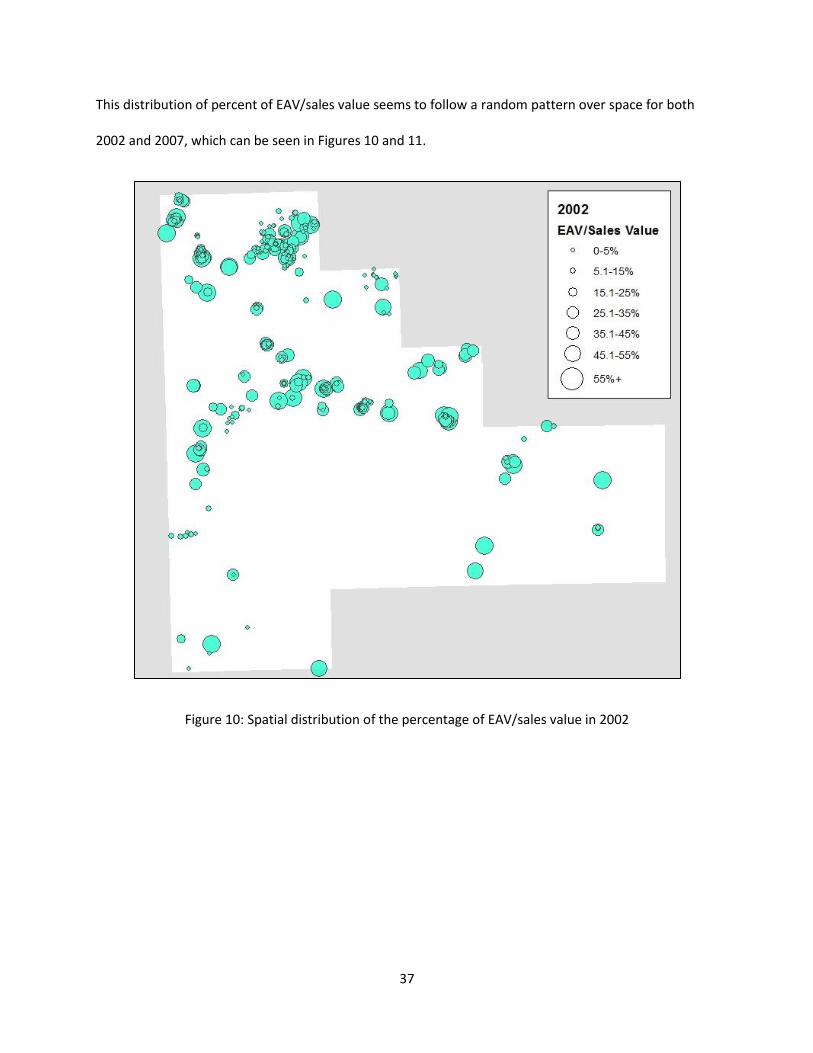
37
This distribution of percent of EAV/sales value seems to follow a random pattern over space for both
2002 and 2007, which can be seen in Figures 10 and 11.
Figure 10: Spatial distribution of the percentage of EAV/sales value in 2002

38
Figure 11: Spatial distribution of the percentage of EAV/sales value in 2007
Based on the analysis described above, this study will proceed with the assumption that the equalized
assessed value is an appropriate indicator of property value. The next section will evaluate the entire
dataset of equalized assessed value for Will County, Illinois.
3.2.4 Will County Equalized Assessed Value (EAV) of Industrial Property
In the initial analysis of equalized assessed value, all of Will County’s industrial property was included to
gain a general understanding of the county’s industrial property trends. The Equalized Assessed Value of
total industrial land parcels in Will County, Illinois can be seen in Table 4.

39
Table 4: Total EAV and average EAV for all industrial property in Will County, Illinois
Industrial properties increased in number of properties from 2002 to 2008, then decreased dramatically
in 2009, and a slight recovery occurred in 2010 (see Table 4). The total equalized assessed value
increased from 2002 to 2008, then fell slightly in 2009 and largely recovers in 2010. The average EAV of
industrial property has a different pattern with continuous growth between 2002 and 2010 and a
dramatic increase between 2008 and 2010.
In addition to the analysis of all industrial properties in Will County, Illinois. Major industrial
developments that have developed in Will County were researched, along with their location in relation
to major transportation corridors. These industrial developments are summarized below:
Heartland Center: According to the Troy Township Assessor’s office, there has only been one
large commercial industrial project since 1998, which was called the Heartland Center. It was
developed between 2005 and 2007, and is a large, one million-square-foot warehouse, located
right off of Interstate 55.
TransCold Express: TransCold Express is expected to be a functional rail service provider by April
2014. TransCold will use the BNSF railway to carry refrigerated goods in a refrigerated boxcar
YearNumber of
PropertiesTotal Average
2002 3346 1,443,051,660$ 431,277$
2003 3453 1,519,787,891$ 440,136$
2004 3646 1,568,976,407$ 430,328$
2005 3817 1,609,585,211$ 421,689$
2006 3998 1,930,864,197$ 482,958$
2007 4145 2,115,163,712$ 510,293$
2008 4474 2,494,158,759$ 557,478$
2009 2620 2,158,819,102$ 823,977$
2010 2692 2,389,185,517$ 887,513$
Industrial Property : Equalized Assessed Value in Will County, IL