intercoat adhesion failure in a multilayer organic coating ...epubs.surrey.ac.uk/738083/2/intercoat...
TRANSCRIPT

*Correspondence to: Steven J. Hinder, The Surface Analysis Laboratory, School of Engineering, Mail Stop H6, University of
Surrey, Guildford, Surrey GU2 7XH, UK.
Email: [email protected] Fax: +44 (0) 1483 686291.
Contract/grant sponsor: EPSRC; Contract/grant number: GR/N65745.
- 1 -
Intercoat Adhesion Failure in a Multilayer Organic Coating System; An X-ray Photoelectron Spectroscopy Study.
Steven J. Hinder1*
, Chris Lowe2, James T. Maxted
2, Christian
Perruchot1#
, John F. Watts1.
1The Surface Analysis Laboratory, School of Engineering, University of Surrey,
Guildford, Surrey GU2 7XH, UK.
2Becker Industrial Coatings Ltd, Goodlass Road, Speke, Liverpool L24 9HJ, UK.
#
Current Address; ITODYS, 1 rue Guy de la Brosse, 75005 Paris, France.
- 2 -
Abstract :
The strength of intercoat adhesion exhibited between a series of
polyester/polyurethane (PU) based primer formulations and a standard
poly(vinylidene difluoride) (PVdF) based topcoat formulation has been investigated
by X-ray photoelectron spectroscopy (XPS). An initial XPS study of changes in
surface elemental composition (induced by variation of the peak metal temperature
(PMT) achieved during thermal curing), on a subset of the PU primers employed,
indicates that beyond a PMT of 232°C changes in PU primer surface composition are
negligible. A reference PU primer coating formulation and four variations of this
formulation, produced by including, excluding or substituting components/additives
in the reference formulation, are characterised by XPS. The PU primer formulation in
which a flow agent additive is included exhibits segregation of the flow agent to the
primer surface. The PU primer and PVdF topcoat intercoat adhesion failure surfaces
resulting from failure at or near the PVdF/PU interface as a result of a peel test are
also characterised by XPS. Additionally the PVdF topcoat air-coating surface is
characterised by XPS. The interface analyses for the flow agent containing PU primer
formulation indicates stripping of the flow agent layer from the PU primer and
transfer of the flow agent to the PVdF topcoat interfacial failure surface. Similarly,
PU primer formulations in which the concentrations of a crosslinking resin are
changed demonstrate that the transfer of carbon and oxygen containing materials
from the PU primer to the PVdF topcoat occurs, due to insufficient crosslinking of the
polyester component of the PU primer formulation. These results suggest a
correlation between the nitrogen concentration at the PU primer surface and the
- 3 -
strength of the intercoat adhesion exhibited by the PU primer towards the PVdF
topcoat.
Keywords :
Intercoat adhesion failure; Polymeric coatings; Multilayer Organic coatings; X-ray
photoelectron spectroscopy.
Running Headline : Intercoat Adhesion Failure in a Multilayer Coating; An XPS Study
- 4 -
1. Introduction. The adhesion of polymers and polymeric based coatings and paints to a variety of
substrates is of worldwide industrial and commercial importance. The use of polymer
based coatings on substrates as diverse as wood [1], concrete [2,3], glass [4], oxides
[5] and metals [6] has been the centre of much research interest. In particular,
polymeric coatings on metal substrates have wide ranging applications including
architectural (coil coating) [7], aerospace [8], automotive [9], marine [10,11], medical
implant [12] and microelectronics [13] industries.
The use of some organic coating systems when applied to metal substrates such as
steel and aluminium, only require the application of a single coat; however, many
commercial coating systems require a two-step application procedure. Typically a
primer is applied directly to the metallic substrate to provide protection against
corrosion but also to provide a sound base with good adhesion for the application of a
topcoat. The topcoat then provides the properties desirable in a coating that interacts
with the environment. These properties include resistance to weathering and water
penetration. Although many of the processes associated with the application and
curing of polymeric coatings such as component/additive segregation to the coating
surface [14-16], characterisation of curing temperature effects [17] and the evaluation
of flow agent additive layer thickness [18] have been investigated, the phenomena of
intercoat adhesion (which is critically important in the long term effectiveness of
multilayer coating procedures) has received limited attention.

- 5 -
The majority of studies reported in the literature regarding the investigation of
polymer-polymer interfaces have concentrated on the structure and chemistry of
interfaces formed between polymer blends, be they miscible or immiscible. [19]
There is however some literature concerning intercoat adhesion between multilayer
polymeric coating/paint systems. Lowe et al. evaluated three complementary methods
used to quantify the adhesion of polymeric paints on metals used in the coil coating
industry [20]. Lauke et al. have employed a novel curved interface tensile test
instrument to examine the adhesion strength exhibited by two polymers towards each
other. [21] However, much of the coating/coating adhesion research interest is
stimulated by the desire of the automotive manufacturing industry to improve the
finish available on motor vehicles [9,22] and motor vehicle components. [23]
In the work described here changes in the strength of intercoat adhesion exhibited by
five variants of a PU based primer coating towards a standard PVdF based topcoat
formulation have been investigated. XPS has been employed to determine the surface
elemental composition of the five PU primer variants employed. The technique has
also been used to examine the PU primer and PVdF topcoat adhesion failure surfaces
resulting from intercoat adhesion failure at the PVdF/PU coatings interface. The
failure occurred when a peel test was applied to initiate disbonding and delamination
of the PVdF topcoat from the underlying PU primer.
- 6 -
2. Experimental.
2.1. Sample Preparation.
Due to reasons of commercial confidentiality only generic terms will be employed to
describe the components and additives included in the PU primer and PVdF topcoat
formulations.
The reference model PU primer and its variants and the model PVdF topcoat samples
applied to a hot-dipped galvanised steel (HDGS) substrate, employed here as a model,
multilayer coating system, were prepared at Becker Industrial Coatings Ltd. The
major components of the PU primer reference formulation are hydroxy functional
phthalate based polyester resins and both caprolactam and methylethylketoxime
blocked isocyanates. Additional components of the PU formulation include pigments
giving opacity and corrosion resistance (strontium chromate) and a filler. Minor
additives of the PU primer reference formulation include an organotin catalyst. The
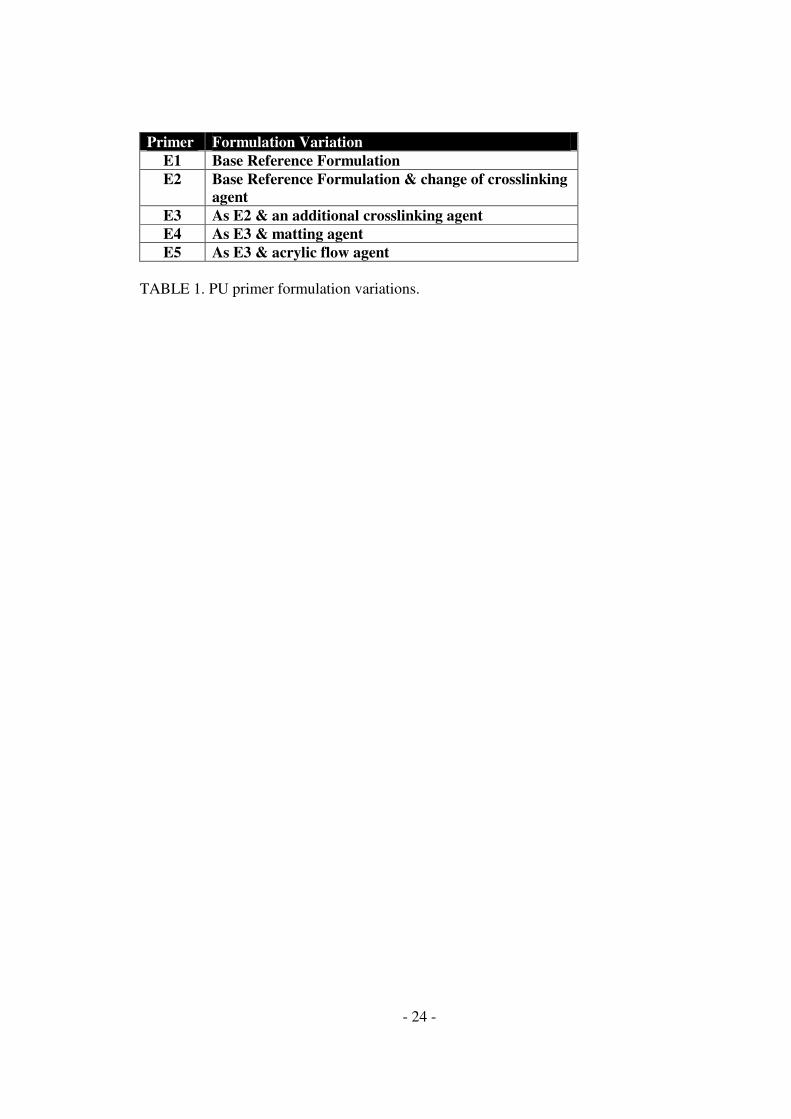
variations employed in the formulation of the PU primers analysed are described in
Table 1. All primer formulations were applied with a bar coater at a 24µm wet film
thickness (5µm dry film) and cured with an oven dwell time of 45s. All primer only
coatings were double baked and quenched immediately in demineralised water.
A single, standard PVdF topcoat formulation was employed. The PVdF topcoat
formulation major components are a vinylidene difluoride resin, methyl methacrylate
based acrylic co-resins and blue and white pigments. Minor additives to the PVdF

- 7 -
topcoat formulation include an acrylic flow agent and a matting agent. The PVdF
topcoat was applied to provide a 20-22µm dry film thickness and cured at a PMT of
249°C with an oven dwell time of 55s.
For the XPS surface characterisation of the PU primer surfaces, a disc ~1cm in
diameter was punched from the sample panel and analysed immediately. For the PU
primer-PVdF topcoat intercoat adhesion failure surfaces a disc ~1cm in diameter was
punched from the sample panel. A double cross-hatch pattern (pitch ~2 mm) was then
scored through the coatings with a scalpel and a peel test performed using adhesive
tape. The freshly exposed PU primer adhesion failure surface was analysed
immediately taking care to analyse within the cross-hatch scribe lines. Regions of the
delaminated PVdF topcoat were removed, where possible, with tweezers and
analysed immediately. Where it was not possible to remove the PVdF topcoat with
tweezers sections of the PVdF topcoat that remained adhered to the adhesive tape
after the peel test were analysed.
2.2. Adhesive Peel Test.
To perform a semi-quantitative ECCA/NCCA adhesive test a PVdF topcoat/PU
primer on HDGS substrate specimen was scored with 10 × 10 cross hatched parallel
lines to produce 100 coating squares. Adhesive tape (Scotch 610) was then applied to
the cross hatched coating surface and pressure applied to the adhesive tape to ensure a
strong adhesive bond existed between the adhesive tape and PVdF topcoat air-coating
surface. The adhesive tape was then removed in a single, rapid motion to attempt to
- 8 -
delaminate the PVdF topcoat from the PU primer. The number of delaminated
coating squares was then recorded to determine the % adhesion of the PVdF coating.
2.3. X-ray Photoelectron Spectroscopy.
XPS analyses were performed on a Thermo VG Scientific Sigma Probe spectrometer
(Thermo VG Scientific, East Grinstead, UK). The instrument is equipped with both a
microfocus monochromated AlKα source and a standard twin anode source
(AlKα/MgKα). In the current work both the twin anode AlKα X-ray source (hν =
1486.6 eV) used at 300 W (15 kV x 20 mA) and the monochromated AlKα X-ray
source (hν = 1486.6 eV) used at 140W were employed. The area of analysis was
approximately 800µm diameter for the twin anode source and 500µm diameter for the
monochromated source. The pass energy was set at 20eV for high resolution, core
level spectra of all elements of interest. The coating samples were held in place on the
instruments sample stage by a sprung Cu/Be clip. Quantitative surface chemical
analyses were calculated from the high resolution core level spectra, following the
removal of a non-linear background. The manufacturer’s Avantage software was used
which incorporates the appropriate sensitivity factors and corrects for the electron
energy analyser transmission function.
- 9 -
3. Results and Discussion.
In the studies described here the surface elemental composition and adhesion
properties exhibited by five variants of a PU primer coating formulation have been
investigated. The variations in the PU primer coating formulations employed are
described in Table 1. As shown in Table 1 components of the PU primer formulation
are changed (E2 & E3), or components added (E4 & E5) to induce changes in the
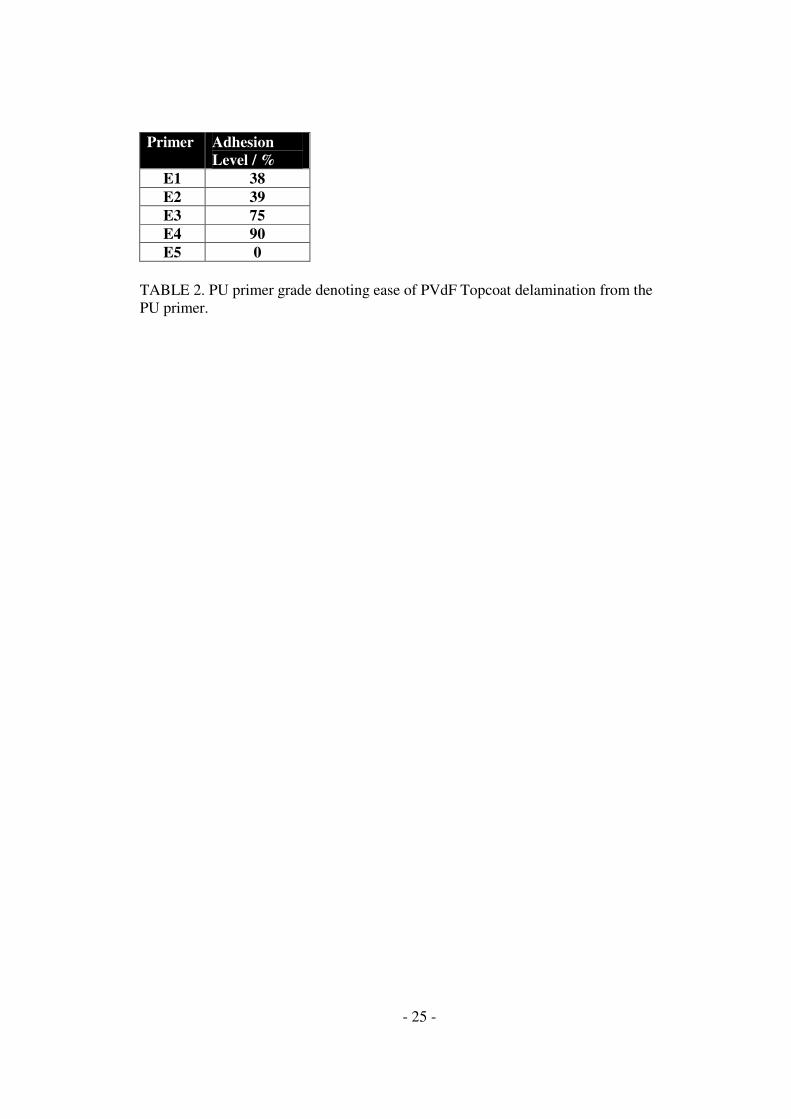
properties exhibited by the PU primer surfaces. Table 2 presents the results from an
investigation into the strength of adhesion exhibited by the PU primer/PVdF topcoat
system, as assessed by the adhesive tape peel test. The PU primers that exhibited the
poorest adhesion between the PU primer and PVdF topcoat displayed 0% adhesion.
Typically in primers achieving 0% adhesion, upon curing of the PVdF topcoat to the
primer, the topcoat readily delaminates and can be easily removed in large sections by
the use of tweezers prior to application of the adhesive tape test. PU primers
achieving 100% adhesion display an adhesive strength so great that it is not possible
to disbond the PVdF topcoat from the PU primer even upon application of the
adhesive tape. Although none of the PU primer formulations described in these
studies achieved 100% adhesion, when commercial formulations were tested in a
similar manner it proved impossible to disbond and delaminate the commercial PVdF
topcoat from the underlying PU primer.
In an initial study to determine a common curing temperature for the primer
formulations employed, a subset of the PU primers (E3 & E4) were cured at four
different PMTs to investigate changes in surface elemental composition resulting

- 10 -
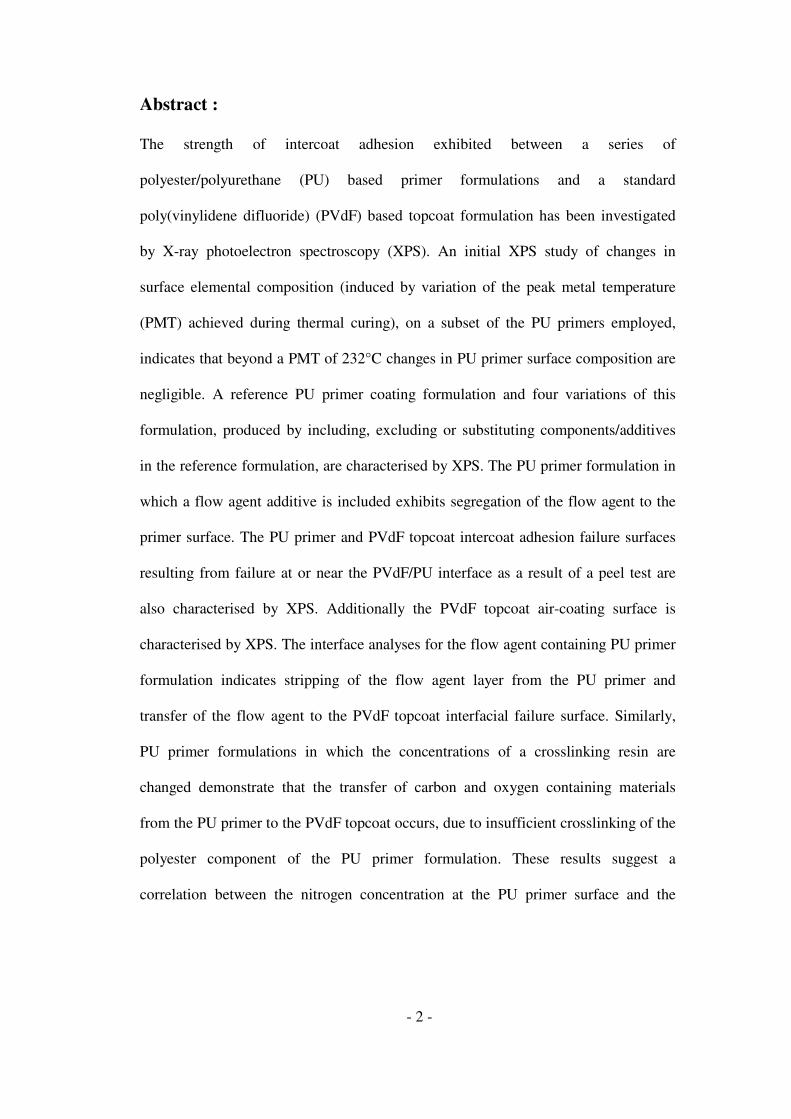
from the use of different curing temperatures. In Figure 1 an XPS survey spectra
acquired for the E3 formulation cured at 224°C is presented. XPS signals
characteristic of C1s (~285eV), O1s (~533eV), N1s (~400eV), Sn3d (~486 &
494eV) and Sn3p (~715 & 757eV) are observed. The XPS survey spectra in Figure 1
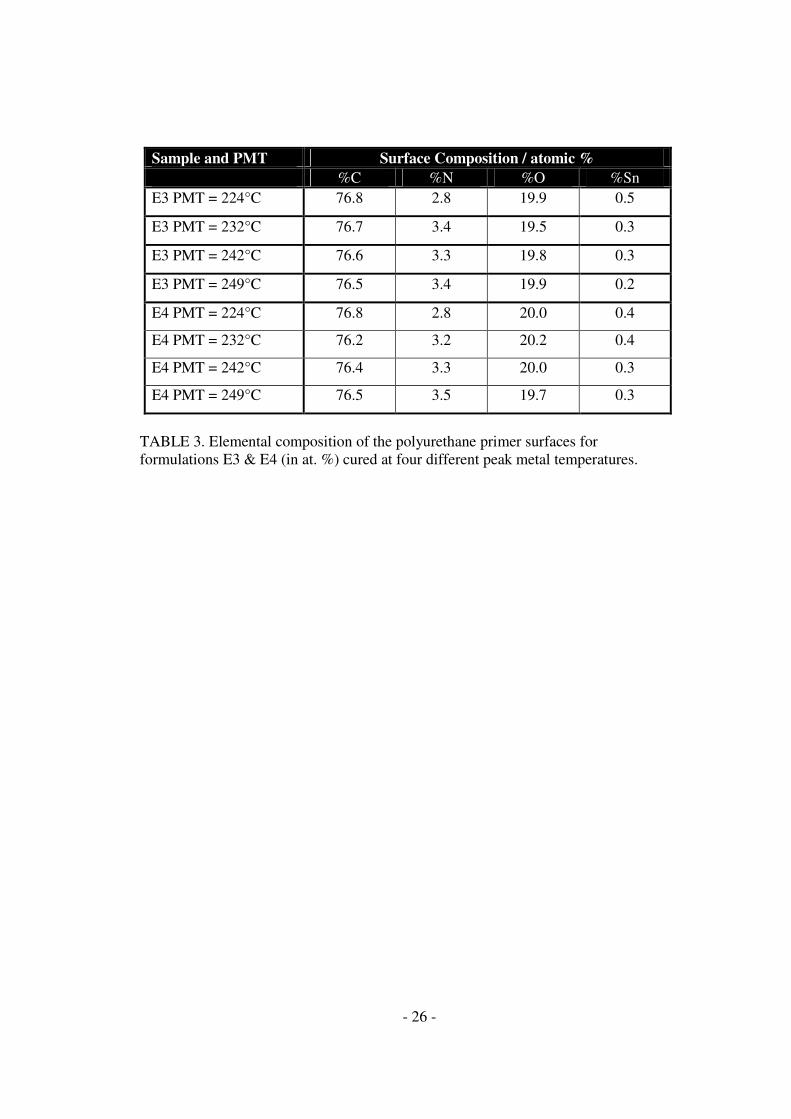
is typical of that observed for both primers at all PMTs in this initial study. In Table 3
the elemental surface compositions of PU primer formulations E3 and E4 cured at
PMTs of 224°C, 232°C, 242°C and 249°C are presented.
It is observed in Table 3 that the surface concentration (in atomic %) of carbon and
oxygen are very similar for both primer formulations regardless of the PMT curing
temperature employed. Additionally, Table 3 shows that for both of the PU primer
formulations investigated, raising the PMT curing temperature leads to an increase in
the surface concentration of nitrogen. The concentration of tin remains similar for
both primers regardless of the PMT curing temperature employed. The tin species
present in the PU primer arise from the addition of an organotin curing catalyst to the
formulation.
As already discussed, Table 3 demonstrates that the surface concentration of tin for
the E3 and E4 PU primer surfaces are similar. At PMTs above 232°C the surface
concentrations of tin in the E3 and E4 PU primers are very similar. The similarity in
tin concentrations above 232°C for the E3 and E4 PU primers indicates that the
addition of the matting agent to the PU primer formulations does not affect the
surface composition of the primer. Furthermore, the similarity in tin concentrations

- 11 -
shows that the matting agent, when added to the E3 PU primer formulation to make
E4, is not expressed at the PU primer surface.
The principal source of the nitrogen species in both PU primer formulations is the
crosslinking agent employed. The increase in nitrogen concentration at the surface of
the PU primers in Table 3 (associated with increasing PMT curing temperature),
suggests the crosslinking agent preferentially segregates towards the air-coating
surface of the PU primer formulation at higher curing temperature. However, given
that the concentration of nitrogen for both PU primers is similar for PMTs above
232°C, it would seem that any variations in surface elemental composition observed
are minor for PU primer coatings cured at or above this temperature. A similar
finding has been reported by Perruchot et al. for the effects of variation of the PMT
employed during curing of a series of polyester coil coating formulations. [17] With
knowledge of this result all primer coatings, regardless of formulation, used in the
studies described here for the investigation of PU primer to PVdF topcoat intercoat
adhesion, were cured at a PMT of 232°C.
The five PU primer formulation variations described in Table 1 were applied to
HDGS substrate, cured at 232°C and characterised by XPS. The surface elemental
compositions (in atomic %) for each of the PU primer formulations are presented in
Table 4. An initial inspection of Table 4 reveals that the PU primers E1, E2, E3 and
E4 possess similar concentrations of carbon at their surface. The E2 (crosslinker
changed) and E4 (extra crosslinker and matting agent) PU primer surfaces exhibit

- 12 -
similar concentrations of oxygen, while the oxygen concentration of the E3 (extra
crosslinker) PU primer surface is somewhat lower and the oxygen concentration of
the E1 PU primer surface somewhat higher than those observed for E2 and E4.
However, the E1, E2, E3 and E4 oxygen concentration values fall within a narrow
range. The similarity in the carbon and oxygen concentrations for E1, E2, E3 and E4
PU primer surfaces suggests the chemical compositions of these four surfaces are
very similar.
The elemental composition of the E5 PU primer is markedly different to that of the
other PU primers investigated, making it something of an anomaly. The E5 PU
primer surface displays increased carbon and oxygen concentrations and a lower
nitrogen concentration than the other PU primer coatings examined. Perhaps, most
notably, no tin signal is observed at the E5 PU primer surface. Table 1 described the
E5 PU primer formulation as containing an acrylic flow agent. It is a well reported
phenomena that flow agents segregate to the surfaces of coating and paints [14-16]
where they perform their principle function, namely, that of aiding flow by lowering
the surface free energy of the pre-cured coating formulation. Often, flow agents are
employed to perform additional functions such as leveling or anti-cratering, which
improve the surface finish of a coating or paint. Perruchot et al., employing angle
resolved XPS, have demonstrated that flow agents form a segregation layer at the
surface of cured coatings, that are typically 0.5 to 2nm thick [18] depending on the
type and quantity of flow agent employed in the coating formulation. The increased
carbon and oxygen concentrations and lower nitrogen concentration observed for the

- 13 -
E5 PU primer surface in Table 4 are the result of the formation of an acrylic flow
agent layer at the air-coating surface. By segregating to the surface and forming a
layer, the flow agent strongly attenuates the nitrogen signal arising from the
crosslinking resin. Furthermore, the signal arising from the presence of the organotin
catalyst in the primer formulation is completely masked by the presence of the flow
agent layer, thus leading to the lack of tin signal as observed in Table 4 for the E5 PU
primer surface.
To investigate intercoat adhesion failure the PU primers, E1 to E5 (cured at 232°C)
were coated with a standard PVdF based topcoat formulation. The PVdF topcoat was
cured at 249°C with an oven dwell time of 55s directly onto the PU primer coating.
To examine the surfaces resulting from adhesion failure between the two polymeric
coatings, coated specimens were scored through to the substrate in a cross-hatch
pattern with a scalpel. Where possible the PVdF topcoat was removed from the PU
primer with tweezers. In some instances it was necessary to apply an adhesive tape
peel to the scored cross-hatch so as to initiate delamination of the PVdF topcoat from
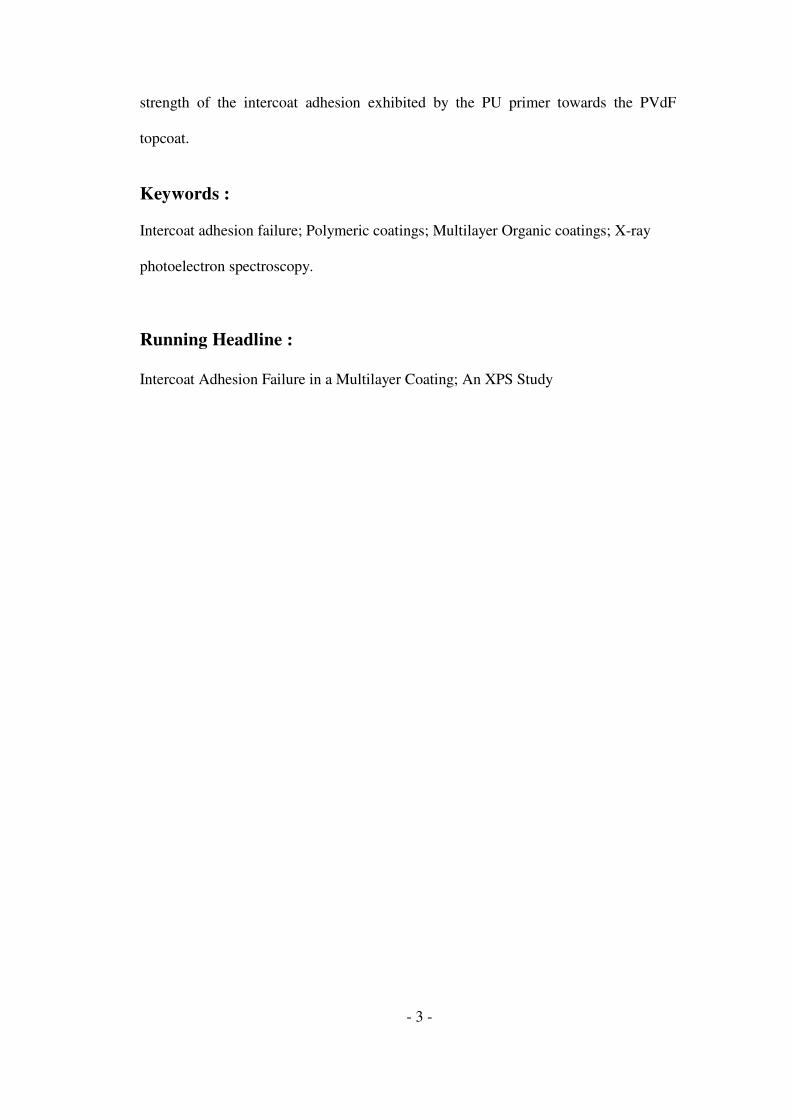
the PU primer. Once delaminated, three surfaces were available for analysis: the PU
primer adhesion failure surface, the PVdF topcoat adhesion failure surface and the
PVdF topcoat air-coating surface. A schematic describing the delamination of the
topcoat and the surfaces available for analysis is presented in Figure 2. The XPS
elemental composition analysis results for the adhesion failure surfaces of the
different PU primers, the corresponding PVdF topcoat adhesion failure surfaces and
the PVdF air-coating surfaces are presented in Table 5.

- 14 -
Comparison of the data from the primer sides of the failed interfaces in Table 5 with
those of the pristine PU primers characterised in Table 4 indicates attenuation of the
carbon, nitrogen and tin surface concentrations at the PU primer adhesion failure
surfaces. An exception is the nitrogen content of the E5 PU primer adhesion failure
surface, which exhibits an increased nitrogen concentration compared to that of the
pristine surface in Table 4. It is also observed that the PU primer adhesion failure
surfaces data in Table 5 exhibit a general increase in oxygen concentration when
compared to the uncoated primers in Table 4. The most notable difference between
the surface elemental compositions of the original primers in Table 4 and those of the
PU primer adhesion failure surfaces in Table 5 is the appearance of fluorine on the
PU primer side of the adhesion failure interface.
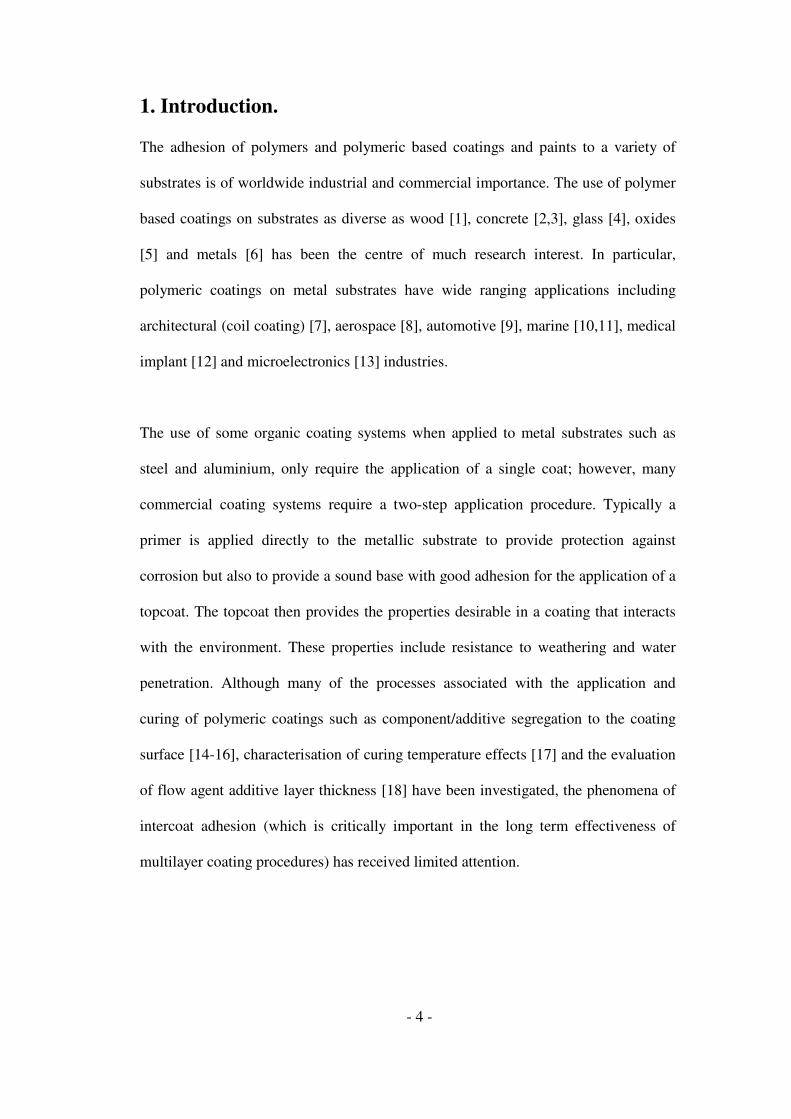
All fluorine data contained in Tables 4 & 5 is collated in Figure 3 to allow ready
comparison of concentration of fluorine as a function of primer type and location
within the coating system. All of the PU primer adhesion failure surfaces investigated
exhibited a fluorine surface concentration in the range 2.5±0.4%. Although the
fluorine must originate from the disbonded PVdF topcoat, the exact nature of the
fluorine has yet to be determined. The fluorine may exist as a monolayer covering the
majority of the surface, as islands in regions of the PU primer where adhesion was
particularly strong or may result from penetration of fluorine bearing components
from the PVdF topcoat into the uppermost regions of the PU primer coating.
- 15 -
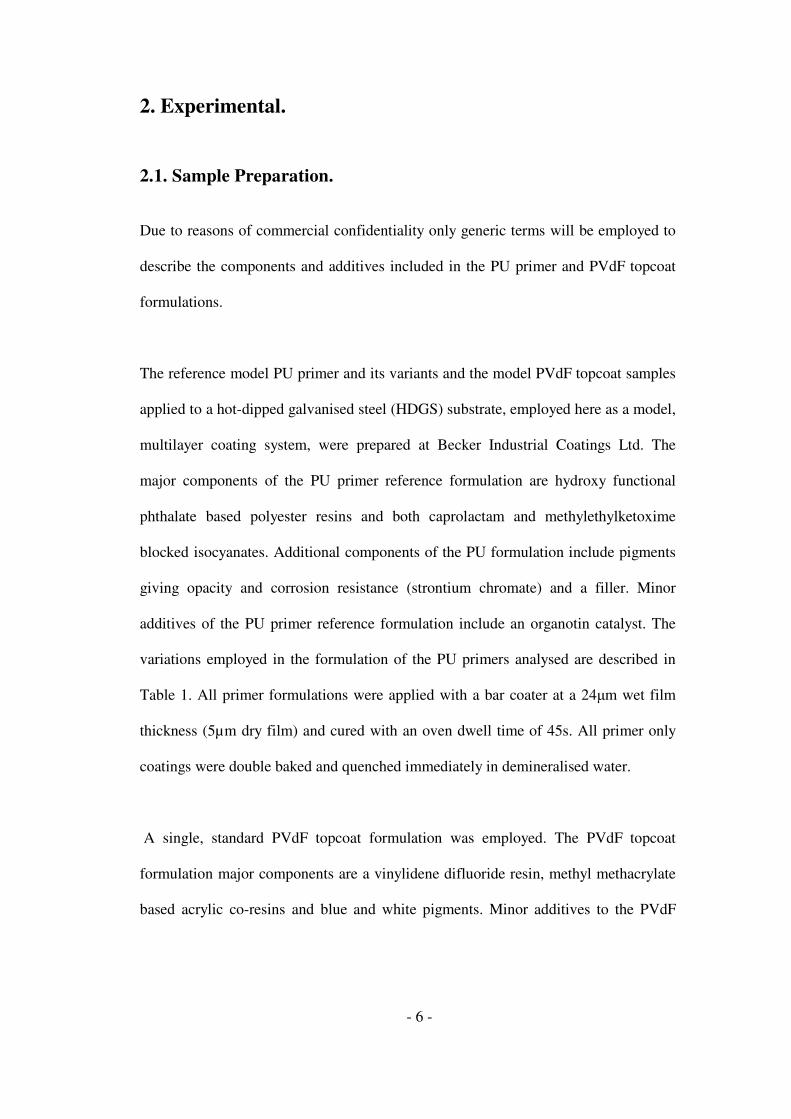
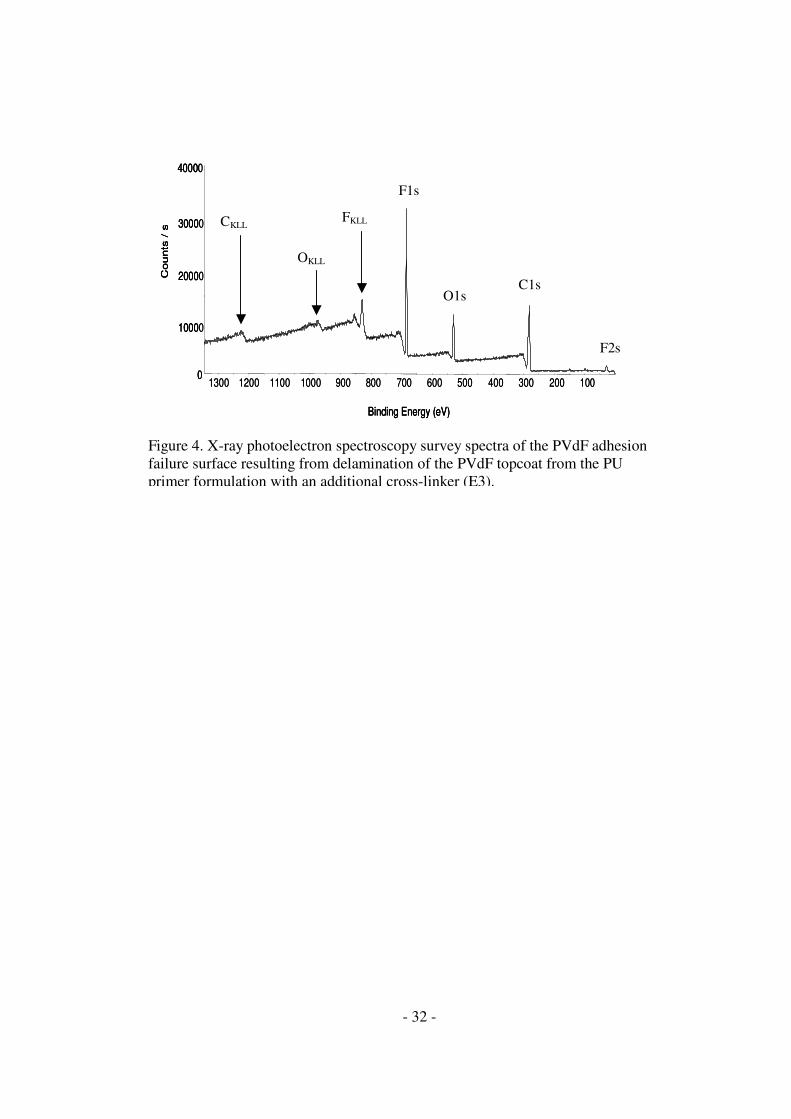
XPS elemental composition data for the PVdF sides of the failed interfaces after
delamination from each of the five PU primers investigated is also presented in Table
5. Figure 4 shows the XPS survey spectrum acquired from the PVdF topcoat side of
the failed interface after delamination from the primer with an additional crosslinker
(E3). XPS signals characteristic of C1s (~285 eV), O1s (~533 eV), F1s (~686 eV) and
F2s (~30 eV) are observed. Comparison of the elemental composition of this interface
with that from the PVdF side of the failed interface from the primer with both extra
crosslinker and matting agent (E4) highlights almost identical surfaces indicating that
the mode of failure is the same and that the influence of the matting agent in the
primer on adhesion comes from the increased surface roughness rather than any
chemical interaction.
It is possible to get information on the mechanism of failure by comparing the
spectra from the PVdF sides of the failed interfaces with those taken from the top
PVdF surfaces provided it is assumed no segregation phenomena are taking place.
The lack of nitrogen on the PVdF side of the interface and its reduced concentration
on the primer side is in concert with reduced concentrations of C and Sn, together
with the presence of fluorine on that side (~2%) suggests that delamination occurs
just into the PVdF side of the interface.
It was noted in the analysis of the XPS elemental composition data for the PU primer
adhesion failure surfaces that the E5 PU primer (flow aid added) exhibited an

- 16 -
increased surface nitrogen concentration (N = 1.9%) upon removal of the PVdF
topcoat, when compared to the pristine PU primer (N = 0.8%). It is also observed in
Table 5 that the PVdF side of the failed interface, complementary to the failed E5 PU
primer interface exhibits an increased oxygen concentration and a decreased fluorine
concentration when compared to the PVdF topcoats air-coating surface (see Table 5).
These results suggest that as the PVdF topcoat is removed from the E5 PU primer
some of the top surface of the primer (in effect the flow-agent layer described earlier)
is stripped and transferred to the PVdF side of the interface. However the carbon and
oxygen content is similar to that seen on the PVdF failure interfaces of E3 and E4 and
may indicate that the flow aid is not there and that the weak boundary layer is not
made up from this material. An alternative hypothesis is that the presence of the flow
aid inhibits the inter-diffusion of the primer and topcoat components because its own
dissolution process takes priority. Thus a substantial interphase region is prevented
from forming during the brief cure schedule. The increased nitrogen concentration is
due to a layer of the PU primer that is richer in nitrogen than the surface, being
exposed by stripping off the flow agent layer when the PVdF topcoat is removed. The
sub-surface nitrogen rich layer is due to the flow agent competing for the surface and
inhibiting the segregation of the crosslinker to the surface, thus even when the flow
agent is removed the nitrogen does not recover to the concentration seen in the other
primers.
A further detailed look at the surface composition shows a reduced fluorine
concentration at the PVdF top surface for E5 compared to the other 4 formulations. In

- 17 -
addition the carbon content is considerably higher and the oxygen content
significantly lower. These changes in C, O and F concentration suggest that the flow
agent in the primer has some effect on the topcoat. It supports the hypothesis that the
flow agent dissolves in the liquid PVdF topcoat which contains solvents prior to
baking and segregates to the air-coating interface in competition with the fluorine
moieties that normally move to the same interface within the time scale of this baking
schedule (10 s between application and oven, 45 s dwell time in the oven). The
acrylic flow aid is more likely to segregate to the surface as the PVdF is present as
discrete particles until they dissolve in the isophorone solvent at high temperature.
However, the surface composition is significantly different to that of the primer with
flow aid (E5) and so this requires further investigation with TOF-SIMS.
The XPS elemental composition data for the PVdF topcoat adhesion failure surfaces
of the E1 (C = 62.2%, O = 15.2%, F = 22.6%, reference formulation) and E2 (C =
63.5%, O = 17.4%, F = 19.1%, new crosslinker) PU primer samples given in Table 5
are significantly different from those for the E3 (C = 58.9%, O = 12.0%, F = 29.1%,
extra crosslinker) sample. For the E1 and E2 topcoat adhesion failure surfaces a
considerable increase in carbon and oxygen concentrations is noted when compared
to the PVdF topcoat air-coating surface (see Table 5). Additionally, a substantial
decrease in the fluorine surface concentration is observed for the same failure
interfaces, when compared to the PVdF topcoat air-coating surfaces (see Figure 3).
These results clearly indicate transfer of non-nitrogen containing components from
the PU primers E1 and E2 to the PVdF topcoats interfacial surface. However, a
- 18 -
review of Table 1 indicates that the E1 and E2 primer formulations contain less of the
nitrogen containing cross-linking agent used in the E3, E4 and E5 primer
formulations. This suggests that the increased carbon and oxygen concentrations,
observed at the PVdF adhesion failure surfaces for E1 and E2 PU primers, result from
the transfer of non-crosslinked polyester resin material from the PU primer which
arises from the reduced concentration of the crosslinking agent in these formulations.
They again will be checked employing TOF-SIMS.
These findings clearly indicate that the degree of crosslinking achieved in the primer
is extremely important in terms of the adhesive properties exhibited by the primers
towards the PVdF topcoat. If the primer coating is under crosslinked, the rigidity and
mechanical properties of the primer are compromised, and adhesion failure occurs on
the PU primer side of the PU primer/PVdF topcoat interface due to the presence of a
weak boundary layer consisting mainly of un-crosslinked polyester. If the primer is
over crosslinked then inter-coating diffusion is reduced or eliminated and true
interfacial failure will occur. These results are of particular importance to the coating
formulator as they suggest that the balance of crosslinker resin concentration and cure
conditions can have wide ranging effects on properties such as intercoat adhesion.
Consideration of the nitrogen concentration values presented in Table 4 for the
pristine PU primer surfaces, percentage adhesion values from the cross hatch
adhesive tape peel test given in Table 2 and the analysis of the PU primer and PVdF
topcoat adhesion failure surfaces in Table 5 suggests a correlation between the
- 19 -
concentration of nitrogen at the PU primer surface and the strength of adhesion
exhibited by the PU primer towards the PVdF topcoat. The E3 and E4 PU primer
coatings (both of which possess a nitrogen concentration >3%, see Table 4) display
the greatest adhesion towards the PVdF topcoat (75% and 90% adhesion respectively,
see Table 2) of the PU primer formulations investigated. Conversely, the E5 PU
primer coating, which possesses the lowest concentration of nitrogen at its surface
(<1% in Table 4) exhibits the poorest adhesion (0% adhesion, see Table 2) of all the
PU primer formulations examined. The E1 and E2 PU primer coatings exhibit a
strength of adhesion somewhat intermediate between the E3/E4 primers and the E5
version [E1 = 38% & E2 = 39% adhesion (see Table 2)]. These results are associated
with nitrogen concentrations >2% but <3% at the PU primer surface.
Analysis of Table 1 indicates that the E1 and E2 PU primer formulations contain
reduced concentrations of the nitrogen containing crosslinking resin, and presumably
this leads to the lower nitrogen concentrations observed for these primer surfaces
detailed in Table 4. Comparison of those nitrogen concentrations obtained for the
higher crosslinking resin concentration formulations (E3 and E4) with those measured
for the lower crosslinking resin concentration formulations (E1 and E2) suggests the
excess crosslinking resin employed may account for as much as a third of the nitrogen
signal observed at the PU primer surface. These results suggest the availability of
nitrogen containing species at the PU primer surface plays an important role in the
adhesive interactions displayed by the PU primer towards the PVdF topcoat. High PU
primer adhesion strengths are correlated with increased nitrogen concentration at the
- 20 -
PU primer surface. Phenomena that lower the nitrogen concentration at the PU primer
surface, such as the segregation of flow agent to the coating surface or the reduction
of nitrogen containing additives/components such as the crosslinking agent, lessen the
adhesive properties exhibited by the PU primer towards the PVdF topcoat.
4.0. Conclusions.
We have characterised, by XPS, five variations of a polyester/polyurethane based
primer formulation. We have also characterised by XPS the PU primer and PVdF
topcoat adhesion failure surfaces and PVdF topcoat air-coating surface in studies
encompassing intercoat adhesion failure. An initial study in which a subset of the PU
primer formulations were cured at different PMTs demonstrated that beyond 232°C
changes in PU primer surface composition are negligible. XPS characterisation of the
pristine PU primers cured at 232°C indicated that inclusion of the matting agent in the
E4 PU primer formulation had no effect on the surface composition observed and that
the flow agent additive segregated to the surface of the E5 PU primer.
Analysis of the PU primer and PVdF topcoat adhesion failure surfaces indicates
stripping of the segregated flow agent layer from the E5 sample and its transfer to the
PVdF topcoat coating-coating surface. For the E3 and E4 PU primers, the transfer of
quantities of components from the PVdF topcoat onto the primer and the lack of
nitrogen on the backside of the PVdF upon delamination indicate the locus of
- 21 -
adhesion failure is located on the PVdF side of the PU primer/PVdF topcoat interface.
For the E1 and E2 PU primers, transfer of material from the PU primer to the PVdF
topcoat is observed. This is the result of insufficient crosslinking of the polyester
component, due to the reduced concentration of the crosslinking resin in these PU
primer formulations.
PU primer adhesive properties are correlated with nitrogen concentration at the PU
primer surface. Increased PU primer adhesion towards the PVdF topcoat is associated
with higher nitrogen concentrations (>3%) at the PU primer surface. These results are
of particular significance to the coating formulator as they demonstrate that the
inclusion or exclusion of components and additives that modify surface composition
and chemistry may have a significant impact upon the properties exhibited by the
coating, such as adhesion in the studies described here.
The presence of the flow aid on the surface of the E5 primer inhibits diffusion
processes that would normally form a strong interphase region thus resulting in very
weak intercoat adhesion.
- 22 -
Acknowledgements.
The authors acknowledge the financial support of the EPSRC (Grant no.
GR/N65745).
References.
[1] Bongiovanni R, Montefusco F, Priola A, Macchioni, Lazzeri S, Sozzi L, Ameduri
B, Progress in Organic Coatings 45 (2002) 359
[2] Barbucci A, Delucchi M, Cerisola G, Progress in Organic Coatings 30 (1997)
293.
[3] Seneviratne AMG, Sergi G, Page CL, Construction and Building Materials 14
(2000) 55.
[4] Cech V, Prikryl R, Balkova R, Vanek J, Grycova A, J. Adhesion Sci. Technol. 17
(2003) 1299.
[5] Nguyen TP, Le Rendu P, de Vos SA, Synthetic Metals 138 (2003) 113.
[6] Pesetskii SS, Jurkowski B, Kuzavkov AI, International Journal of Adhesion and
Adhesives 18 (1998) 351.
[7] Haverkamp RG, Siew DCW, Barton TF, Surface and Interface Analysis 33
(2002) 330.
[8] Bierwagen GP, Tallman DE, Progress in Organic Coatings 41 (2001) 201.
[9] Haack LP, Straccia AM, Holubka JW, Bhurke A, Xie M, Drzal LT, Surface and
Interface Analysis 29 (2000) 829.
[10] Brady RF, Progress in Organic Coatings 43 (2001) 188.
[11] Adkins JD, Mera AE, Roe-Short MA, Pawlikowski GT, Brady RF, Progress in
Organic Coatings 29 (1996) 1.
[12] Tritschler B, Forest B, Rieu J, Tribology International 32 (1999) 587.
[13] Fahlman M, Salaneck WR, Surface Science 500 (2002) 904.
[14] Leadley SR, Watts JF, Blomfield CJ, Lowe C, Surf. Interface Anal. 26 (1998)
444.
- 23 -
[15] Watts JF, Abel M-L, Perruchot C, Lowe C, Maxted JT, White RG, J. Electron
Spectrosc. Relat. Phenom. 121 (2001) 233.
[16] Perruchot C, Abel M-L, Watts JF, Lowe C, Maxted JT, White RG, Surf.
Interface Anal. 34 (2002) 570.
[17] Perruchot C, Watts JF, Lowe C, Beamson G, International Journal of Adhesion
and Adhesives 23 (2003) 101.
[18] Perruchot C, Watts JF, Lowe C, White RG, Cumpson PJ, Surf. Interface Anal.
33 (2002) 869.
[19] Li H, Chiba T, Higashida N, Yang Y, Inoue T, Polymer 38 (1997) 3921.
[20] Lowe C, Devos L, Lavaste V, Simmons GC, Watts JF, Journal of Coatings
Technology 72 (2000) 135.
[21] Lauke B, Schüller T, Schneider K, Composite Interfaces 10 (2003) 1.
[22] Horgnies M, Darque-Ceretti E, Combarieu R, Progress in Organic Coatings 47
(2003) 154.
[23] Cho DL, Shin KH, Lee W-J, Kim D-H, J. Adhesion Sci. Technol. 15 (2001) 653.
- 24 -
TABLE 1. PU primer formulation variations.
Primer Formulation Variation
E1 Base Reference Formulation
E2 Base Reference Formulation & change of crosslinking
agent
E3 As E2 & an additional crosslinking agent E4 As E3 & matting agent
E5 As E3 & acrylic flow agent
- 25 -
TABLE 2. PU primer grade denoting ease of PVdF Topcoat delamination from the
PU primer.
Primer Adhesion
Level / %
E1 38
E2 39
E3 75
E4 90
E5 0
- 26 -
Sample and PMT Surface Composition / atomic %
%C %N %O %Sn
E3 PMT = 224°C 76.8 2.8 19.9 0.5
E3 PMT = 232°C 76.7 3.4 19.5 0.3
E3 PMT = 242°C 76.6 3.3 19.8 0.3
E3 PMT = 249°C 76.5 3.4 19.9 0.2
E4 PMT = 224°C 76.8 2.8 20.0 0.4
E4 PMT = 232°C 76.2 3.2 20.2 0.4
E4 PMT = 242°C 76.4 3.3 20.0 0.3
E4 PMT = 249°C 76.5 3.5 19.7 0.3
TABLE 3. Elemental composition of the polyurethane primer surfaces for
formulations E3 & E4 (in at. %) cured at four different peak metal temperatures.

- 27 -
Primer Surface Composition / atomic %
%C %N %O %Sn
E1 76.5 2.3 20.8 0.4
E2 76.8 2.6 20.2 0.4
E3 76.7 3.4 19.5 0.3
E4 76.2 3.2 20.2 0.3
E5 77.8 0.8 21.5 -
TABLE 4. XPS elemental compositions (in atomic%) of the PU primer surfaces. A
peak metal temperature of 232°C was employed to cure all PU primer samples
investigated.
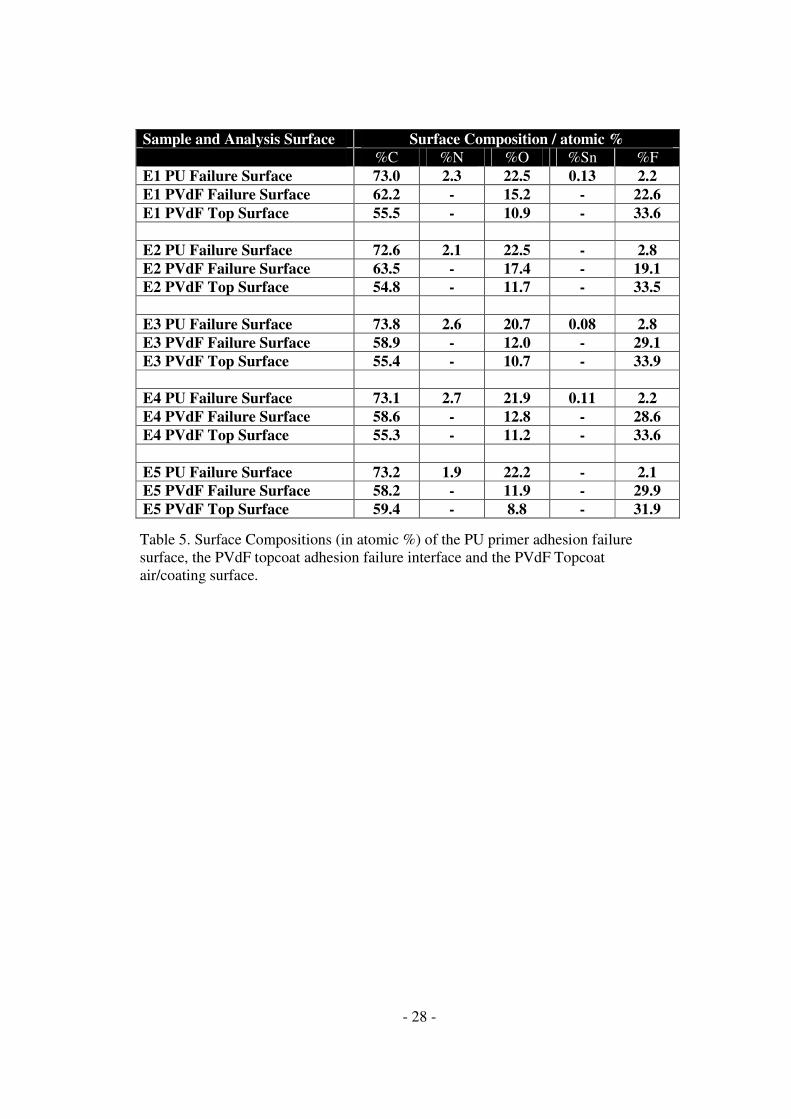
- 28 -
Sample and Analysis Surface Surface Composition / atomic %
%C %N %O %Sn %F
E1 PU Failure Surface 73.0 2.3 22.5 0.13 2.2
E1 PVdF Failure Surface 62.2 - 15.2 - 22.6
E1 PVdF Top Surface 55.5 - 10.9 - 33.6
E2 PU Failure Surface 72.6 2.1 22.5 - 2.8
E2 PVdF Failure Surface 63.5 - 17.4 - 19.1
E2 PVdF Top Surface 54.8 - 11.7 - 33.5
E3 PU Failure Surface 73.8 2.6 20.7 0.08 2.8
E3 PVdF Failure Surface 58.9 - 12.0 - 29.1
E3 PVdF Top Surface 55.4 - 10.7 - 33.9
E4 PU Failure Surface 73.1 2.7 21.9 0.11 2.2
E4 PVdF Failure Surface 58.6 - 12.8 - 28.6
E4 PVdF Top Surface 55.3 - 11.2 - 33.6
E5 PU Failure Surface 73.2 1.9 22.2 - 2.1
E5 PVdF Failure Surface 58.2 - 11.9 - 29.9
E5 PVdF Top Surface 59.4 - 8.8 - 31.9
Table 5. Surface Compositions (in atomic %) of the PU primer adhesion failure
surface, the PVdF topcoat adhesion failure interface and the PVdF Topcoat
air/coating surface.

- 29 -
Figure 1. X-ray photoelectron spectroscopy survey spectra of the E3 PU primer
coating formulation cured at a peak metal temperature of 224°C.
0
10000
20000
30000
40000
50000
60000
70000
80000
90000
100000
110000
120000
130000
0100200300400500600700800900100011001200
Counts
/ s
Binding Energy (eV)
Survey
C1s
O1s
N1s
Sn3d Sn3p
SnMNN
OKLL

- 30 -
PU Primer
PVdF Topcoat
PU Failure Surface
PVdF Failure Surface PVdF Top Surface
Figure 2. A schematic of the PU primer and PVdF topcoat intercoat adhesion
failure surfaces and PVdF topcoat air-coating surface analysed.

- 31 -
E1 E2E3
E4E5
0
5
10
15
20
25
30
35
%F
Primer
Pristine
PU FS
PVdF FS
PVdF TC
Figure 3. A 3-D histogram showing the fluorine concentrations of the pristine primer,
the PU primer interfacial failure surface (PU FS), the PVdF topcoat interfacial failure
surface (PVdF FS) and the PVdF topcoat air/coating surface (PVdF TC) for each of
the PU primer formulations E1 to E5.
- 32 -
0
10000
20000
30000
40000
1002003004005006007008009001000110012001300
Counts
/ s
Binding Energy (eV)
0
10000
20000
30000
40000
1002003004005006007008009001000110012001300
Counts
/ s
Binding Energy (eV)
0
10000
20000
30000
40000
1002003004005006007008009001000110012001300
Counts
/ s
Binding Energy (eV)
C1s
F2s
O1s
F1s
CKLL
OKLL
FKLL
Figure 4. X-ray photoelectron spectroscopy survey spectra of the PVdF adhesion
failure surface resulting from delamination of the PVdF topcoat from the PU
primer formulation with an additional cross-linker (E3).