interchange modification report - locust grove, … document is an interchange modification report...
TRANSCRIPT

Interchange Modification Report
I-75 at Bill Gardner Parkway (CR 650)
City of Locust Grove in Henry County, Georgia
Prepared for:
City of Locust Grove
In coordination with:
Georgia Department of Transportation
Prepared by:
February 2011
I-75 & Bill Gardner Parkway IMR Page | ii
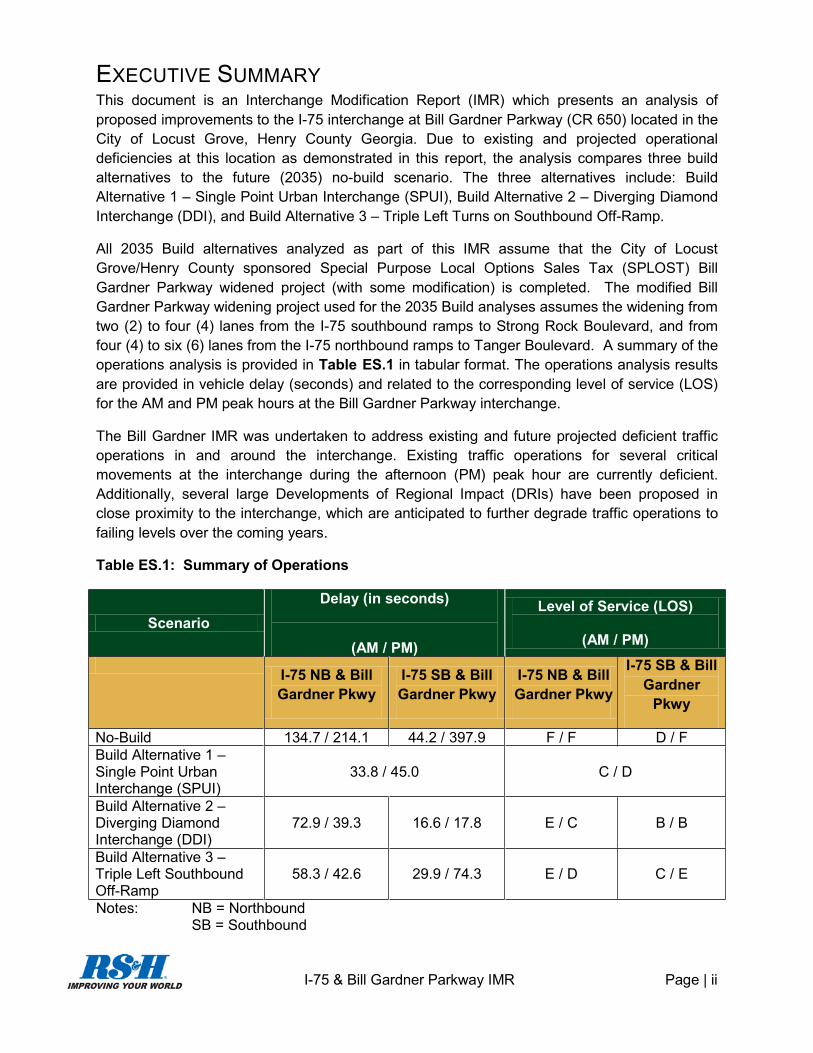
EXECUTIVE SUMMARYThis document is an Interchange Modification Report (IMR) which presents an analysis of proposed improvements to the I-75 interchange at Bill Gardner Parkway (CR 650) located in the City of Locust Grove, Henry County Georgia. Due to existing and projected operational deficiencies at this location as demonstrated in this report, the analysis compares three build alternatives to the future (2035) no-build scenario. The three alternatives include: Build Alternative 1 – Single Point Urban Interchange (SPUI), Build Alternative 2 – Diverging Diamond Interchange (DDI), and Build Alternative 3 – Triple Left Turns on Southbound Off-Ramp.
All 2035 Build alternatives analyzed as part of this IMR assume that the City of Locust Grove/Henry County sponsored Special Purpose Local Options Sales Tax (SPLOST) Bill Gardner Parkway widened project (with some modification) is completed. The modified Bill Gardner Parkway widening project used for the 2035 Build analyses assumes the widening from two (2) to four (4) lanes from the I-75 southbound ramps to Strong Rock Boulevard, and from four (4) to six (6) lanes from the I-75 northbound ramps to Tanger Boulevard. A summary of the operations analysis is provided in Table ES.1 in tabular format. The operations analysis results are provided in vehicle delay (seconds) and related to the corresponding level of service (LOS) for the AM and PM peak hours at the Bill Gardner Parkway interchange.
The Bill Gardner IMR was undertaken to address existing and future projected deficient traffic operations in and around the interchange. Existing traffic operations for several critical movements at the interchange during the afternoon (PM) peak hour are currently deficient.Additionally, several large Developments of Regional Impact (DRIs) have been proposed in close proximity to the interchange, which are anticipated to further degrade traffic operations to failing levels over the coming years.
Table ES.1: Summary of Operations
ScenarioDelay (in seconds)
(AM / PM)
Level of Service (LOS)
(AM / PM)
I-75 NB & Bill Gardner Pkwy
I-75 SB & Bill Gardner Pkwy
I-75 NB & Bill Gardner Pkwy
I-75 SB & Bill Gardner
Pkwy
No-Build 134.7 / 214.1 44.2 / 397.9 F / F D / FBuild Alternative 1 –Single Point Urban Interchange (SPUI)
33.8 / 45.0 C / D
Build Alternative 2 –Diverging Diamond Interchange (DDI)
72.9 / 39.3 16.6 / 17.8 E / C B / B
Build Alternative 3 –Triple Left Southbound Off-Ramp
58.3 / 42.6 29.9 / 74.3 E / D C / E
Notes: NB = NorthboundSB = Southbound

I-75 & Bill Gardner Parkway IMR Page | iii
The SPUI combines the NB and SB movements into one intersection.
The decision matrix compares the environmental impacts, operational results, cost of each Build Alternative, and benefit/cost (B/C) ratios. Based on a desktop analysis of the wetlands around the Bill Gardner Parkway interchange, the DDI is the only alternative that would potentially impact wetlands. An engineer’s estimate of probable costs was calculated based on previous Georgia Department of Transportation (GDOT) unit costs from 01/2009 to 12/2009 and an estimate of right-of-way costs was calculated based on guidance from the City of Locust Grove.
Decision Matrix
Table ES-2 summarizes the key evaluation factors used to assess the three Build alternatives.Build Alternative 3, the Triple Left Turn Lanes at Southbound Off-Ramp is the recommended alternative.
Table ES-2: Key Evaluation Factors – Build Alternatives
Scenario
EnvironmentalImpacts (Acres)
Operational LOS
(AM/PM)
Cost(in
millions)
Benefit/Cost(B/C) Ratio
No-Build N/A F / F N/A N/ABuild Alternative 1 –Single Point Urban Interchange (SPUI)
0.0 C / D $ 47 0.39
Build Alternative 2 –Diverging Diamond Interchange (DDI)
0.15 E / C $33 0.61
Build Alternative 3 –Triple Left Turn Lanesat Southbound Off-Ramp
0.0 E / E $17 1.0
N/A = Not Applicable
RECOMMENDATIONS BASED ON FHWA POLICIESThe Federal Highway Administration (FHWA) has provided guidance on the access or modification to existing access points on the interstate system. FHWA’s policy requires justification and documentation of the proposed changes based on forecasted traffic volumes and corresponding operational levels of service, recommended safety improvements, and the cost of the improvements. These policy points are further discussed in Section 11 of this report.
The recommended interchange type selected was the existing standard diamond with an additional left turn lane for the southbound-to-eastbound off movement. This is Build Alternative 3 – Triple Left Turn Lanes on Southbound Off-Ramp. As stated previously, this recommendation assumes that Bill Gardner Parkway is widened from two (2) to four (4) lanes from the I-75 southbound ramps to Strong Rock Boulevard, and from four (4) to six (6) lanes from the I-75 northbound ramps to Tanger Boulevard. With Build Alternative 3, the interchange operates at an acceptable level of service based on the design year 2035 traffic estimates. Build Alternative 3 requires no additional right-of-way to construct the additional left-turn lane. This

I-75 & Bill Gardner Parkway IMR Page | iv
alternative has the lowest cost estimate of the three alternatives studied with an estimated total project cost of $17 million, and the most favorable B/C ratio.

I-75 & Bill Gardner Parkway IMR Page | v
TABLE OF CONTENTSExecutive Summary ....................................................................................................................ii
Recommendations Based on FHWA Policies ......................................................................... iii
1. Introduction ......................................................................................................................... 1
1.1 Project Description/Existing Roadways .........................................................................1
1.2 Project Need and Purpose ............................................................................................4
2. Study Methodology ............................................................................................................. 5
2.1 Analysis Years ..............................................................................................................5
2.2 Area of Influence...........................................................................................................5
2.3 Summary of IMR Methodology......................................................................................5
2.3.1 Data Collection........................................................................................................... 5
2.3.2 Assessment of Existing Conditions............................................................................. 5
2.3.3 Development of Future Traffic Projections.................................................................. 6
2.3.4 Analysis of Future Traffic Operations ......................................................................... 6
2.3.5 Identification of Needs/Development of Alternatives................................................... 6
2.3.6 Testing of Alternatives/Detailed Analysis.................................................................... 7
2.3.7 Development of Recommendations............................................................................ 7
2.4 Traffic Analysis Tools....................................................................................................7
3. Data Collection, Existing Conditions, and Planned Improvements ...................................... 8
3.1 Summary of Data Collected ......................................................................................... 8
3.1.1 Metro Atlanta Regional Freight Mobility Plan (2005)................................................... 8
3.1.2 Value-Added Pricing Study: I-75 Corridor (2009)........................................................ 9
3.1.3 Southern Regional Accessibility Study (2007) ............................................................ 9
3.1.4 Joint Henry County/Cities Comprehensive Transportation Plan (2007) .....................10
3.1.5 Joint Henry County/Cities Comprehensive Plan (2007).............................................10
3.1.6 City of Locust Grove IMR Feasibility Report (2008)...................................................11
3.1.7 City of Locust Grove Impact Fee Methodology Report ..............................................11
3.1.8 Bandy Locust Grove DRI, DRI No. 1610 (2008) ........................................................12
3.1.9 Strong Rock DRI No. 999 (2006)...............................................................................13
3.1.10 City of Locust Grove Land Use Maps ......................................................................14
3.1.11 Envision6 Regional Transportation Plan and FY 2008-13 Transportation Improvement Program .......................................................................................................15
3.2 Traffic Count Data.....................................................................................................166
3.3 Other Data Collected and Utilized .............................................................................176

I-75 & Bill Gardner Parkway IMR Page | vi
3.4 Planned Transportation Improvements .......................................................................18
4. Existing Conditions Analysis ..............................................................................................21
4.1 Existing Peak Hour Traffic Volume Development........................................................21
4.2 Existing Conditions – Basic Freeway Analysis ............................................................25
4.3 Existing Conditions – Ramp Merge/Diverge Analysis..................................................25
4.4 Existing Conditions – Intersection Analysis .................................................................26
4.4.1 Price Drive/Strong Rock Parkway and Bill Gardner.....................................................26
4.4.2 I-75 Southbound and Bill Gardner Parkway ................................................................27
4.4.3 I-75 Northbound and Bill Gardner Parkway ................................................................27
4.4.4 Tanger Boulevard and Bill Gardner Parkway .............................................................27
4.4.5 I-75 Northbound and SR 155 ......................................................................................27
4.4.6 I-75 Southbound and SR 155......................................................................................27
4.4.7 I-75 Northbound and SR 16 ........................................................................................27
4.4.8 I-75 Southbound and SR 16........................................................................................27
5. Crash Analysis ...................................................................................................................28
6. Forecast of Future Traffic Volumes ....................................................................................30
7. Concept Development........................................................................................................33
7.1 Build Alternative 1 – Single Point Urban Interchange (SPUI) ......................................34
7.2 Build Alternative 2 – Diverging Diamond Interchange (DDI) ........................................35
7.3 Build Alternative 3 – Triple Left Turns on I-75 Southbound Off Ramp .........................36
8. Design Year 2035 Analysis ................................................................................................38
8.1 2035 No-Build Analysis ...............................................................................................38
8.1.1 2035 No Build – Freeway Analysis..............................................................................38
8.1.2 2035 No Build – Merge/Diverge Analysis ....................................................................38
8.1.3 2035 No Build – Intersection Analysis .........................................................................39
8.1.4 2035 No Build – Cost Estimates..................................................................................40
8.2 2035 Build Alternative Freeway Analysis ....................................................................43
8.2.1 2035 Freeway Analysis ...............................................................................................43
8.2.2 2035 Merge/Diverge Analysis .....................................................................................43
8.3 Build Alternative 1 – Single Point Urban Interchange (SPUI) ......................................44
8.3.1 Build Alternative 1 – Intersection Analysis - SPUI .......................................................44
8.3.2 Build Alternative 1 – Planning Level Cost Estimates - SPUI........................................45
8.4 Build Alternative 2 – Diverging Diamond Interchange (DDI) ........................................48
8.4.1 Build Alternative 2 – Intersection Analysis - DDI .........................................................48

I-75 & Bill Gardner Parkway IMR Page | vii
8.4.2 Build Alternative 2 – Planning Level Cost Estimates - DDI ..........................................49
8.5 Build Alternative 3 – Triple Left Turns (Southbound Off-Ramp at Bill Gardner) ...........52
8.5.1 Build Alternative 3 – Intersection Analysis – Triple Left Turns .....................................52
8.5.2 Build Alternative 3 – Planning Level Cost Estimates – Triple Left Turns......................53
8.6 Summary of Operations Analysis ................................................................................56
9. Environmental Screening ...................................................................................................57
9.1 Potential Wetlands.......................................................................................................57
9.2 Floodplains .. ....…………………………..........................................................................58
9.3 Threatened and Endangered Species………………………………………………………59
9.4 Community Issues…………………………………………………………………………….60
9.5 Section 4(f) ... ………………………………………………………………………………….60
9.6 Potential Contamination.………………………………………………………………….….60
10. Evaluation of Alternatives..…………………………………………………………………….62
11. FHWA Policy Compliance...............................................................................................63
Policy 1: Existing Facilities .................................................................................................63
Policy 2: Transportation Management System ...................................................................63
Policy 3: Operational Analysis............................................................................................64
Policy 4: Access Connections and Design .........................................................................65
Policy 5: Transportation Plans............................................................................................65
Policy 6: Comprehensive Interstate Network Study............................................................66
Policy 7: Coordination with Transportation System Improvements .....................................66
Policy 8: Status of Planning and NEPA ..............................................................................67
Recommendations Based on FHWA Policies ........................................................................67

I-75 & Bill Gardner Parkway IMR Page | viii
LIST OF FIGURES
Figure 1.1: Project Location Map ............................................................................................... 1Figure 1.2: Project Study Area ................................................................................................... 3Figure 3.1: City of Locust Grove Existing Land Use ..................................................................14Figure 3.2 : City of Locust Grove Future Land Use (2030) ........................................................15Figure 3.3: Count Site Locations ...............................................................................................17Figure 4.1: Peak Hour Determination ........................................................................................21Figure 4.2: Existing Year 2010: Bill Gardner Interchange Peak Hour Volume and LOS Results23Figure 4.3: Existing Year 2010: Adjacent Interchanges Peak Hour Volume and LOS Results...24Figure 5.1: 2008 Crash Rate Comparisons ...............................................................................29Figure 5.2: 2005 to 2009 Study Area Crashes ..........................................................................29Figure: 6.1 : I-75 Growth Rates .................................................................................................31Figure 7.1 : Build Alternative 1 – SPUI ......................................................................................35Figure 7.2 : Build Alternative 2 - DDI .........................................................................................36Figure 7.3: Build Alternative 3 - Triple Left Turns ......................................................................37Figure 8.1: Future 2035 No Build Peak Hour Volume and LOS Results (Bill Gardner ParkwayInterchange)..............................................................................................................................41Figure 8.2: Future 2035 No Build Peak Hour Volume and LOS Results (Adjacent Interchanges).................................................................................................................................................42Figure 8.3: Future Year 2035 – Build Alternative 1 – SPUI Peak Hour Volumes and LOS Results.................................................................................................................................................47Figure 8.4: Right-of-Way Requirements – Diverging Diamond Interchange...............................49Figure 8.5: Future Year 2035 – Build Alternative 2 – DDI Peak Hour Volumes and LOS Results.................................................................................................................................................51Figure 8.6: Year 2035 Build Alternative 3 – Triple Left Turns on Southbound Off-Ramp Peak Hour Volume and LOS Results .................................................................................................55Figure 9.1: Potential Wetlands ……………………………………………………………………….58Figure 9.2: FEMA Flood Zones……………………………………………………………………….59
LIST OF TABLES
Table 3.1: Bandy Locust Grove DRI Project Recommendations ...............................................12Table 3.2: Strong Rock DRI Project Improvements ...................................................................13Table 3.3: Summary of Planned Transportation Projects ..........................................................19Table 4.1: Summary of Traffic Factors ......................................................................................22Table 4.2: Truck Factors ...........................................................................................................22Table 4.3: Existing Conditions - Basic Freeway Analysis .........................................................25Table 4.4: Existing Conditions – Ramp Merge/Diverge (Northbound)........................................25Table 4.5: Existing Conditions - Ramp Merge/Diverge (Southbound)........................................26Table 4.6: Existing Conditions - Intersection Delay and LOS....................................................26Table 7.1: Interchange Alternatives...........................................................................................33Table 8.1: 2035 No Build Freeway Analyses.............................................................................38Table 8.2: 2035 No Build Merge/Diverge Analysis (Southbound) ..............................................39

I-75 & Bill Gardner Parkway IMR Page | ix
Table 8.3: 2035 No Build Merge/Diverge Analysis (Northbound)...............................................39Table 8.4: 2035 No Build Intersection Analysis .........................................................................40Table 8.5: 2035 Build Scenario - Basic Freeway Analysis.........................................................43Table 8.6: 2035 Build Scenario - Merge/Diverge Analysis (Southbound)...................................43Table 8.7: 2035 Build Merge/Diverge Analysis (Northbound) ....................................................44Table 8.8: Build Alternative 1 - Intersection LOS - SPUI............................................................45Table 8.9: Build Alternative 1 - Planning Level Cost Estimate - SPUI........................................46Table 8.10: Build Alternative 2 - Intersection LOS - DDI............................................................48Table 8.11: Build Alternative 2 - Planning Level Cost Estimate - DDI ........................................50Table 8.12: Build Alternative 3 - Intersection LOS – Triple Left Turns .......................................52Table 8.13: Build Alternative 3 - Planning Level Cost Estimate – Triple Left Turns....................54Table 8.14 : Summary of Operations Analysis ..........................................................................56Table 9.1: Listed Species in Henry County..…………………………………………………………60Table 9.2 : Underground Storage Tanks (USTs) Within the Project Area ..………………………61Table 10.1: Evaluation Matrix....................................................................................................62
APPENDICES
Appendix A – Existing Year 2010 Traffic CountsAppendix B – Crash Analysis SummaryAppendix C – Existing Year 2010 HCM Based Operational AnalysisAppendix D – Existing Year 2010 Micro-simulation AnalysisAppendix E – No Build 2035 HCM Based Operational AnalysisAppendix F – No Build Year 2035 Micro-simulation AnalysisAppendix G – Build 2035 Year HCM Based Operational AnalysisAppendix H – Build Year 2035 Micro-simulation AnalysisAppendix I – FHWA Policy on Interchange Modification ReportsAppendix J – CORSIM Model ManualAppendix K – Official Species List – Bill Gardner Parkway

I-75 & Bill Gardner Parkway IMR Page | 1
1. INTRODUCTIONThis report provides an analysis of proposed improvements to the I-75 interchange at Bill Gardner Parkway (CR 650) located in the City of Locust Grove, Henry County, Georgia as a result of existing and projected operational deficiencies in the area. The analysis presented here includes a comparison of traffic operations and capacity for the existing conditions and future Build and No Build scenarios. A brief environmental screening was also conducted to assesspossible wetland impacts and contamination issues related to the proposed improvements to the Bill Gardner Interchange.
1.1 PROJECT DESCRIPTION/ EXISTING ROADWAYS
This study consists of analyzing potential modifications to the existing interchange of I-75 at Bill Gardner Parkway in Henry County due to projected operational deficiencies (see Figure 1.1).The project limits along Bill Gardner Parkway for this IMR are Strong Rock Parkway to the west and Tanger Boulevard to the east.
The existing diamond interchange at Bill Gardner Parkway includes a six-lane bridge (three lanes north and south) carry I-75 over Bill Gardner Parkway.
Figure 1.1: Project Location Map

I-75 & Bill Gardner Parkway IMR Page | 2
The interchange is currently signalized at the intersections of the northbound and southbound I-75 ramps and Bill Gardner Parkway. Bill Gardner Parkway is a four (4) lane urban roadway with curb and gutter and a center two-way left-turn lane to the east and a rural two-lane roadway to the west. The northbound off-ramp consists of one deceleration lane off the mainline. The ramp then is divided into a through/left lane and a channelized right turn lane. The northbound on-ramp has two lanes immediately north of Bill Gardner Parkway, then merges into a one-lane ramp prior to intersecting the mainline of I-75. The southbound off-ramp consists of one deceleration lane departing the mainline, and then is divided into three lanes, which consist of a dedicated right turn, a through/left lane, and a dedicated left lane. The southbound on-ramp consists of one lane. Bill Gardner Parkway currently maintains one through lane westbound under the I-75 overpass with two eastbound through lanes. There is also a left turn lane with approximately 200 feet of storage for eastbound and westbound left turning vehicles.
The study area along I-75 includes the interchange at I-75 and State Route (SR) 155 to the north and at I-75 and SR 16 to the south. The SR 155 interchange consists of a partial cloverleaf with both loop ramps on the north side of SR 155 located approximately 4.5 miles north of Bill Gardner Parkway. The SR 16 interchange is a traditional diamond interchange located approximately 6.2 miles south of Bill Gardner Parkway. A map depicting the entire project study area can be seen in Figure 1.2.

I-75 & Bill Gardner Parkway IMR Page | 3
Figure 1.2: Project Study Area

I-75 & Bill Gardner Parkway IMR Page | 4
1.2 PROJECT NEED AND PURPOSE
The purpose of this IMR is to examine and analyze potential modifications at the I-75 and Bill Gardner Parkway interchange in Henry County, Georgia. The IMR is also a required technical document for obtaining FHWA approval to move forward on implementation of any proposed modifications to this interchange.
The need to study the Bill Gardner Parkway interchange is due to recent development within the Bill Gardner Parkway corridor and projected population growth that may impact and further degrade the LOS in the Locust Grove region of I-75. The Strong Rock Development of Regional Impact (DRI), construction of a Wal-Mart retail store, and continued growth throughout the region is resulting in additional traffic congestion on local roads as well as the I-75 ramps and mainline.
Congestion at the Tanger Boulevard intersection rapidly builds in the PM peak hour and field observations show queues extending west through the northbound intersection of the interchange. Existing PM peak operating conditions at Tanger Boulevard are at Level of Service (LOS) “E”, with 77.3 seconds of delay. The I-75 southbound off-ramp is currently experiencing LOS “D” with 43.9 seconds of delay and queues extending up to 600 feet from the intersection.The LOS at all of the study intersections is predicted to worsen if improvements are not implemented.
It should be noted that the purpose of this document is to also summarize the demand along the I-75 mainline and ramps at Bill Gardner Parkway, as well as the at-grade intersections on Bill Gardner Parkway adjacent to the I-75 interchange. The I-75 interchanges and ramp intersections at SR 155 in Henry County to the north and at the SR 16 interchange in Butts County to the south are also included in the analysis.

I-75 & Bill Gardner Parkway IMR Page | 5
2. STUDY METHODOLOGY
2.1 ANALYSIS YEARSThe IMR will examine existing conditions and future Build and No-Build alternatives using a variety of analysis software tools as described in more detail in subsequent sections. The analysis years for this IMR include the Existing Year (2010) and the Build Year 2035.
2.2 AREA OF INFLUENCEThe City of Locust Grove is a community of approximately 4,900 residents (www.census.comfor 2009) located along I-75 at Exit 212 (Bill Gardner Parkway). Locust Grove is approximately 35 miles south of Atlanta’s downtown area. The City of McDonough is located approximately 4.5 miles north of Locust Grove at Exit 216. The latest population statistics (www.census.com for 2009) for the City of McDonough show a population of approximately 19,900 residents. I-75 is a major transportation connector linking the Midwest to Florida. Both of these communities are situated along I-75 between Macon to the south and Atlanta to the north.
2.3 SUMMARY OF IMR METHODOLOGYThe Bill Gardner IMR was completed in several phases, including data collection, assessment of existing conditions, development of future traffic projections, analysis of future traffic operations, identification of needs, testing of alternatives, and development of project recommendations. Each of these phases is discussed in the following sub-sections.
2.3.1 DATA COLLECTION The first phase of the IMR was to collect and review available data. The study team requested and obtained data from local, regional, and state sources including data such as traffic counts, existing and future land use maps, proposed locations of new developments, travel demand model data, signal timing data, and roadway geometric data. Once all of the available data wereobtained and reviewed, it was determined that there were data gaps in the available recent traffic count data. Therefore, new traffic counts were required at the Bill Gardner Parkway/I-75interchange, the intersections adjacent to this interchange, the interchanges immediately north and south of the Bill Gardner Parkway interchange, and also along I-75. The study team alsoreviewed current and recently completed plans and studies to determine locations of recommended and programmed (funded) projects within the study area.
2.3.2 ASSESSMENT OF EXISTING CONDITIONSThe next phase of the study included analyzing the existing traffic operational conditions using the April 2010 traffic count data. The intersections within and adjacent to the Bill Gardner Parkway Interchange were analyzed, as well as freeway conditions along I-75, and ramp mergeand ramp diverge conditions. The Highway Capacity Methodology (HCM 2000+) was utilized for these analyses.

I-75 & Bill Gardner Parkway IMR Page | 6
2.3.3 DEVELOPMENT OF FUTURE TRAFFIC PROJECTIONSSubsequent to analyzing the existing traffic conditions, future traffic data were calculated to analyze the interchange for the future 2035 conditions. Several sources were used to project the 2010 traffic counts into future analysis years, 2020, and 2035. These sources included the adopted Atlanta Regional Commission’s (ARC) Envision6 travel demand model and the GDOT three-county model covering Butts, Jones, and Monroe Counties. Growth rates from these travel demand models were obtained and utilized as the primary data to help project existing traffic count data into the future analysis years. The future approach volumes were then calculated using the appropriate growth rates. The future traffic turning movements were balanced using an iterative procedure outlined in National Cooperative Highway Research Program (NCHRP) Report 255 entitled, “Highway Traffic Data for Urban Area Project Planning and Design.” The future traffic projections were completed with the assumption that Bill Gardner Parkway is widened from two (2) to four (4) lanes from the I-75 southbound ramps to Strong Rock Boulevard, and from four (4) to six (6) lanes from the I-75 northbound ramps to Tanger Boulevard.
2.3.4 ANALYSIS OF FUTURE TRAFFIC OPERATIONSUsing the future traffic turning movements, the HCS 2000 methodology was used to determine the future traffic operation conditions for the design year (2035) “No build” scenario at the Bill Gardner Parkway interchange with I-75. Similarly to the existing conditions (2010) analysis, theintersections within and adjacent to the Bill Gardner Parkway interchange were analyzed for the 2035 “No-Build” scenario, as well as freeway conditions along I-75, and ramp merge and ramp diverge conditions. As stated previously, the 2035 Build alternatives were analyzed with the assumption that Bill Gardner Parkway is widened from two (2) to four (4) lanes from the I-75southbound ramps to Strong Rock Boulevard, and from four (4) to six (6) lanes from the I-75 northbound ramps to Tanger Boulevard.
2.3.5 IDENTIFICATION OF NEEDS / DEVELOPMENT OF ALTERNATIVESBased upon the results of the future traffic operational analysis, the study team identified future deficiencies at the Bill Gardner Parkway Interchange and certain adjacent intersections. To mitigate these future deficiencies, the study team developed eight (8) preliminary alternatives that were proposed to the City of Locust Grove and GDOT. The eight (8) preliminary alternatives were then screened using the following evaluation criteria:
Driver expectancyLong term roadway capacity needsMagnitude of right-of-way impactsPotential environmental impacts
The results of the screening led to the narrowed list of three (3) recommended Build alternatives that were carried forward for more detailed analysis and further evaluation as described in more detail in Section 7.

I-75 & Bill Gardner Parkway IMR Page | 7
2.3.6 TESTING OF ALTERNATIVES / DETAILED ANALYSISFor the future 2035 No-Build scenario and three (3) Build alternatives, the freeway analysis was completed using the HCS+ software and further analyzed for queuing and general traffic flow parameters using CORSIM micro-simulation. The signalized intersections were analyzed using the Synchro micro-simulation software and the adjacent intersections were coordinated and optimized to achieve minimum delays throughout the system. The detailed analysis for the No-Build and three (3) Build alternatives included comparing operational results for each intersection. The results for each intersection turning movement were calculated for level-of-service (LOS) and delay (in seconds). As stated previously, the 2035 Build alternatives were analyzed with the assumption that Bill Gardner Parkway is widened from two (2) to four (4) lanes from the I-75 southbound ramps to Strong Rock Boulevard, and from four (4) to six (6) lanes from the I-75 northbound ramps to Tanger Boulevard. Other information obtained as part of the detailed analysis included completion of an environmental screening for each Build alternative, the approximate amount of right-of-way required for each Build alternative,estimated costs, and estimated B/C ratios.
2.3.7 DEVELOPMENT OF RECOMMENDATIONSThe final phase of the analysis involved an evaluation of the results of the detailed analysis for the future 2035 No-Build scenario and three (3) Build alternatives. The main criteria utilized for the final evaluation included the following:
Potential impacts to wetlands (acres)Cumulative operational results (LOS) for the AM and PM peak periodsTotal project costsBenefit-to-Cost (B/C) ratio
2.4 TRAFFIC ANALYSIS TOOLSThe operational analysis of the mainline segments and ramp junctions was completed using HCS+ software. The operational analysis for the study intersections was completed using Synchro 7.0. The intersection analysis results documented in this IMR are based on HCMmethodologies. Micro-simulation programs were utilized to determine vehicle hours of delay, control delay, 50th and 95th percentile queue lengths, and other operational measures of effectiveness (MOEs). The measures were calculated for the existing, future, and Build alternative roadway configurations including their associated traffic volumes.

I-75 & Bill Gardner Parkway IMR Page | 8
3. DATA COLLECTION, EXISTING CONDITIONS, AND PLANNED IMPROVEMENTS
This section presents a summary of the plans and studies reviewed for the IMR, additional data collected, and development of a summary of planned transportation projects.
3.1 SUMMARY OF DATA COLLECTED A vast array of data was collected for this study, including a review of applicable plans and studies with a potential to impact the Bill Gardner Parkway interchange with I-75. The following sections provide details of other planning and design efforts recently completely or currently underway that relate to the study area.
3.1.1 METRO ATLANTA REGIONAL FREIGHT MOBILITY PLAN (2005)In 2005, the Atlanta Regional Commission (ARC) undertook a major effort to analyze and document the major role that the Atlanta region’s freight network plays in the nation’s freight system. Therefore, a well-planned freight system with effective improvement measures is crucial to the region’s economy and quality of life. The goal of this plan is to “enhance regional economic competitiveness by providing efficient, reliable, and safe freight transportation while maintaining the quality of life in the region’s communities.” The Plan presents the following objectives in meeting this goal:
o Facilitation of an understanding of the importance of freight mobility to the region’s economy and quality of life
o Development of a dialogue between public decision makers and private sector freight stakeholders regarding freight needs and strategies
o Integration of freight considerations in the public planning processes at all levelso Identification of a regional freight transportation subsystem that is recognized as
being essential to continued regional economic growtho Development of a goods movement action plan that is data driven and stakeholder
informed
Key findings of the Plan that relate to the Bill Gardner Parkway Parkway/I-75 interchange include:
o The region is a major freight hub and its economy depends on freight mobility.o The systemic needs for current and future freight mobility in the Atlanta region were
summarized as seven (7) key issues:o System capacityo Regional approacheso Safetyo Land use conflictso Education and public awarenesso Community and environmental impacts
o Congestion and capacity limitation are the major issues affecting freight mobility in the Atlanta region.

I-75 & Bill Gardner Parkway IMR Page | 9
o The roadway system is severely congested along all major arteries in the region during the morning and evening rush periods.
o Intersections and interchanges are the chief form of congestion bottleneck affecting freight travel, according to logistics stakeholders.
o A principal recommendation of the Regional Freight Mobility Plan is the designation and development of a Regional Priority Freight Highway Network (RPFHN).
o Among the operational issues arising during plan development, the three most commonly identified by a spectrum of stakeholders were (1) the need for improved network management, (2) updated design standards to accommodate newer commercial vehicle requirements, and (3) an updated and properly signed regional truck route system.
3.1.2 VALUE-ADDED PRICING STUDY: I-75 CORRIDOR Interstate 75 (I-75) south of Downtown Atlanta is one of the region’s most congested corridors.In 2009, the Georgia State Road and Tollway Authority (SRTA) examined potential pricing strategies along the corridor from I-285 to SR 16 in Butts County. This study explores managed lanes in order to “accommodate the expected increase in travel demand, provide a corridor with guaranteed mobility, and provide a guideway for the increasingly popular commuter express bus services operating in the corridor.” The study had three primary goals:
o Evaluate various pricing options so that corridor travel is optimized and better managed
o Examine specific methods of addressing efficient freight movement along this corridor
o Identify the alternative that best makes use of the public investment
Eight different managed lanes options were studied. Of the eight, a preferred alternative was selected that consists of two express toll lanes for passenger cars each direction along I-75 from I-285 to SR 16. This was preferred because it produces the most efficient use of public funds.
3.1.3 SOUTHERN REGIONAL ACCESSIBILITY STUDY (2007)
In 2007, ARC conducted a study to analyze the future transportation and land use distribution patterns for the southern Atlanta sub-area, utilizing two evaluation scenarios. The study areagenerally included the counties in the Atlanta region located south of I-20. One scenario utilizedARC’s Mobility 2030 Plan to create a “visionary” scenario, reflecting the desires of stakeholders in the public involvement process. The second scenario was comprised of the projects from the first scenario that were the most effective in improving congestion. The results were further analyzed to determine the study recommendations. Through an analysis of the land use framework, socio-economic data, transportation context, roadway considerations, financial considerations, travel demand modeling, and public involvement, the study presentedrecommendations for the region. Both scenarios found that the I-75 corridor would experience the largest improvement. The following transportation improvements were recommended that relate to or are affected by the Bill Gardner Parkway/I-75 IMR.

I-75 & Bill Gardner Parkway IMR Page | 10
o New GRTA Express bus services on I-75o Four (4) lanes of Truck-Only Lanes on I-75 between SR 138 and SR 16o Extend four (4) lanes of high-occupancy vehicle (HOV) lanes along I-75 to SR 16o Widening of US 23/SR 42 between SR 155 and Bill Gardner Parkwayo Widening of US 23/SR 42 between Bill Gardner Parkway and Butts County
Additionally, proposed land use policies are presented to support the proposed transportation investments. The study also stated that because of financing shortfalls, alternative, non-traditional funding mechanisms would likely have to be sought. As presented in Mobility 2030,several potential funding options could include public private initiatives, tax allocation districts, community improvement districts, or a regional sales tax.
3.1.4 JOINT HENRY COUNTY/CITIES COMPREHENSIVE TRANSPORTATION PLAN
The Joint Henry County/Cities Comprehensive Transportation Plan was adopted by the Henry County Board of Commissioners in June 2007 on behalf of Henry County as well as the Cities of Locust Grove, Hampton, McDonough, and Stockbridge. This was the first joint County-Cities CTP for Henry County. This plan seeks to create a comprehensive blueprint for Henry County and its municipalities to address the area’s transportation issues and opportunities. With a horizon year of 2030, it is divided into recommendations for the short, medium, and long range future. The following recommendations presented by the CTP impact or are impacted by the Bill Gardner Parkway/I-75 IMR:
Hampton-Locust Grove Road/Bill Gardner Parkway from SR 155 to SR 42 (High PriorityProject)Bill Gardner Parkway and Tanger Boulevard Intersection Improvements (potential project identified by Plan stakeholders)
3.1.5 JOINT HENRY COUNTY/CITIES COMPREHENSIVE PLAN
Developed concurrently with the Comprehensive Transportation Plan described previously, the Henry County Board of Commissioners adopted its Joint Henry County/Cities Comprehensive Plan in 2007, which presented a vision for the future of the entirety of Henry County, including its cities. Through a process involving identifying key issues and opportunities for the County and each jurisdiction, extensive public outreach, socio-economic data analysis, and land use analysis, the Plan presented recommendations, an implementation plan, and a short-term work program for the County and Cities. Recommendations included the projects listed below, which impact or are impacted by the Bill Gardner Parkway/I-75 IMR.
Additional left turn lane from Highway 42 northbound onto Bill Gardner ParkwaySR 42 from Bethlehem Road to Bill Gardner Parkway - widen from two to four lanes SR 42 from Bill Gardner Parkway to Peeksville Road – widen from two to four lanes SR 42 from Grove Road to Tanger Boulevard - widen from two to four lanes Intersection Improvement at Tanger Boulevard and SR 42 (signalization)

I-75 & Bill Gardner Parkway IMR Page | 11
Tanger Blvd Extension from Bill Gardner Parkway north to Gardner Peach Orchard -temporary turn to SR 42 at water tank
3.1.6 CITY OF LOCUST GROVE INTERCHANGE MODIFICATION REPORT (IMR)FEASIBILITY REPORT
In 2008, the City of Locust Grove developed its IMR Feasibility Report for the Bill Gardner Parkway Interchange. The City submitted the feasibility review requesting an Interchange Modification Report (IMR) for the interchange of I-75 at Bill Gardner Parkway. This request wasapproved by the GDOT Office of Planning in March of 2009. This feasibility review gives several reasons for the need for the interchange modification:
Interchange experiences peak hour delays as a result of tremendous growth in the area that began in the late 1990s.Adjacent interchanges are also inadequate for supporting peak hour volumes.With the proposed widening project of Bill Gardner Parkway to six lanes from Lester Mill Road to the I-75 ramps, the existing lane configuration on Bill Gardner Parkway beneath I-75 is not consistent with the proposed layout. The conceptual phase of the widening project cannot be completed until interchange analysis has also been undertaken.Pending retail and commercial development in the southern part of Henry County places pressure on the existing interchange.This interchange is the proposed terminus of I-75’s HOV lane system as included in the ARC Regional Transportation Plan.
3.1.7 CITY OF LOCUST GROVE IMPACT FEE METHODOLOGY REPORT
Completed in June of 2005, this report details the process by which the City of Locust Grove collects impact fees from developers based upon the proposed development’s share of the cost for the City to provide the needed facilities and services. These fees assist in payment of the high costs of expanding public services (e.g., public safety, parks, and roads) to meet the needs of the projected growth that the development brings. The State of Georgia’s Development of Impact Fee Act (DIFA) authorizes the collection of impact fees and protects development by assuring that no more than its fair share is paid and that it does not pay double taxation. Impact fees are intended to cover capital items with a life expectancy of at least ten years, but may not be used for maintenance, supplies, personnel salaries, or other operational costs.
This study provides the methods and calculations used to determine a new development’s fair share of these investments, in order to determine an appropriate impact fee. Calculations are made according to land use category. The report provides a schedule of impact fees for each land use category per a particular unit of measurement. For example, fees for the residential land use category are given as a cost per dwelling. The fees are determined based on current socioeconomic data, population forecasts, tax digest value, forecasted tax base growth, anticipated Special Purpose Local Option Sales Tax (SPLOST) collections, current inventories of capital facilities, and proposed capital improvement projects to meet future demand.

I-75 & Bill Gardner Parkway IMR Page | 12
The Impact Fee Methodology Report also presents roadway capacity projects intended to serve new growth. Listed below are the projects identified in this report that impact or are impacted by the Bill Gardner Parkway/I-75 IMR.
Widening of Bill Gardner Parkway from two to six through lanes from Price Drive to I-75 southbound rampsWidening of Bill Gardner Parkway from four to six through lanes from I-75 southbound ramps to Tanger BoulevardWidening of Bill Gardner Parkway from four to six through lanes, Tanger Boulevard to Bill Gardner-Peeksville Connector
3.1.8 BANDY LOCUST GROVE DEVELOPMENT OF REGIONAL IMPACT, DRI NO. 1610
In 2008, the City of Locust Grove and the Georgia Regional Transportation Authority (GRTA) received a proposal for a Development of Regional Impact (DRI) located on Bill Gardner Parkway, on the south side of the roadway between I-75 and Lester Mill Road. This location is within the Bill Gardner Parkway IMR study area. The Bandy Locust Grove DRI site is 236 acresin area and is proposed to include retail uses, a hotel, single-family detached housing, and apartment units. The zoning of the eastern portion of the property is C-3 (Heavy Commercial).The western portion is proposed to change from R-A (Residential-Agricultural) to PD (Planned Development) that will include R-3 (Large Lot Residential Subdivision), RM (Multi-family), and C-3. The build-out year for this site is 2016. Recommended roadway improvements affecting the Bill Gardner IMR are listed in the Table 3.1.
Table 3-1: Bandy Locust Grove DRI Project Recommendations
Recommendations for Immediate Implementation to Meet Existing Deficiencies
Bill Gardner Pkwy. at I-75 Coordinate signals with those surrounding and optimize timing
Bill Gardner Pkwy. at Tanger Blvd
Add eastbound right turn laneCoordinate signals with those surrounding and optimize timing
Recommended for 2016 Build Out Conditions
I-75 Southbound Ramp at Bill Gardner Pkwy.
Add a third eastbound through laneAdd two additional westbound through lanesAdd eastbound right turn laneAdd free southbound right turn laneCoordinate signals with those surrounding and optimize timing

I-75 & Bill Gardner Parkway IMR Page | 13
I-75 Northbound Ramp at Bill Gardner Pkwy.
Add second eastbound turn laneAdd third eastbound through laneAdd two westbound through lanesAdd two northbound turn lanesCoordinate signals with those surrounding and optimize timing
Bill Gardner Pkwy. at Tanger Blvd.
Add eastbound through laneConvert eastbound exclusive left turn to combined left-through laneAdd eastbound right turn laneAdd westbound through laneConvert left-most westbound through lane to combined left-through laneAdd two additional left turn lanesConvert combined northbound left-through-right lane to exclusive through laneAdd northbound right turn laneCoordinate signals with those surrounding and optimize timing
Bill Gardner Pkwy. at Price Rd.
Add two eastbound and two westbound through lanes
3.1.9 STRONG ROCK DRI NO. 999 (2006)
In 2006, the Strong Rock DRI was submitted to the City and Georgia Regional Transportation Authority (GRTA) for its location west of I-75 and south of Bill Gardner Parkway. The Strong Rock development is approximately 209 acres in area and is proposed to include a private school, hospital, day care facility, assisted living facility, and offices. A new four-lane roadway is also proposed to be aligned directly across from Price Drive and extend to the south, terminating at the development’s southern property line. The build-out year for this development is 2012. Recommended roadway improvements affecting the Bill Gardner IMR are listed in the table below.
Table 3.2: Strong Rock DRI Project Recommendations
Recommendations for Immediate Implementation to Meet Existing Deficiencies
I-75 southbound ramp at Bill Gardner Pkwy.
Provide for a westbound dual left-turn movement along Bill Gardner Pkwy.Provide an eastbound right-turn bay along Bill Gardner Pkwy.Provide an additional lane on the I-75 southbound entrance rampProvide for an additional westbound travel lane (from one to two lanes)
I-75 northbound ramp at Bill Gardner Pkwy.
Provide for a northbound dual right-turn movement from I-75Provide for a westbound dual right-turn movement along Bill Gardner Pkwy.Provide for an additional lane on the I-75 northbound entrance ramp

I-75 & Bill Gardner Parkway IMR Page | 14
Recommended for 2012 Build Out ConditionsI-75 southbound ramp at Bill Gardner Pkwy.
Provide for a southbound triple left-turn movement and a dualright-turn movement
I-75 northbound ramp at Bill Gardner Pkwy.
Provide for an eastbound dual left-turn movement
3.1.10 CITY OF LOCUST GROVE LAND USE MAPS
As shown by Figure 3.1, Locust Grove’s existing land use within the project limits is primarily “Regional Commercial” with undeveloped parcels designated as “Undeveloped/Vacant”.
Figure 3.1: City of Locust Grove Existing Land Use
Source: City of Locust Grove
As shown by Figure 3.2, Locust Grove’s proposed future land use within the project limits is primarily “Regional Commercial”. The intent of the project is to relieve congestion. The project will not significantly affect land uses within the project limits.

I-75 & Bill Gardner Parkway IMR Page | 15
Figure 3.2: City of Locust Grove’s Future Land Use Map (2030)
Source: City of Locust Grove
3.1.11 ENVISION6 REGIONAL TRANSPORTATION PLAN AND FY 2008-13TRANSPORTATION IMPROVEMENT PROGRAM
As part of the Governor’s FY 2011 budget recommendations, several projects along the I-75South corridor north of the Bill Gardner Parkway interchange were included in the Prioritized Capital Construction Project List, which is required by Senate Bill 200. The entire list of recommended statewide projects (including the I-75 managed lanes projects) were recommended to be constructed using $300M in General Obligation Bonds. Through the Atlanta Regional Commission Metropolitan Planning Organization (MPO) planning process, the I-75 Managed Lanes Projects were amended to the previously adopted Long Range Transportation Plan (LRTP) called Envision6, and the corresponding FY 2008 – 2013 Transportation Improvement Program (TIP). Five (5) managed lanes projects and one (1) associated auxiliary lane project were added to the Envision6 RTP and FY 2008-2013 in Fall 2010. None of these projects are within the Bill Gardner IMR Study Area.

I-75 & Bill Gardner Parkway IMR Page | 16
3.2 TRAFFIC COUNT DATA Traffic counts provided from previous studies were too dated (more than two years old) to utilize for the Bill Gardner Parkway at I-75 IMR analysis. More recent data were required to accurately reflect existing conditions. Existing traffic volumes for the Bill Gardner IMR study were developed from multiple sources including 24-hour machine counts on the surface streets, turning movements counts (TMCs) at the intersections, and 24-hour counts using radar for the I-75 mainline. Machine counts were taken over multiple days including Thursday, Friday, Saturday, and Sunday (3/11/2010 through 3/14/2010). The TMCs were taken during weekday AM and PM peak hour conditions on 3/23/2010. Due to congestion associated with the TangerOutlet Stores, both weekday and weekend counts were collected at and adjacent to the Bill Gardner Parkway Interchange.
The radar counts for I-75 were taken over a 24-hour period during the weekday on 3/23/2010. Only a single mainline (I-75) count was taken. The study team also reviewed the GDOT Traffic Polling and Analysis System (TPAS) that presents hourly and daily volumes for the Automatic Traffic Recorders (ATRs) across the State. The two specific stations that were evaluated were ATR 151-0412 in Henry County (near Hudson Bridge Road), and ATR035-0127 in Butts County.The Bill Gardner Parkway Interchange is approximately half-way between these two ATRs.Based upon the review of this data, the ATRs show no major difference in peaking characteristics or volume from day to day; therefore, the study team did not find that additional mainline counts would have resulted in different volumes. Figure 3.1 depicts the traffic count locations for the study area.
3.3 OTHER DATA COLLECTED AND UTILIZED In addition to the plans and studies listed previously, other data relevant to the study was also collected and utilized for the IMR analyses. This data includes the following:
GDOT signal timing dataAerial photography
o Aerials of Henry County o National Agricultural Imagery (from the Georgia Department of Community Affairs)
Traffic impact study for the proposed Locust Grove Wal-MartDesign plans for Bill Gardner Parkway Widening Project (the Henry County SPLOST project)I-75 Northbound Ramp Auxiliary Lane Study

I-75 & Bill Gardner Parkway IMR Page | 17
Figure 3.3: Traffic Count Site Locations

I-75 & Bill Gardner Parkway IMR Page | 18
3.4 PLANNED TRANSPORTATION IMPROVEMENTSAs part of the review of ongoing and recently completed studies, the study team generated a list of planned transportation projects within the study area. A comprehensive list of planned transportation improvements is presented in Table 3.3. All listed planned transportation projects were considered within the study area for the Bill Gardner Parkway Interchange.
As presented in Table 3.3, the intersections of Strong Rock Parkway and Price Drive are to be realigned and a traffic signal will be installed. There are no funded capacity projects within the study area, but several projects are in the planning stages.
It should be noted that that all 2035 Build alternatives analyzed as part of this IMR assume that the City of Locust Grove/Henry County sponsored Special Purpose Local Options Sales Tax (SPLOST) Bill Gardner Parkway widened project (with some modification) is completed. The modified Bill Gardner Parkway widening project used for the 2035 Build analyses assumes thewidening from two (2) to four (4) lanes from the I-75 southbound ramps to Strong Rock Boulevard, and from four (4) to six (6) lanes from the I-75 northbound ramps to Tanger Boulevard.
Although not within the Bill Gardner Parkway IMR study area, GDOT is also planning five (5)managed lanes improvement projects and one (1) auxiliary lane project along I-75 South from Aviation Boulevard south to SR 155. The first two (2) of the five (5) managed lanes projects and the one (1) auxiliary lane project are slated to be constructed by 2012, using General Obligation (GO) Bonds. The remaining three (3) managed lanes projects are slated to be phased in by 2030. The I-75 managed lanes projects were not included as part of the IMR analysis.

I
-75
& Bi
ll G
ardn
er P
arkw
ay IM
R
P
age
| 19
Tabl
e 3.
3:Su
mm
ary
of P
lann
ed T
rans
port
atio
n Pr
ojec
ts
Proj
ect
Reco
mm
enda
tion
s: P
rogr
amm
ed P
roje
cts
ARC
/GD
OT
Proj
ect
No.
Sour
ce (N
ame
of S
tudy
/ P
lan)
Impl
emen
tati
on T
imef
ram
ePr
ojec
t St
atus
Bill
Gar
dner
Wid
enin
g fr
om S
R 15
5 to
I-75
Sou
thH
E -1
26B
ARC
; Loc
ust G
rove
Impa
ct F
ee
Met
hodo
logy
Rep
ort
Unk
now
nO
n H
old
Hen
ry C
ount
y A
RRA
Res
urfa
cing
Pro
gram
-Ta
nger
Blv
dH
E –
178
ARC
Unk
now
nU
nkno
wn
Proj
ect
Reco
mm
enda
tion
s: O
ther
Iden
tifie
d Pr
ojec
tsfr
om O
ther
Pla
nsA
RC/G
DO
T Pr
ojec
t N
o.So
urce
(Nam
e of
Stu
dy /
Pla
n)Im
plem
enta
tion
Tim
efra
me
Proj
ect
Stat
us
I-75
at C
abin
Cre
ek/B
utts
and
Bill
Gar
dner
Par
kway
/Hen
ry D
eck
Reha
bN
/AG
DO
T TR
EXU
nkno
wn
Cons
truc
tion
Aut
hori
zed
3/19
/200
7
I-75
Sou
th H
igh-
Occ
upan
cy T
oll/
Truc
k O
nly
Toll
Lane
(HO
T/TO
T)St
udy
N/A
GD
OT
TREX
Unk
now
nPl
anni
ng P
hase
Ham
pton
-Loc
ust G
rove
Roa
d/Bi
ll G
ardn
er P
arkw
ay fr
om S
R 15
5 to
SR
42N
/AH
enry
Cou
nty/
Citie
s Jo
int C
TPU
nkno
wn
Unk
now
n
I-75
Sou
thbo
und
Ram
p at
Bill
Gar
dner
Par
kway
-Tur
n M
ovem
ent a
long
Bill
Gar
dner
Pkw
y.e
righ
t-tu
rn
ay a
long
Bill
Gar
dner
Pkw
y.-7
5 s
entr
ance
ram
pw
trav
el l
one
to tw
o)
N/A
Stro
ng R
ock
DRI
Unk
now
n
I-75
Sou
thbo
und
Ram
p at
Bill
Gar
dner
Par
kway
str
iple
l-t
urn
mov
emen
t and
a d
ualr
ight
-tur
n m
ovem
ent
N/A
Stro
ng R
ock
DRI
Unk
now
n
I-75
at B
ill G
ardn
er P
kwy.
(Nor
thbo
und
and
Sout
hbou
nd R
amps
):Co
ordi
nate
sig
nals
with
thos
e su
rrou
ndin
gan
d op
timiz
e tim
ing
N/A
Band
y Lo
cust
Gro
ve D
RIRe
quir
ed to
mee
t exi
stin
g U
nkno
wn
I-75
Sou
thbo
und
Ram
p at
Bill
Gar
dner
Par
kway
thro
ugh
lane
two
addi
tiona
l th
roug
h la
nes
righ
t tur
n la
neri
ght t
urn
lane
N/A
Band
y Lo
cust
Gro
ve D
RICo
nditi
ons
(201
6)
Thro
ugh
lane
add
ition
s in
clud
ed in
-126
B)
I-75
Nor
thbo
und
Ram
p at
Bill
Gar
dner
Par
kway
nd
righ
t-tu
rn m
-75
wdu
alri
ght-
turn
mov
emen
t alo
ng B
ill G
ardn
er P
kwy.
-75
nen
tran
ce ra
mp
N/A
Stro
ng R
ock
DRI
Unk
now
n
I-75
Nor
thbo
und
Ram
p at
Bill
Gar
dner
Par
kway
edu
all
-tur
n m
ovem
ent
N/A
Stro
ng R
ock
DRI
Unk
now
n

I
-75
& Bi
ll G
ardn
er P
arkw
ay IM
R
P
age
| 20
Proj
ect
Reco
mm
enda
tion
s: O
ther
Iden
tifie
d Pr
ojec
ts fr
om O
ther
Pla
ns(c
on’t
)A
RC/G
DO
T Pr
ojec
t N
o.So
urce
(Nam
e of
Stu
dy /
Pla
n)Im
plem
enta
tion
Tim
efra
me
Proj
ect
Stat
usI-
75 N
orth
boun
d Ra
mp
atBi
ll G
ardn
er P
arkw
ay
turn
lane
thro
ugh
lane
thro
ugh
lane
stu
rn la
nes
N/A
Band
y Lo
cust
Gro
ve D
RICo
nditi
ons
(201
6)Th
roug
h la
ne a
dditi
ons
incl
uded
in
Bill
-126
B)
Bill
Gar
dner
Par
kway
at T
ange
r Bo
ulev
ard
nri
ght-
turn
ay
alo
ng T
ange
r Bo
ulev
ard
el
righ
t-tu
rn
ays
alon
g Bi
ll G
ardn
erPa
rkw
ayN
/ASt
rong
Roc
k D
RIU
nkno
wn
Bill
Gar
dner
Par
kway
at T
ange
r Bo
ulev
ard
n e
dual
right
-tur
n m
ovem
ent
wap
proa
ch to
thre
e (3
) tra
vel l
anes
wri
ght-
turn
ay
N/A
Stro
ng R
ock
DRI
Unk
now
n
Bill
Gar
dner
Par
kway
at T
ange
r Bo
ulev
ard
righ
t tur
n la
nesu
rrou
ndin
g an
d op
timiz
e tim
ing
N/A
Band
y Lo
cust
Gro
ve D
RIRe
quir
ed to
mee
t exi
stin
g
Unk
now
n
Bill
Gar
dner
Par
kway
at T
ange
r Bo
ulev
ard
thro
ugh
lane
-thr
ough
lane
righ
t tur
n la
neth
roug
h la
ne-m
ost
-thr
ough
lane
-thr
ough
-rig
ht la
ne to
exc
lusi
ve th
roug
h la
neri
ght t
urn
lane
N/A
Band
y Lo
cust
Gro
ve D
RICo
nditi
ons
(201
6)U
nkno
wn
Bill
Gar
dner
Par
kway
at
Pric
e Ro
adth
roug
h la
nes
N/A
Band
y Lo
cust
Gro
ve D
RICo
nditi
ons
(201
6)U
nkno
wn
Bill
Gar
dner
Par
kway
at
SR 4
2e
dual
righ
t-tu
rn m
ovem
ent a
long
Bill
Gar
dner
Par
kway
ndu
all
-tur
n m
ovem
ent a
long
SR
42N
/ASt
rong
Roc
k D
RIU
nkno
wn

I-75 & Bill Gardner Parkway IMR Page | 21
4. EXISTING CONDITIONS ANALYSISThe latest version of the Highway Capacity Manual (HCM 2000) and the latest version of the Highway Capacity Software (HCS+) were used to analyze the existing conditions (2010) for freeway operations, ramp merge and ramp diverge conditions.
4.1 EXISTING PEAK HOUR TRAFFIC VOLUME DEVELOPMENTA comparison was made between the weekday peak periods and the weekend peak periods to determine the highest peak period for a typical week. The difference between the weekday and weekend peak hours was minor (a difference of 4%) with weekday traffic volumes being slightly higher. This analysis was completed by totaling the peak hour approach volumes for three links surrounding the Bill Gardner interchange (the eastern, western, and northern legs) for both weekday and weekend periods. As discussed previously, counts were not collected on I-75 south of the interchange, as they were not deemed necessary. Therefore, the southern link was not included in this analysis. If the peak hour link volumes on I-75 south of Bill Gardner Parkway were included, the difference would have been even greater. It should be noted that the weekend demand was high and extended over a three to four-hour period. However, weekday peaks were slightly higher and will therefore be used for the IMR analysis. The weekday and weekend total traffic volumes are displayed in Figure 4.1.
The existing peak hour ramp volumeswere calculated by summing the relevant turning movements at each ramp terminal intersection. The mainline 24-hour tube counts were converted to annual average daily traffic (AADT) by applying daily and monthly conversion factors in accordance with GDOT standards. The traffic factors used for this study can be found in Table 4.1.
A peak hour factor (PHF) was determined for each interchange for the AM and PM peak hours as well as the mainline of I-75, which were used in the operational analysis. A driver population factor (fp) of 1.0 was used in the analysis due to the fact that the traffic stream characteristics within the study area are known to be representative.
Figure 4.1: Peak Hour Determination

I-75 & Bill Gardner Parkway IMR Page | 22
Table 4.1: Summary of Traffic Factors
Facility Daily Factor
Monthly Factor
Peak Hour Factor(PHF)
AM PM
I-75 Mainline 1.15 0.93 0.98 0.94Bill Gardner 1.01 0.97 0.86 0.93SR 155 1.01 0.97 0.91 0.93SR 16 1.01 0.97 0.91 0.91
The truck factors used in this IMR are presented in Table 4.2. Tf is the percentage of truck traffic occurring during the peak hours and T24 is the 24-hour truck percentage. Peak hour and daily truck percentages for Bill Gardner Parkway were derived from 24-hour machine counts. Peak hour truck percentages for SR 155 and SR 16 were derived from the turning movement counts (TMCs). Daily truck percentages for each SR 155, SR 16, and I-75 were obtained from Georgia’s State Traffic and Report Statistics (STARS). Peak hour truck percentage results were not available for I-75 due to the nature of the recording (radar) process.
Table 4.2: Truck Factors
FacilityPeak Truck %
Source24-Hour Truck
Percent (%)(T24)
SourceAM PM
I-75 Mainline N/A N/A N/A 14.6 TC: 0412
Bill Gardner 6.4 7.5 Machine Counts 7.5 Machine Counts
SR 155 6.5 6.7 TMCs 12 TC: 0105
SR 16 8.6 5.0 TMCs 15 TC: 0172
This analysis of the existing (2010) traffic operations was conducted using AM and PM peak hour traffic data collected in March of 2010 for the peak hour associated with each geographic area as previously discussed. Seasonal adjustment factors were applied to convert the field data to peak season volumes. Figures 4.2 and 4.3 depict the density in passenger car/mile/lane (pc/mi/ln) for freeway operations and the corresponding LOS. No weaving analysis is needed due to existing interchange spacing.

I-7
5 &
Bill
Gar
dner
Par
kway
IMR
P
age
| 23
Figu
re 4
.2: E
xist
ing
Year
201
0: B
ill G
ardn
er In
terc
hang
e Pe
ak H
our V
olum
e an
d LO
S R
esul
ts

I-7
5 &
Bill
Gar
dner
Par
kway
IMR
P
age
| 24
Figu
re 4
.3: E
xist
ing
Year
201
0 Ad
jace
nt In
terc
hang
es P
eak
Hou
r Vol
ume
and
LOS
Res
ults
I-75 & Bill Gardner Parkway IMR Page | 25
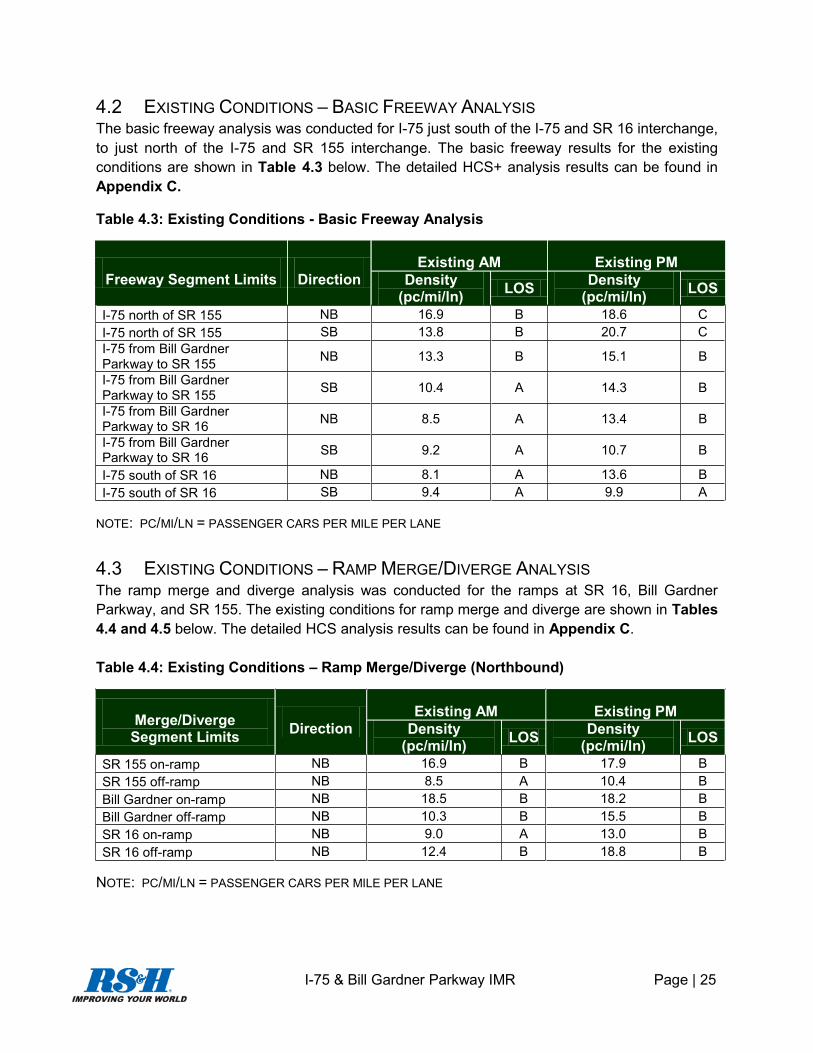
4.2 EXISTING CONDITIONS – BASIC FREEWAY ANALYSISThe basic freeway analysis was conducted for I-75 just south of the I-75 and SR 16 interchange, to just north of the I-75 and SR 155 interchange. The basic freeway results for the existing conditions are shown in Table 4.3 below. The detailed HCS+ analysis results can be found in Appendix C.
Table 4.3: Existing Conditions - Basic Freeway Analysis
Freeway Segment Limits DirectionExisting AM Existing PM
Density (pc/mi/ln) LOS Density
(pc/mi/ln) LOS
I-75 north of SR 155 NB 16.9 B 18.6 CI-75 north of SR 155 SB 13.8 B 20.7 CI-75 from Bill Gardner Parkway to SR 155 NB 13.3 B 15.1 B
I-75 from Bill Gardner Parkway to SR 155 SB 10.4 A 14.3 B
I-75 from Bill Gardner Parkway to SR 16 NB 8.5 A 13.4 B
I-75 from Bill Gardner Parkway to SR 16 SB 9.2 A 10.7 B
I-75 south of SR 16 NB 8.1 A 13.6 BI-75 south of SR 16 SB 9.4 A 9.9 A
NOTE: PC/MI/LN = PASSENGER CARS PER MILE PER LANE
4.3 EXISTING CONDITIONS – RAMP MERGE/DIVERGE ANALYSISThe ramp merge and diverge analysis was conducted for the ramps at SR 16, Bill Gardner Parkway, and SR 155. The existing conditions for ramp merge and diverge are shown in Tables4.4 and 4.5 below. The detailed HCS analysis results can be found in Appendix C.
Table 4.4: Existing Conditions – Ramp Merge/Diverge (Northbound)
Merge/Diverge Segment Limits Direction
Existing AM Existing PMDensity
(pc/mi/ln) LOS Density (pc/mi/ln) LOS
SR 155 on-ramp NB 16.9 B 17.9 BSR 155 off-ramp NB 8.5 A 10.4 BBill Gardner on-ramp NB 18.5 B 18.2 BBill Gardner off-ramp NB 10.3 B 15.5 BSR 16 on-ramp NB 9.0 A 13.0 BSR 16 off-ramp NB 12.4 B 18.8 B
NOTE: PC/MI/LN = PASSENGER CARS PER MILE PER LANE

I-75 & Bill Gardner Parkway IMR Page | 26
Table 4.5: Existing Conditions - Ramp Merge/Diverge (Southbound)
Merge/Diverge Segment Limits Direction
Existing AM Existing PMDensity
(pc/mi/ln) LOS Density (pc/mi/ln) LOS
SR 155 on-ramp SB 6.6 A 10.3 BSR 155 off-ramp SB 15.6 B 23.2 CBill Gardner on-ramp SB 10.2 B 11.4 BBill Gardner off-ramp SB 12.0 B 17.2 BSR 16 on-ramp SB 8.4 A 8.8 ASR 16 off-ramp SB 14.4 B 16.3 BNOTE: PC/MI/LN = PASSENGER CARS PER MILE PER LANE
4.4 EXISTING CONDITIONS – INTERSECTION ANALYSISThe intersection analysis was completed for the existing year 2010 using the latest Synchro micro simulation software (version 7). An operations analysis and corresponding LOS as a function of delay (seconds) was calculated for the signalized and unsignalized intersections as seen below in Table 4.6. Details relative to each intersection and any field observations relating to the LOS of the intersection are described in the following sections. The detailed intersection analysis can be found in Appendix D.
Table 4.6: Existing Conditions - Intersection Delay and LOS
IntersectionAM PM
Delay (in seconds) LOS Delay (in seconds) LOS
SR 155 SB 31.3 C 80.6 FSR 155 NB 37.7 D 12.2 B
Strong Rock Parkway 8.8 A 1.9 APrice Drive 0.2 A 0.3 AI-75 SB 24.5 C 46.0 DI-75 NB 19.2 B 14.2 BTanger Boulevard 48.7 D 82.6 F
SR 16 SB 9.3 A 8.4 ASR 16 NB 11.5 B 11.4 B
4.4.1 PRICE DRIVE/STRONG ROCK PARKWAY AND BILL GARDNERPARKWAY
The Price Drive/Strong Rock intersections are currently stop controlled intersections. Strong Rock has been constructed with sufficient turn lanes and queue storage to accommodate the planned realignment of Price Drive as part of the Strong Rock DRI.

I-75 & Bill Gardner Parkway IMR Page | 27
4.4.2 I-75 SOUTHBOUND AND BILL GARDNER PARKWAYThe I-75 southbound off ramp is the critical movement in the PM peak hour. The off-ramp currently has two left turn lanes onto Bill Gardner Parkway and a channelized (yield) right turn lane for westbound Bill Gardner Parkway traffic. The maximum queue measured in the field was approximately 25 vehicles, which did not extend onto the I-75 mainline.
4.4.3 I-75 NORTHBOUND AND BILL GARDNER PARKWAYThe I-75 northbound on-ramp is the critical movement in the AM peak hour. Bill Gardner Parkway currently has two westbound lanes. One lane is dedicated to northbound turning traffic while one lane continues west under the I-75 overpass. Although the westbound movement has a lane dedicated to the westbound to northbound movement, extensive queuing was observed in the AM peak hour.
4.4.4 TANGER BOULEVARD AND BILL GARDNER PARKWAYThe eastbound through movement is the heaviest movement during the PM peak hour. There was also a relatively heavy northbound left turn movement observed due to the presence of the Tanger Outlet Center to the south.
4.4.5 I-75 NORTHBOUND AND SR 155The I-75 northbound on-ramp is the critical movement in the AM peak hour. SR 155 was observed to be congested due to signal spacing, access spacing along the corridor, and heavy percentage of trucks.
4.4.6 I-75 SOUTHBOUND AND SR 155The I-75 southbound off-ramp is the critical movement in the PM peak hour. The off-ramp currently has one left turn lane onto SR 155. Field observations found that due to excessive queuing on SR 155, the southbound left-turning traffic often had difficulties entering the eastbound traffic stream. Closely spaced adjacent traffic signals and too many access points to businesses along the corridor contribute to excessive queuing and delays in the PM peak hours.Field observations recorded queuing extending into the mainline of I-75 in the PM peak hour.
4.4.7 I-75 NORTHBOUND AND SR 16Due to the rural setting of SR 16, minimal existing development, and existing lane geometry (four-lane with turn lanes) SR 16 experiences relatively delay free operations with substantialreserve capacity for future growth.
4.4.8 I-75 SOUTHBOUND AND SR 16Due to the rural setting of SR 16, minimal existing development, and existing lane geometry (4-lanes with turn lanes) SR 16 experiences relatively delay free operations with substantialreserve capacity for future growth.

I-75 & Bill Gardner Parkway IMR Page | 28
5. CRASH ANALYSISAccident data were obtained from the State’s Critical Analysis Reporting Environment (C.A.R.E.) crash data management system for a five year period from 2005 to 2009 for the immediate project area. Statewide data were used to compare crash rates with the project area for the year 2008.
Crashes throughout the study area were compared to “Principal Arterial, Non-Freeway, Non-NHS, Urban” roadways that have an Average Annual Daily Traffic (AADT) of 17,430 vehicles.Throughout the crash analysis years, the study area roadways experienced an Average ADT of approximately 18,000 vehicles. Figure 5.1 depicts the crash rate comparison between the Bill Gardner Parkway study area and the statewide average for similar facilities for 2008.
The interchange of I-75 at Bill Gardner Parkway from Strong Rock Parkway to Tanger Boulevard experienced 249 accidents involving forty-eight (48) injuries and no fatalities during the five year analysis period. Figure 5.2 depicts the crashes recorded within the Bill Gardner Parkway Study Area from 2005 to 2006.
For the study period (2005 to 2009), a total 249 accidents were reported with 48 injuries and no fatalities. Records indicate that 236 crashes occurred on the roadway, seven (7) crashes occurred on the shoulder, five (5) crashes occurred off of the roadway, and one (1) crash occurred in the gore area. There were 124 angle collisions, five (5) head-ons, 77 rear ends, 35 sideswipes (with 25 in the same direction and 10 in the opposite direction), and eight (8) other collision types. For a detailed tabulation of accidents at this location, see Appendix B.

I-75 & Bill Gardner Parkway IMR Page | 29
Figure 5.1: 2008 Crash Rate Comparisons
Figure 5.2: 2005 to 2009 Study Area Crashes

I-75 & Bill Gardner Parkway IMR Page | 30
6. FORECAST OF FUTURE TRAFFIC VOLUMESThe following describes the methodology used to develop existing traffic volumes and future design year (2035) traffic forecasts for the I-75 IMR.
In order to assess the future travel demand on any roadway facility, it is necessary to project future traffic volumes. There are a variety of methods used to project future traffic volumes. In urbanized areas within a Metropolitan Planning Organization (MPO), a regional travel demand model is the best resource for future traffic forecasts. The Atlanta Regional Commission (ARC) is the MPO for the study area including Henry County. Areas to the south (including Butts County) are not within the MPO area. A three-county transportation study and travel demand model was developed by GDOT for Butts, Jones, and Monroe Counties. For this study, both the ARC and the GDOT three-county model were utilized to assist with development of future traffic forecasts. The base, interim, and horizon years incorporated in each model are presented below:
GDOT three-county model (Butts, Jones, and Monroe Counties) for 2006 (base year), 2015 (interim year), and 2035 (horizon year). Adopted Envision6 ARC Model: 2010 and 2020 (interim years) and 2030 (horizon year).For both models, the Existing + Committed (E+C) network was utilized as part of the development of the future traffic forecasts. The E+C network includes the existing roads and committed projects that meet the following criteria:
o For projects within Henry County, they must be included in the ARC 2008-2013 Transportation Improvement Program (TIP) and have right-of-way or constructionphases programmed by 2011.
o For projects within Butts County, they must be included in the 2008-2011Statewide Transportation Improvement Program (STIP) and have right-of-way or construction phases programmed no later than 2011.
Figure 6.1 depicts projected annual growth rates obtained from the ARC travel demand model and the three-county model. The annual growth rates were determined by interpolating between model years.

I-75 & Bill Gardner Parkway IMR Page | 31
Figure: 6.1 : I-75 Growth Rates
As discussed in Section 3, the Strong Rock DRI has currently begun construction on its mixed-use development south of Bill Gardner Parkway and west of I-75. The existing development traffic has been captured in the 2010 traffic counts previously discussed. Similarly, it was determined that the impacts from the Bandy Locust Grove DRI would be captured in the growth rate and specific project impacts would not need to be addressed through this study.
The AM and PM peak hour traffic distribution percentages for the intersection at Bill GardnerParkway and Strong Rock Boulevard (not currently aligned) were acquired from the Strong Rock DRI Study completed in 2006. The forecasted traffic developed for this IMR, which captures the DRI growth in future phases of the development, were applied to these distributions to develop the intersection traffic volumes at the Strong Rock Boulevard intersection with Bill Gardner Parkway after the re-alignment occurs.
The traffic forecasting methodology was developed and reviewed by the GDOT and the FHWA for concurrency. The methodology was reviewed and accepted in mid-May of 2010. The methodology is as follows:
Machine counts along Bill Gardner Parkway were used to develop peak hour traffic by determining the highest total traffic demand per link and intersection approaches. Peak hours were determined to be 7:15 am to 8:15 am and 5:00 pm to 6:00 pm. The peak hours determined from these counts correspond to the same peak hours determined by the Strong

I-75 & Bill Gardner Parkway IMR Page | 32
Rock DRI, which confirms our analysis of the traffic count data collected in March 2010 for the Bill Gardner IMR. Growth rates were developed from the appropriate models for the future design year. For example, the Henry County growth rates were developed using the ARC model comparing the 2030 model volumes to the 2010 model volumes.I-75 will use an average annual growth rate of 1.57% derived from the average of the four links of the I-75 mainline within the study area.Once existing AM and PM peak hour traffic was determined, forecasted growth rates were then applied to the peak hour link volumes where available. For example, 2035 traffic volumes at the SR 155 interchange were developed by taking the 2010 traffic counts at that interchange and applying the growth rate that was developed from the 2010 to 2030 ARC model volumes for 25 years (2010 to 2035).For future turning movement volumes, the existing turning movement volumes and the future approach volumes were balanced using an iterative balancing procedure outlined in National Cooperative Highway Research Program (NCHRP) Report 255 as referenced earlier.
As previously stated, all 2035 Build alternatives analyzed as part of this IMR assume that the City of Locust Grove/Henry County sponsored Special Purpose Local Options Sales Tax (SPLOST) Bill Gardner Parkway widened project (with some modification) is completed. The modified Bill Gardner Parkway widening project used for the 2035 Build analyses assumes the widening from two (2) to four (4) lanes from the I-75 southbound ramps to Strong Rock Boulevard, and from four (4) to six (6) lanes from the I-75 northbound ramps to Tanger Boulevard.

I-75 & Bill Gardner Parkway IMR Page | 33
7. CONCEPT DEVELOPMENTNine (9) preliminary analysis alternatives were originally proposed to the City of Locust Grove and GDOT. The nine (9) preliminary alternatives were developed subsequent to evaluating the issues and needs identified through the existing conditions analysis, which is presented in Section 4 of this report. A preliminary evaluation was performed based on overall costs and potential right-of-way acquisition for each of the alternatives. The list of alternatives, anindication of costs ranging from minimal ($) to substantial ($$$$), and a preliminary estimation of right-of-way required for each alternative are shown below in Table 7.1. The alternatives marked with an asterisk (*) were selected for further detailed analysis.
Table 7.1: Interchange Alternatives
Interchange Alternative Cost Right-of-way
No-Build Diamond N/A N/A
Widen Southbound Off-Ramp(Triple Left Turn Lanes)* $$ Minimal
Diamond with Southwest Loop $$$ Moderate
Diamond with Southwest Loop and Additional Eastbound Lane $$$$ Moderate
Single Point Urban Interchange (SPUI)* $$$ Minimal
Full Clover Leaf $$$$ Substantial
Partial Clover Leaf $$$ Substantial
Diverging Diamond Interchange (DDI)* $$$ Minimal
Southbound to Eastbound Flyover $$$$ Moderate
pc/mi/ln = passenger cars per mile per lane *Selected for further evaluation
Note: Signal timing optimization was determined to be included as part of the development ofall alternatives; therefore, it was not considered as a separate one.
The studied interchange designs were based on a screening process and evaluation of a number of different types of interchanges. The evaluation criteria took into account the following items:
Driver expectancyLong term roadway capacity needsMagnitude of right-of-way impactsPotential environmental impacts

I-75 & Bill Gardner Parkway IMR Page | 34
The results of the screening process led to the detailed analysis of three design alternatives:Build Alternative 1: Single Point Urban Interchange (SPUI)Build Alternative 2: Diverging Diamond Interchange (DDI)Build Alternative 3: Triple Left-Turn Southbound Off-Ramp
It should be noted that all three Build alternatives include a recommended triple left turn movement for the I-75 southbound off-ramp to the Bill Gardner Parkway eastbound movement, as the future traffic volumes warrant this improvement. Additionally, all 2035 Build alternatives analyzed as part of this IMR assume that the City of Locust Grove/Henry County sponsored Special Purpose Local Options Sales Tax (SPLOST) Bill Gardner Parkway widened project (with some modification) is completed. The modified Bill Gardner Parkway widening project used for the 2035 Build analyses assumes the widening from two (2) to four (4) lanes from the I-75 southbound ramps to Strong Rock Boulevard, and from four (4) to six (6) lanes from the I-75northbound ramps to Tanger Boulevard.
The interchange configurations at Bill Gardner Parkway will be designed in accordance with GDOT Design Policy Manual - Rural and Suburban Undivided - New or Reconstruction Projects.The interchange ramps, loops, and bridge will be designed in accordance with the GDOT Geometric Design Standards. Due to current opportunities at the site, there is adequate right-of-way to design and build the optimal interchange solution with no design exceptions anticipated.
7.1 BUILD ALTERNATIVE 1 – SINGLE POINT URBAN INTERCHANGE (SPUI)This alternative widens the existing bridge over Bill Gardner Parkway to accommodate a single point intersection under the I-75 mainline. The ramp configurations include a triple left turn at the southbound off-ramp to eastbound Bill Gardner Parkway. The southbound on-ramp consists of two single lanes (westbound and eastbound) that merge into a dual lane ramp and finally to a single lane on ramp prior to merging onto the mainline. The northbound off-ramp consists of achannelized right turn onto Bill Gardner Parkway and a dual left-turn lane for the northbound to westbound movement. The northbound on-ramp consists of a dual through lane that merges to a single lane prior to merging with the mainline traffic.
Generally, the SPUI can be constructed within the right-of-way limits for the existing diamond interchange. It also allows more vehicles to make a turn and clear the interchange in one traffic signal cycle, can be coordinated with cross-street signal systems, and allows long, gradual turns so larger vehicles have more room to navigate the intersection. The SPUI requires a large open space for turning vehicles and thus requires a long overpass. A SPUI interchange would require the I-75 overpass to be lengthened by up to 400 feet. The SPUI is not considered a “pedestrian friendly” interchange due to the extended distance between stop bars. There are no median islands or other pedestrian refuge areas to more easily accommodate pedestrians. Figure 7.1depicts Build Alternative 1 – SPUI.

I-75 & Bill Gardner Parkway IMR Page | 35
Figure 7.1 : Build Alternative 1 – Single Point Urban Interchange (SPUI)
7.2 BUILD ALTERNATIVE 2 – DIVERGING DIAMOND INTERCHANGE (DDI)The diverging diamond interchange (DDI) or double crossover diamond (DCD) is a new interchange design that has similar aspects to the traditional diamond interchange. The main difference between the traditional diamond and the DDI is the way left and through cross-street movements maneuvers between the interchange ramps. The DDI is uniquely designed to allow left-turning movements onto arterials and limited access highways while eliminating the need for left-turn phased signals at the ramp terminals.
The alternative proposed for this study includes three lanes for the eastbound movement and two lanes to accommodate the westbound traffic. The southbound off-ramp is composed of three left-turn lanes and one channelized right-turn lane. The southbound on-ramp consists of a single lane for westbound to southbound and a single lane for eastbound to southbound I-75.The northbound off-ramp consists of a single lane which splits into a channelized lane (yield) for the northbound to eastbound and the northbound to westbound movement is composed of one lane that is signalized prior to merging with westbound traffic on Bill Gardner Parkway. The northbound on ramp consists of a single lane for eastbound to northbound and westbound to northbound which then merges into one lane prior to merging with I-75 mainline traffic.
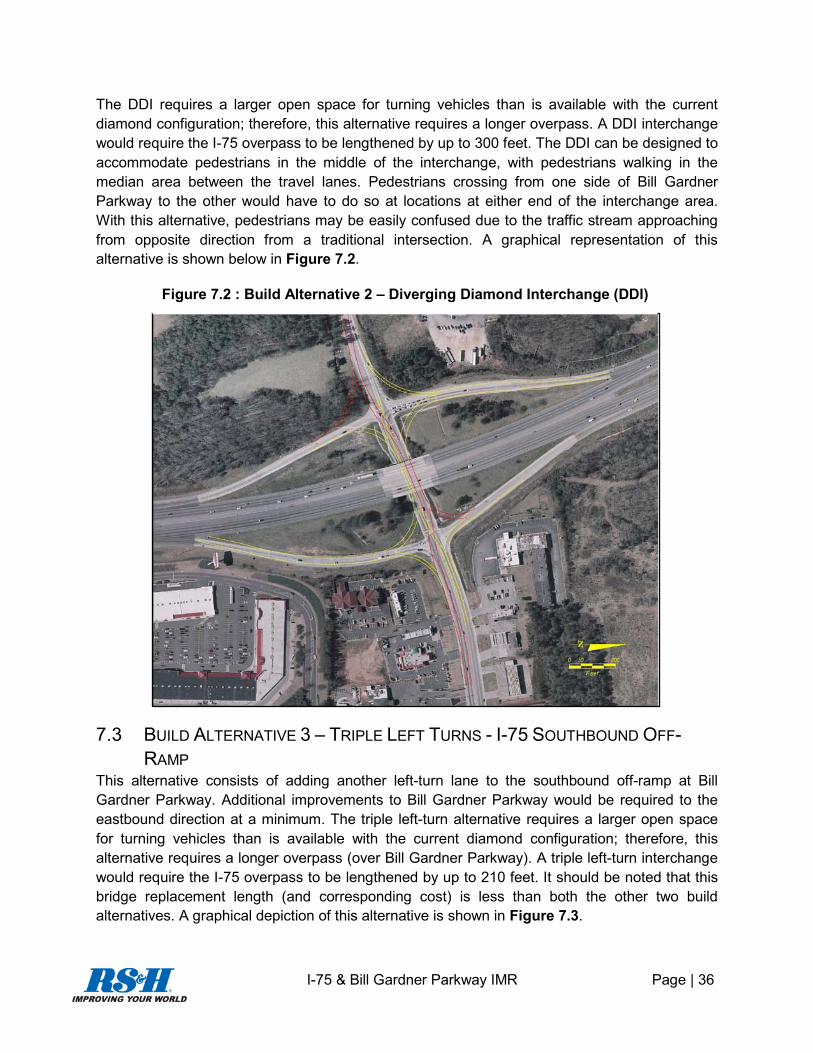
I-75 & Bill Gardner Parkway IMR Page | 36
The DDI requires a larger open space for turning vehicles than is available with the current diamond configuration; therefore, this alternative requires a longer overpass. A DDI interchange would require the I-75 overpass to be lengthened by up to 300 feet. The DDI can be designed to accommodate pedestrians in the middle of the interchange, with pedestrians walking in the median area between the travel lanes. Pedestrians crossing from one side of Bill Gardner Parkway to the other would have to do so at locations at either end of the interchange area.With this alternative, pedestrians may be easily confused due to the traffic stream approaching from opposite direction from a traditional intersection. A graphical representation of this alternative is shown below in Figure 7.2.
7.3 BUILD ALTERNATIVE 3 – TRIPLE LEFT TURNS - I-75 SOUTHBOUND OFF-RAMP
This alternative consists of adding another left-turn lane to the southbound off-ramp at Bill Gardner Parkway. Additional improvements to Bill Gardner Parkway would be required to the eastbound direction at a minimum. The triple left-turn alternative requires a larger open space for turning vehicles than is available with the current diamond configuration; therefore, this alternative requires a longer overpass (over Bill Gardner Parkway). A triple left-turn interchange would require the I-75 overpass to be lengthened by up to 210 feet. It should be noted that this bridge replacement length (and corresponding cost) is less than both the other two build alternatives. A graphical depiction of this alternative is shown in Figure 7.3.
Figure 7.2 : Build Alternative 2 – Diverging Diamond Interchange (DDI)

I-75 & Bill Gardner Parkway IMR Page | 37
The standard diamond option provides a single directional ramp for each entrance and exit movement to the freeway. Standard diamonds operate very well for the traffic volumes expected with this project and they are also the prevailing type of interchange on I-75. Therefore, astandard diamond at Bill Gardner Parkway would best satisfy driver expectancies.
The standard diamond with the additional left-turn lane to the southbound off-ramp at Bill Gardner Parkway would also work best with the proposed Henry County Special Purpose Local Option Sales Tax (SPLOST) project. This SPLOST project will include widening Bill Gardner Parkway to a six-lane facility in the immediate vicinity of the I-75 interchange.
The Standard Diamond Interchange with triple left turn lanes for the southbound off-ramp was found to:
Have the lowest environmental impacts Have the least right-of-way impactsHave the lowest construction costsSatisfy traffic volumes in the design yearProvide the most optimum walkability with provisions for pedestrian refuge and familiarity. This factor aligns with the City’s goal of enhancing pedestrian mobility and accessibility, including along Bill Gardner Parkway.
Figure 7.3: Build Alternative 3 - Triple Left Turns on I-75 Southbound Off-Ramp

I-75 & Bill Gardner Parkway IMR Page | 38
8. DESIGN YEAR 2035 ANALYSISThe design year analysis was completed using the forecasted traffic developed from the methodology previously explained. The freeway analysis was completed using the Highway Capacity Software (HCS+) and further analyzed for queuing and general traffic flow parametersusing CORSIM micro-simulation. The signalized intersections were analyzed using the Synchro micro-simulation software and the adjacent intersections were coordinated and optimized to achieve minimum delays throughout the system.
8.1 2035 NO-BUILD ANALYSISThe No-Build analysis was completed for the freeway segments, merge, and diverge areas, and the study area intersections. There are no programmed capacity improvements in the GDOT Five-Year Work Plan. The Henry County SPLOST project to widen Bill Gardner Parkway to a six-lane facility will require the lengthening of the I-75 interchange bridge. The SPLOST widening project was incorporated into the “Existing plus Committed (E+C)” analysis.
8.1.1 2035 NO-BUILD – FREEWAY ANALYSISThe 2035 freeway analysis was completed using HCS+ software and the corresponding LOS value was assigned based on density (passenger car per mile per lane). The results of the 2035 No-Build freeway analysis are seen below in Table 8.1.
Table 8.1: 2035 No-Build Freeway Analyses
Freeway Segment Limits Direction 2035 AM 2035 PMDensity (pc/mi/ln) LOS Density (pc/mi/ln) LOS
I-75 north of SR 155 NB 28.5 D 29.1 DI-75 north of SR 155 SB 21.6 C 40.4 EI-75 from Bill Gardner Parkway to SR 155 NB 21.3 C 22.2 C
I-75 from Bill Gardner Parkway to SR 155 SB 15.3 B 22.8 C
I-75 from Bill Gardner Parkway to SR 16 NB 13.1 B 18.0 C
I-75 from Bill Gardner Parkway to SR 16 SB 12.9 B 14.9 B
I-75 south of SR 16 NB 11.7 B 18.3 CI-75 south of SR 16 SB 13.1 B 13.7 B
NOTE: PC/MI/LN = PASSENGER CARS PER MILE PER LANE
8.1.2 2035 NO-BUILD – MERGE / DIVERGE ANALYSISThe 2035 No-build merge and diverge analysis was completed using HCS software and the corresponding LOS value was assigned based on density (passenger car per mile per lane).The results of the 2035 No-Build merge/diverge analysis are seen in Tables 8.2 and 8.3.

I-75 & Bill Gardner Parkway IMR Page | 39
Table 8.2: 2035 No-Build Merge/Diverge Analysis (Southbound)
Merge/Diverge Segment Limits Direction 2035 AM 2035 PM
Density (pc/mi/ln) LOS Density (pc/mi/ln) LOSSR 155 on-ramp SB 11.7 B 18.8 B
SR 155 off-ramp SB 24.5 C 37.0 FBill Gardner Parkway on-ramp SB 14.7 B 16.3 BBill Gardner Parkway off-ramp SB 18.6 B 28.3 FSR 16 on-ramp SB 12.4 B 12.7 BSR 16 off-ramp SB 18.7 B 21.3 C
NOTE: PC/MI/LN = PASSENGER CARS PER MILE PER LANE
Table 8.3: 2035 No-Build Merge/Diverge Analysis (Northbound)
Merge/Diverge Segment Limits Direction 2035 AM 2035 PM
Density (pc/mi/ln) LOS Density (pc/mi/ln) LOSSR 155 on-ramp NB 28.2 D 27.8 DSR 155 off-ramp NB 16.9 B 17.7 BBill Gardner Parkway on-ramp NB 29.3 D 27.0 CBill Gardner Parkway off-ramp NB 15.4 B 20.9 CSR 16 on-ramp NB 13.6 B 17.7 BSR 16 off-ramp NB 16.7 B 23.9 C
NOTE: PC/MI/LN = PASSENGER CARS PER MILE PER LANE
The results presented in Table 8.3 indicate two deficiencies for the merge/diverge movements associated with the Bill Gardner Interchange off-ramp at Bill Gardner Parkway for the 2035 no-Build (southbound) scenario. The second is at the I-75 southbound off-ramp at SR 155. The study team determined that SR 155 likely will need to be widened with possible improvements at the SR 155/I-75 interchange. Specific lane improvements are undetermined at this point.
8.1.3 2035 NO-BUILD – INTERSECTION ANALYSISThe 2035 No-Build intersection analysis was completed using the Synchro micro-simulation software and the corresponding LOS value was assigned based on vehicle delay (seconds).The results of the 2035 No-Build intersection analysis are seen in Table 8.4. Figure 8.1illustrates the 2035 No Build Peak Hour Volumes and Level of Service (LOS) for the Bill Gardner Interchange and Figure 8.2 shows the same information for the adjacent interchanges.

I-75 & Bill Gardner Parkway IMR Page | 40
Table 8.4: 2035 No-Build Intersection Analyses
AM PM
IntersectionDelay
(seconds) LOSDelay
(seconds) LOSSR 155 / I-75 southbound off-ramp 195.4 F 176.2 FSR 155 / I-75 northbound on-ramp 260.3 F 115.3 F
Bill Gardner Parkway/Strong RockParkway/Price Drive 148.3 F 36.6 CBill Gardner Parkway/I-75 southbound off-ramp 44.2 D 397.9 FBill Gardner Parkway/I-75 northbound on-ramp 134.7 F 214.1 FBill Gardner Parkway/Tanger Boulevard 97.9 F 333.2 F
SR 16 / I-75 southbound off-ramp 11.8 B 12.6 BSR 16 / I-75 northbound on-ramp 11.9 B 10.0 B
NOTE: PC/MI/LN = PASSENGER CARS PER MILE PER LANE
For the 2035 No-build scenario, several operational deficiencies have been identified at intersections within the study area. The following intersections with LOS of F will require some level of operational improvement by year 2035.
SR 155/I-75 southbound off-ramp (AM and PM peak periods)SR 155/I-75 northbound on-ramp (AM and PM peak periods)Bill Gardner Parkway/Strong Rock Parkway/Price Drive (AM peak period)Bill Gardner Parkway/I-75 southbound off-ramp (PM peak period)Bill Gardner Parkway/I-75 northbound on-ramp (AM and PM peak periods)Bill Gardner Parkway/Tanger Boulevard (AM and PM peak periods)
Specific recommendations for transportation improvements at these intersections are discussed in Section 11 of this report.
8.1.4 2035 NO-BUILD – COST ESTIMATESThe future No-build alternative has no capacity improvements associated with it and thus there are no costs associated with this alternative.

I-7
5 &
Bill
Gar
dner
Par
kway
IMR
Pag
e | 4
1
Figu
re 8
.1: F
utur
e 20
35 N
o B
uild
Pea
k H
our V
olum
e an
d LO
S R
esul
ts (B
ill G
ardn
er In
terc
hang
e)

I-7
5 &
Bill
Gar
dner
Par
kway
IMR
Pag
e | 4
2
Figu
re 8
.2: F
utur
e 20
35 N
o B
uild
Pea
k H
our V
olum
e an
d LO
S R
esul
ts (A
djac
ent I
nter
chan
ges)

I-75 & Bill Gardner Parkway IMR Page | 43
8.2 2035 BUILD ALTERNATIVE FREEWAY ANALYSIS
8.2.1 2035 FREEWAY ANALYSISThe freeway segment analysis was conducted along Interstate 75 before and after merge and diverge areas within the project limits. There were no improvements recommended for the I-75main line, thus the below results apply for all Build Alternatives. The resulting LOS for the Build Alternatives is shown below in Table 8.5.
Table 8.5: 2035 Build Scenario - Basic Freeway Analysis
Freeway Segment Limits Direction
2035 AM 2035 PMDensity
(pc/mi/ln) LOS Density (pc/mi/ln) LOS
I-75 north of SR 155 NB 28.5 D 29.1 DI-75 north of SR 155 SB 21.6 C 40.4 EI-75 from Bill Gardner Parkway to SR 155 NB 21.3 C 22.2 C
I-75 from Bill Gardner Parkway to SR 155 SB 15.3 B 22.8 C
I-75 from Bill Gardner Parkway to SR 16 NB 13.1 B 18.0 C
I-75 from Bill Gardner Parkway to SR 16 SB 12.9 B 14.9 B
I-75 south of SR 16 NB 11.7 B 18.3 CI-75 south of SR 16 SB 13.1 B 13.7 B
NOTE: PC/MI/LN = PASSENGER CARS PER MILE PER LANE
8.2.2 2035 MERGE / DIVERGE ANALYSISThe Build scenario for the merge and diverge analysis was yielded the same improvements for all Build Alternatives. Table 8.6 depicts the density in passenger cars per mile per lane and LOS for each of the merge/diverge locations throughout the study area.
Table 8.6 : 2035 Build Scenario - Merge/Diverge Analysis (Southbound)
Merge/Diverge Segment Limits Direction
2035 AM 2035 PMDensity
(pc/mi/ln) LOS Density (pc/mi/ln) LOS
SR 155 On-Ramp SB 11.7 B 18.8 BSR 155 Off-Ramp SB 24.5 C 37.0 FBill Gardner On-Ramp SB 14.7 B 16.3 BBill Gardner Off-Ramp* SB 1.3 A 5.2 ASR 16 On-Ramp SB 12.4 B 12.7 BSR 16 Off-Ramp SB 18.7 B 21.3 C
*Bill Gardner southbound off-ramp has been improved with a 2,000’ deceleration lane and a two-lane off-ramp.
NOTE: PC/MI/LN = PASSENGER CARS PER MILE PER LANE

I-75 & Bill Gardner Parkway IMR Page | 44
As presented in Table 8.6, the 2035 Build scenario with improvements at the Bill Gardner interchange show an improvement in LOS at the southbound Bill Gardner Parkway off-ramp, which goes from LOS F to LOS B for the Build scenario. No improvement in LOS is expected at the other interchanges within the study area for the Build scenario versus that of the No Build scenario.
Table 8.7: 2035 Build Merge/Diverge Analysis (Northbound)
Merge/Diverge Segment Limits Direction
2035 AM 2035 PMDensity
(pc/mi/ln) LOS Density (pc/mi/ln) LOS
SR 155 on-ramp NB 28.2 D 27.8 DSR 155 off-ramp NB 16.9 B 17.7 BBill Gardner on-ramp NB 29.3 D 27.0 CBill Gardner off-ramp NB 15.4 B 20.9 CSR 16 on-ramp NB 13.6 B 17.7 BSR 16 off-ramp NB 16.7 B 23.9 CNOTE: PC/MI/LN = PASSENGER CARS PER MILE PER LANE
As presented in Table 8.7, the operational results of merge/diverge analysis for northbound I-75for the Build scenario do not show a change from that of the No Build scenario. This is due to the fact that the deficient movements within the study area are primarily located at the southbound off-ramps for the I-75 interchanges of SR 155 and Bill Gardner Parkway.
8.3 BUILD ALTERNATIVE 1 – SINGLE POINT URBAN INTERCHANGE (SPUI)
8.3.1 BUILD ALTERNATIVE 1 – INTERSECTION ANALYSIS
The intersection analysis was completed using Synchro 7 software. Lane geometry at the adjacent intersections was kept consistent for each of the Build Alternatives. Synchro software was used to optimize the signal timing and offsets throughout the system to minimize the delay and achieve the optimal LOS. As noted previously, the analysis for all three (3) Build Alternatives assumes that the City of Locust Grove/Henry County sponsored Special Purpose Local Options Sales Tax (SPLOST) Bill Gardner Parkway widened project (with some modification) is completed. The modified Bill Gardner Parkway widening project used for the 2035 Build analyses assumes the widening from two (2) to four (4) lanes from the I-75southbound ramps to Strong Rock Boulevard, and from four (4) to six (6) lanes from the I-75 northbound ramps to Tanger Boulevard. Table 8.8 depicts the delay and LOS for Build Alternative 1.

I-75 & Bill Gardner Parkway IMR Page | 45
Table 8.8: Build Alternative 1 - Intersection LOS for Single Point Urban Interchange AM PM
IntersectionDelay
(seconds) LOSDelay
(seconds) LOSSR 155 / I-75 SB Off-Ramp 195.4 F 176.2 FSR 155 / I-75 NB On-Ramp 260.3 F 115.3 F
Bill Gardner Parkway / Strong Rock / Price Dr. 44.5 D 18.5 BBill Gardner Parkway / I-75 SB Off-Ramp* 33.8 C 45.0 DBill Gardner Parkway / Tanger Boulevard 60.7 D 78.9 E
SR 16 / I-75 SB Off-Ramp 11.8 B 12.6 BSR 16 / I-75 NB On-Ramp 11.9 B 10.0 B
*Bill Gardner southbound off-ramp has been improved with a 2,000’ deceleration lane and a two-lane off-ramp.
As presented in Table 8.8, traffic operations in year 2035 would greatly improve with the construction of the SPUI at the Bill Gardner Parkway Interchange compared to the 2035 No Build scenario. Specifically, traffic operations at the following intersections improve with the implementation of SPUI by 2035:
Bill Gardner Parkway/Strong Rock Parkway/Price Drive (both AM and PM peak periods)Bill Gardner Parkway/I-75 southbound off-ramp (both AM and PM peak periods)Bill Gardner Parkway/Tanger Boulevard
It should be noted that the implementation of the SPUI at the Bill Gardner Parkway interchangeis not projected to have any impact on traffic operations at the adjacent two interchanges (I-75at SR 155 or I-75 at SR 16).
8.3.2 BUILD ALTERNATIVE 1 – PLANNING LEVEL COST ESTIMATES - SPUIAlternative 1 will require the longest bridge lengthening to span the intersection of the northbound and southbound I-75 ramps and Bill Gardner Parkway of the three Build Alternatives. A desktop review of the parcel boundaries provided by the Henry County Assessor’s Office shows that the SPUI alternative can be constructed without any additional right-of-of way requirements. The total cost for the SPUI is estimated at $47 million and can be seen in Table 8.9.

I-75 & Bill Gardner Parkway IMR Page | 46
Table 8.9: Build Alternative 1 - Planning Level Cost Estimate - SPUI
Alternative 1Unit Cost
(in millions) QuantityCost
(in millions)
Traffic SignalizationLump sum $ 0.250 1 $ 0.250
Bridge Replacement (removal & replacement)
Square foot $ 0.250 52,800 $ 13.200
Add 600' Turn-laneLump sum $ 0.500 1 $ 0.500
New Construction(lane miles) Miles $ 18.00 0.426 $ 7.668
Drainage ImprovementsLump sum $ 0.500 1 $ 0.500
Estimated Construction Cost $ 22.118Mobilization (10%) $ 2.210Maintenance of Traffic $ 4.420Subtotal $ 28.748Contingency (25%) $ 7.187Total Construction Cost $ 35.935PE Design (15%) $ 5.390Construction Engineering Inspection (15%) $ 5.390Total Project Cost $ 46.715
The costs in Table 8.9 were derived from the GDOT Item Mean Summary from 01/2009 to 12/2009 and dated January 11, 2010. The bridge removal and replacement was estimated at $250 per square foot. The new bridge for Alternative 1 was estimated to be 132 feet wide by 400 feet long. An estimate of new lanes for the construction of this alternative yielded 0.426 lane-miles of new construction. A new lane-mile of construction was estimated at $18 million.
A benefit-to-cost (B/C) ratio has been calculated using the cost of improvements and delay experienced at the Bill Gardner Parkway and I-75 ramps intersection. Build Alternative 1improves delay from 397.9 seconds to 45.0 seconds for the critical southbound left movement, a savings of 352.9 seconds for the nearly $ 47 million cost. The B/C ratio is calculated to be 0.39.
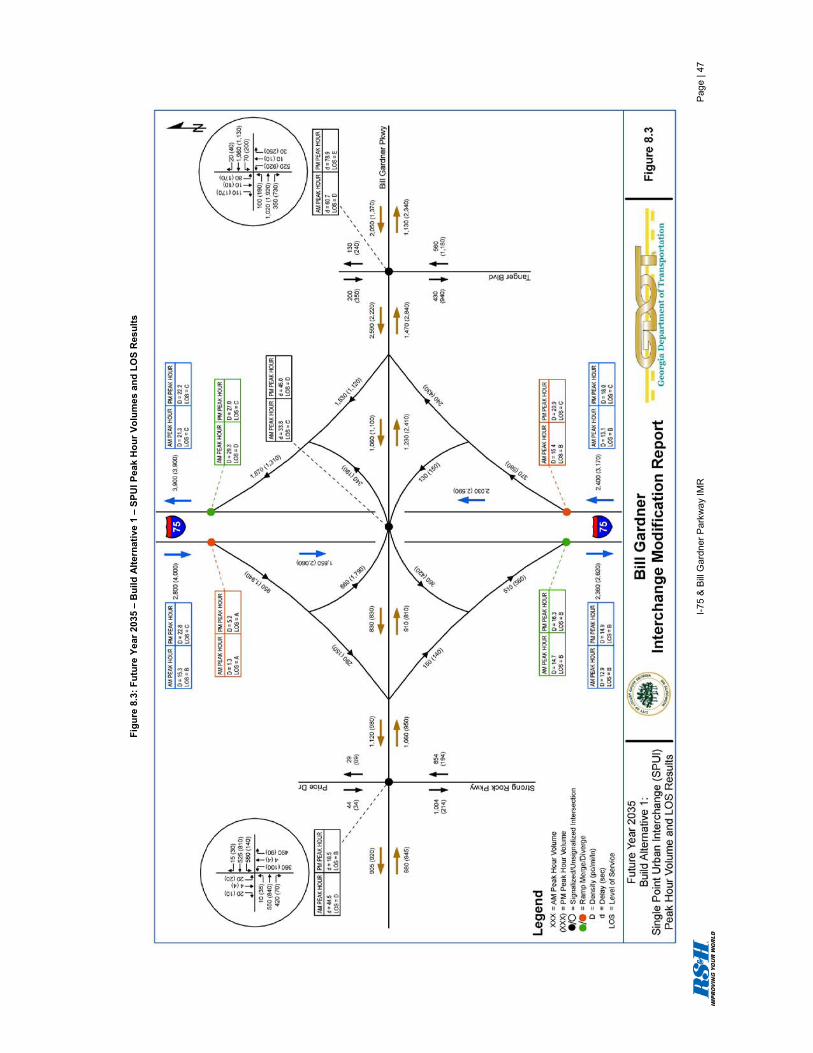
I-7
5 &
Bill
Gar
dner
Par
kway
IMR
Pag
e | 4
7
Figu
re 8
.3: F
utur
e Ye
ar 2
035
–B
uild
Alte
rnat
ive
1 –
SPU
I Pea
k H
our V
olum
es a
nd L
OS
Res
ults

I-75 & Bill Gardner Parkway IMR Page | 48
8.4 BUILD ALTERNATIVE 2 – DIVERGING DIAMOND INTERCHANGE (DDI)
8.4.1 BUILD ALTERNATIVE 2 – INTERSECTION ANALYSIS – DDIThe diverging diamond interchange was analyzed using the latest Synchro 7 software. Four signals are required to safely operate the DDI, the critical intersection for the AM and PM peak hours are shown in Table 8.10 below.
Table 8.10: Build Alternative 2 – Intersection Level of Service - DDI
AM PMDelay
(seconds) LOSDelay
(seconds) LOSSR 155 / I-75 southbound off-ramp 195.4 F 176.2 FSR 155 / I-75 northbound on-ramp 260.3 F 115.3 F
Bill Gardner Parkway/Strong RockParkway/Price Drive 37.4 D 25.3 CBill Gardner Parkway/I-75 westbound approach 10.7 B 8.2 ABill Gardner Parkway/I-75 southbound off-ramp* 16.6 B 17.8 BBill Gardner Parkway/I-75 northbound on-ramp 19.6 A 9.9 ABill Gardner Parkway/I-75 eastbound approach 72.9 E 39.3 CBill Gardner Parkway/Tanger Boulevard 50.3 D 78.5 E
SR 16 / I-75 southbound off-ramp 11.8 B 12.6 BSR 16 / I-75 northbound on-ramp 11.9 B 10.0 B
*Bill Gardner southbound off-ramp has been improved with a 2,000’ declaration lane and a two-lane off-ramp.
As presented in Table 8.10, traffic operations in year 2035 would greatly improve with the construction of the DDI at the Bill Gardner Parkway Interchange compared to the 2035 No Build scenario. Specifically, traffic operations at the following intersections improve with the implementation of the DDI by 2035:
Bill Gardner Parkway/Strong Rock Parkway/Price Drive (AM peak period)Bill Gardner Parkway/I-75 southbound off-ramp (both AM and PM peak periods)Bill Gardner Parkway/I-75 northbound on-ramp (both AM and PM peak periods)Bill Gardner Parkway/Tanger Boulevard (both AM and PM peak periods)
It should be noted that the implementation of the DDI at the Bill Gardner Parkway interchange is not projected to have any impact on traffic operations at the adjacent two interchanges (I-75 at SR 155 or I-75 at SR 16).

I-75 & Bill Gardner Parkway IMR Page | 49
8.4.2 BUILD ALTERNATIVE 2 – DDI: PLANNING LEVEL COST ESTIMATESThe diverging diamond will require approximately 0.121 lane-miles of roadway. This Alternative will require a bridge length of at least 300 feet due the required separation of through traffic.
A desktop review of the parcel boundaries provided by the Henry County Assessor’sOffice shows that the Diverging Diamond alternative will require approximately 0.3 acre of additional of right-of-way in the southwest quadrant of the interchange and approximately 0.2 acre of additional right-of-way in the northwest quadrant. Figure 8.4 shows the right-of-way required based on lane lines. Table 8.11 depicts the cost of Build Alternative 2 with a total cost of nearly $33 million.
A benefit-to-cost (B/C) ratio has been calculated using the cost of improvements and delay experienced at the Bill Gardner Parkway and I-75 ramps intersection. Build Alternative 2 improves delay from 397.9 seconds to 17.8 seconds for the critical southbound left movement, a savings of 380.1 seconds for the nearly $ 33 million. The B/C is calculated to be 0.61.
Figure 8.4: Right-of-Way Requirements – Diverging Diamond Interchange
I-75 & Bill Gardner Parkway IMR Page | 50
Table 8.11: Build Alternative 2 - Planning Level Cost Estimate - DDI
Alternative 2
Unit Cost(in millions) Quantity
Cost(in millions)
Traffic SignalizationLump sum $ 0.250 4 $ 1.000
Bridge Replacement (removal & replacement)
Squarefoot $ 0.250 39,600 $ 9.900
Add 600' Turn-lanelump sum $ 0.500 1 $ 0.500
New Construction (lane miles) miles $ 18.000 0.121 $ 2.178
Drainage Improvementslump sum $ 0.500 1 $ 0.500
Estimated Construction Cost $ 14.078Mobilization (10%) $ 1.410Maintenance of Traffic $ 4.230
Right-of-WaySquare
foot $ 16.57 21,780 $ 0.361Subtotal $ 20.079Contingency (25%) $ 5.020Total Construction Cost $ 25.099PE Design (15%) $ 3.760Construction Engineering Inspection (15%) $ 3.760Total Project Cost $ 32.619
The costs in Table 8.11 on the previous page were derived from the GDOT Item Mean Summary from 01/2009 to 12/2009 and dated January 11, 2010. The bridge removal and replacement was estimated at $250.00 per square foot. The new bridge for Alternative 2 was estimated to be 132 feet wide by 300 feet long. An estimate of new lanes for the construction of this alternative yielded 0.121 lane-miles of new construction. A new lane-mile of construction was estimated at $18 million.

I-7
5 &
Bill
Gar
dner
Par
kway
IMR
Page
| 51
Figu
re 8
.5: F
utur
e Ye
ar 2
035
–B
uild
Alte
rnat
ive
2 –
DD
I Pea
k H
our V
olum
es a
nd L
OS
Res
ults

I-75 & Bill Gardner Parkway IMR Page | 52
8.5 BUILD ALTERNATIVE 3 – TRIPLE LEFT (SB OFF-RAMP AT BILL GARDNER)
8.5.1 BUILD ALTERNATIVE 3 – TRIPLE LEFT: INTERSECTION ANALYSISThe traditional diamond interchange was analyzed using the latest Synchro 7 software. The improvements to the intersection of Bill Gardner Parkway and the I-75 SB Off-ramp enable the Bill Gardner Parkway / I-75 NB On-Ramp intersection to operate at an LOS E for the AM, northbound, and the Bill Gardner Parkway/I-75 SB Off-Ramp intersection to operate at LOS E for the PM. Table 8.12 shows the LOS and delay calculated for each intersection within the Study Area.
Table 8.12: Build Alternative 3 - Intersection LOS – Triple Left Southbound Off-Ramp
AM PM
IntersectionDelay
(seconds) LOSDelay
(seconds) LOSSR 155/I-75 southbound off-ramp 195.4 F 176.2 FSR 155 / I-75 northbound on-ramp 260.3 F 115.3 F
Bill Gardner Parkway/Strong Rock Parkway/Price Drive 32.8 C 27.8 CBill Gardner Parkway /I-75 southbound off-ramp* 29.9 C 74.3 EBill Gardner Parkway / I-75 northbound on-ramp* 58.3 E 42.6 DBill Gardner Parkway/Tanger Boulevard 48.2 D 77.6 E
SR 16/I-75 southbound off-ramp 11.8 B 12.6 BSR 16/I-75 northbound on-ramp 11.9 B 10.0 B
*Bill Gardner southbound off-ramp has been improved with a 2,000’ deceleration lane and a two-lane off-ramp
As presented in Table 8.12, traffic operations in year 2035 would greatly improve with the construction of the triple left turn at the southbound I-75 off-ramp intersection with Bill Gardner Parkway, compared to the 2035 No Build scenario. Specifically, traffic operations at the following intersections improve with the implementation of the I-75 southbound triple-left turn by 2035:
Bill Gardner Parkway/Strong Rock Parkway/Price Drive (AM peak period)Bill Gardner Parkway/I-75 southbound off-ramp (both AM and PM peak periods)Bill Gardner Parkway/I-75 northbound on-ramp (both AM and PM peak periods)Bill Gardner Parkway/Tanger Boulevard (both AM and PM peak periods)
It should be noted that the implementation of the I-75 southbound triple-left turn at the intersection with the Bill Gardner Parkway Interchange is not projected to have any impact on

I-75 & Bill Gardner Parkway IMR Page | 53
traffic operations at the adjacent two interchanges at I-75 at SR 155, north of Bill Gardner Parkway or at I-75 and SR 16, south of Bill Gardner Parkway.
8.5.2 BUILD ALTERNATIVE 3 – PLANNING LEVEL COST ESTIMATES – TRIPLE LEFT TURNSThe traditional diamond interchange with three left turn lanes, each with 600 feet of storage length would require 0.121 miles of new roadway. This alternative will require the least amount of modification to the overpass with a necessary length of 210 feet. A desktop review of the parcel boundaries provided by the Henry County Assessor’s Office shows that the Triple Left Turn Alternative can be constructed without any additional right-of-of way requirements. Table8.13 depicts the estimated cost for improvements related to Build Alternative 3.
The existing Bill Gardner at I-75 interchange configuration (standard diamond) with the addition of a third left-turn lane to the southbound off ramp at Bill Gardner Parkway would also work best with the proposed widening of Bill Gardner Parkway by Henry County, using SPLOST funds.The project involves widening Bill Gardner Parkway to a six-lane facility in the immediate vicinity of the I-75 interchange. The combination of the widening project and the addition of the third left-turn lane would be the best option of all three Build alternatives that were evaluated.
Figure 8.6 illustrates the peak hour volumes and LOS for the 2035 Build Alternative 3 – Triple Left Turns on Southbound Off-Ramp.

I-75 & Bill Gardner Parkway IMR Page | 54
Table 8.13: Build Alternative 3 - Planning Level Cost Estimate – Triple Left Turns
Alternative 3Unit Cost
(in millions) QuantityCost
(in millions)
Traffic SignalizationLump sum $ 0.250 2 $ 0.500
Bridge Replacement (removal & replacement)
squarefoot $ 250.00 27,720 $ 6.930
Add 600' Turn-laneLump sum $ 0.500 1 $ 0.500
New Construction (lane miles) Miles $ 18.000 $ -
Drainage ImprovementsLump sum $ 0.500 1 $ 0.500
Estimated Construction Cost $ 8.430Mobilization (10%) $ 0.843Maintenance of Traffic $ 0.843Subtotal $ 10.100Contingency (25%) $ 2.525Total Construction Cost $ 12.625PE Design (15%) $ 1.894Construction Engineering Inspection (15%) $ 1.894Total Project Cost $ 16.413
The costs in Table 8.13 were derived from the GDOT Item Mean Summary from 01/2009 to 12/2009 and dated January 11, 2010. The bridge removal and replacement was estimated at $250.00 per square foot. The new bridge for Alternative 3 was estimated to be 132 feet wide by 210 feet long.
The benefit-to-cost (B/C) ratio has been calculated using the cost of improvements and delay experienced at the Bill Gardner Parkway and I-75 ramps intersection. Build Alternative 3 is the lowest cost alternative and improves delay from 397.9 seconds to 74.3 seconds for the AM critical northbound right movement. This represents a savings of 323.6 seconds of delay for the nearly $ 17 million cost, yielding a B/C ratio of 1.0.

I
-75
&Bi
ll G
ardn
er P
arkw
ay IM
R
Pag
e | 5
5
Figu
re 8
.6: Y
ear 2
035
Bui
ld A
ltern
ativ
e 3
–Tr
iple
Lef
t Tur
ns o
n So
uthb
ound
Off-
Ram
p -P
eak
Hou
r Vol
ume
and
LOS
Res
ults

I-75 & Bill Gardner Parkway IMR Page | 56
8.6 SUMMARY OF OPERATIONS ANALYSISTable 8.14 depicts the critical link analysis for the operations of each of the Build Alternatives.All three Build Alternatives function at an acceptable level of service for both the AM and PM peak hours. Based on right-of-way costs and construction costs, Build Alternative 3, the Triple Left Turns on the Southbound Off-Ramp has the fewest impacts and lowest construction cost.The motoring public would experience far less delay and a better operating roadway than compared with the No-Build Alternative.
Table 8.14: Summary of Operations Analysis
Scenario
Delay (seconds)
(AM / PM)
LOS
(AM / PM)
Northbound Southbound Northbound Southbound
No-Build 134.7 / 214.1 44.2 / 397.9 F / F D / FBuild Alternative 1 –Single Point Urban Interchange
33.8 / 45.0 C / D
Build Alternative 2 –Diverging Diamond Interchange
72.9 / 39.3 16.6 / 17.8 E / C B / B
Build Alternative 3 –Triple Left Turns on Southbound Off-Ramp
58.3 / 42.6 29.9 / 74.3 E / D C / E
As noted previously, the analysis for all three (3) Build Alternatives assumes that the City of Locust Grove/Henry County sponsored Special Purpose Local Options Sales Tax (SPLOST) Bill Gardner Parkway widened project (with some modification) is completed. The modified Bill Gardner Parkway widening project used for the 2035 Build analyses assumes the widening from two (2) to four (4) lanes from the I-75 southbound ramps to Strong Rock Boulevard, and from four (4) to six (6) lanes from the I-75 northbound ramps to Tanger Boulevard.

I-75 & Bill Gardner Parkway IMR Page | 57
9. ENVIRONMENTAL SCREENINGThe National Environmental Policy Act (NEPA) requires federal agencies to integrate environmental values into their decision making processes by considering the environmental impacts of their proposed actions and reasonable alternatives to those actions. The following section will review resources covered under NEPA such as potential wetlands, floodplains, threatened and endangered species, and community issues such as land use.
9.1 POTENTIAL WETLANDSExecutive Order 11990 entitled “Protection of Wetlands”, dated May 24, 1977, requires federal agencies to take action to avoid adversely impacting wetlands wherever possible, to minimize wetlands destruction and to preserve the values of wetlands, and to prescribe procedures to implement the policies and procedures of this Executive Order.
The project area was evaluated on-site in July 2010 by a qualified environmental scientist.Within the project, area two potential wetlands were evaluated (Potential Wetland 1 and Potential Wetland 2). Potential Wetland 1 is located in the northwest quadrant of the interchange and Potential Wetland 2 is located in the southwest quadrant of the interchange.Figure 9.1 shows the location of the two potential wetlands within the project limits. These two potential wetlands are a minor tributary of Indian Branch separated by a box culvert under Bill Gardner Parkway. Potential Wetland 1 and potential Wetland 2 can by classified by Cowardin’s Wetland and Deepwater Habitat (Cowardin et al. 1979) as PFO1C (palustrine, forested, broad-leaved deciduous, seasonally flooded). During the field visit in July 2010, flowing water was evident in the channelized portions of the potential wetland.
Alternative 1 (SPUI) is not anticipated to impact the potential wetlands. As shown in Figure 9.1,it is estimated that Alternative 2 (DDI) will require approximately 0.10 acre of fill in Potential Wetland 1 and 0.05 acre of fill in Potential Wetland 2. Alternative 3 (Triple Left Turns on Southbound Off-Ramp) is not anticipated to impact the potential wetlands. Due to the small amount of potential wetlands within the project limits, impacts to the potentials wetlands are anticipated to be minor. Section 404 of the Clean Water Act regulates the discharge of dredged, excavated, or fill material in wetlands, streams, rivers, and other U.S. waters. The U.S. Army Corps of Engineers is the federal agency authorized to issue Section 404 Permits for certain activities conducted in wetlands or other U.S. waters.

I-75 & Bill Gardner Parkway IMR Page | 58
Figure 9.1 – Potential Wetlands
9.2 FLOODPLAINSExecutive Order 11988 entitled “Floodplain Management” dated May 24, 1977, requires federal agencies to evaluate the potential effects of actions it may take in a floodplain to (1) avoid adversely impacting floodplains wherever possible, (2) to ensure that its planning programs and budget requests reflect consideration of flood hazards and floodplain management, including the restoration and preservation of such land areas as natural undeveloped floodplains, and to(3) prescribe procedures to implement the policies and procedures of this Executive Order.
A review of the Federal Emergency Management Agency (FEMA) Digital Flood Insurance Rate Maps (DFIRM) 13255C0100D and 13255C01125D shows that there are no floodplains within the project limits and therefore, none of the build alternatives will impact floodplains. The FEMA map for the project area is depicted in Figure 9.2.

I-75 & Bill Gardner Parkway IMR Page | 59
Figure 9.2 – FEMA Flood Zones
Source: Federal Emergency Management Agency (FEMA) Digital Flood Insurance Rate Maps (DFIRM) 13255C0100D and 13255C01125D
9.3 THREATENED AND ENDANGERED SPECIESThe project was evaluated for potential impacts to threatened and endangered plant and animal species in accordance with 50 CFR 402.12; Section 7(c) of the Endangered Species Act of 1973.
The U.S. Fish and Wildlife Service (USFWS) lists three species which have the potential for occurrence in the project area. The official species list is attached in Appendix K. Table 9.1 lists these species. None of these species were observed during field reviews in July 2010.
The project study area was also evaluated for the occurrence of listed species in Critical Habitatdesignated by Congress in 17 CFR 35.1532. Critical Habitat has not been designated for any of the species listed on Table 9.1. No designated Critical Habitat for any federally listed species occurs within the project study area. Based on the information presented, no impacts to state and federally listed species are anticipated as a result of the proposed project improvements.

I-75 & Bill Gardner Parkway IMR Page | 60
Table 9.1: Listed Species in Henry County
Species Status Critical Habitat Designated?
Ferns and AlliesBlack Spored Quillwort(Isoetes mellanospora)
Endangered No
Flowering PlantsLittle amphianthus(Amphianthus pusillus)
Threatened No
Michaux’s sumac (Rhus michauxii)
Endangered No
Source: U.S. Fish and Wildlife Service and State of Georgia
9.4 COMMUNITY ISSUESThe predominant land-use surrounding the project corridor is commercial properties, such as restaurants, gas stations, and a hotel. There are no community resources such as schools, churches, or doctor’s offices within the project limits.
The U.S. Census lists the minority population of Henry County at 38.7%, which is slightly higher than the statewide minority population of 35.0%. This project will be developed in accordance with the Civil Rights Act of 1964, as amended by the Civil Rights Act of 1968. Along with Title VI of the Civil Rights Act, Executive Order 12898 (Environmental Justice) which ensures that minority and/or low-income households are neither disproportionably adversely impacted by major transportation projects, nor denied reasonable access to them by excessive costs or physical barriers (Environmental Protection Agency [EPA], 1994).
Henry County Transit provides “curb to curb” public transportation service on a first-come, first-served reservation system. Since this is an on-demand transit system and there are no stops in the study area, no transit facilities would be affected by the project. Improvements in traffic circulation provided by any of the proposed transportation system improvements described herein would benefit the operation of Henry County Transit as well.
9.5 SECTION 4(F)The project was examined for potential Section 4(f) properties in accordance with Section 4(f) of the Department of Transportation Act of 1966 (Title 49, USC, Section 1653 (f), amended and recodified in Title 49, USC, Section 303, in 1983). Within the project limits, there are no potential Section 4(f) resources.
9.6 POTENTIAL CONTAMINATIONA desktop review of underground storage tanks (USTs) listed on the Georgia Department of Natural Resources Environmental Protection Division’s database was conducted for the project area. As Table 9.2 shows, there are nine facilities with USTs within ½ mile of the interchange.Two of these facilities, Chevron Foodmart #2 and Liberty Gas Station are documented as having suspected releases.

I-75 & Bill Gardner Parkway IMR Page | 61
Table 9.2: Underground Storage Tanks (USTs) Within the Project Area
Facility IDFacility Name
Location Address
Location City
Location State
Location Zip
Facility Type Desc
Facility Status
750030 LIBERTY
4856 BILL GARDNER PKWY
LOCUST GROVE GA 30248
Gas Station Active
750070
HENRYS QUIK STOP #367
4837 BILL GARDNER PKWY
LOCUST GROVE GA 30248
Gas Station Active
750072LOCUST GROVE BP
4850 BILL GARDNER PARKWAY
LOCUST GROVE GA 30248
Gas Station Active
750099HENRYS REAL QUICK
4896 BILL GARDNER BLVD
LOCUST GROVE GA 30248
Gas Station Closed
9075026
LOCUST GROVE EXXON
4841 BILL GARDEN PKWY
LOCUST GROVE GA 30248
Gas Station Active
9075064
LOCUST GROVE EXXON
4621 BILL GARDNER PKWY
LOCUST GROVE GA 30248
Gas Station Active
9075100
CHEVRON FOODMART #2
4912 BILL GARDNER PARKWAY
LOCUST GROVE GA 30248
Gas Station Active
10000252
INGLES GAS EXPRESS #495
4920 BILL GARDNER PKWY
LOCUST GROVE GA 30248
Gas Station Active
10001287 BP
2800TANGER BLVD
LOCUST GROVE GA 30248
Gas Station Active
Source: Georgia DNR August 2010
It is recommended that additional analysis should be conducted during the design and permitting phase to determine whether further contamination screening should be conducted.

I-75 & Bill Gardner Parkway IMR Page | 62
10. EVALUATION OF ALTERNATIVESAn evaluation of the No-Build and three Build scenarios was completed based on the environmental impacts, operational results from the Synchro and CORSIM analysis, cost estimates, and benefit/cost (B/C) ratios. The evaluation matrix is shown below in Table 10.1.
Table 10.1: Evaluation Matrix
Scenario
Potential Environmental
Impacts (Acres)
OperationalLOS
(AM/PM)
Estimated Total Cost of Improvement(in millions)
Benefit/CostRatio
No Build Alternative N/A F / F N/A N/ABuild Alternative 1 –SPUI
0.0 C / D $47 0.39
Build Alternative 2 –DDI
0.15 E / C $33 0.61
Build Alternative 3 –Triple Left
0.0 E / E $17 1.0
Based upon the results of all three (3) Build alternatives as well as the No Build scenario, Build Alternative 3 – Triple Left Turns on Southbound Off-Ramp is recommended as the preferred alternative. This conclusion was derived from an assessment of the primary Federal Highway Administration (FHWA) criteria for IMRs and Interchange Justification Reports (IJRs).These criteria are discussed in detail in Section 11 of this report.
The result of the alternative evaluation indicates that although Alternative 3 will likely not provide the best operational improvements, the improvements that will be realized over the No Build scenario will occur at the lowest cost. The resulting cost/benefit ratios support this conclusion that Alternative 3 – Triple Left Turns will provide the best operational results for the lowest cost.
As noted previously, the analysis for all three (3) Build Alternatives assumes that the City of Locust Grove/Henry County sponsored Special Purpose Local Options Sales Tax (SPLOST) Bill Gardner Parkway widened project (with some modification) is completed. The modified Bill Gardner Parkway widening project used for the 2035 Build analyses assumes the widening from two (2) to four (4) lanes from the I-75 southbound ramps to Strong Rock Boulevard, and from four (4) to six (6) lanes from the I-75 northbound ramps to Tanger Boulevard.
It should also be noted that no potential environmental (wetlands) impacts were identified for Alternatives 1 and 3, and only minimal potential impacts were identified for Alternative 2. Since the potential environmental impacts for alternative are so low, they were not a primary factor used to recommend a preferred alternative.

I-75 & Bill Gardner Parkway IMR Page | 63
11. FHWA POLICY COMPLIANCEFHWA has issued a series of policies regarding the modification of access points on the Interstate System, published in the Federal Register, Volume 63, Number 28 (pages 7045-7047), dated February 11, 1998 (Doc. 98-3460). GDOT endorses these FHWA policies and has instituted a policy, titled “Responsibility and Procedures for Interchange Justification Reports (IJR’s) and Interchange Modification Reports (IMR’s) for Interstate and Non-Interstate Limited Access Facilities,” which complements the requirements and procedures set forth by FHWA. Both FHWA and GDOT policies, detailed in Appendix A, are intended to protect the capacity and safety of travel along the Interstate System by maintaining its limited access functionality. Compliance with these policies ensures that appropriate alternatives to providing new Interstate access points are considered prior to granting an additional access point.
The need for a modification to the interchange at I-75 and Bill Gardner Parkway (Exit 212) was examined in relation to the eight policy requirements of the Federal Register and included in the FHWA Guidance on Interstate Access Requests. The following section presents an examination of the findings and how they relate to these eight criteria. In order for an interchange modification to be recommended, all eight criteria must be met.
POLICY 1: EXISTING FACILITIESThe existing interchanges and/or local roads and streets in the corridor can neither provide the necessary access nor be improved to satisfactorily accommodate the design year traffic demands while at the same time providing the access intended by the proposal.
Based on traffic data and analysis documented in the IMR, the Design Year (2035) traffic demands cannot be accommodated at the Bill Gardner interchange as it is currently configured.Under design year traffic demand, the existing network will not efficiently permit direct access to and from the Interstate system (I-75), hindering further economic development. Without modification to the existing interchange, impacts to existing and future business would be extensive as safe and efficient access to I-75 would be limited.
Excessive queuing and delay in the AM peak hour on the northbound on-ramp at Bill GardnerParkway forces the northbound intersection to operate at LOS F. Excessive queuing in the PM peak hour on the southbound off-ramp at Bill Gardner Parkway both impedes the southbound mainline traffic in the design year and forces the southbound intersection to operate at a LOS F.
POLICY 2: TRANSPORTATION MANAGEMENT SYSTEMAll reasonable alternatives for design options, location and transportation system management type improvements (such as ramp metering, mass transit, and HOV facilities) have been assessed and provided for if currently justified, or provisions are included for accommodating such facilities if a future need is identified.Nine (9) concept alternatives, including the No Build alternative were originally evaluated and screened as part of this IMR. The initial nine (9) concepts were developed with theunderstanding of potential future improvements along I-75 recommended from various previous and potential future corridor system studies including the Study of Potential Managed Lanes on I-75 South Corridor (SRTA, November 2008), and the Value-Added Pricing Study: I-75 Corridor

I-75 & Bill Gardner Parkway IMR Page | 64
(SRTA, 2009), along with a planned I-75 South Corridor Master Plan and Sub-Area Plan to be undertaken by GDOT in 2011. This planned study will incorporate the results of the previous work and will evaluate mobility and access along I-75 from south of Atlanta to Warner Robbins, Georgia.
The initial nine (9) interchange concept alternatives for I-75 at Bill Gardner Parkway were screened based upon approximate cost and potential right-of-way impacts. The No Build was not selected as the preferred alternative because of the operational analysis results associated with it. According to FHWA policy, factors to be considered in the planning process include environmental enhancement and protection, energy conservation, and promotion of efficient system management and operation.
Three (3) design alternatives were recommended for detailed analysis as part of the initial concept alternative screening process. As discussed in Section 6.1 of this report, Build Alternative 1 proposes a Single Point Urban Interchange (SPUI), which would require the widening/reconstruction of the existing I-75 mainline bridge. The cost of construction for this alternative due to the extended bridge length required has rendered this alternative not feasible.Alternative 2 proposes constructing a Diverging Diamond Interchange (DDI), which would also require extensive lengthening of the existing I-75 mainline bridge. The DDI impacts approximately 0.15 acres of wetlands. Alternative 3 proposes constructing an additional (third) left-turn lane on the southbound off-ramp. This alternative requires lengthening the existing I-75 bridge, similar to the other two Build Alternatives. However, besides the bridge, there are minimal construction requirements associated with Alternative 3. This is the preferred alternative due to the construction cost, minimal right-of-way requirements, limited environmental impacts, and operating conditions in 2035 (LOS E).
POLICY 3: OPERATIONAL ANALYSISThe proposed access point does not have a significant adverse impact on the safety and operation of the Interstate facility based on an analysis of current and future traffic. The operational analysis for existing conditions shall, particularly in urbanized areas, include an analysis of sections of Interstate to and including at least the first adjacent existing or proposed interchange on either side. Crossroads and other roads and streets shall be included in the analysis to the extent necessary to assure their ability to collect and distribute traffic to and from the interchange with new or revised access points.
Traffic operations analyses have been performed using procedures outlined in the Transportation Research Board’s (TRB) 2000 Highway Capacity Manual (HCM) for basic freeway segments, ramps, non-signalized and signalized intersections. The current and future levels-of-service were analyzed using projected traffic volumes based on methodology approved by GDOT and FHWA for the 2035 design year. Included within the analysis are the adjacent interchanges consisting of SR 155, approximately 4.5 miles to the north, and SR 16, approximately 6.6 miles to the south.
As presented in the Existing Conditions analysis (Section 4) and Future Conditions analysis (Section 8) of this report, the proposed modifications to the Bill Gardner Parkway interchange will not have an adverse impact on operational characteristics of the I-75 mainline based on

I-75 & Bill Gardner Parkway IMR Page | 65
analysis of current and future traffic. I-75 will continue to operate at LOS B/C in base year 2010 and LOS B/C in design year 2035. Freeway segment analysis was conducted along I-75 before and after merge and diverges of Bill Gardner Parkway. Based on this analysis, the proposed improvements have been designed to address safety elements shown to lower potential crash rates and promote a safe transition to and from a limited access facility.
The basic freeway analysis for the 2035 No-Build Alternative (Section 8) shows that the I-75 mainline at Bill Gardner Parkway will continue to operate at LOS B/C with no modifications. The diverge movement for the southbound off-ramp will degrade to LOS F due to excessive queuing from the off-ramp. The suggested improvements to the southbound off-ramp include adding a 2,000-foot deceleration lane and a two-lane off-ramp for the southbound movement to Bill Gardner Parkway.
The basic freeway analysis for the 2035 No-Build Alternative (Section 8) also shows that the I-75 mainline at the SR 155 interchange will operate at LOS C/E and the diverge analysis shows an LOS of C/F for this alternative.
POLICY 4: ACCESS CONNECTIONS & DESIGNThe proposed access connects to a public road only and will provide for all traffic movements. Less than "full interchanges" for special purpose access for transit vehicles, for HOVs, or into park and ride lots may be considered on a case-by-case basis. The proposed access will be designed to meet or exceed current standards for federal-aid projects on the Interstate System.
The interchange currently connects to Bill Gardner Parkway which is maintained by Henry County. Thus, the proposed improvements to this interchange will connect to a public road and will provide for all traffic movements. With proposed modifications to this interchange, increased efficiency and access would be available to the industrial and residential area of the Metro Atlanta region. The proposed modifications will be designed to meet or exceed current standards for federal-aid projects on the Interstate System.
POLICY 5: TRANSPORTATION PLANSThe proposal considers and is consistent with local and regional land use and transportation plans. Prior to final approval, all requests for new or revised access must be consistent with the metropolitan and/or statewide transportation plan, as appropriate, the applicable provisions of 23 CFR part 450 and the transportation conformity requirements of 40 CFR parts 51 and 93.
The proposed improvements are consistent with the existing interstate network in the region. These improvements are in conformance with local and regional land use and transportation plans and have been appropriately coordinated with local stakeholders. Local involvement was an integral part of the project’s development. Local representatives from the City of Locust Grove and Henry County as well as GDOT staff met throughout the process indicating needs of both the citizens and local and regional visions. A list of plans and studies that were reviewed as part of this IMR follows. Each of these plans and studies is discussed in more detail in Section 3 of this report.

I-75 & Bill Gardner Parkway IMR Page | 66
Metro Atlanta Regional Freight Mobility Plan (ARC, 2005)Value-Added Pricing Study: I-75 Corridor (SRTA, 2009)Southern Regional Accessibility Study (ARC, 2007)Joint Henry County/Cities Comprehensive Transportation Plan (Henry County, 2007)Joint Henry County/Cities Comprehensive Plan (Henry County, 2007)City of Locust Grove IMR Feasibility Report (City of Locust Grove, 2008)City of Locust Grove Impact Fee Methodology ReportBandy Locust Grove DRI, DRI No. 1610 (GRTA, 2008)Strong Rock DRI No. 999 (GRTA, 2006) City of Locust Grove Existing Land Use mapCity of Locust Grove Existing and Future Land Use Map
Furthermore, this project has been coordinated through a 2008 Feasibility Study approved by GDOT and Federal Highway Administration (FHWA).
POLICY 6: COMPREHENSIVE INTERSTATE NETWORK STUDYIn areas where the potential exists for future multiple interchange additions, all requests for new or revised access are supported by a comprehensive Interstate network study with recommendations that address all proposed and desired access within the context of a long-term plan.
A comprehensive assessment has been achieved by extensive traffic operations analysis, modeling efforts, and simulation. The interchange immediately to the north of Bill Gardner Parkway is located at SR 155, approximately 4.5 miles away. The immediate interchange to the south of Bill Gardner Parkway is located at SR 16, approximately 6.6 miles to the south. Under Section II-A, this IMR would be in excess of the suburban spacing requirements (1.b.). Adjacent intersections at Bill Gardner Parkway include Tanger Boulevard to the east and Price Drive/Strong Rock Parkway to the west. Proposed modifications at the Bill Gardner Parkway Interchange are compatible with future points of access and would permit adequate vehicle movements for anticipated development within the region.
POLICY 7: COORDINATION WITH TRANSPORTATION SYSTEM IMPROVEMENTSThe request for a new or revised access generated by new or expanded development demonstrates appropriate coordination between the development and related or otherwise required transportation system improvements.
Due to the recent and projected growth in the area and the need to provide improved connectivity to Bill Gardner Parkway, the need for an improvement at the existing interchange location has been identified. Several Development of Regional Impact (DRI) studies and traffic studies were reviewed to assess local growth projections within the vicinity of the Bill GardnerParkway Interchange.
Bandy Locust Grove DRI, DRI No. 1610 (GRTA, 2008)Strong Rock DRI No. 999 (GRTA, 2006)Traffic Study for Proposed Wal-Mart in Locust Grove, Georgia (Wolverton Associates, 2008)
I-75 & Bill Gardner Parkway IMR Page | 67
POLICY 8: STATUS OF PLANNING AND NEPAThe request for new or revised access contains information relative to the planning requirements and the status of the environmental processing of the proposal.
From preliminary observations and data collection, the proposed modifications would not directly impact environmentally sensitive areas. No potential fatal flaws from a planning and environmental perspective have been identified for the preferred interchange alternative. There will not be any cultural, community or wetland impacts associated with the proposed modifications to the interchange.
RECOMMENDATIONS BASED ON FHWA POLICIESIt is anticipated that development will occur within the project area that will increase traffic demand to a level not sustainable by the existing interchange configuration at Bill Gardner Parkway. As a result of this growth, the interchange warrants an upgrading in the future.
The recommended interchange type selected was the standard diamond with an additional left turn lane for the southbound off-ramp movement. This is Build Alternative 3 – Triple LeftTurns. The interchange operates at an acceptable level of service based on the design year 2035 traffic estimates. Build Alternative 3 requires no additional right-of-way to construct the additional left-turn lane. This alternative has the lowest cost estimate of the three studied alternatives with an estimated total project cost of $17 million. This costs which is approximately 50% less than the next most costly improvement, would provide an 81% reduction of delay from the No Build Alternative, where the most costly alternative would provide an 87% reduction in delay.
Additional recommended improvements to Bill Gardner Parkway that were identified for all Build alternatives and are summarized below. Where applicable, the improvements identified in previous studies are noted.
Add a 2,000-foot deceleration lane for the southbound I-75 off-ramp and a two-lane off ramp to Bill Gardner Parkway.Widen Bill Gardner Parkway from two (2) to four (4) lanes from Strong Rock Boulevard to I-75 southbound ramps – (Henry County SPLOST Project)Widen Bill Gardner Parkway from four (4) to six (6) lanes from the I-75 northbound ramps to beyond Tanger Boulevard – Henry County SPLOST ProjectIncrease westbound left-turn queue storage bay along Bill Gardner Parkway at Strong Rock Boulevard - Strong Rock DRIAdd southbound left and right-turn lanes at Tanger Boulevard (due to the additional traffic from Wal-Mart) - Strong Rock DRI and Bandy Locust Grove DRIAdd left/through lane and exclusive right-turn lane for the northbound approach of Tanger Boulevard - Bandy Locust Grove DRIAdd I-75 northbound ramp auxiliary lane - Impact Fee Project