interaction and spatial distribution of wetland nitrogen
TRANSCRIPT
Ecological Modelling 105 (1997) 1–21
Interaction and spatial distribution of wetland nitrogenprocesses
Jay F. Martin a,b,*, K.R. Reddy b
a Department of En6ironmental Engineering Sciences, Uni6ersity of Florida, Gaines6ille, FL 32611, USAb Department of Soil and Water Science, Uni6ersity of Florida, Gaines6ille, FL 32611, USA
Accepted 29 April 1997
Abstract
A spatially-explicit, two-dimensional model was developed to evaluate the processes which determine the fate andtransport of nitrogen (N) in wetland systems. The wetland soil profile was partitioned into floodwater, and aerobic,and anaerobic soil layers, with diffusion and settling accounting for the transport of N between layers. Nitrogentransformations considered in the model were; enzyme hydrolysis, mineralization, nitrification, NH4-N adsorption/desorption, NH3-N volatilization, denitrification, and vegetative assimilation and decay. Most processes wererepresented with first-order kinetics, except vegetative uptake, which was represented with Michaelis–Menten kinetics.STELLA® iconographic software was used to simulate processes regulating N removal from wetlands. Denitrification,ammonia volatilization, and accretion of organic N were identified as major pathways accounting for N removal.Downward flux of NO3
− from floodwater to soil limited N removal through denitrification. Denitrification ratesincreased from 13 to 88 g N year−1 in response to augmented vertical flux of soluble N, caused by increasingdiffusion coefficients two orders of magnitude. Edaphic organic N storage, through the production of inorganic N,negatively impacted N removal. Spatial simulation illustrated the phenomena of diminishing returns in the massremoval rates of N, which were in agreement with documented values. © 1997 Elsevier Science B.V.
Keywords: Wetland model; Nitrogen cycling; Wastewater treatment
1. Introduction
Present concentrations and population levels ofhuman society require that nutrient levels inwastewater flows be reduced to preserve down-stream water quality. Nitrogen (N) occurring inwastewater, due to its role in eutrophication, and
* Corresponding author. Department of Oceanography andCoastal Sciences, Coastal Ecology Institute, Louisiana StateUniversity, Baton Rouge, LA 70803, USA.
0304-3800/97/$17.00 © 1997 Elsevier Science B.V. All rights reserved.
PII S 0304 -3800 (97 )00122 -1
J.F. Martin, K.R. Reddy / Ecological Modelling 105 (1997) 1–212
potential toxicity to aquatic species, is a nutrientof primary concern. Initial studies by Odum et al.(1977), Kadlec (1979), followed by others, haveidentified wetlands as a proven, low-energymethod to reduce nutrient levels, including N, inwastewater. Results from wetland treatment sys-tems have lead to a technical database quantifyingnutrient removal (NATWD, 1993). Relationships,derived from this database, and other results, arethe basis of current design and analysis methodsof wetland treatment systems. This design ap-proach, referred to as ‘black box’ methodology, isbased upon empirical equations derived from therelationships between input and output nutrientlevels. Integrative studies of the intrasystem pro-cesses leading to N removal are needed to deter-mine the interactions of responsible processes,and possible methods to increase N removal. Sin-gularly, these processes have been researched inwetland settings (Reddy and Patrick, 1984; Bow-den, 1987). However, comprehensive studies ofthe interactions, and resulting integrative effectsof such processes are limited. Integrating N cy-cling processes spatially on a wetland scalethrough a simulation model is an approach toevaluate such effects, and provide a frameworkfor hypothesis testing (Bakker, 1994).
The objectives of this study were to determine:(i) the interactions of N processes that affect thefate and transport of N in wetlands, and(ii) factors affecting N removal from treatmentwetlands.
A mechanistic model was developed to simulateboth vertical and horizontal distribution of Nprocesses in wetlands. First, a general unit modelwas developed, which was then adapted for appli-cation to vertical layers of floodwater, aerobicsoil, and anaerobic soil. Horizontal boundarieswere determined by the hydraulic retention time(HRT). Transport between the vertical layers wassimulated as diffusive flux, which was varied over3 orders of magnitude, ranging from rates indica-tive of molecular to turbulent diffusion. Waterwas viewed as a constant medium providing hori-zontal transport between cells. The model followsapproaches in earlier studies of vertical (Rao etal., 1984; Chapelle, 1995) and horizontal (Ham-mer, 1984; Dørge, 1994) distribution of N speciesin wetlands.
2. Description of model
2.1. Conceptual model and processes
Nitrogen transformations simulated in themodel included enzymatic hydrolysis of organicN, mineralization, nitrification, NH4-N adsorp-tion/desorption, NH3-N volatilization, denitrifica-tion, and vegetative assimilation and decay.Nitrogen transport was simulated vertically withdiffusion and settling, and horizontally as move-ment due to water flow. The model was designedto determine general concepts applicable to allwetland systems, but can be applied to specificsystems if required model inputs are known orcan be estimated. These include basic vegetative,soil, hydrologic, and size characteristics, as well asvarious first-order rate constants and N loadingrates. The model was developed for a southernNorth American climate where temperature vari-ances have minimal effects on N removal (Knight,1986; Gearheart, 1990) and thus, were not ex-plicitly included in the model. The model wasconceptualized and simulated using STELLA®
iconographic modeling software (Richmond et al.,1987; Martin and Tilley, 1998).
Rates were described with the following differ-ential equations: First-order rate kinetics:
dS/dt=k S
Michaelis–Menten kinetics:
dS/dt=km S/(ks+S)
Diffusive flux following Fick’s law:
dS/dt=D (C1−C2)/dx
where S is storage; dS/dt is the rate of process; kis the first-order rate constant; km is the maximumtransformation rate of storage; ks is the saturationconstant; D is the diffusion coefficient and C1 andC2 are the concentrations of N species in layer 1and 2, respectively. Time units of the model weremeasured in days with a time step of 0.0625 days,which was necessary for the diffusion equations.The integration method was fourth order Runge–Kutta (Richmond et al., 1987).
A general unit model (Fig. 1) was first devel-oped. Nitrogen was partitioned into five state
J.F. Martin, K.R. Reddy / Ecological Modelling 105 (1997) 1–21 3
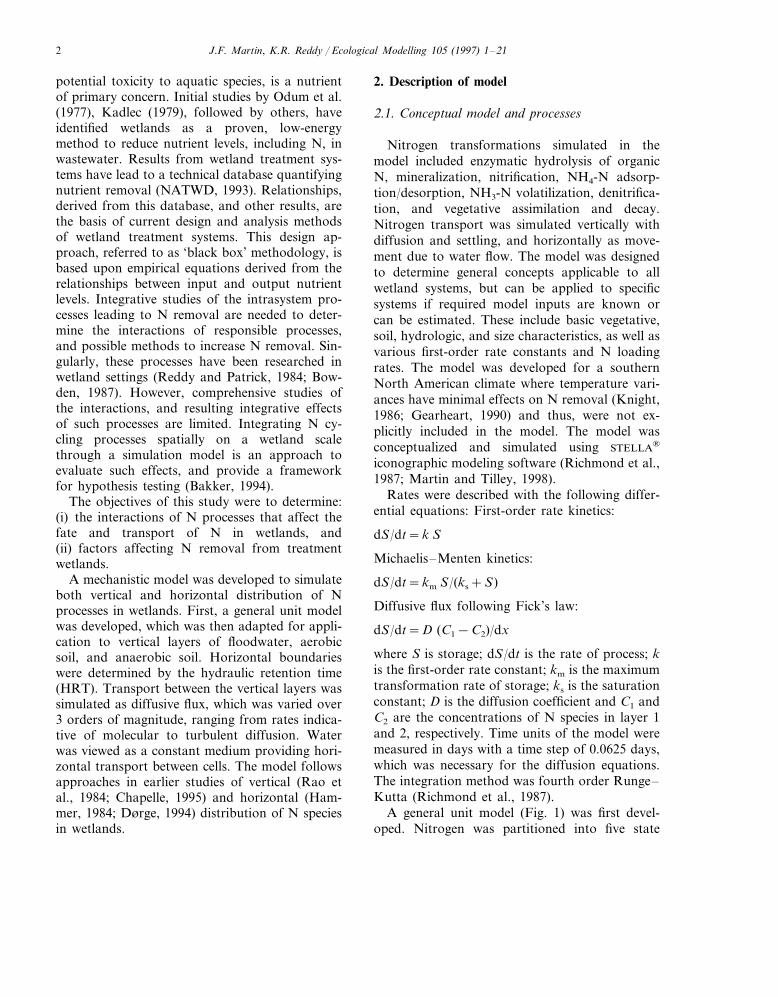
Fig. 1. General unit model which was amended and applied to different wetland layers. Valve symbols represent the transformationand flow of N between storages (boxes) of different N species. Clouds denote both sources and sinks outside the model boundary(Forrester, 1961; Richmond et al., 1987).
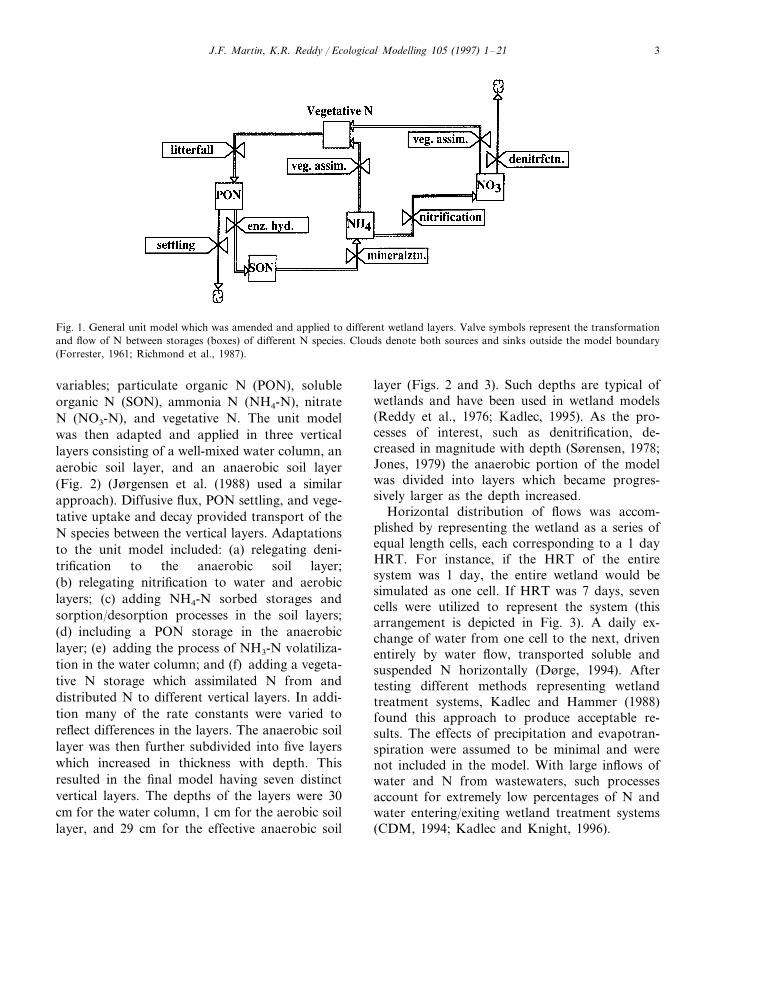
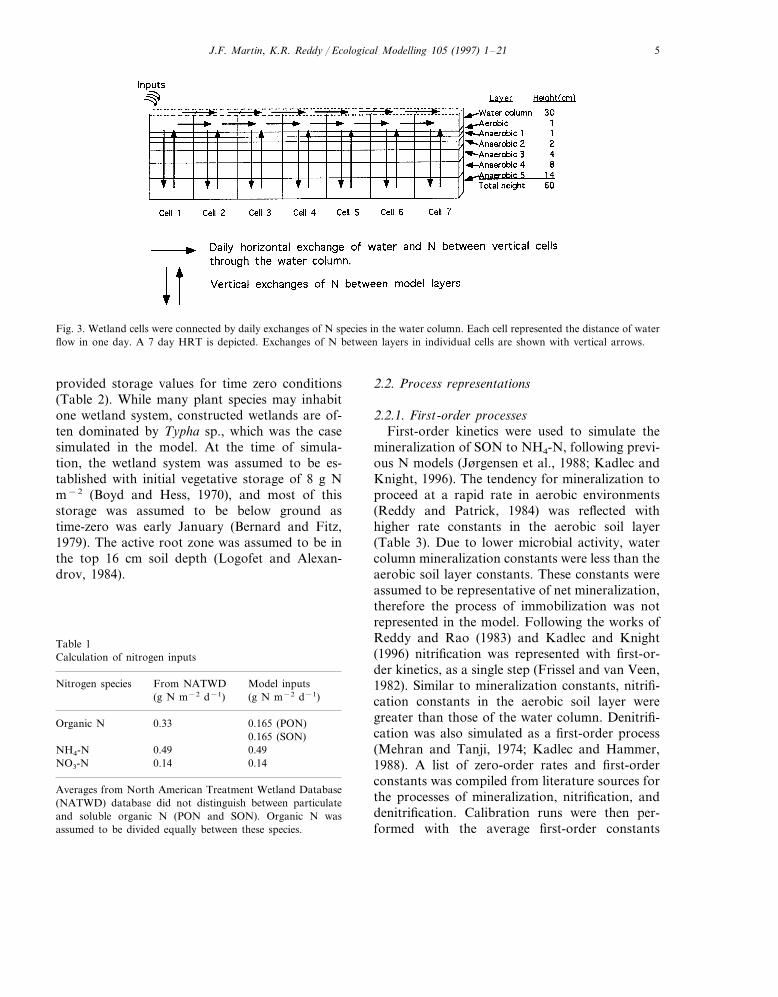
variables; particulate organic N (PON), solubleorganic N (SON), ammonia N (NH4-N), nitrateN (NO3-N), and vegetative N. The unit modelwas then adapted and applied in three verticallayers consisting of a well-mixed water column, anaerobic soil layer, and an anaerobic soil layer(Fig. 2) (Jørgensen et al. (1988) used a similarapproach). Diffusive flux, PON settling, and vege-tative uptake and decay provided transport of theN species between the vertical layers. Adaptationsto the unit model included: (a) relegating deni-trification to the anaerobic soil layer;(b) relegating nitrification to water and aerobiclayers; (c) adding NH4-N sorbed storages andsorption/desorption processes in the soil layers;(d) including a PON storage in the anaerobiclayer; (e) adding the process of NH3-N volatiliza-tion in the water column; and (f) adding a vegeta-tive N storage which assimilated N from anddistributed N to different vertical layers. In addi-tion many of the rate constants were varied toreflect differences in the layers. The anaerobic soillayer was then further subdivided into five layerswhich increased in thickness with depth. Thisresulted in the final model having seven distinctvertical layers. The depths of the layers were 30cm for the water column, 1 cm for the aerobic soillayer, and 29 cm for the effective anaerobic soil
layer (Figs. 2 and 3). Such depths are typical ofwetlands and have been used in wetland models(Reddy et al., 1976; Kadlec, 1995). As the pro-cesses of interest, such as denitrification, de-creased in magnitude with depth (Sørensen, 1978;Jones, 1979) the anaerobic portion of the modelwas divided into layers which became progres-sively larger as the depth increased.
Horizontal distribution of flows was accom-plished by representing the wetland as a series ofequal length cells, each corresponding to a 1 dayHRT. For instance, if the HRT of the entiresystem was 1 day, the entire wetland would besimulated as one cell. If HRT was 7 days, sevencells were utilized to represent the system (thisarrangement is depicted in Fig. 3). A daily ex-change of water from one cell to the next, drivenentirely by water flow, transported soluble andsuspended N horizontally (Dørge, 1994). Aftertesting different methods representing wetlandtreatment systems, Kadlec and Hammer (1988)found this approach to produce acceptable re-sults. The effects of precipitation and evapotran-spiration were assumed to be minimal and werenot included in the model. With large inflows ofwater and N from wastewaters, such processesaccount for extremely low percentages of N andwater entering/exiting wetland treatment systems(CDM, 1994; Kadlec and Knight, 1996).
J.F. Martin, K.R. Reddy / Ecological Modelling 105 (1997) 1–214
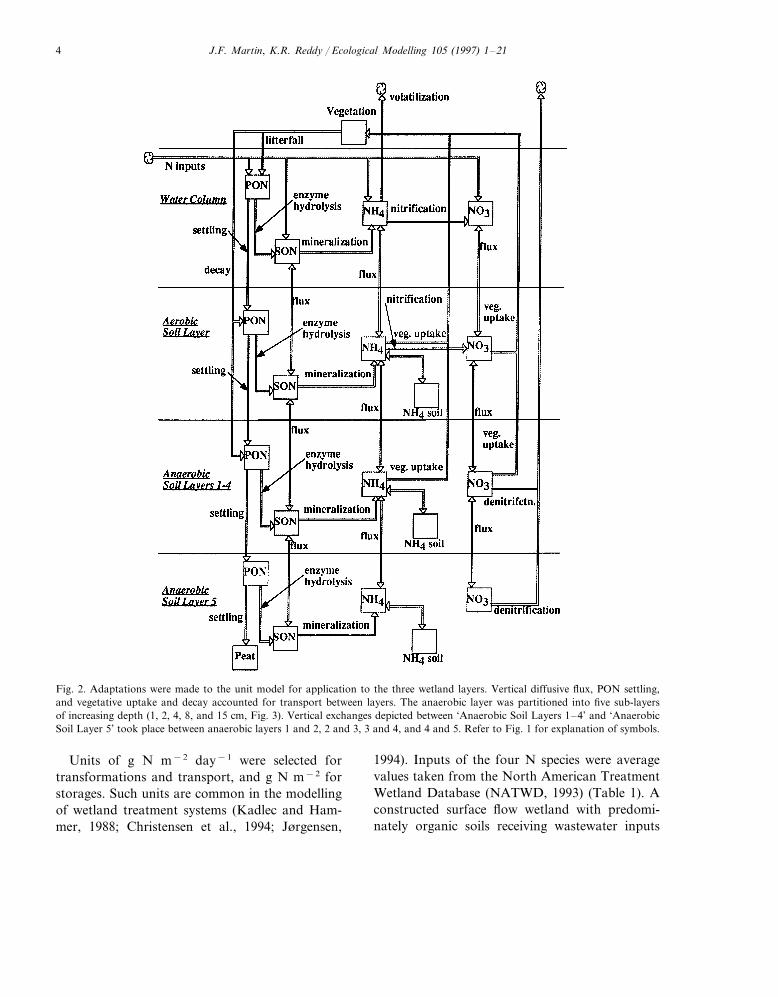
Fig. 2. Adaptations were made to the unit model for application to the three wetland layers. Vertical diffusive flux, PON settling,and vegetative uptake and decay accounted for transport between layers. The anaerobic layer was partitioned into five sub-layersof increasing depth (1, 2, 4, 8, and 15 cm, Fig. 3). Vertical exchanges depicted between ‘Anaerobic Soil Layers 1–4’ and ‘AnaerobicSoil Layer 5’ took place between anaerobic layers 1 and 2, 2 and 3, 3 and 4, and 4 and 5. Refer to Fig. 1 for explanation of symbols.
Units of g N m−2 day−1 were selected fortransformations and transport, and g N m−2 forstorages. Such units are common in the modellingof wetland treatment systems (Kadlec and Ham-mer, 1988; Christensen et al., 1994; Jørgensen,
1994). Inputs of the four N species were averagevalues taken from the North American TreatmentWetland Database (NATWD, 1993) (Table 1). Aconstructed surface flow wetland with predomi-nately organic soils receiving wastewater inputs
J.F. Martin, K.R. Reddy / Ecological Modelling 105 (1997) 1–21 5
Fig. 3. Wetland cells were connected by daily exchanges of N species in the water column. Each cell represented the distance of waterflow in one day. A 7 day HRT is depicted. Exchanges of N between layers in individual cells are shown with vertical arrows.
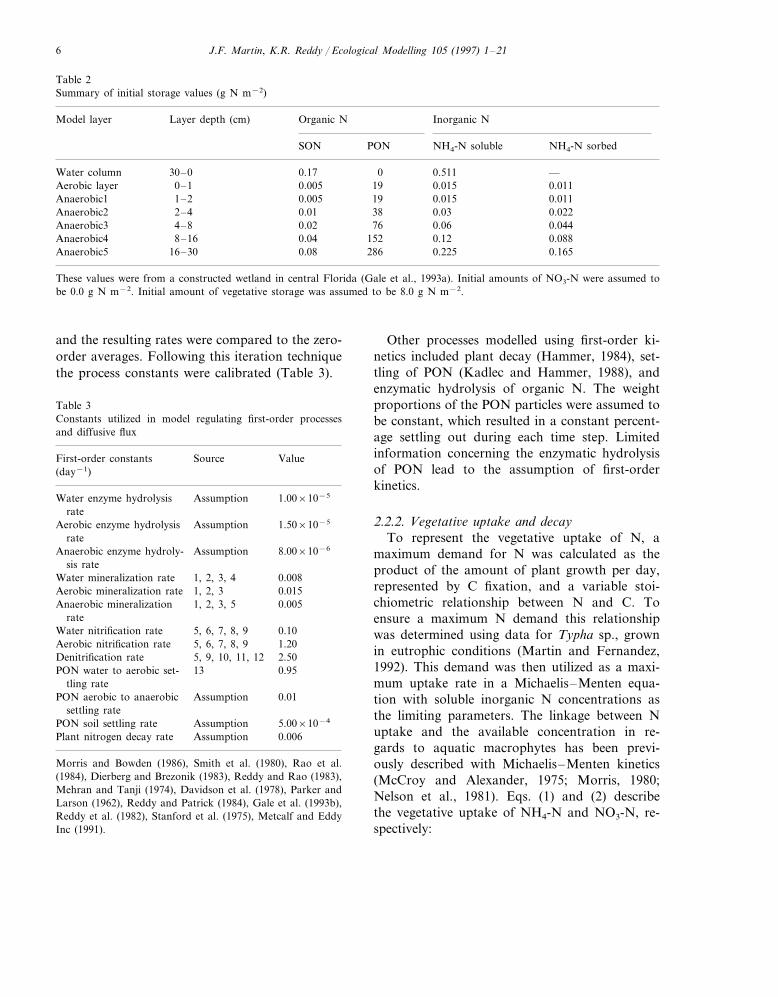
provided storage values for time zero conditions(Table 2). While many plant species may inhabitone wetland system, constructed wetlands are of-ten dominated by Typha sp., which was the casesimulated in the model. At the time of simula-tion, the wetland system was assumed to be es-tablished with initial vegetative storage of 8 g Nm−2 (Boyd and Hess, 1970), and most of thisstorage was assumed to be below ground astime-zero was early January (Bernard and Fitz,1979). The active root zone was assumed to be inthe top 16 cm soil depth (Logofet and Alexan-drov, 1984).
2.2. Process representations
2.2.1. First-order processesFirst-order kinetics were used to simulate the
mineralization of SON to NH4-N, following previ-ous N models (Jørgensen et al., 1988; Kadlec andKnight, 1996). The tendency for mineralization toproceed at a rapid rate in aerobic environments(Reddy and Patrick, 1984) was reflected withhigher rate constants in the aerobic soil layer(Table 3). Due to lower microbial activity, watercolumn mineralization constants were less than theaerobic soil layer constants. These constants wereassumed to be representative of net mineralization,therefore the process of immobilization was notrepresented in the model. Following the works ofReddy and Rao (1983) and Kadlec and Knight(1996) nitrification was represented with first-or-der kinetics, as a single step (Frissel and van Veen,1982). Similar to mineralization constants, nitrifi-cation constants in the aerobic soil layer weregreater than those of the water column. Denitrifi-cation was also simulated as a first-order process(Mehran and Tanji, 1974; Kadlec and Hammer,1988). A list of zero-order rates and first-orderconstants was compiled from literature sources forthe processes of mineralization, nitrification, anddenitrification. Calibration runs were then per-formed with the average first-order constants
Table 1Calculation of nitrogen inputs
Model inputsNitrogen species From NATWD(g N m−2 d−1)(g N m−2 d−1)
0.33Organic N 0.165 (PON)0.165 (SON)
0.49NH4-N 0.49NO3-N 0.14 0.14
Averages from North American Treatment Wetland Database(NATWD) database did not distinguish between particulateand soluble organic N (PON and SON). Organic N wasassumed to be divided equally between these species.
J.F. Martin, K.R. Reddy / Ecological Modelling 105 (1997) 1–216
Table 2Summary of initial storage values (g N m−2)
Layer depth (cm) Organic NModel layer Inorganic N
SON NH4-N soluble NH4-N sorbedPON
0.17 0 0.511Water column —30–00.0110.015190.005Aerobic layer 0–1
19 0.015Anaerobic1 1–2 0.005 0.01138 0.03Anaerobic2 2–4 0.01 0.022
0.0676 0.0440.02Anaerobic3 4–80.04 152 0.12Anaerobic4 0.0888–16
0.225 0.165Anaerobic5 16–30 0.08 286
These values were from a constructed wetland in central Florida (Gale et al., 1993a). Initial amounts of NO3-N were assumed tobe 0.0 g N m−2. Initial amount of vegetative storage was assumed to be 8.0 g N m−2.
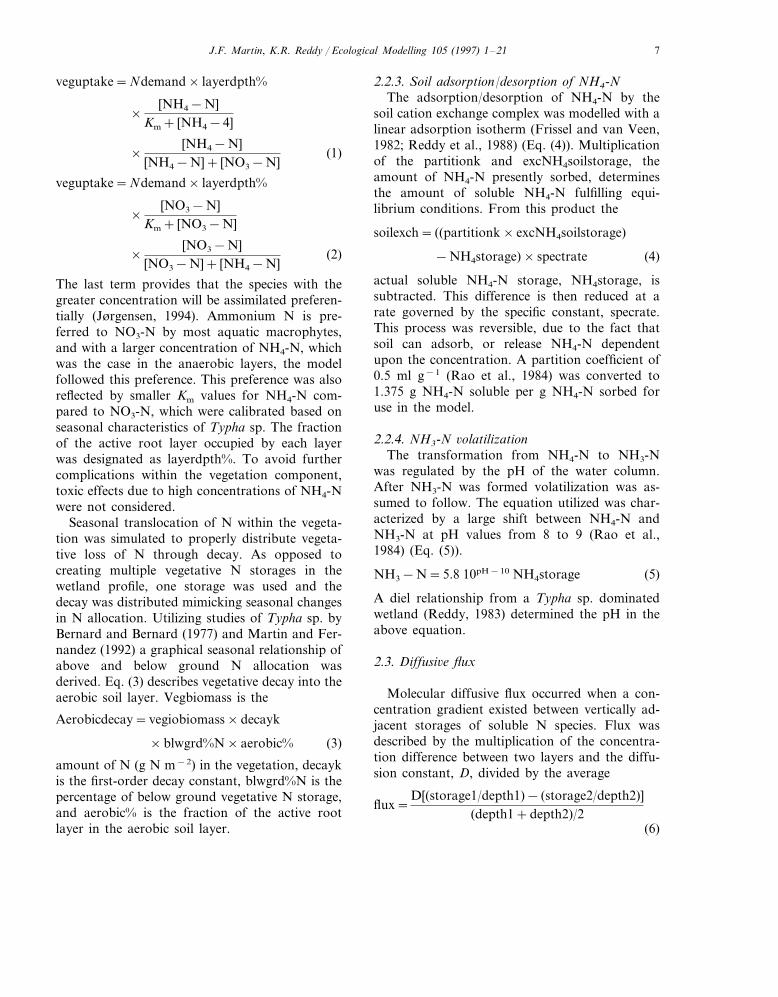
and the resulting rates were compared to the zero-order averages. Following this iteration techniquethe process constants were calibrated (Table 3).
Other processes modelled using first-order ki-netics included plant decay (Hammer, 1984), set-tling of PON (Kadlec and Hammer, 1988), andenzymatic hydrolysis of organic N. The weightproportions of the PON particles were assumed tobe constant, which resulted in a constant percent-age settling out during each time step. Limitedinformation concerning the enzymatic hydrolysisof PON lead to the assumption of first-orderkinetics.
2.2.2. Vegetati6e uptake and decayTo represent the vegetative uptake of N, a
maximum demand for N was calculated as theproduct of the amount of plant growth per day,represented by C fixation, and a variable stoi-chiometric relationship between N and C. Toensure a maximum N demand this relationshipwas determined using data for Typha sp., grownin eutrophic conditions (Martin and Fernandez,1992). This demand was then utilized as a maxi-mum uptake rate in a Michaelis–Menten equa-tion with soluble inorganic N concentrations asthe limiting parameters. The linkage between Nuptake and the available concentration in re-gards to aquatic macrophytes has been previ-ously described with Michaelis–Menten kinetics(McCroy and Alexander, 1975; Morris, 1980;Nelson et al., 1981). Eqs. (1) and (2) describethe vegetative uptake of NH4-N and NO3-N, re-spectively:
Table 3Constants utilized in model regulating first-order processesand diffusive flux
First-order constants Source Value(day−1)
Water enzyme hydrolysis 1.00×10⁻⁵Assumptionrate
1.50×10⁻⁵AssumptionAerobic enzyme hydrolysisrate
Assumption 8.00×10⁻⁶Anaerobic enzyme hydroly-sis rate
Water mineralization rate 1, 2, 3, 4 0.008Aerobic mineralization rate 1, 2, 3 0.015
1, 2, 3, 5 0.005Anaerobic mineralizationrate
Water nitrification rate 5, 6, 7, 8, 9 0.105, 6, 7, 8, 9Aerobic nitrification rate 1.205, 9, 10, 11, 12Denitrification rate 2.50
PON water to aerobic set- 13 0.95tling rate
0.01PON aerobic to anaerobic Assumptionsettling rate
PON soil settling rate Assumption 5.00×10⁻⁴
Plant nitrogen decay rate Assumption 0.006
Morris and Bowden (1986), Smith et al. (1980), Rao et al.(1984), Dierberg and Brezonik (1983), Reddy and Rao (1983),Mehran and Tanji (1974), Davidson et al. (1978), Parker andLarson (1962), Reddy and Patrick (1984), Gale et al. (1993b),Reddy et al. (1982), Stanford et al. (1975), Metcalf and EddyInc (1991).
J.F. Martin, K.R. Reddy / Ecological Modelling 105 (1997) 1–21 7
veguptake=Ndemand× layerdpth%
×[NH4−N]
Km+ [NH4−4]
×[NH4−N]
[NH4−N]+ [NO3−N](1)
veguptake=Ndemand× layerdpth%
×[NO3−N]
Km+ [NO3−N]
×[NO3−N]
[NO3−N]+ [NH4−N](2)
The last term provides that the species with thegreater concentration will be assimilated preferen-tially (Jørgensen, 1994). Ammonium N is pre-ferred to NO3-N by most aquatic macrophytes,and with a larger concentration of NH4-N, whichwas the case in the anaerobic layers, the modelfollowed this preference. This preference was alsoreflected by smaller Km values for NH4-N com-pared to NO3-N, which were calibrated based onseasonal characteristics of Typha sp. The fractionof the active root layer occupied by each layerwas designated as layerdpth%. To avoid furthercomplications within the vegetation component,toxic effects due to high concentrations of NH4-Nwere not considered.
Seasonal translocation of N within the vegeta-tion was simulated to properly distribute vegeta-tive loss of N through decay. As opposed tocreating multiple vegetative N storages in thewetland profile, one storage was used and thedecay was distributed mimicking seasonal changesin N allocation. Utilizing studies of Typha sp. byBernard and Bernard (1977) and Martin and Fer-nandez (1992) a graphical seasonal relationship ofabove and below ground N allocation wasderived. Eq. (3) describes vegetative decay into theaerobic soil layer. Vegbiomass is the
Aerobicdecay=vegiobiomass×decayk
×blwgrd%N×aerobic% (3)
amount of N (g N m−2) in the vegetation, decaykis the first-order decay constant, blwgrd%N is thepercentage of below ground vegetative N storage,and aerobic% is the fraction of the active rootlayer in the aerobic soil layer.
2.2.3. Soil adsorption/desorption of NH4-NThe adsorption/desorption of NH4-N by the
soil cation exchange complex was modelled with alinear adsorption isotherm (Frissel and van Veen,1982; Reddy et al., 1988) (Eq. (4)). Multiplicationof the partitionk and excNH4soilstorage, theamount of NH4-N presently sorbed, determinesthe amount of soluble NH4-N fulfilling equi-librium conditions. From this product the
soilexch= ((partitionk×excNH4soilstorage)
−NH4storage)×spectrate (4)
actual soluble NH4-N storage, NH4storage, issubtracted. This difference is then reduced at arate governed by the specific constant, specrate.This process was reversible, due to the fact thatsoil can adsorb, or release NH4-N dependentupon the concentration. A partition coefficient of0.5 ml g−1 (Rao et al., 1984) was converted to1.375 g NH4-N soluble per g NH4-N sorbed foruse in the model.
2.2.4. NH3-N 6olatilizationThe transformation from NH4-N to NH3-N
was regulated by the pH of the water column.After NH3-N was formed volatilization was as-sumed to follow. The equation utilized was char-acterized by a large shift between NH4-N andNH3-N at pH values from 8 to 9 (Rao et al.,1984) (Eq. (5)).
NH3−N=5.8 10pH−10 NH4storage (5)
A diel relationship from a Typha sp. dominatedwetland (Reddy, 1983) determined the pH in theabove equation.
2.3. Diffusi6e flux
Molecular diffusive flux occurred when a con-centration gradient existed between vertically ad-jacent storages of soluble N species. Flux wasdescribed by the multiplication of the concentra-tion difference between two layers and the diffu-sion constant, D, divided by the average
flux=D[(storage1/depth1)− (storage2/depth2)]
(depth1+depth2)/2(6)
J.F. Martin, K.R. Reddy / Ecological Modelling 105 (1997) 1–218
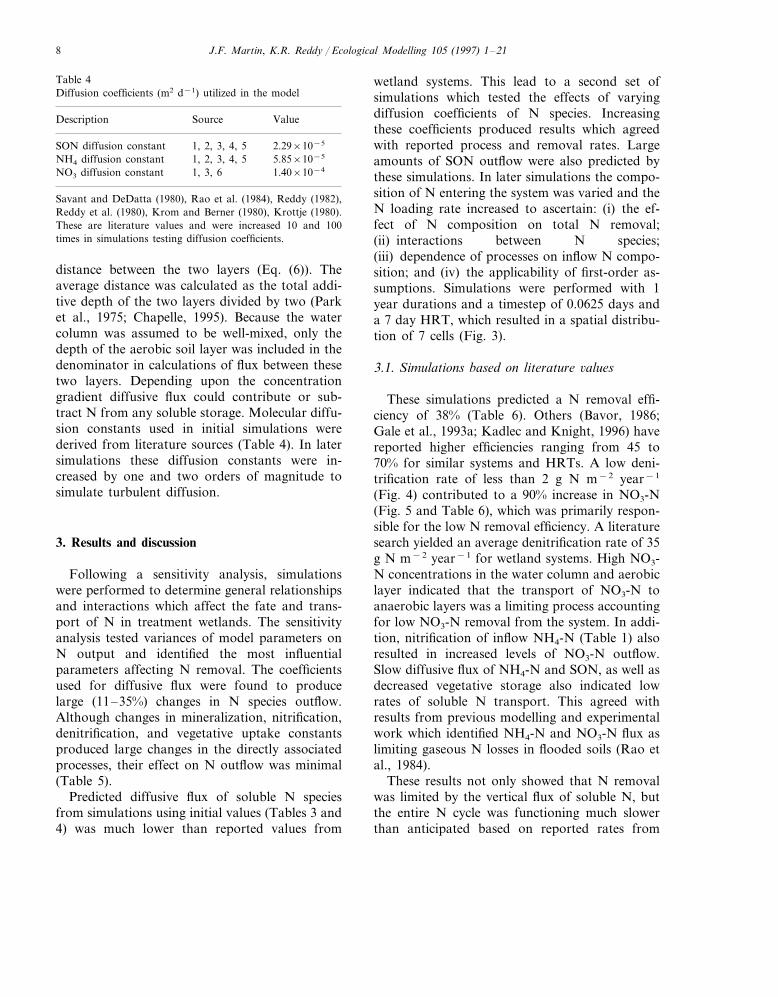
Table 4Diffusion coefficients (m2 d−1) utilized in the model
Description Source Value
1, 2, 3, 4, 5SON diffusion constant 2.29×10⁻⁵
1, 2, 3, 4, 5 5.85×10⁻⁵NH4 diffusion constantNO3 diffusion constant 1, 3, 6 1.40×10⁻⁴
Savant and DeDatta (1980), Rao et al. (1984), Reddy (1982),Reddy et al. (1980), Krom and Berner (1980), Krottje (1980).These are literature values and were increased 10 and 100times in simulations testing diffusion coefficients.
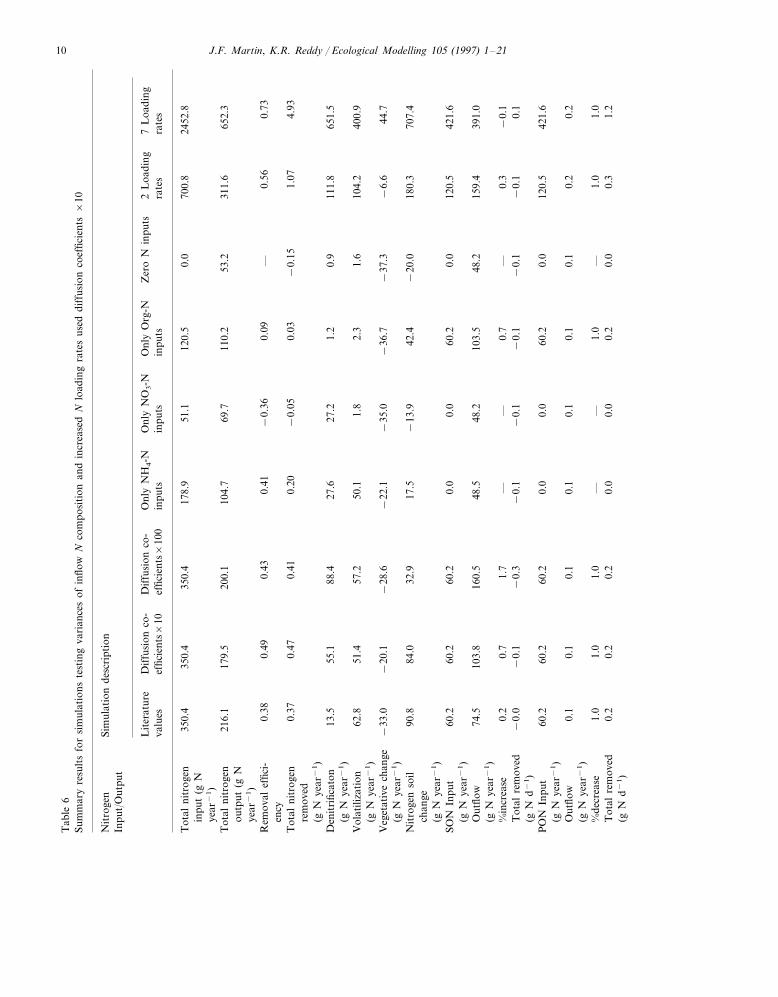
wetland systems. This lead to a second set ofsimulations which tested the effects of varyingdiffusion coefficients of N species. Increasingthese coefficients produced results which agreedwith reported process and removal rates. Largeamounts of SON outflow were also predicted bythese simulations. In later simulations the compo-sition of N entering the system was varied and theN loading rate increased to ascertain: (i) the ef-fect of N composition on total N removal;(ii) interactions between N species;(iii) dependence of processes on inflow N compo-sition; and (iv) the applicability of first-order as-sumptions. Simulations were performed with 1year durations and a timestep of 0.0625 days anda 7 day HRT, which resulted in a spatial distribu-tion of 7 cells (Fig. 3).
3.1. Simulations based on literature 6alues
These simulations predicted a N removal effi-ciency of 38% (Table 6). Others (Bavor, 1986;Gale et al., 1993a; Kadlec and Knight, 1996) havereported higher efficiencies ranging from 45 to70% for similar systems and HRTs. A low deni-trification rate of less than 2 g N m−2 year−1
(Fig. 4) contributed to a 90% increase in NO3-N(Fig. 5 and Table 6), which was primarily respon-sible for the low N removal efficiency. A literaturesearch yielded an average denitrification rate of 35g N m−2 year−1 for wetland systems. High NO3-N concentrations in the water column and aerobiclayer indicated that the transport of NO3-N toanaerobic layers was a limiting process accountingfor low NO3-N removal from the system. In addi-tion, nitrification of inflow NH4-N (Table 1) alsoresulted in increased levels of NO3-N outflow.Slow diffusive flux of NH4-N and SON, as well asdecreased vegetative storage also indicated lowrates of soluble N transport. This agreed withresults from previous modelling and experimentalwork which identified NH4-N and NO3-N flux aslimiting gaseous N losses in flooded soils (Rao etal., 1984).
These results not only showed that N removalwas limited by the vertical flux of soluble N, butthe entire N cycle was functioning much slowerthan anticipated based on reported rates from
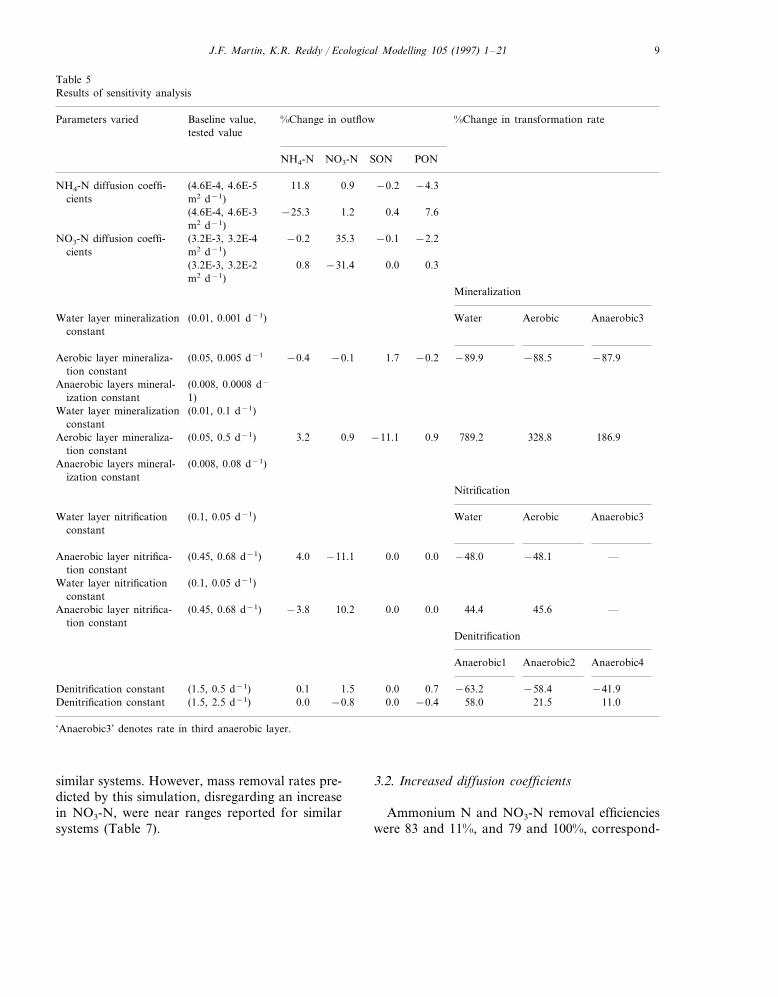
distance between the two layers (Eq. (6)). Theaverage distance was calculated as the total addi-tive depth of the two layers divided by two (Parket al., 1975; Chapelle, 1995). Because the watercolumn was assumed to be well-mixed, only thedepth of the aerobic soil layer was included in thedenominator in calculations of flux between thesetwo layers. Depending upon the concentrationgradient diffusive flux could contribute or sub-tract N from any soluble storage. Molecular diffu-sion constants used in initial simulations werederived from literature sources (Table 4). In latersimulations these diffusion constants were in-creased by one and two orders of magnitude tosimulate turbulent diffusion.
3. Results and discussion
Following a sensitivity analysis, simulationswere performed to determine general relationshipsand interactions which affect the fate and trans-port of N in treatment wetlands. The sensitivityanalysis tested variances of model parameters onN output and identified the most influentialparameters affecting N removal. The coefficientsused for diffusive flux were found to producelarge (11–35%) changes in N species outflow.Although changes in mineralization, nitrification,denitrification, and vegetative uptake constantsproduced large changes in the directly associatedprocesses, their effect on N outflow was minimal(Table 5).
Predicted diffusive flux of soluble N speciesfrom simulations using initial values (Tables 3 and4) was much lower than reported values from
J.F. Martin, K.R. Reddy / Ecological Modelling 105 (1997) 1–21 9
Table 5Results of sensitivity analysis
Baseline value, %Change in transformation rate%Change in outflowParameters variedtested value
NH4-N NO3-N SON PON
NH4-N diffusion coeffi- −0.2 −4.3(4.6E-4, 4.6E-5 11.8 0.9m2 d−1)cients
0.4 7.6(4.6E-4, 4.6E-3 −25.3 1.2m2 d−1)
NO3-N diffusion coeffi- −0.1 −2.2(3.2E-3, 3.2E-4 −0.2 35.3m2 d−1)cients
0.0 0.3(3.2E-3, 3.2E-2 0.8 −31.4m2 d−1)
Mineralization
Aerobic Anaerobic3Water layer mineralization Water(0.01, 0.001 d−1)constant
−87.9−88.5−89.9Aerobic layer mineraliza- −0.21.7(0.05, 0.005 d−1 −0.4 −0.1tion constant
Anaerobic layers mineral- (0.008, 0.0008 d−
1)ization constantWater layer mineralization (0.01, 0.1 d−1)
constant789.2 186.9328.8Aerobic layer mineraliza- (0.05, 0.5 d−1) 3.2 0.9 −11.1 0.9
tion constantAnaerobic layers mineral- (0.008, 0.08 d−1)
ization constantNitrification
WaterWater layer nitrification Aerobic(0.1, 0.05 d−1) Anaerobic3constant
—−48.0Anaerobic layer nitrifica- −48.10.00.0(0.45, 0.68 d−1) 4.0 −11.1tion constant
Water layer nitrification (0.1, 0.05 d−1)constant
0.0 44.4Anaerobic layer nitrifica- 45.6(0.45, 0.68 d−1) −3.8 10.2 —0.0tion constant
Denitrification
Anaerobic2 Anaerobic4Anaerobic1
−41.9−58.4−63.2Denitrification constant (1.5, 0.5 d−1) 0.70.1 1.5 0.011.021.5Denitrification constant (1.5, 2.5 d−1) 0.0 −0.8 0.0 −0.4 58.0
‘Anaerobic3’ denotes rate in third anaerobic layer.
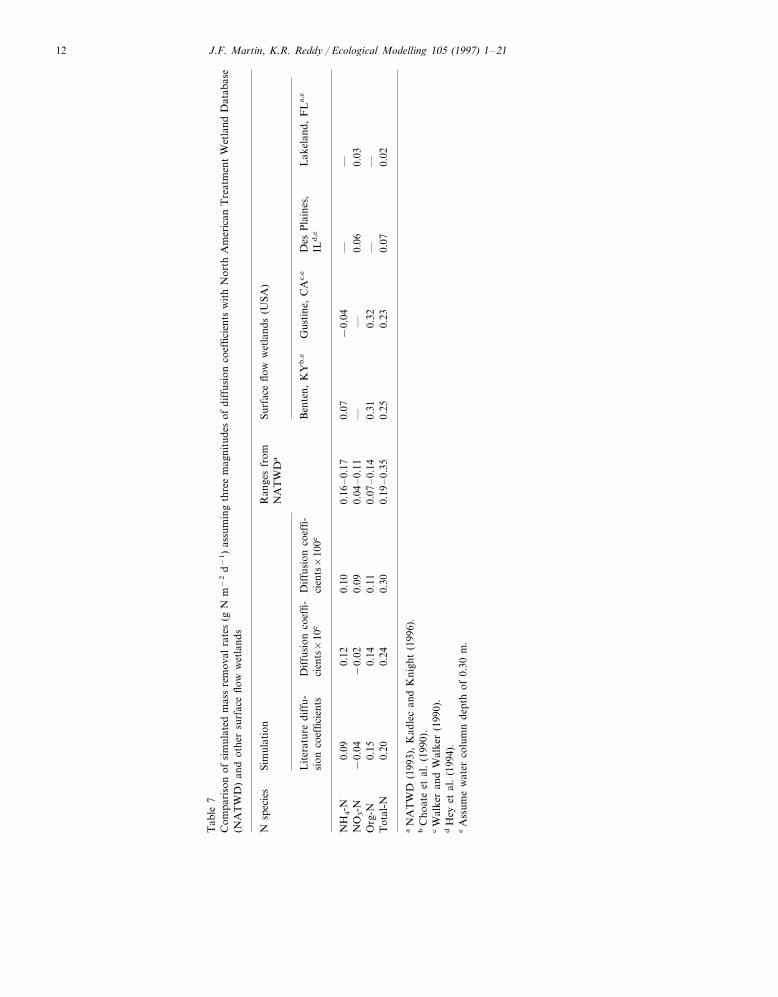
similar systems. However, mass removal rates pre-dicted by this simulation, disregarding an increasein NO3-N, were near ranges reported for similarsystems (Table 7).
3.2. Increased diffusion coefficients
Ammonium N and NO3-N removal efficiencieswere 83 and 11%, and 79 and 100%, correspond-
J.F. Martin, K.R. Reddy / Ecological Modelling 105 (1997) 1–2110T
able
6Su
mm
ary
resu
lts
for
sim
ulat
ions
test
ing
vari
ance
sof
inflo
wN
com
posi
tion
and
incr
ease
dN
load
ing
rate
sus
eddi
ffus
ion
coef
ficie
nts
×10
Nit
roge
nSi
mul
atio
nde
scri
ptio
nIn
put/
Out
put
Dif
fusi
onco
-O
nly
NH
4-N
Lit
erat
ure
Onl
yN
O3-N
Dif
fusi
onco
-O
nly
Org
-N7
Loa
ding
Zer
oN
inpu
ts2
Loa
ding
rate
sin
puts
inpu
tsra
tes
inpu
tsef
ficie
nts×
10ef
ficie
nts×
100
valu
es
178.
9T
otal
nitr
ogen
51.1
350.
412
0.5
0.0
700.
824
52.8
350.
435
0.4
inpu
t(g
Nye
ar−
1)
104.
7T
otal
nitr
ogen
69.7
216.
111
0.2
53.2
311.
665
2.3
179.
520
0.1
outp
ut(g
Nye
ar−
1)
−0.
360.
09—
0.56
0.49
0.73
0.43
0.38
0.41
Rem
oval
effic
i-en
cy0.
370.
410.
20−
0.05
0.03
−0.
151.
074.
93T
otal
nitr
ogen
0.47
rem
oved
(gN
year
−1)
88.4
27.6
27.2
1.2
0.9
111.
865
1.5
Den
itri
ficat
on55
.113
.5(g
Nye
ar−
1)
1.8
2.3
1.6
104.
257
.240
0.9
50.1
51.4
62.8
Vol
atili
zati
on(g
Nye
ar−
1)
−22
.1−
33.0
−35
.0−
36.7
−37
.3−
6.6
44.7
−20
.1−
28.6
Veg
etat
ive
chan
ge(g
Nye
ar−
1)
17.5
−13
.942
.4−
20.0
180.
384
.070
7.4
90.8
32.9
Nit
roge
nso
ilch
ange
(gN
year
−1)
60.2
0.0
0.0
60.2
0.0
120.
542
1.6
60.2
SON
Inpu
t60
.2(g
Nye
ar−
1)
160.
548
.548
.210
3.5
48.2
159.
439
1.0
Out
flow
103.
874
.5(g
Nye
ar−
1)
0.7
—0.
3−
0.1
——
1.7
0.7
0.2
%in
crea
se−
0.1
−0.
1−
0.1
−0.
1T
otal
rem
oved
0.1
−0.
0−
0.1
−0.
3−
0.1
(gN
d−1)
0.0
60.2
0.0
120.
560
.242
1.6
PO
NIn
put
60.2
60.2
0.0
(gN
year
−1)
0.1
0.1
0.1
0.1
0.1
0.2
0.2
0.1
Out
flow
0.1
(gN
year
−1)
1.0
—1.
0—
1.0
1.0
1.0
1.0
%de
crea
se—
0.0
0.2
0.0
0.3
1.2
0.0
Tot
alre
mov
ed0.
20.
20.
2(g
Nd−
1)
J.F. Martin, K.R. Reddy / Ecological Modelling 105 (1997) 1–21 11
Tab
le6
(con
tinu
ed)
Sim
ulat
ion
desc
ript
ion
Nit
roge
nIn
put/
Out
put
Onl
yN
H4-N
Lit
erat
ure
Zer
oN
inpu
tsO
nly
Org
-N2
Loa
ding
7L
oadi
ngD
iffu
sion
co-
Onl
yN
O3-N
Dif
fusi
onco
-ra
tes
effic
ient
s×10
rate
sva
lues
inpu
tsin
puts
effic
ient
s×10
0in
puts 0.0
0.0
0.0
357.
717
8.9
1252
.017
8.9
178.
9N
H4-N
Inpu
t17
8.9
(gN
year
−1)
44.5
27.9
3.7
4.6
3.4
59.3
249.
029
.9O
utflo
w37
.7(g
Nye
ar−
1)
—0.
8—
—0.
80.
80.
80.
80.
8%
decr
ease
0.0
0.0
0.0
0.8
2.7
0.4
Tot
alre
mov
ed0.
40.
40.
4(g
Nd−
1)
51.1
0.0
0.0
102.
235
7.7
NO
3-N
Inpu
t51
.151
.151
.10.
0(g
Nye
ar−
1)
17.7
1.9
1.4
92.7
1.8
12.0
28.3
45.7
96.9
Out
flow
(gN
year
−1)
—0.
7—
—0.
11.
0−
0.9
%de
crea
se0.
11.
00.
1−
0.0
−0.
00.
00.
9−
0.1
0.1
Tot
alre
mov
ed0.
0−
0.1
(gN
d−1)
The
unit
sof
gN
year
−1
deno
teN
mas
sba
sed
upon
the
enti
resy
stem
of7
cells
wit
ha
HR
Tof
7da
ys.
To
obta
ina
m2
aver
age
for
the
enti
resy
stem
thes
eva
lues
can
bedi
vide
dby
7.
J.F. Martin, K.R. Reddy / Ecological Modelling 105 (1997) 1–2112
Tab
le7
Com
pari
son
ofsi
mul
ated
mas
sre
mov
alra
tes
(gN
m−
2d−
1)
assu
min
gth
ree
mag
nitu
des
ofdi
ffus
ion
coef
ficie
nts
wit
hN
orth
Am
eric
anT
reat
men
tW
etla
ndD
atab
ase
(NA
TW
D)
and
othe
rsu
rfac
eflo
ww
etla
nds
Ran
ges
from
Sim
ulat
ion
Nsp
ecie
sSu
rfac
eflo
ww
etla
nds
(USA
)N
AT
WD
a
Lit
erat
ure
diff
u-B
ente
n,K
Yb
,eG
usti
ne,
CA
c,e
Dif
fusi
onco
effi-
Des
Pla
ines
,D
iffu
sion
coef
fi-L
akel
and,
FL
a,e
ILd
,eci
ents
×10
esi
onco
effic
ient
sci
ents
×10
0e
0.16
–0.
170.
07−
0.04
——
NH
4-N
0.12
0.09
0.10
—0.
060.
03—
0.04
–0.
110.
09N
O3-N
−0.
04−
0.02
0.31
0.15
0.32
——
0.14
0.11
0.07
–0.
14O
rg-N
0.20
0.25
0.23
0.07
0.02
0.24
0.30
Tot
al-N
0.19
–0.
35
aN
AT
WD
(199
3),
Kad
lec
and
Kni
ght
(199
6).
bC
hoat
eet
al.
(199
0).
cW
alke
ran
dW
alke
r(1
990)
.d
Hey
etal
.(1
994)
.e
Ass
ume
wat
erco
lum
nde
pth
of0.
30m
.
J.F. Martin, K.R. Reddy / Ecological Modelling 105 (1997) 1–21 13
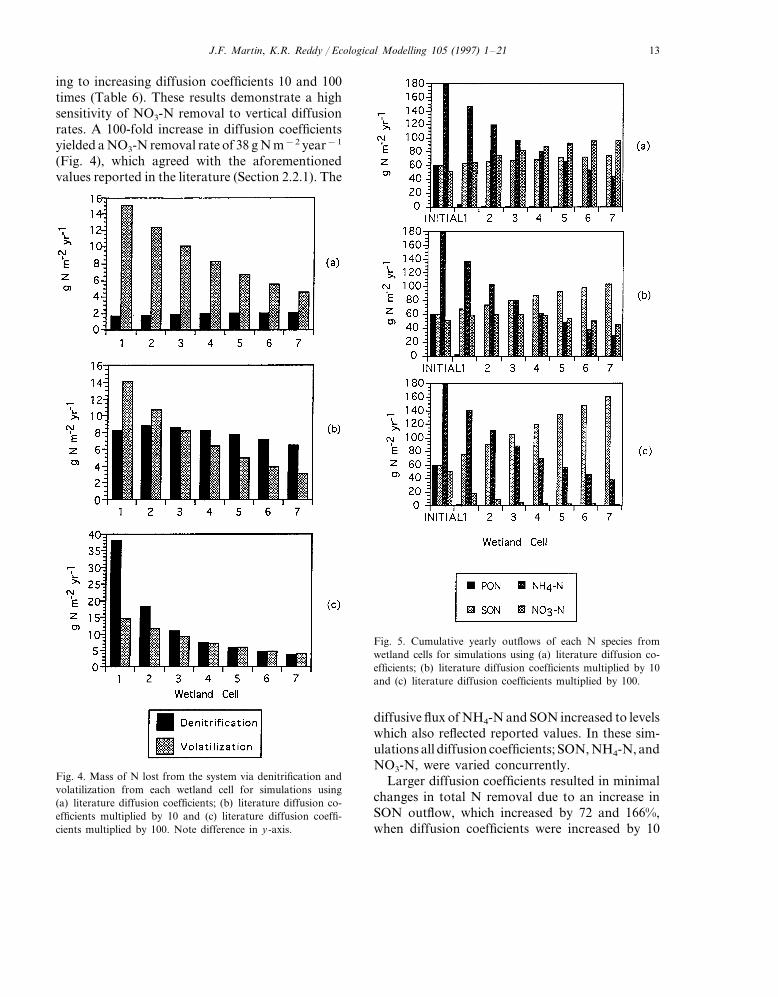
ing to increasing diffusion coefficients 10 and 100times (Table 6). These results demonstrate a highsensitivity of NO3-N removal to vertical diffusionrates. A 100-fold increase in diffusion coefficientsyielded a NO3-N removal rate of 38 g N m−2 year−1
(Fig. 4), which agreed with the aforementionedvalues reported in the literature (Section 2.2.1). The
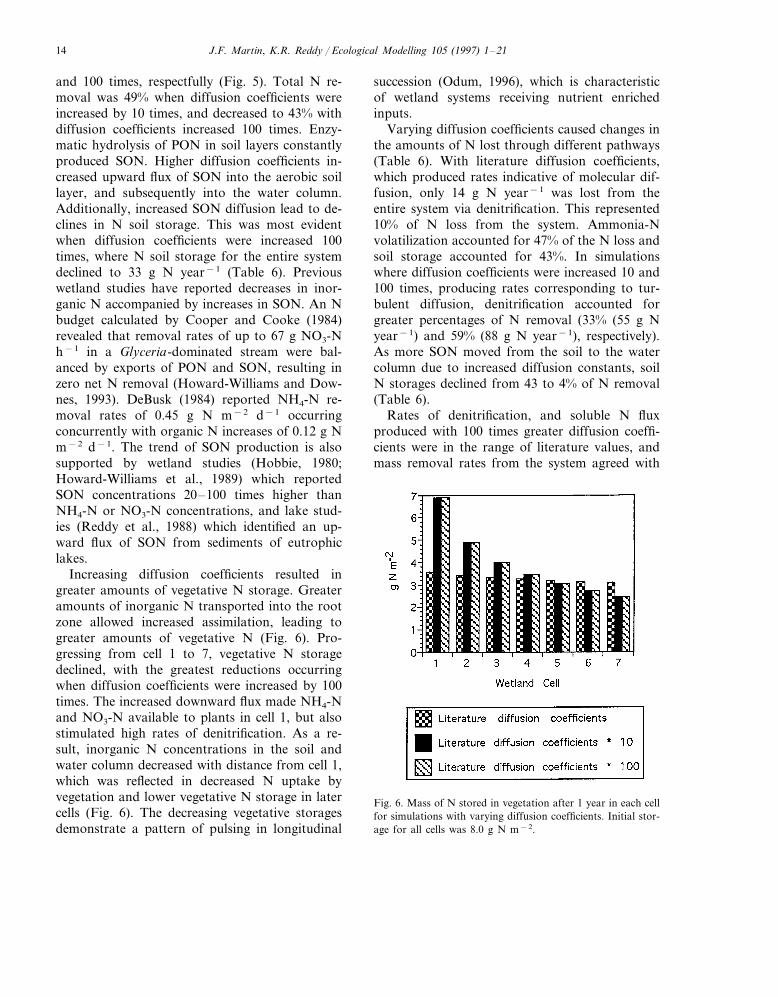
Fig. 5. Cumulative yearly outflows of each N species fromwetland cells for simulations using (a) literature diffusion co-efficients; (b) literature diffusion coefficients multiplied by 10and (c) literature diffusion coefficients multiplied by 100.
Fig. 4. Mass of N lost from the system via denitrification andvolatilization from each wetland cell for simulations using(a) literature diffusion coefficients; (b) literature diffusion co-efficients multiplied by 10 and (c) literature diffusion coeffi-cients multiplied by 100. Note difference in y-axis.
diffusive flux of NH4-N and SON increased to levelswhich also reflected reported values. In these sim-ulations all diffusion coefficients; SON, NH4-N, andNO3-N, were varied concurrently.
Larger diffusion coefficients resulted in minimalchanges in total N removal due to an increase inSON outflow, which increased by 72 and 166%,when diffusion coefficients were increased by 10
J.F. Martin, K.R. Reddy / Ecological Modelling 105 (1997) 1–2114
and 100 times, respectfully (Fig. 5). Total N re-moval was 49% when diffusion coefficients wereincreased by 10 times, and decreased to 43% withdiffusion coefficients increased 100 times. Enzy-matic hydrolysis of PON in soil layers constantlyproduced SON. Higher diffusion coefficients in-creased upward flux of SON into the aerobic soillayer, and subsequently into the water column.Additionally, increased SON diffusion lead to de-clines in N soil storage. This was most evidentwhen diffusion coefficients were increased 100times, where N soil storage for the entire systemdeclined to 33 g N year−1 (Table 6). Previouswetland studies have reported decreases in inor-ganic N accompanied by increases in SON. An Nbudget calculated by Cooper and Cooke (1984)revealed that removal rates of up to 67 g NO3-Nh−1 in a Glyceria-dominated stream were bal-anced by exports of PON and SON, resulting inzero net N removal (Howard-Williams and Dow-nes, 1993). DeBusk (1984) reported NH4-N re-moval rates of 0.45 g N m−2 d−1 occurringconcurrently with organic N increases of 0.12 g Nm−2 d−1. The trend of SON production is alsosupported by wetland studies (Hobbie, 1980;Howard-Williams et al., 1989) which reportedSON concentrations 20–100 times higher thanNH4-N or NO3-N concentrations, and lake stud-ies (Reddy et al., 1988) which identified an up-ward flux of SON from sediments of eutrophiclakes.
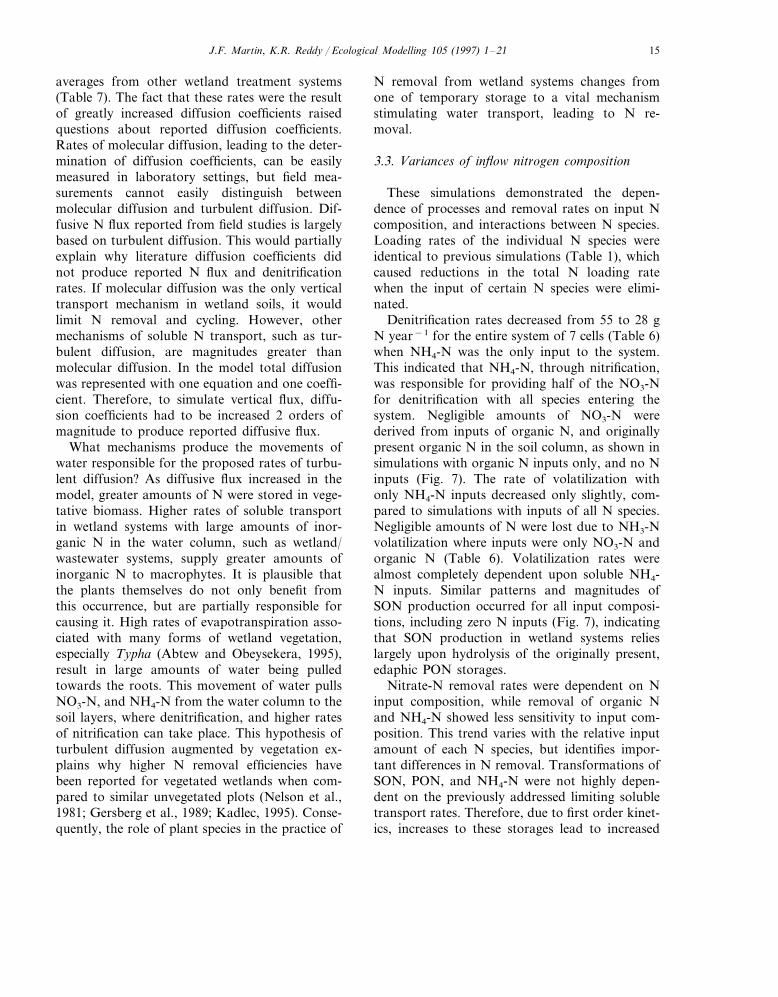
Increasing diffusion coefficients resulted ingreater amounts of vegetative N storage. Greateramounts of inorganic N transported into the rootzone allowed increased assimilation, leading togreater amounts of vegetative N (Fig. 6). Pro-gressing from cell 1 to 7, vegetative N storagedeclined, with the greatest reductions occurringwhen diffusion coefficients were increased by 100times. The increased downward flux made NH4-Nand NO3-N available to plants in cell 1, but alsostimulated high rates of denitrification. As a re-sult, inorganic N concentrations in the soil andwater column decreased with distance from cell 1,which was reflected in decreased N uptake byvegetation and lower vegetative N storage in latercells (Fig. 6). The decreasing vegetative storagesdemonstrate a pattern of pulsing in longitudinal
succession (Odum, 1996), which is characteristicof wetland systems receiving nutrient enrichedinputs.
Varying diffusion coefficients caused changes inthe amounts of N lost through different pathways(Table 6). With literature diffusion coefficients,which produced rates indicative of molecular dif-fusion, only 14 g N year−1 was lost from theentire system via denitrification. This represented10% of N loss from the system. Ammonia-Nvolatilization accounted for 47% of the N loss andsoil storage accounted for 43%. In simulationswhere diffusion coefficients were increased 10 and100 times, producing rates corresponding to tur-bulent diffusion, denitrification accounted forgreater percentages of N removal (33% (55 g Nyear−1) and 59% (88 g N year−1), respectively).As more SON moved from the soil to the watercolumn due to increased diffusion constants, soilN storages declined from 43 to 4% of N removal(Table 6).
Rates of denitrification, and soluble N fluxproduced with 100 times greater diffusion coeffi-cients were in the range of literature values, andmass removal rates from the system agreed with
Fig. 6. Mass of N stored in vegetation after 1 year in each cellfor simulations with varying diffusion coefficients. Initial stor-age for all cells was 8.0 g N m−2.
J.F. Martin, K.R. Reddy / Ecological Modelling 105 (1997) 1–21 15
averages from other wetland treatment systems(Table 7). The fact that these rates were the resultof greatly increased diffusion coefficients raisedquestions about reported diffusion coefficients.Rates of molecular diffusion, leading to the deter-mination of diffusion coefficients, can be easilymeasured in laboratory settings, but field mea-surements cannot easily distinguish betweenmolecular diffusion and turbulent diffusion. Dif-fusive N flux reported from field studies is largelybased on turbulent diffusion. This would partiallyexplain why literature diffusion coefficients didnot produce reported N flux and denitrificationrates. If molecular diffusion was the only verticaltransport mechanism in wetland soils, it wouldlimit N removal and cycling. However, othermechanisms of soluble N transport, such as tur-bulent diffusion, are magnitudes greater thanmolecular diffusion. In the model total diffusionwas represented with one equation and one coeffi-cient. Therefore, to simulate vertical flux, diffu-sion coefficients had to be increased 2 orders ofmagnitude to produce reported diffusive flux.
What mechanisms produce the movements ofwater responsible for the proposed rates of turbu-lent diffusion? As diffusive flux increased in themodel, greater amounts of N were stored in vege-tative biomass. Higher rates of soluble transportin wetland systems with large amounts of inor-ganic N in the water column, such as wetland/wastewater systems, supply greater amounts ofinorganic N to macrophytes. It is plausible thatthe plants themselves do not only benefit fromthis occurrence, but are partially responsible forcausing it. High rates of evapotranspiration asso-ciated with many forms of wetland vegetation,especially Typha (Abtew and Obeysekera, 1995),result in large amounts of water being pulledtowards the roots. This movement of water pullsNO3-N, and NH4-N from the water column to thesoil layers, where denitrification, and higher ratesof nitrification can take place. This hypothesis ofturbulent diffusion augmented by vegetation ex-plains why higher N removal efficiencies havebeen reported for vegetated wetlands when com-pared to similar unvegetated plots (Nelson et al.,1981; Gersberg et al., 1989; Kadlec, 1995). Conse-quently, the role of plant species in the practice of
N removal from wetland systems changes fromone of temporary storage to a vital mechanismstimulating water transport, leading to N re-moval.
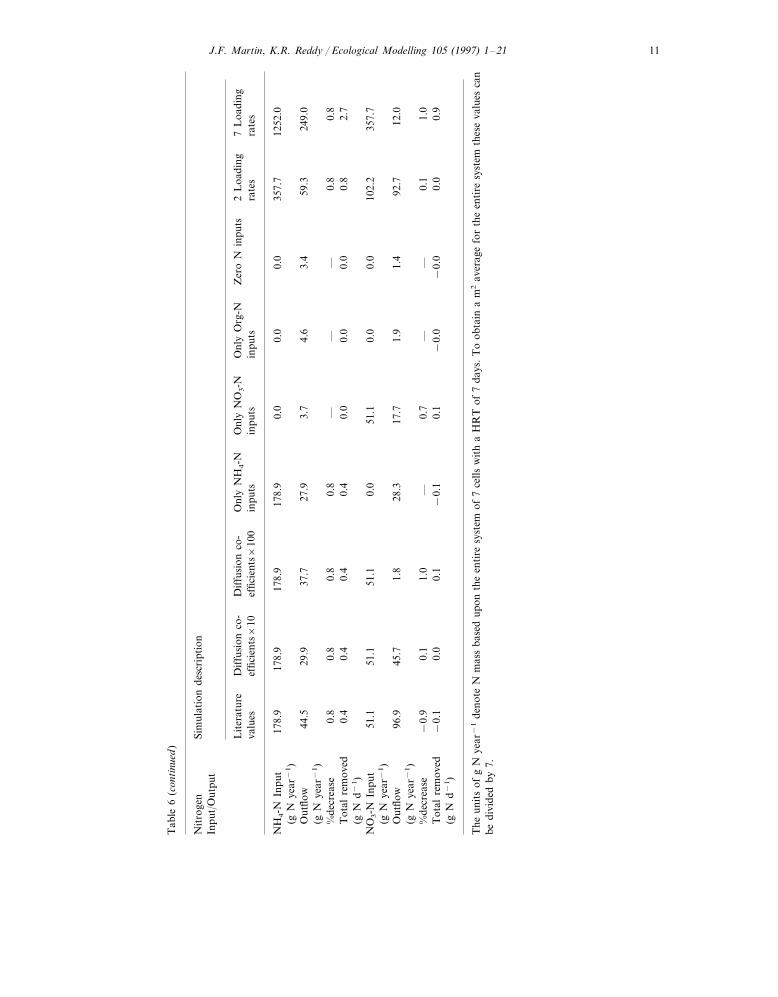
3.3. Variances of inflow nitrogen composition
These simulations demonstrated the depen-dence of processes and removal rates on input Ncomposition, and interactions between N species.Loading rates of the individual N species wereidentical to previous simulations (Table 1), whichcaused reductions in the total N loading ratewhen the input of certain N species were elimi-nated.
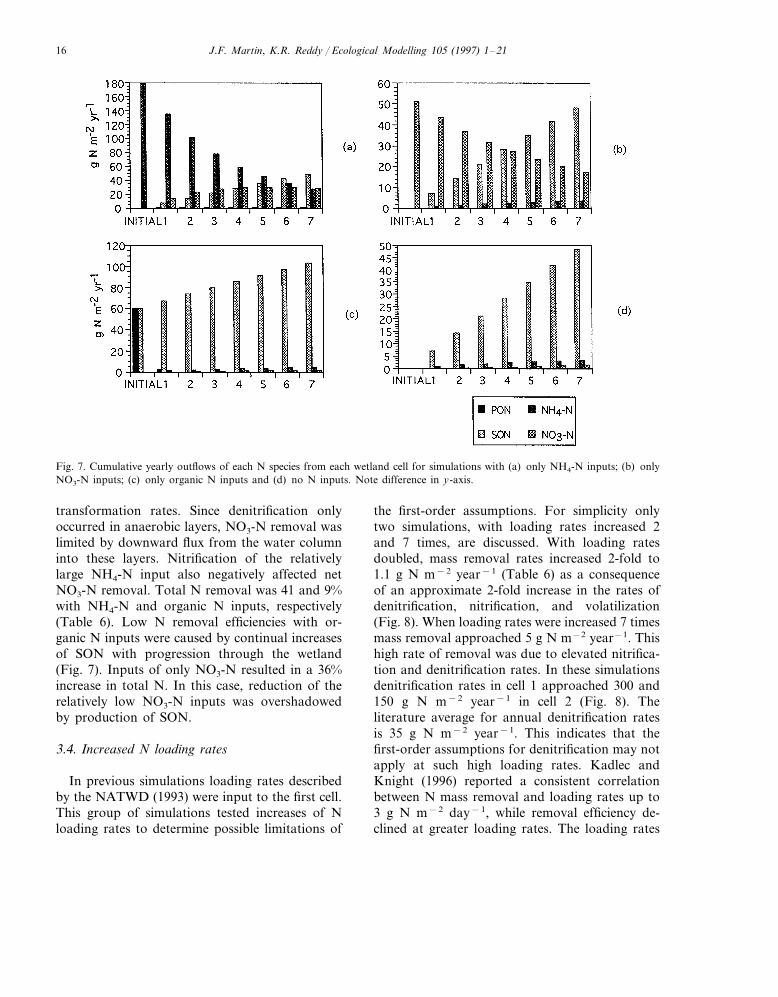
Denitrification rates decreased from 55 to 28 gN year−1 for the entire system of 7 cells (Table 6)when NH4-N was the only input to the system.This indicated that NH4-N, through nitrification,was responsible for providing half of the NO3-Nfor denitrification with all species entering thesystem. Negligible amounts of NO3-N werederived from inputs of organic N, and originallypresent organic N in the soil column, as shown insimulations with organic N inputs only, and no Ninputs (Fig. 7). The rate of volatilization withonly NH4-N inputs decreased only slightly, com-pared to simulations with inputs of all N species.Negligible amounts of N were lost due to NH3-Nvolatilization where inputs were only NO3-N andorganic N (Table 6). Volatilization rates werealmost completely dependent upon soluble NH4-N inputs. Similar patterns and magnitudes ofSON production occurred for all input composi-tions, including zero N inputs (Fig. 7), indicatingthat SON production in wetland systems relieslargely upon hydrolysis of the originally present,edaphic PON storages.
Nitrate-N removal rates were dependent on Ninput composition, while removal of organic Nand NH4-N showed less sensitivity to input com-position. This trend varies with the relative inputamount of each N species, but identifies impor-tant differences in N removal. Transformations ofSON, PON, and NH4-N were not highly depen-dent on the previously addressed limiting solubletransport rates. Therefore, due to first order kinet-ics, increases to these storages lead to increased
J.F. Martin, K.R. Reddy / Ecological Modelling 105 (1997) 1–2116
Fig. 7. Cumulative yearly outflows of each N species from each wetland cell for simulations with (a) only NH4-N inputs; (b) onlyNO3-N inputs; (c) only organic N inputs and (d) no N inputs. Note difference in y-axis.
transformation rates. Since denitrification onlyoccurred in anaerobic layers, NO3-N removal waslimited by downward flux from the water columninto these layers. Nitrification of the relativelylarge NH4-N input also negatively affected netNO3-N removal. Total N removal was 41 and 9%with NH4-N and organic N inputs, respectively(Table 6). Low N removal efficiencies with or-ganic N inputs were caused by continual increasesof SON with progression through the wetland(Fig. 7). Inputs of only NO3-N resulted in a 36%increase in total N. In this case, reduction of therelatively low NO3-N inputs was overshadowedby production of SON.
3.4. Increased N loading rates
In previous simulations loading rates describedby the NATWD (1993) were input to the first cell.This group of simulations tested increases of Nloading rates to determine possible limitations of
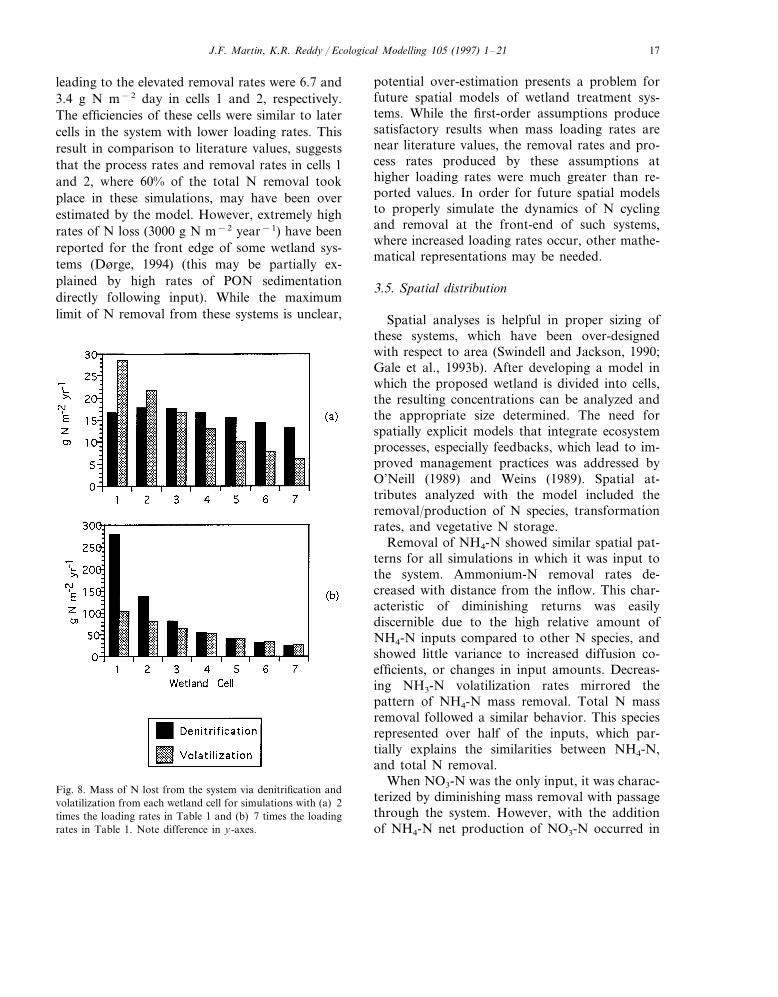
the first-order assumptions. For simplicity onlytwo simulations, with loading rates increased 2and 7 times, are discussed. With loading ratesdoubled, mass removal rates increased 2-fold to1.1 g N m−2 year−1 (Table 6) as a consequenceof an approximate 2-fold increase in the rates ofdenitrification, nitrification, and volatilization(Fig. 8). When loading rates were increased 7 timesmass removal approached 5 g N m−2 year−1. Thishigh rate of removal was due to elevated nitrifica-tion and denitrification rates. In these simulationsdenitrification rates in cell 1 approached 300 and150 g N m−2 year−1 in cell 2 (Fig. 8). Theliterature average for annual denitrification ratesis 35 g N m−2 year−1. This indicates that thefirst-order assumptions for denitrification may notapply at such high loading rates. Kadlec andKnight (1996) reported a consistent correlationbetween N mass removal and loading rates up to3 g N m−2 day−1, while removal efficiency de-clined at greater loading rates. The loading rates
J.F. Martin, K.R. Reddy / Ecological Modelling 105 (1997) 1–21 17
leading to the elevated removal rates were 6.7 and3.4 g N m−2 day in cells 1 and 2, respectively.The efficiencies of these cells were similar to latercells in the system with lower loading rates. Thisresult in comparison to literature values, suggeststhat the process rates and removal rates in cells 1and 2, where 60% of the total N removal tookplace in these simulations, may have been overestimated by the model. However, extremely highrates of N loss (3000 g N m−2 year−1) have beenreported for the front edge of some wetland sys-tems (Dørge, 1994) (this may be partially ex-plained by high rates of PON sedimentationdirectly following input). While the maximumlimit of N removal from these systems is unclear,
potential over-estimation presents a problem forfuture spatial models of wetland treatment sys-tems. While the first-order assumptions producesatisfactory results when mass loading rates arenear literature values, the removal rates and pro-cess rates produced by these assumptions athigher loading rates were much greater than re-ported values. In order for future spatial modelsto properly simulate the dynamics of N cyclingand removal at the front-end of such systems,where increased loading rates occur, other mathe-matical representations may be needed.
3.5. Spatial distribution
Spatial analyses is helpful in proper sizing ofthese systems, which have been over-designedwith respect to area (Swindell and Jackson, 1990;Gale et al., 1993b). After developing a model inwhich the proposed wetland is divided into cells,the resulting concentrations can be analyzed andthe appropriate size determined. The need forspatially explicit models that integrate ecosystemprocesses, especially feedbacks, which lead to im-proved management practices was addressed byO’Neill (1989) and Weins (1989). Spatial at-tributes analyzed with the model included theremoval/production of N species, transformationrates, and vegetative N storage.
Removal of NH4-N showed similar spatial pat-terns for all simulations in which it was input tothe system. Ammonium-N removal rates de-creased with distance from the inflow. This char-acteristic of diminishing returns was easilydiscernible due to the high relative amount ofNH4-N inputs compared to other N species, andshowed little variance to increased diffusion co-efficients, or changes in input amounts. Decreas-ing NH3-N volatilization rates mirrored thepattern of NH4-N mass removal. Total N massremoval followed a similar behavior. This speciesrepresented over half of the inputs, which par-tially explains the similarities between NH4-N,and total N removal.
When NO3-N was the only input, it was charac-terized by diminishing mass removal with passagethrough the system. However, with the additionof NH4-N net production of NO3-N occurred in
Fig. 8. Mass of N lost from the system via denitrification andvolatilization from each wetland cell for simulations with (a) 2times the loading rates in Table 1 and (b) 7 times the loadingrates in Table 1. Note difference in y-axes.
J.F. Martin, K.R. Reddy / Ecological Modelling 105 (1997) 1–2118
the early cells, followed by NO3-N reduction.Increasing diffusion coefficients pushed thechange from net NO3-N production to net NO3-Nreduction closer to the front of the system. Suchchanges in the middle cells represented a point inthe wetland where the amount of NO3-N pro-duced through nitrification was balanced by NO3-N flux into the soil.
4. Conclusions
Increasing molecular diffusion coefficientsabove literature values produced results similar todocumented removal and process rates. This indi-cated that other transport processes of magni-tudes greater than molecular diffusion account forthe transport of soluble N in wetland systems.Based upon the concurrent increases in biomasswith the increased diffusion rates, and high ratesof evapotranspiration, characteristic of wetlandmacrophytes, it was proposed that this turbulentdiffusion was augmented by vegetation inducedwater movement. As wetland plants draw watertowards the roots, NH4-N and NO3-N are pulledfrom the water column to aerobic soil zones withenhanced rates of nitrification, and to anaerobicsoil zones, where denitrification can occur. Inaddition to providing temporary N storage, andadditional aerobic zones, wetland vegetation is avital mechanism stimulating transport of solubleN. This implies that N removal from wetlandsystems without vegetation is limited by diffusiveflux of soluble N, and additionally, that wetlandspecies with greater evapotranspiration rates willpromote greater N removal. This point can befurther investigated by explicitly including interac-tions of evapotranspiration and turbulent diffu-sion in future models of this type.
Changes in diffusion coefficients resulted in op-posing effects upon N removal. Molecular diffu-sion coefficients obtained from the literatureresulted in slow downward flux of NO3-N, result-ing in large outflows of this species. Concurrently,upward movement of soluble organic N (SON)was restricted by lower diffusion coefficients. Thisresulted in larger storages of SON in the intersti-tial soil water. As diffusion coefficients were in-
creased, resulting in flux rates in the range ofturbulent diffusion, this trend reversed. Largerdiffusion coefficients promoted greater downwardtransport of NO3-N, resulting in greater amountsof denitrification. Increased diffusion coefficientslead to higher rates of SON outflow, followingincreased upward flux of SON to the watercolumn.
Production of SON took place regardless of Ninflow composition and loading rate. This indi-cated that SON production, which contributes tobackground levels of N in wetland systems, wasdependent upon originally present, edaphic PONstorages. This suggests that initial conditions forconstructed wetlands should have adequate or-ganic material to meet the demands of carbonconsumptive processes, but not excessive amountswhich contribute to production of SON. Lessorganic matter, and greater amounts of porousmineral substrate will also promote transport ofsoluble species in the soils, which will stimulategreater N removal.
Little change was produced in NH4-N removalas a result of varying diffusion coefficients, andinput composition. Ammonium-N could be lostthrough volatilization from the water column, orvia nitrification in either the water column, oraerobic soil layer. The net effect of these processeson NH4-N removal was relatively constant for allsimulations. Removal rates of NO3-N weregreatly impacted by the input amounts of NH4-N.When NO3-N was the only input, a 63% reduc-tion in NO3-N resulted, but when all species wereadded only 11% reduction of NO3-N took placedue to the nitrification of NH4-N. When diffusioncoefficients were increased this trend did not oc-cur, as the increased amount of NO3-N was trans-ported to anaerobic soil layers and lost viadenitrification.
Spatial distribution allowed the portrayal ofdeclining nitrogen gradients associated with Nremoval from wetland treatment systems. Modelsof this type will be beneficial in the design offuture systems with regards to N, or other wet-land compounds. Site specific models can be usedto determine the area required to produce desiredeffluent characteristics, and the critical point atwhich background levels of N will be reached.
J.F. Martin, K.R. Reddy / Ecological Modelling 105 (1997) 1–21 19
Spatial patterns for higher loading rates showedpossible limitations of the model. At the front-endof the system, where the highest mass loadingrates took place, the first-order assumptions mayhave yielded exaggerated removal and processrates. The same first-order representations re-sulted in satisfactory rates for cells with lowerloading rates, characteristic of wetland treatmentsystems. This implies that future models may re-quire different, and multiple kinetic assumptionsto properly simulate N removal.
Acknowledgements
We wish to thank Dave Tilley, Bill DeBusk,Dan Childers, and Clay Montague for providingadvice and ideas during this research. Themanuscript benefited from readings by EnriqueReyes and Dave Tilley.
References
Abtew, W., Obeysekera, J., 1995. Lysimeter study of evapo-transpiration of cattails and comparison of three estima-tion methods. Trans. Am. Soc. Agric. Eng. 38, 121–129.
Bakker, S.A., 1994. Spatial and dynamic modelling: describingthe terrestrialization of fen ecosystems. In: Mitsch, W.J.(Ed.), Global Wetlands: Old World and New. Elsevier,New York, pp. 555–561.
Bavor, H.J. (Ed.), 1986. Joint Study on Nutrient RemovalUsing Shallow Lagoon-Macrophyte Systems. Interim Re-port, March 1984–May 1985, Water Research Laboratory,Hawkesbury Agricultural College, Australia.
Bernard, J.M., Bernard, F.A., 1977. Winter standing crop andnutrient contents in five central New York wetlands. Bull.Torr. Bot. Club 104, 57–59.
Bernard, J.M., Fitz, M.L., 1979. Seasonal changes in above-ground primary production and nutrient contents in acentral New York Typha glauca ecosystem. Bull. Torr.Bot. Club 106, 37–40.
Bowden, W.B., 1987. The biogeochemistry of nitrogen infreshwater wetlands. Biogeochemistry 4, 313–348.
Boyd, C.E., Hess, L.W., 1970. Factors influencing shoot pro-duction and mineral nutrient levels in Typha Latifola.Ecology 51, 296–300.
CDM, 1994. Annual Report: Orange County Eastern ServiceArea Waste Water Treatment Facility. Camp, Dresser andMcKee, Orlando, FL.
Chapelle, A., 1995. A preliminary model of nutrient cycling insediments of a Mediterranean lagoon. Ecol. Model. 80,131–147.
Choate, K.D., Steiner, G.R., Watson, J.T., 1990. SecondMonitoring Report: Demonstration of Constructed Wet-lands for Treatment of Municipal Wastewaters, March1988 to October 1989. Report TVA/WR/WQ-90/11, TVAWater Quality Department, Chattanooga, TN.
Christensen, N., Mitsch, W.J., Jørgensen, S.E., 1994. A firstgeneration ecosystem model of the Des Plaines river exper-imental wetlands. Ecol. Eng. 3, 495–521.
Cooper, A.B., Cooke, J.G., 1984. Nitrate loss and transforma-tion in two vegetated headwater streams. N. Z. J. Mar.Freshwater Res. 18, 441–450.
Davidson, J.M., Graetz, D.A., Rao, P.S.C., Selim, H.M.,1978. Simulation of Nitrogen Movement, Transformationand Uptake in Plant Root Zones. EPA-600/3-78-029,U.S.E.P.A. Washington, D.C.
DeBusk, W.F., 1984. Nutrient Dynamics in a Cypress StrandReceiving Municipal Wastewater Effluent. Thesis, Univer-sity of Florida, Gainesville, FL.
Dierberg, F.E., Brezonik, P.L., 1983. Nitrogen and phospho-rus mass balances in natural and sewage enriched Cypressdomes. J. Appl. Ecol. 20, 323–337.
Dørge, J., 1994. Modelling nitrogen transformations in fresh-water wetlands—estimating nitrogen-retention and re-moval in natural wetlands in relation to their hydrologyand nutrient loadings. Ecol. Model. 75, 409–420.
Forrester, J.W., 1961. Industrial Dynamics. MIT Press, Cam-bridge, MA.
Frissel, M.J., van Veen, J.A., 1982. A review of modelsinvestigating the behavior of nitrogen in soil. Philos. Trans.R. Soc. Lond. Biol. 296, 341–349.
Gale, P.M., Reddy, K.R., Graetz, D.A., 1993a. Nitrogenremoval from reclaimed water applied to constructed andnatural wetland microcosms. Water Env. Res. 65, 162–168.
Gale, P.M., Devai, I., Reddy, K.R., Graetz, D.A., 1993b.Denitrification potential of soils from constructed andnatural wetlands. Ecol. Eng. 2, 119–130.
Gearheart, R.A., 1990. Nitrogen removal at the Arcata con-structed wetlands. Presentation at the Water PollutionControl Federation Meeting. Washington, DC.
Gersberg, R.M., Lyon, S.R., Brenner, R., Elkins, B.V., 1989.Integrated wastewater treatment using artificial wetlands: agravel marsh case study. In: Hammer, D.A. (Ed.), Con-structed Wetlands for Wastewater Treatment: Municipal,Industrial and Agricultural, Lewis Brothers, Chelsea, MI,pp. 145–152.
Hammer, D.E., 1984. An Engineering Model of Wetland/Wastewater Interactions. PhD. Dissertation, University ofMichigan, Ann Arbor.
Hey, D.L., Kenimer, A.L., Barrett, K.R., 1994. Water qualityimprovement by four experimental wetlands. Ecol. Eng. 3,381–398.
Hobbie, J., 1980. Limnology of Tundra Ponds. US/IBP Syn-thesis Series 13. Dowden, Hutchinson and Ross. Strouds-burg, PA.
Howard-Williams, C., de Esteves, F., Santos, J.E., Downes,M.T., 1989. Short term nitrogen dynamics in a small
J.F. Martin, K.R. Reddy / Ecological Modelling 105 (1997) 1–2120
brazilian wetland (Lago Infernao, Sao Paulo).. J. Trop.Ecol. 5, 323–325.
Howard-Williams, C., Downes, M.T., 1993. Nitrogen cyclingin wetlands. In: Burt, T.P. (Ed.), Nitrate: Processes, Pat-terns and Management, Wiley, New York, pp. 141–167.
Jones, J.G., 1979. Microbial nitrate reduction in freshwatersediments. J. Gen. Microbiol. 115, 27–35.
Jørgensen, S.E., 1994. A general model of nitrogen removal bywetlands. In: Mitsch, W.J. (Ed.), Global Wetlands: OldWorld and New. Elsevier, Amsterdam, pp. 575–583.
Jørgensen, S.E., Hoffman, C.C., Mitsch, W.J., 1988. Mod-elling nutrient retention by a reedswamp and wet meadowin Denmark. In: Mitsch, W.J., Straskraba, M., Jørgensen,S.E. (Eds.), Wetland Modelling. Elsevier, New York, pp.133–152.
Kadlec, R.H., 1979. Wetlands for tertiary treatment. In:Greeson, P.E. (Ed.), Wetland Functions and Values: TheState of Our Understanding. American Water ResourcesAssociation, Minneapolis, MN, pp. 490–504.
Kadlec, R.H., 1995. Design models for nutrient removal inconstructed wetlands. In: Steele, K. (Ed.), Animal Wasteand the Land-Water Interface. Lewis, Boca Raton, FL, pp.173–184.
Kadlec, R.H., Hammer, D.E., 1988. Modelling nutrient behav-ior in wetlands. Ecol. Model. 40, 37–66.
Kadlec, R.H., Knight, R.L., 1996. Treatment Wetlands.Lewis, Boca Raton, FL.
Knight, R.L., 1986. Florida effluent wetlands, Total Nitrogen.CH2M Hill Wetland Technical Reference Document SeriesNo. 1. Gainesville, FL.
Krottje, P.A., 1980. Denitrification and nitrous oxide produc-tion in Florida wetland soils. M.S. Thesis, University ofFlorida, Gainesville.
Krom, M.D., Berner, R.A., 1980. The diffusion coefficients ofsulfate, ammonium and phosphate ions in anoxic marinesediments. Limnol. Ocean. 25, 327.
Logofet, D.O., Alexandrov, G.A., 1984. Modelling of mattercycle in a mesotrophic bog ecosystem. II dynamic modeland ecological succession.. Ecol. Model. 21, 247–258.
Martin, I., Fernandez, J., 1992. Nutrient dynamics and growthof a cattail crop (Typha latifolia) developed in an effluentwith high eutrophic potential. Biores. Technol. 42, 7–12.
Martin, J., Tilley, D., 1998. Simulating with STELLA. In:Odum, H.T., Odum, E.C. (Eds.), Modeling for All Scales:An Introduction to Systems and Simulation, AcademicPress, San Diego, CA (in press).
McCroy, P.C., Alexander, V., 1975. Nitrogen kinetics inaquatic plants in artic Alaska. Aqua. Bot. 1, 3–10.
Mehran, M., Tanji, K.K., 1974. Computer modelling of nitro-gen transformations in soils. J. Environ. Qual. 3, 391–396.
Metcalf and Eddy Inc., 1991. Wastewater Engineering: Treat-ment Disposal and Reuse. McGraw-Hill, St. Louis, MO.
Morris, J.T., 1980. The nitrogen uptake kinetics of Spartinaalterniflora in culture. Ecology 61, 1114–1121.
Morris, J.T., Bowden, W.B., 1986. A mechanistic numericalmodel of sedimentation, mineralization and decompositionfor marsh sediments. Soil Sci. Soc. Am. J. 50, 96–105.
NATWD (North American Treatment Wetland Database).1993. Electronic database created by R. Knight, R.Ruble,R. Kadlec, S. Reed for the U.S. Environmental ProtectionAgency.
Nelson, S.G., Smith, B.D., Best, B.R., 1981. Kinetics of nitrateand ammonium uptake by the tropical freshwatermacrophyte Pistia stratiotes. Aquaculture 24, 11–19.
Odum, H.T., 1996. Scales of ecological engineering. Ecol. Eng.6, 7–19.
Odum, H.T., Ewel, K.C., Mitsch, W.J., Ordway, J.W., 1977.Recycling treated sewage through Cypress wetlands inFlorida. In: D’Itri, F.M. (Ed.), Wastewater Renovationand Reuse. Marcel Decker, New York, NY, pp. 35–67.
O’Neill, R.V., 1989. Perspectives in hierarchy and scale. In:May, R.M., Levin, S.A. (Eds.), Perspectives in EcologicalTheory. Princeton University Press, Princeton, NJ, pp.140–156.
Park, R.A., et al., 1975. A generalized model for simulatinglake ecosystems. Simulation 23 (2), 33–50.
Parker, D.T., Larson, W.E., 1962. Nitrification as affected bytemperature and moisture content of mulched soils. SoilSci. Soc. Am. Proc. 238, 92–102.
Rao, P.S.C., Jessup, R.E., Reddy, K.R., 1984. Simulation ofnitrogen dynamics in flooded soils. Soil Sci. 138, 54–62.
Reddy, K.R., 1982. Mineralization of nitrogen in organic soils.Soil Sci. Soc. Am. J. 46, 561–566.
Reddy, K.R., 1983. Fate of nitrogen and phosphorus in awaste-water retention resevoir containing aquaticmacrophytes. J. Environ. Qual. 12, 137–141.
Reddy, K.R., Rao, P.S.C., 1983. Nitrogen and phosphorusfluxes from a flooded organic soil. Soil Sci. 5, 300–307.
Reddy, K.R., Patrick, W.H., 1984. Nitrogen transformationand loss in flooded soils and sediments. CRC Crit. Rev.Environ. Control 13, 273–309.
Reddy, K.R., Patrick, W.H., Phillips, R.E., 1976. Ammoniumdiffusion as a factor in nitrogen loss from flooded soils.Soil Sci. Soc. Am. J. 40, 528–533.
Reddy, K.R., Patrick, W.H., Phillips, R.E., 1980. Evaluationof selected processes controlling nitrogen loss in floodedsoils. Soil Sci. Soc. Am. J. 44, 1241.
Reddy, K.R., Rao, P.S.C., Jessup, R.E., 1982. The effect ofcarbon mineralization on denitrification kinetics in mineraland organic Soils. Soil Sci. Soc. Am. J. 46, 62–68.
Reddy, K.R., Jessup, R.E., Rao, P.S.C., 1988. Nitrogen dy-namics in a eutrophic lake sediment. Hydrobiology 159,177–188.
Richmond, B., Peterson, S., Vescuso, P., 1987. An AcademicUser’s Guide to STELLA. High Performance Systems, NewHampshire.
Savant, N.K, DeDatta, S.K., 1980. Movement and distribu-tion of ammonium N following deep placement of urea inwetland rice soil., Soil Sci. Soc. Am. J. 44, 559–565.
Smith, J.L., Schnabel, R.R., McNeal, B.L., Campbell, G.S.,1980. Potential errors in the first-order model for estimat-ing soil nitrogen mineralization potentials. Soil Sci. Soc.Am. J. 44, 996–1000.
J.F. Martin, K.R. Reddy / Ecological Modelling 105 (1997) 1–21 21
Sørensen, J., 1978. Capacity for denitrification and reduction innitrate to ammonia in a coastal marine sediment. Appl.Environ. Microbiol. 35, 301–305.
Stanford, G., Vander Pol, R.A., Dzienia, S., 1975. Denitrifica-tion rates in relation to total and extractable soil carbon. SoilSci. Soc. Am. J. 39, 284–289.
Swindell, C.E., Jackson, J.A., 1990. Constructed wetlands design
and operation to maximize nutrient removal capabilities. In:Cooper, P.F., Findlater, B.C. (Eds.), Constructed Wetlandsin Water Pollution Control, Pergamon, New York.
Walker, L.P., Walker, M.R., 1990. City of Gustine MarshEvaluation Study. Larry Walker Associates, Davis, CA.
Weins, J.A., 1989. Spatial scaling in ecology. Funct. Ecol. 3,385–397.
..